
Evolutionary Game-Theoretic Approach to Enhancing User-Grid Cooperation in Peak Shaving: Integrating Whole-Process Democracy (Deliberative Governance) in Renewable Energy Systems


Abstract
1. Introduction
2. Theoretical Foundations for User–Grid Dynamics: Evolutionary Game Models in Low-Carbon Renewable Energy Systems
2.1. Classical Game Theory
2.2. Evolutionary Game Theory
2.2.1. Replicator Dynamics
- denotes the proportion of the population adopting strategy i.
- represents the payoff of strategy i under the current population distribution x.
- refers to the average payoff across all strategies within the population.
- i represents a specific population.
- n represents the total number of populations.
- represents the quantity of the j-th pure strategy chosen by population i at a certain moment t.
- xi represents the state of population i.
- x−i represents the state of all populations other than i.
- represents the j-th pure strategy in the total decision set of population i.
- x represents the total number of mixed strategy combinations for all populations.
- represents the payoff for population i in state x when choosing the j-th pure strategy.
- represents the average payment parameter.
2.2.2. Evolutionarily Stable Strategy (ESS)
2.2.3. The Role of Evolutionarily Stable Strategies and Equilibria in Modeling Complex Dynamic Systems
2.2.4. Payoff Matrix Construction and Replicator Dynamics
- Population A: SA1, and SA2;
- Population B: SB1, and SB2.
2.2.5. Jacobian Matrix and Stability Analysis
- σx and σy are constants representing the intensity (amplitude) of the noise in the X- and Y-equations, respectively.
- and are independent (or possibly correlated) standard Wiener processes (Brownian motions).
- F(Xt, Yt) and F(Yt, Xt) represent the payoff functions, reflecting the strategies adopted by both users (Xt) and grid operators (Yt).
- σxx, σxy, σyx, σyy represent the noise coefficients, which describe the random perturbations due to environmental or system uncertainties.
- dWt(1) and dWt(2) are the Brownian motions for each of the populations, reflecting their inherent randomness.
- ΔXt and ΔYt represent the adjustment terms added to incorporate the effects of deliberative decision-making. These adjustments correspond to the democratic process where the populations adjust their strategies based on feedback and participation from all stakeholders.
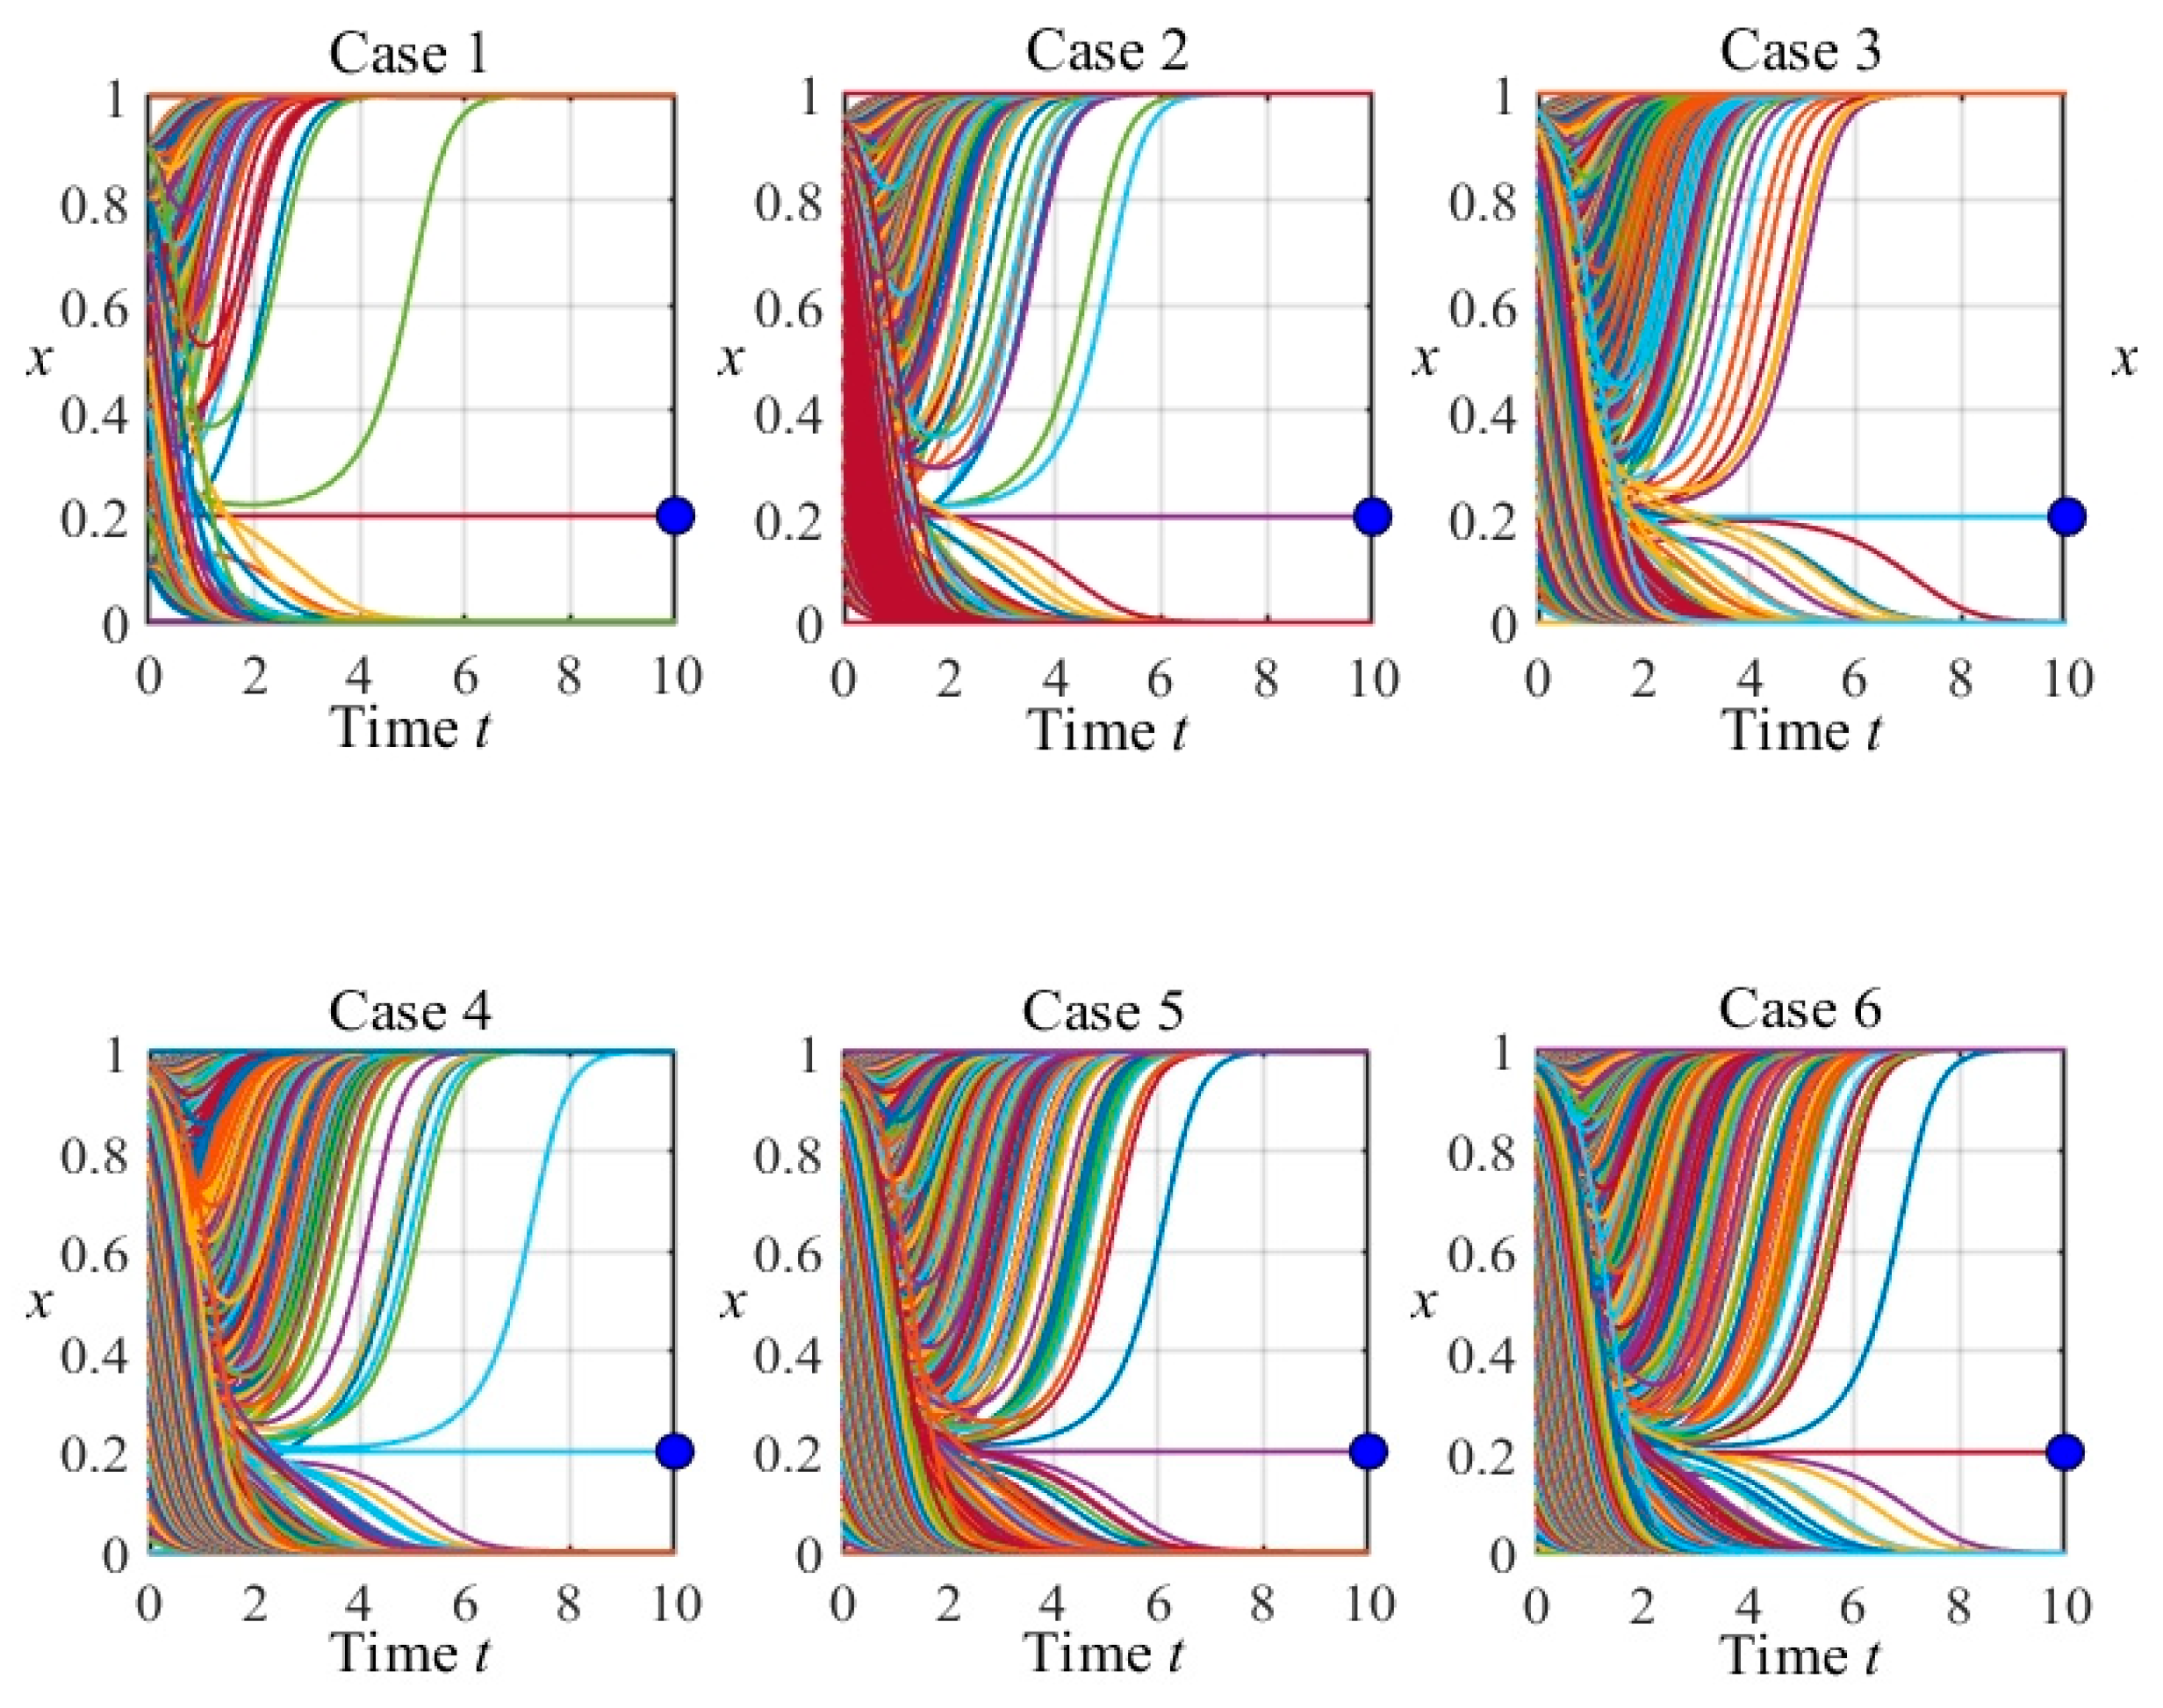
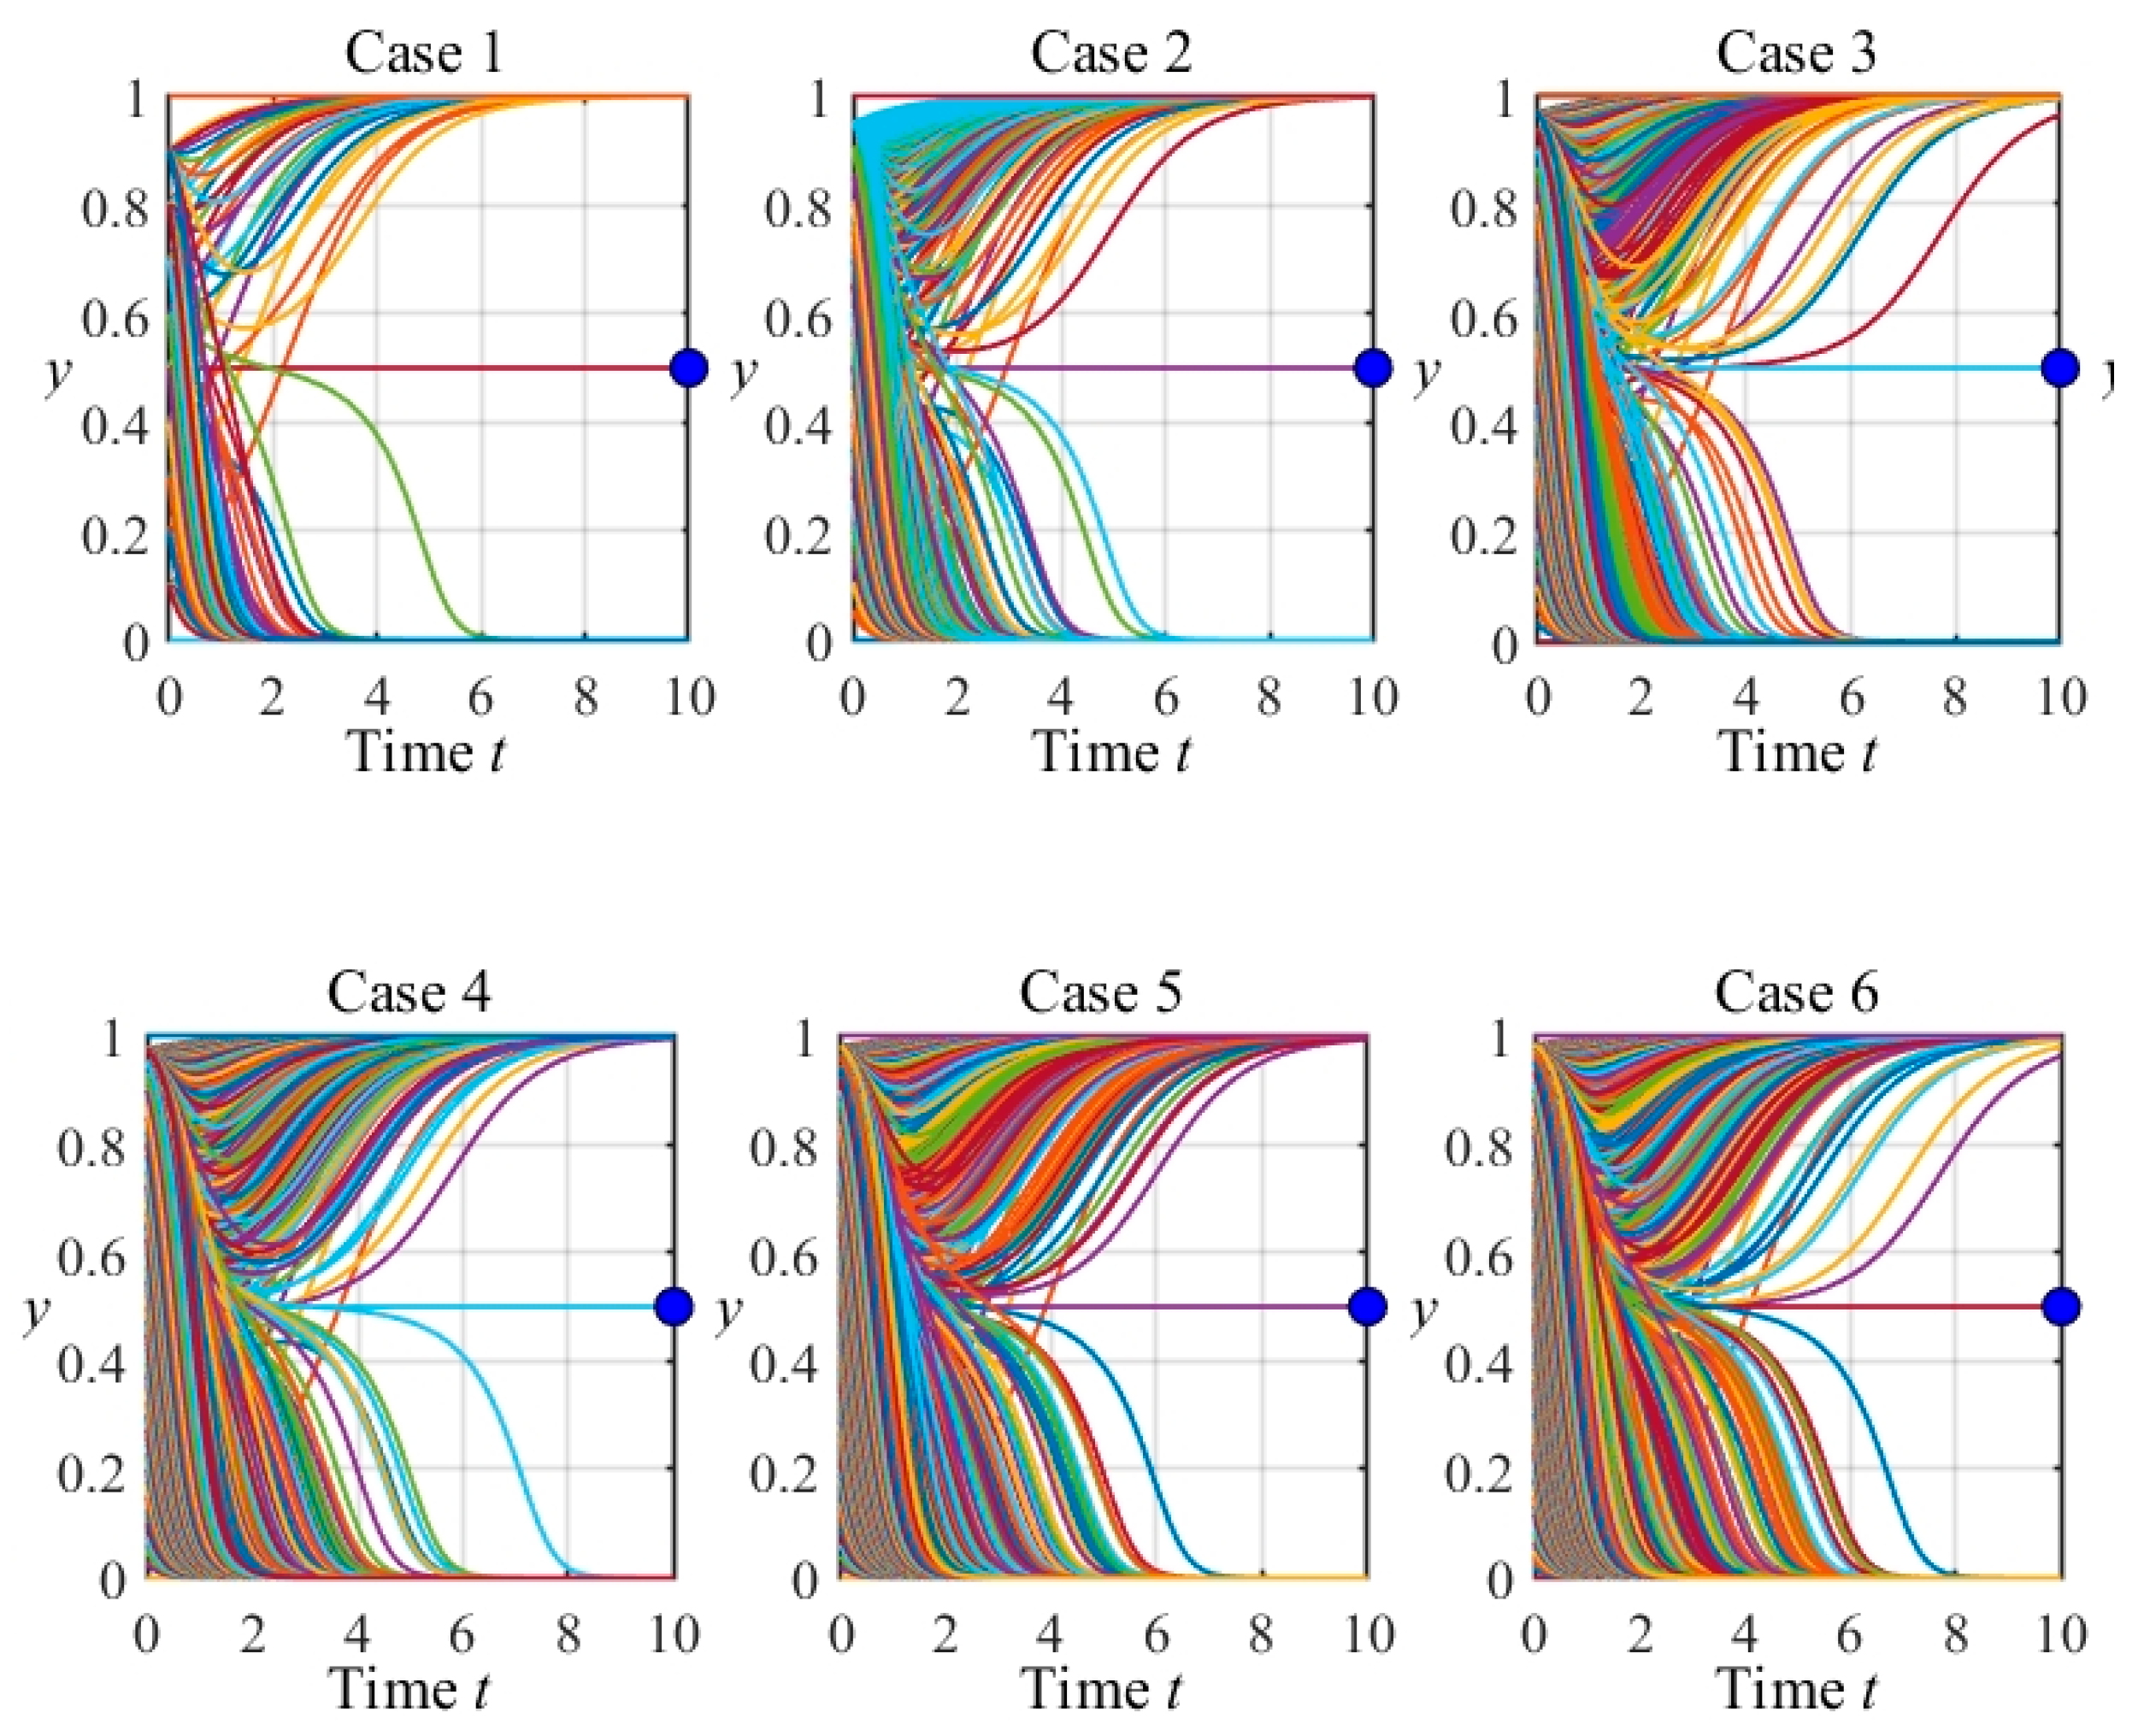
2.2.6. Parameter Selection and Numerical Experiments
- (i)
- As time t increases, most trajectories converge toward certain values of x or y, reflecting the system’s tendency to lock onto stable or near-stable equilibria.
- (ii)
- The red points on the right-hand side of each subplot mark evolutionarily stable strategies (ESS). When trajectories from a wide range of initial conditions cluster around these red points, it indicates that these points exert a strong attracting influence in the evolutionary sense.
- (iii)
- The blue points (often located in the interior or somewhere within the domain) represent saddle points (also described as “near-stable” in the figures). Trajectories may approach these points along one direction but diverge along another; thus, only a subset of initial conditions actually converges to a saddle, while many others eventually leave its vicinity.
- (iv)
- The green points indicate unstable equilibria. The trajectories around these points tend to move away rather than settle, making them repelling states from an evolutionary perspective.
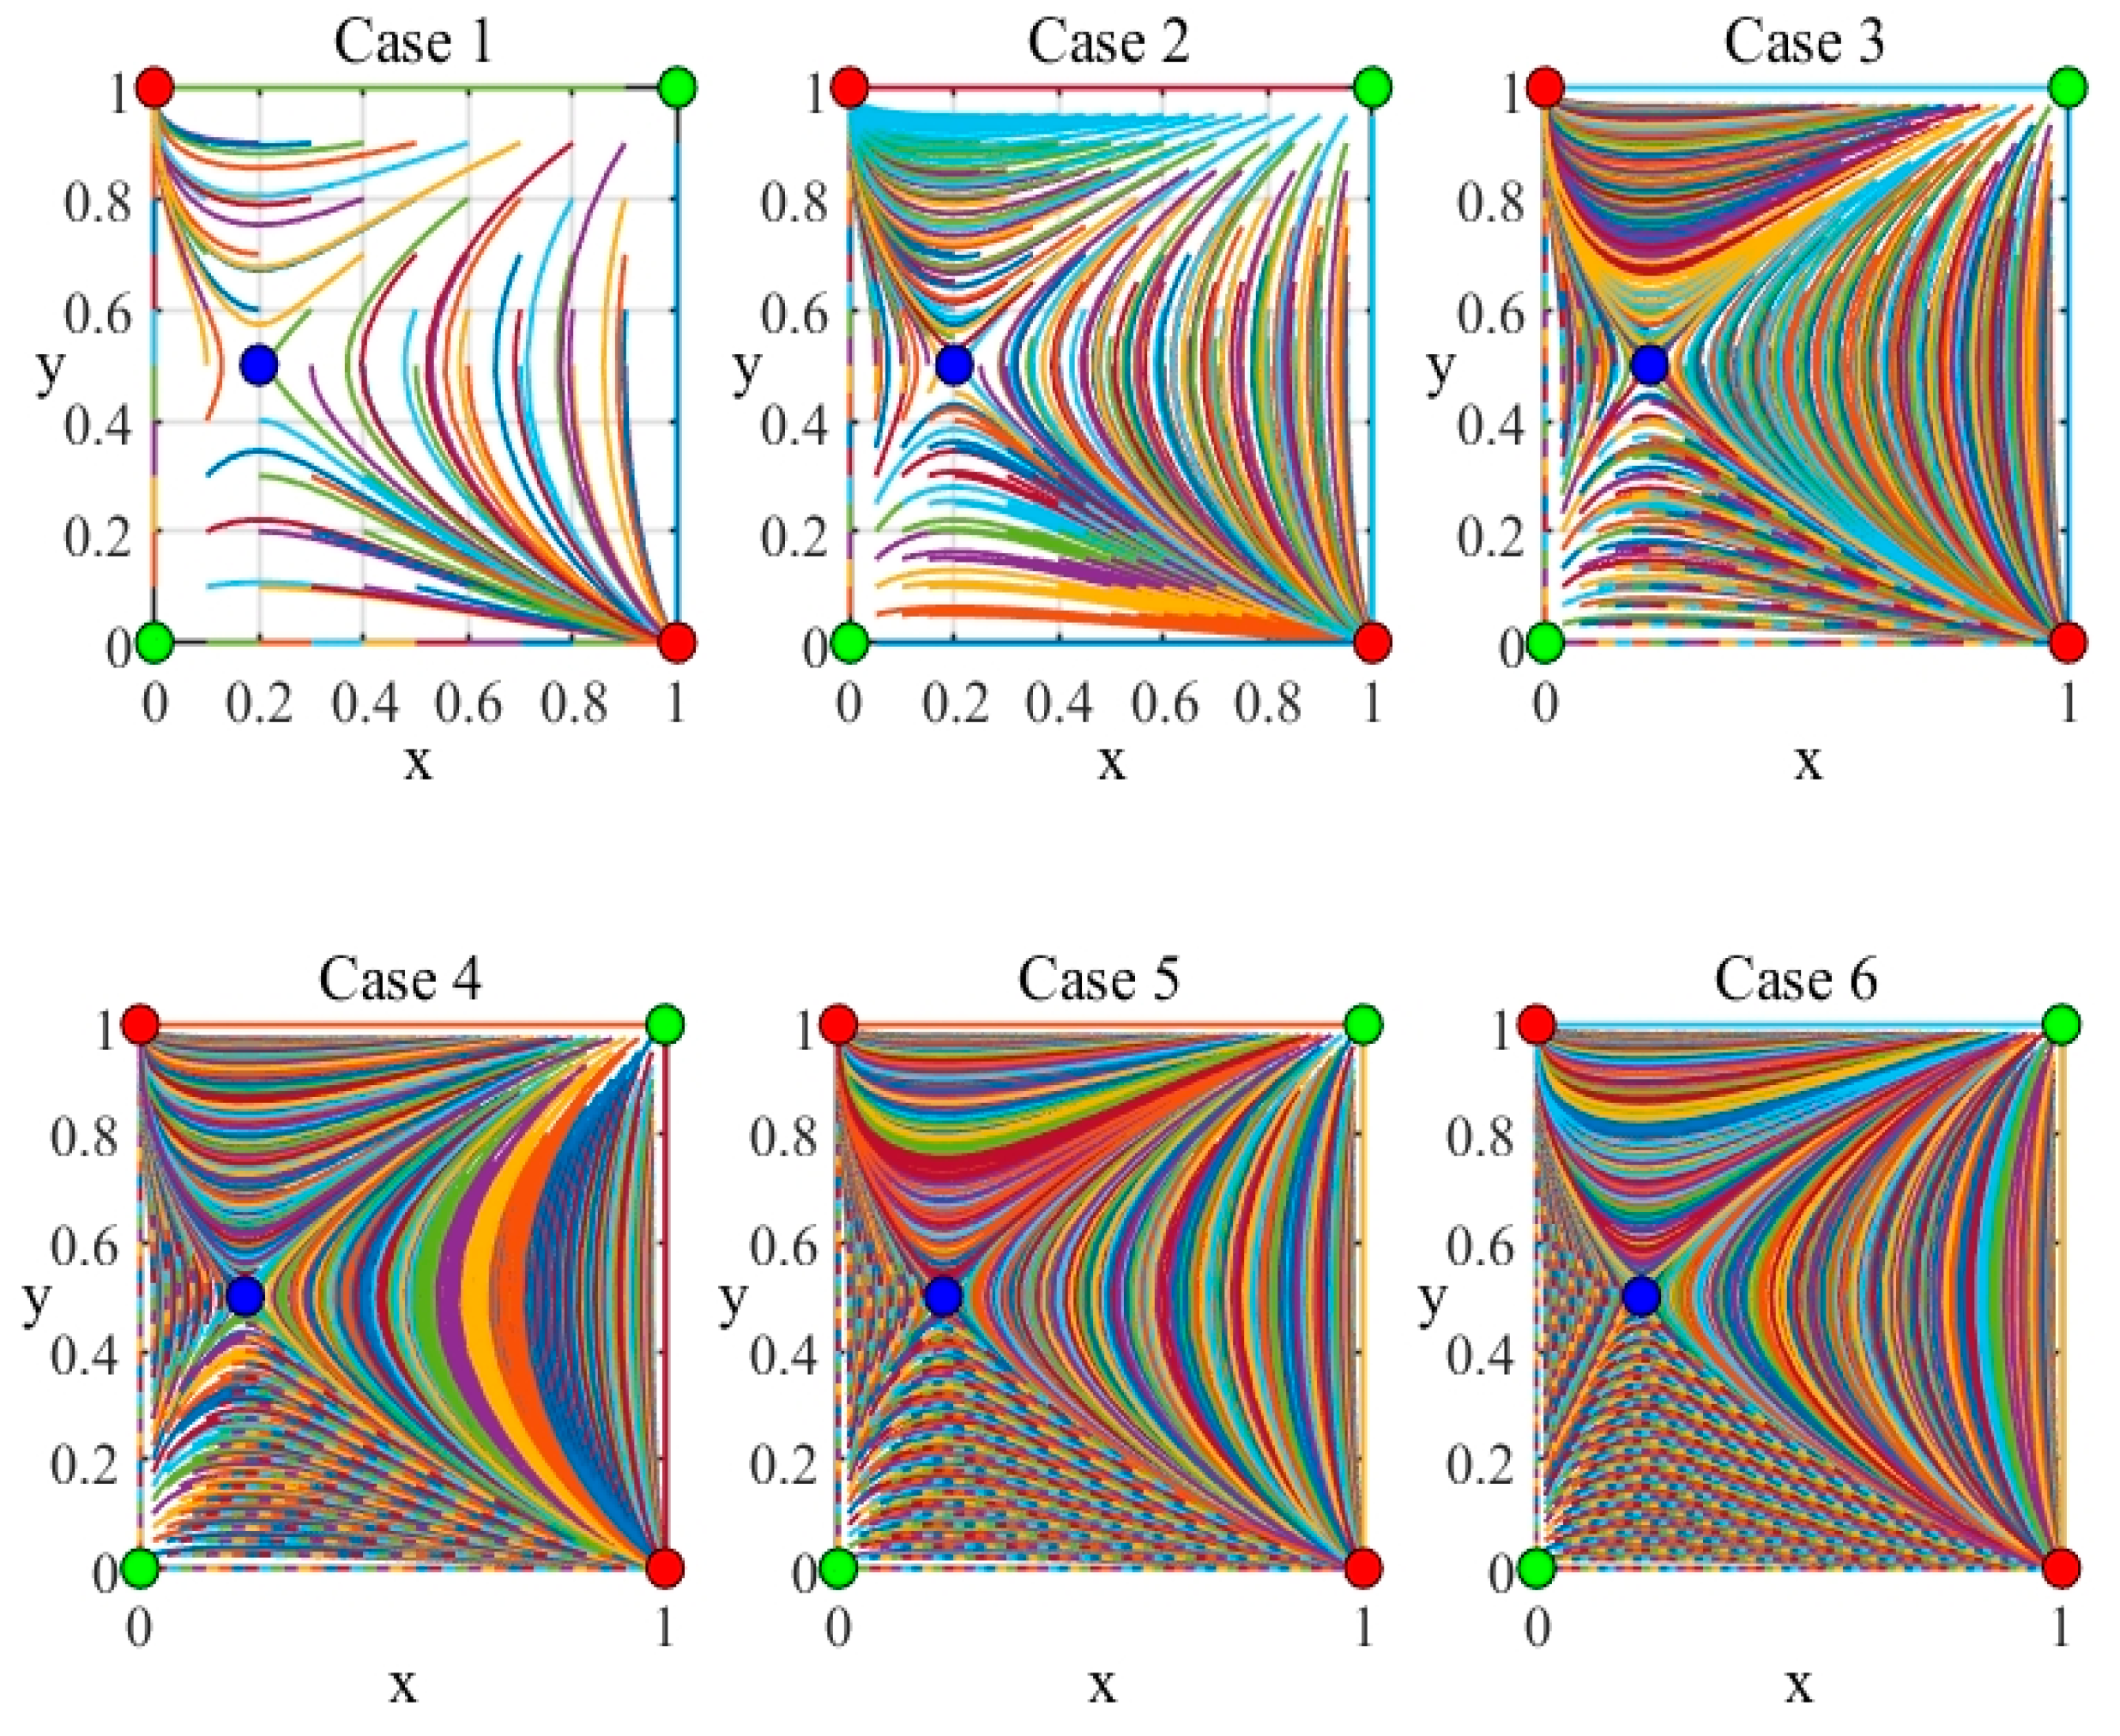
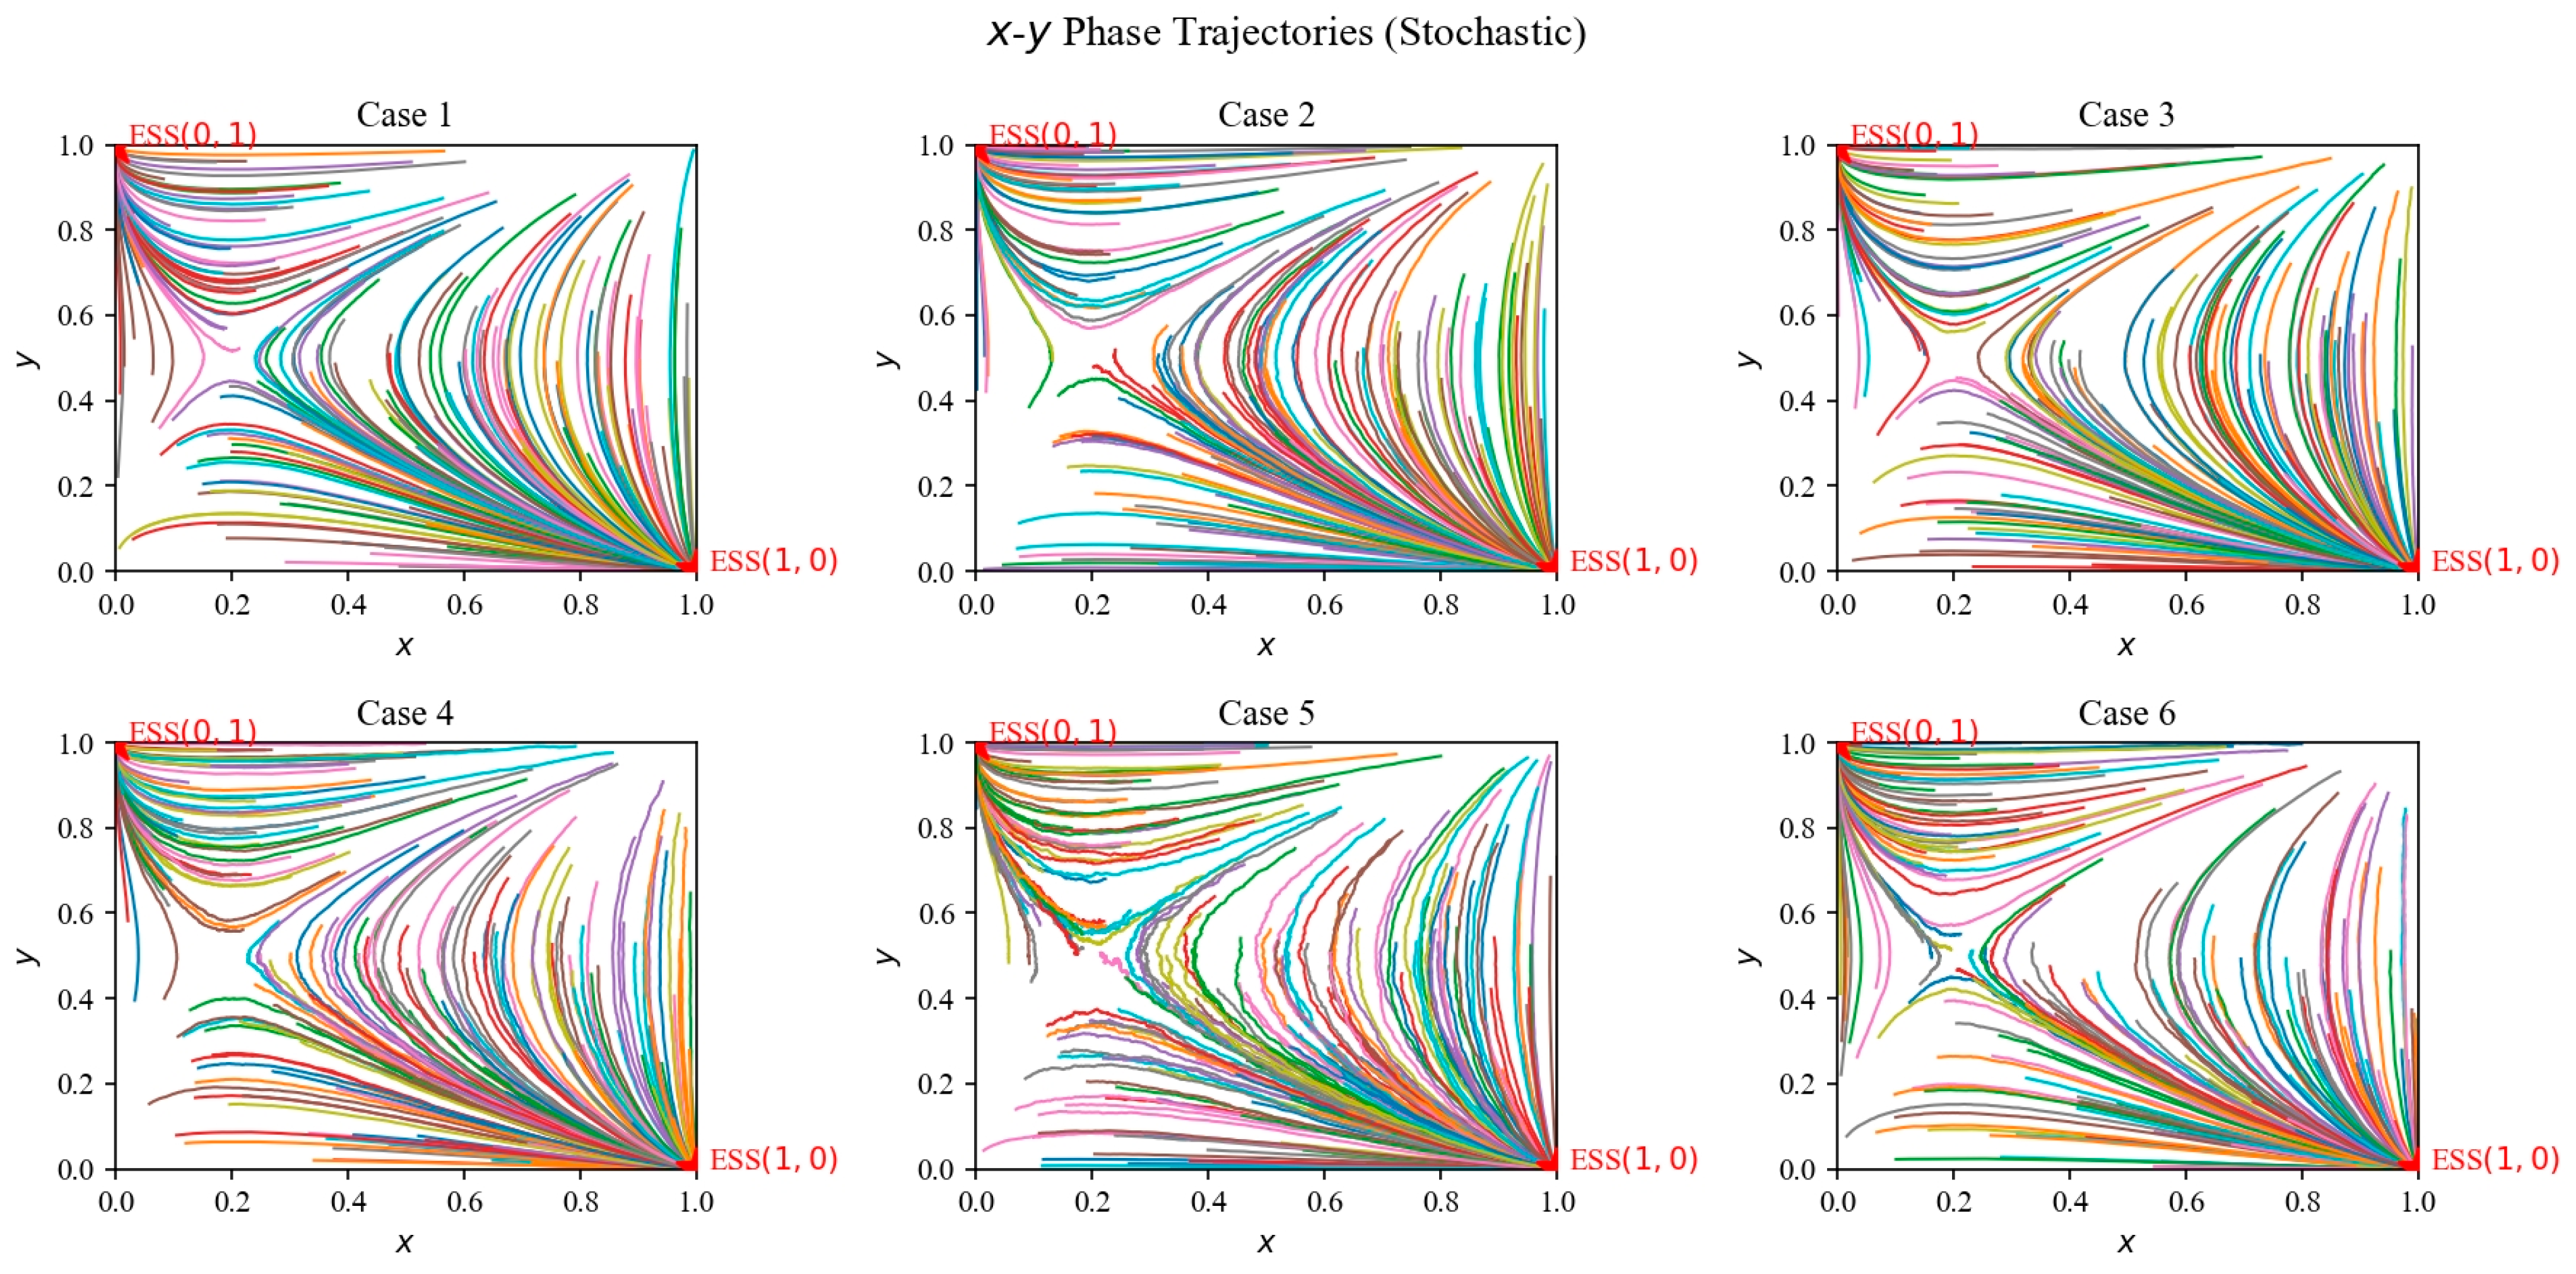
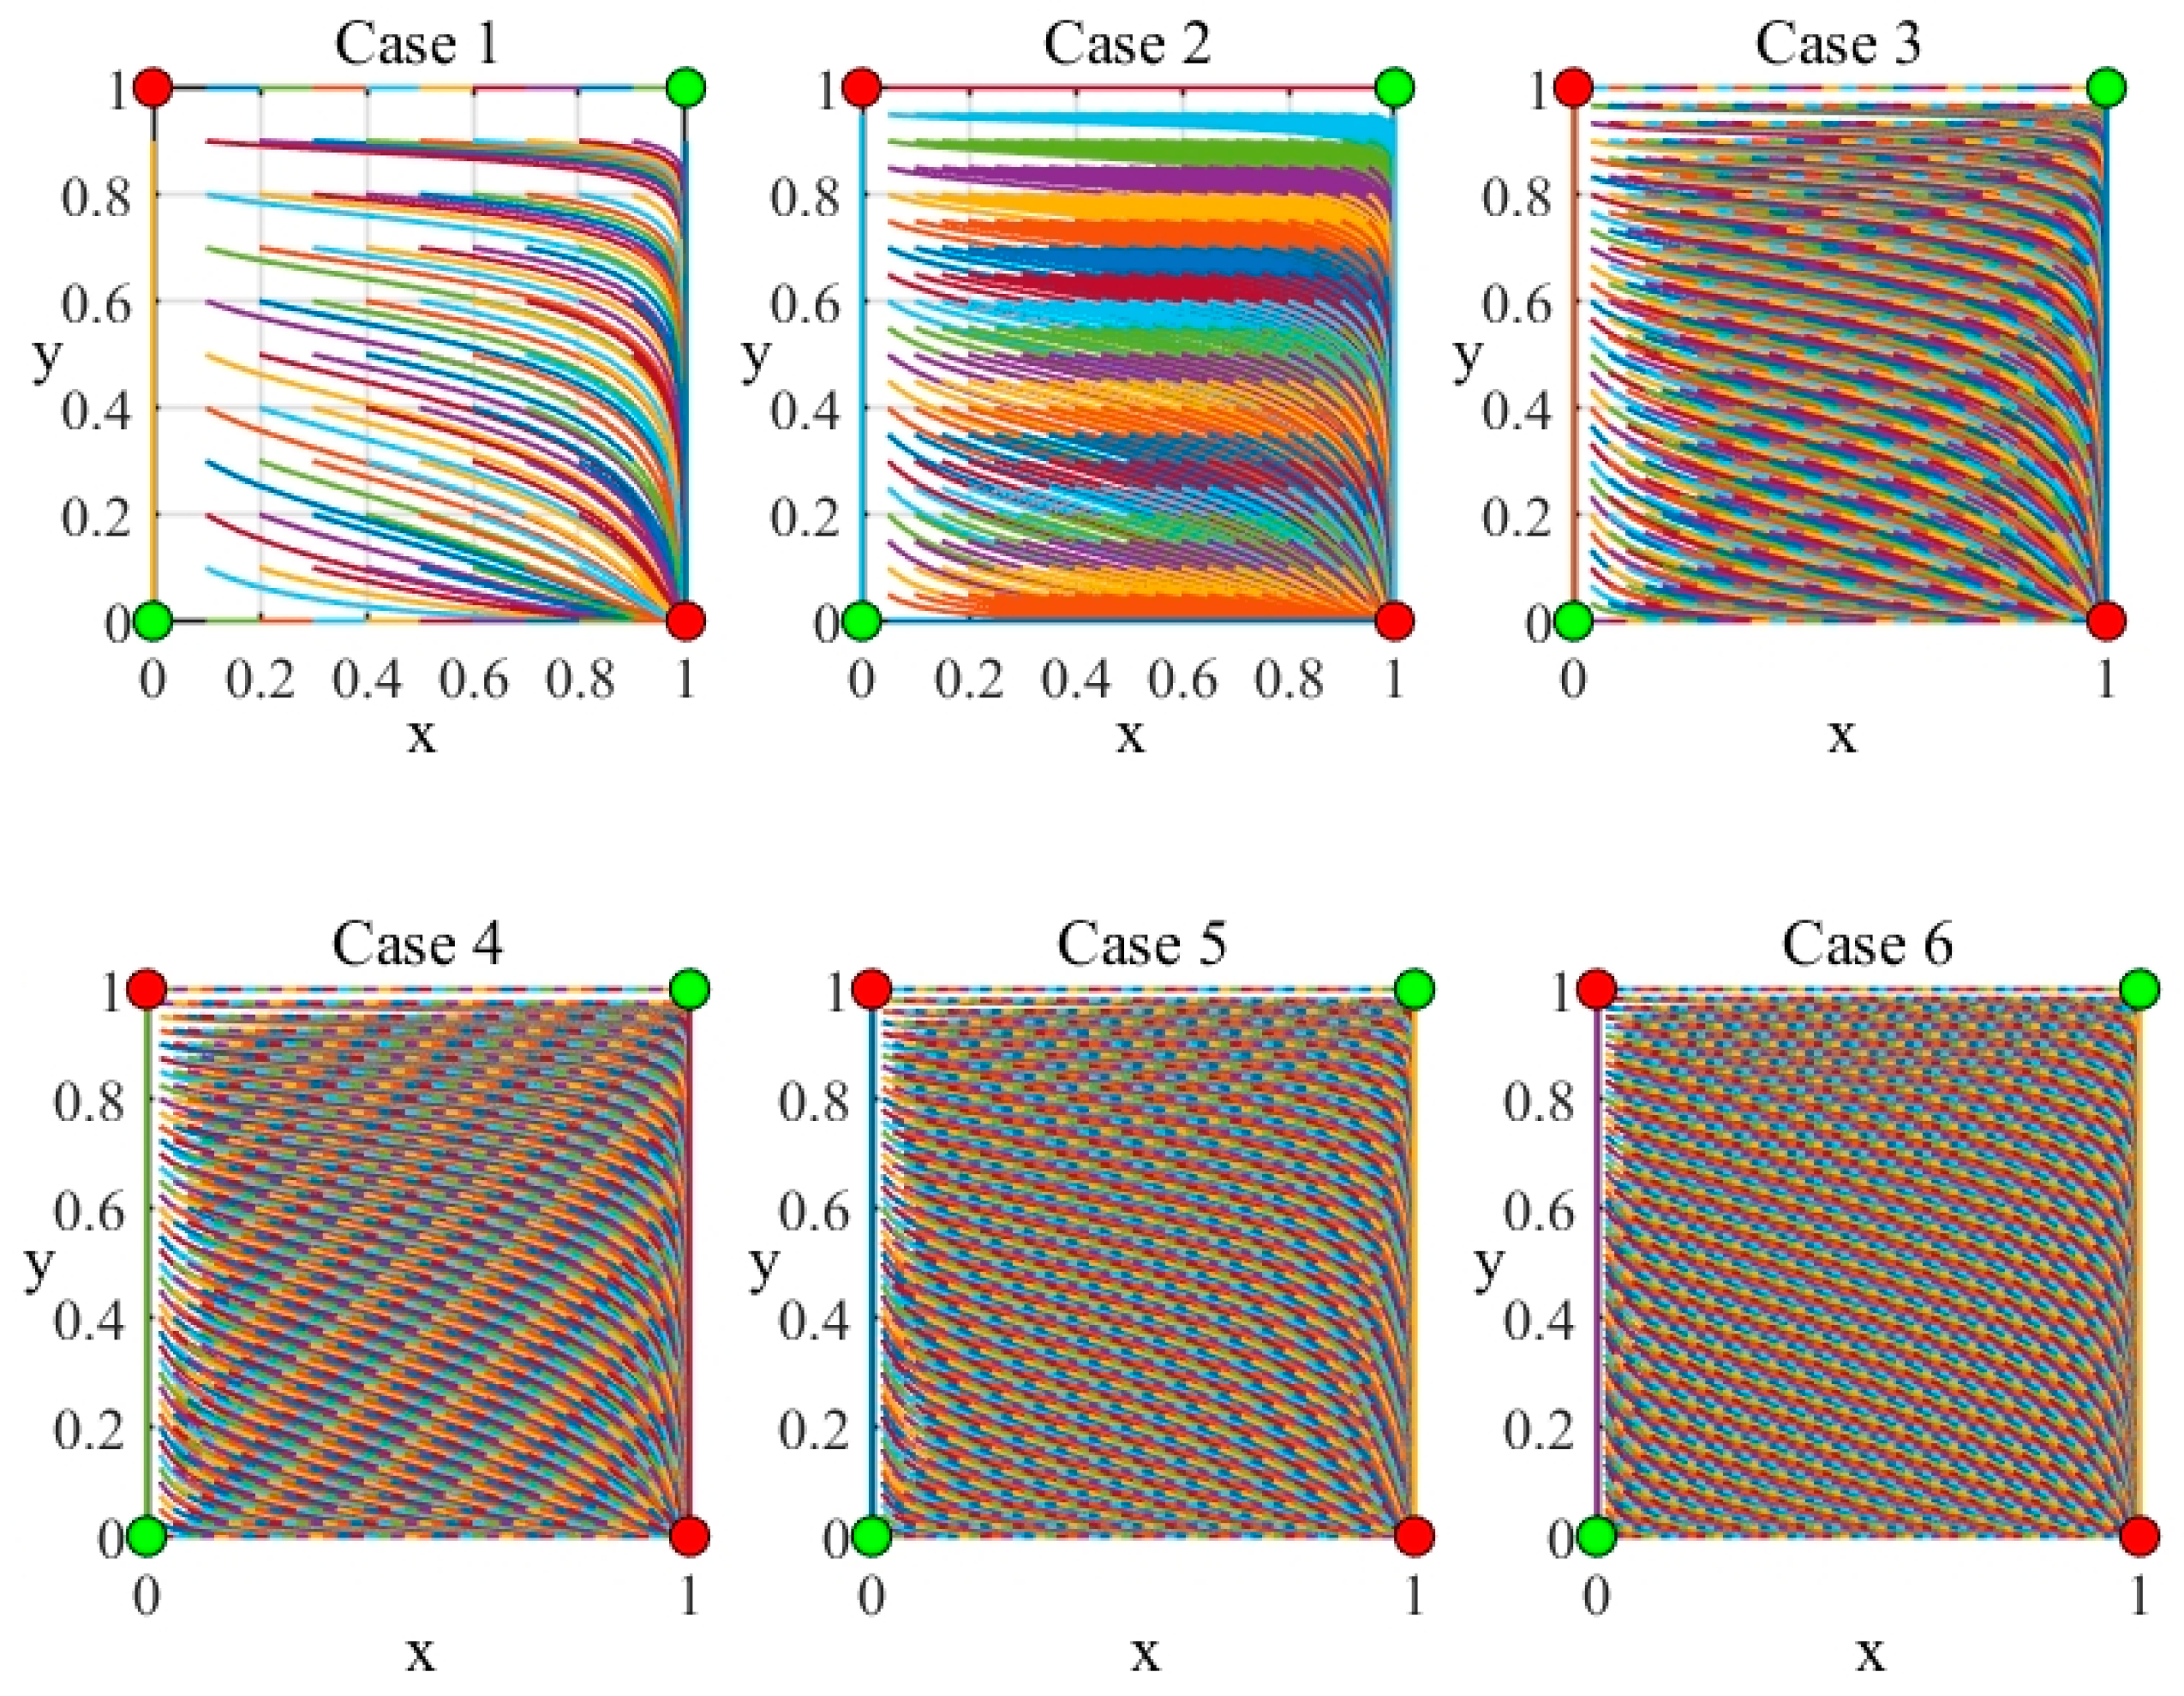
- (i)
- Plotted in the unit square [0, 1] × [0, 1], each trajectory shows how the pair (x, y) changes jointly over time.
- (ii)
- The colored corners and interior points correspond to equilibrium candidates: Red corners in these diagrams typically coincide with stable boundary equilibria (ESS). Green corners are unstable equilibria, where trajectories rarely linger. The blue point in the interior (e.g., (2/5, 3/7)) is a saddle-like equilibrium: it may attract trajectories along certain directions yet repel them along others.
- (i)
- (0, 0) and (1, 1): Both have a positive determinant but a positive trace, leading to instability under the replicator dynamics. Hence, these corner points are labeled green in Figure 3.
- (ii)
- (0, 1) and (1, 0): These corners exhibit negative trace with positive determinant, indicating ESS (red points). They attract a wide range of trajectories that begin in their “basin” of attraction.
- (iii)
- (2/5, 3/7): The determinant is negative (or only marginally positive/negative depending on parameter variations), and the trace is zero. Such a condition typically signifies a saddle or “soft” equilibrium. Consequently, it is shown in blue in the phase plots, reflecting its partial attraction and partial repulsion properties.
- (a)
- a = 3, b = 5, c = 7, d = 9, e = 6, f = 3, g = 4, and h = 2, which define payoff outcomes in different user–grid strategic interactions;
- (b)
- A simulation horizon tmax = 50 (in, for instance, dimensionless time units or hours, depending on context);
- (c)
- An integration step size Δt = 0.01 (unit), and two hundred independent runs (ntrajectories = 200) per noise “case” to explore the variability of outcomes under distinct noise intensities and coupling structures.
3. Evolutionary Game Model of User–Grid Cooperation in Peak Shaving Participation
- Economic parameters, such as revenue, costs, subsidies, and penalties.
- Operational parameters, like efficiency, dynamic pricing, and user–grid interaction costs.
- Behavioral parameters, such as risk aversion and responsiveness to incentives.
3.1. Evolutionary Game Model of User–Grid Participation in Power System Peak Shaving
3.1.1. Parameter Settings and Key Steps in Model Construction
- (i)
- Strategies of Cooperation and Non-Cooperation: Each party, users and the grid, has the option to adopt either a cooperative or non-cooperative strategy during peak shaving. Cooperation involves mutual participation in renewable energy grid integration, while non-cooperation reflects unilateral actions or inaction.
- (ii)
- Payoff Matrix Construction: The payoff matrix defines the potential revenue for each party under each strategic combination (cooperation/cooperation, cooperation/non-cooperation, etc.). These revenues are calculated based on their respective benefits and associated costs of participation or abstention.
- (iii)
- Jacobian Matrix and Evolutionary Stability Conditions: Using the constructed payoff matrix, the Jacobian matrix is derived to analyze the dynamic interactions between users and the grid. The conditions for ESCs are then formulated, identifying the stable strategies that ensure mutual benefit maximization under given circumstances.
- (iv)
- Case Analysis and Simulation: The derived evolutionary stability conditions are applied to specific case scenarios, analyzing various equilibrium outcomes. Simulations are conducted to illustrate the impacts of strategic choices on the revenue and cost dynamics of users and the grid.
- (i)
- Cooperation by Both Sides: When both the user and the grid choose cooperation, they collectively maximize the net benefits derived from renewable energy integration projects. The grid’s revenue increases due to shared surplus profit allocation (1 − α)ΔS, while the user benefits through its surplus profit allocation αΔS, minus the respective additional costs related to renewable energy consumption or generation.
- (ii)
- One-Sided Cooperation: If one party opts for cooperation while the other does not, the cooperative party faces additional costs while receiving no benefit from surplus profit allocation, leading to an imbalanced distribution of benefits.
- (iii)
- Non-Cooperation by Both Sides: When both parties choose non-cooperation, the payoffs revert to the baseline level of benefit without any surplus profit or additional cost incurred, resulting in a stagnant scenario for the overall system’s advancement.
- (i)
- Base Benefits (πg and πf): These represent the foundational economic returns for the grid and users, respectively, under normal conditions without implementing peak-shaving programs.
- (ii)
- Surplus Profit (ΔSg, ΔSf, and ΔS): These variables quantify the additional profit generated through cooperative strategies. ΔS represents the total surplus profit shared between the grid (1 − α) and users (α).
- (iii)
- Cost Parameters (lg, lf): These represent the incremental costs incurred by the grid and users for handling renewable energy integration during peak-shaving programs.
- (iv)
- Incremental Revenue (γg, γf): These factors reflect the unit revenue increases for the grid and users due to renewable energy adoption.
- (v)
- Energy Variables (Q and ΔQ): These specify the additional electricity consumption or production changes depending on the user’s cooperative or non-cooperative behavior.
3.1.2. Model Construction
- (i)
- Instability of Fitness Gradients: The replicator dynamic equations are driven by the differences in fitness (or payoffs) between strategies. At the mixed strategy equilibrium, any small deviation in either x or y caused by external perturbations will lead to a fitness imbalance. This imbalance drives the system away from the equilibrium point, as the proportions of individuals adopting each strategy will adjust dynamically to maximize their respective payoffs.
- (ii)
- Absence of Evolutionary Stability: For a point to be evolutionarily stable, any deviation from the equilibrium should result in forces that restore the system back to the equilibrium. However, at this mixed strategy equilibrium, small deviations in x or y create reinforcing feedback loops in the fitness gradients, pushing the system further away instead of returning to the equilibrium. This lack of restorative forces means the mixed strategy equilibrium cannot maintain long-term stability.
- (iii)
- Competitive Dynamics Between Strategies: The coexistence of cooperative and non-cooperative strategies inherently creates competition between these strategies. The payoff structures for both the user group and the power grid indicate that as one strategy becomes slightly more dominant, it starts to outcompete the other, further destabilizing the equilibrium.
- (iv)
- Path Dependency and System Sensitivity: The equilibrium values of x and y are highly sensitive to the parameters ΔS, ΔQ, γg, γf, lg, and lf. Any changes in these parameters, such as fluctuations in demand or shifts in cost structures, can disrupt the equilibrium state, leading to an evolutionary trajectory away from the mixed strategy equilibrium.
3.1.3. Evolutionary Stability Analysis
3.2. Theoretical Integration of Whole-Process Democracy into the Evolutionary Game Framework
3.2.1. Assumptions
- (i)
- Whole-Process Democracy (WPD): This concept promotes transparency, equality, and continuous feedback between stakeholders, especially in decision-making. It incorporates deliberative processes in which users and grid operators consult each other to adjust strategies dynamically based on mutual feedback.
- (ii)
- Incorporation of Deliberative Democracy in Payoff Structure: In the evolutionary game, the payoff for each player (users and the grid) can be enhanced by incorporating the idea of negotiation and mutual decision-making, which reflects real-world democratic processes.
3.2.2. Mathematical Framework
- xi represents the proportion of population i (users or grid).
- πi(x, y) is the payoff function for individual iii given the strategy profile (x, y).
- is the average payoff in the population.
- δ is a factor that modulates the effect of deliberative processes.
- Fdem(x, y) is a function representing the adjustments in payoffs due to cooperative negotiation and democratic processes.
- Government subsidies (Sg, Su);
- User participation in decision-making (αu);
- Feedback mechanisms (Rfeedback).
- αu and βg are coefficients that adjust the influence of subsidies for the user and grid, respectively.
- Rfeedback represents the impact of deliberative feedback between the parties.
3.2.3. Stability Analysis and Equilibrium Derivation
4. Evolutionary Stability Analysis of User-Power Grid Participation in Peak Shaving
4.1. Scenario 1: Simulation Analysis
- Physical/Engineering Implications: The equilibrium points in this evolutionary game represent the balance between the incremental profits and costs associated with adopting cooperative strategies for renewable energy and peak shaving projects. In engineering applications, this translates to optimal resource allocation: Both the user group and the power grid can maximize their respective payoffs by aligning their strategies with the conditions for evolutionary stability.
- System Stability: The final cooperative equilibrium ensures a sustainable and efficient distribution of energy resources, reducing costs and increasing system efficiency.
- Scalability: The model can be extended to larger-scale systems with multiple user groups and power grids, highlighting its practical applicability in energy management.
- Factors Influencing the Equilibrium Point: (i) Cost Coefficients. Lower lg and lf values reduce the barrier for cooperation, encouraging more frequent cooperative behaviors. (ii) Benefit Coefficients. Higher γg and γf values increase the attractiveness of cooperative strategies, accelerating the convergence to the stable equilibrium. (iii) Allocation Ratio (α): A balanced allocation ratio ensures fair distribution of incremental profits, maintaining trust and cooperation between the parties.
4.2. Scenario 2: Simulation Analysis
- (i)
- Cost barriers to cooperation: High initial costs can discourage both users and the power grid from adopting cooperative strategies, even when long-term benefits are achievable.
- (ii)
- Policy implications: To promote cooperation, it is essential to reduce the initial cost barriers or provide subsidies and incentives to offset the costs of participation.
- (iii)
- Dynamic systems behavior: The simulation results emphasize the importance of initial conditions in determining the evolutionary trajectory of the system. Systems with high initial costs are more likely to stabilize at non-cooperative equilibria.
- (i)
- Cost Coefficients: Higher lg and lf values discourage cooperation by increasing the relative cost of participation.
- (ii)
- Benefit Coefficients: Lower γg and γf values reduce the attractiveness of cooperative strategies, reinforcing non-cooperative behavior.
- (iii)
- Allocation Ratio (α): The distribution of incremental profits plays a critical role in determining the likelihood of cooperation. An inequitable allocation ratio can exacerbate non-cooperative tendencies.
- High-Cost Barrier to Cooperation: High initial costs (lg, lf) discourage both users and the power grid from adopting cooperative strategies. This is especially evident in Case 1 and Case 2 of Figure 9, where the trajectories show significant tendencies toward non-cooperation in the early stages of the game.
- System Optimization through Mixed Strategies: The results indicate that under high-cost scenarios, mixed strategies are more prevalent. Both users and the power grid alternate between cooperation and non-cooperation to maximize their respective payoffs. This dynamic behavior underscores the importance of designing flexible operational strategies in energy systems.
- Profit Distribution and Stability: The allocation ratio (α) plays a crucial role in determining the likelihood of cooperation. A higher α value favors the power grid, potentially discouraging user cooperation. Conversely, a lower α may incentivize users but reduce the grid’s motivation.
- (i)
- Cost Parameters (lg, lf): Higher costs reduce the attractiveness of cooperative strategies, especially for users.
- (ii)
- Benefit Parameters (γg, γf): Lower incremental profits from renewable energy supply discourage cooperative behavior.
- (iii)
- Allocation Ratio (α): Equitable distribution of profits is critical for maintaining trust and fostering cooperation.
- (i)
- Subsidies and incentives: Implementing financial incentives can lower the barriers to cooperation and ensure system stability.
- (ii)
- Dynamic pricing models: Introducing flexible pricing schemes based on real-time energy consumption can enhance user participation.
- (iii)
- Integrated system design: Engineering solutions should focus on minimizing initial costs and optimizing profit distribution to encourage sustainable cooperation.
4.3. Scenario 3: Simulation Analysis
- (i)
- Economic Feasibility of Cooperation: When the incremental costs (lg, lf) outweigh the incremental profits (γg, γf), cooperation becomes economically unsustainable. This is evident in the trajectories of all six cases in Figure 10, where the system converges to non-cooperative equilibria.
- (ii)
- Barriers to Cooperation: The high costs associated with renewable energy generation and consumption discourage both users and the power grid from engaging in cooperative strategies. These barriers are further exacerbated by the inequitable distribution of profits, as evidenced by the low values of a and b.
- (iii)
- Role of Initial Conditions: The high initial investment costs create inertia that locks both parties into non-cooperative behaviors, even when marginal gains from cooperation are achievable. This highlights the importance of addressing cost barriers to enable cooperation.
- (i)
- Economic Challenges: The lack of economic feasibility due to high costs and low profits forces both the user group and the power grid to reject cooperative strategies. This highlights the need for targeted interventions to reduce costs and enhance the economic appeal of cooperation.
- (ii)
- Policy Implications: Policy measures such as subsidies, cost-sharing mechanisms, and tax incentives are essential to overcome the barriers to cooperation. These measures can help offset the high initial costs and make cooperative strategies more attractive.
- (iii)
- Engineering Design: From an engineering perspective, the focus should be on reducing the costs of renewable energy generation and improving the efficiency of grid-connected peak shaving projects. This can be achieved through technological innovation and optimized system design.
- (iv)
- Sensitivity to Profit Distribution: The allocation ratio (α) plays a critical role in determining the outcomes of the evolutionary game. An equitable profit distribution mechanism can foster trust and encourage cooperation between users and the power grid.
4.4. Scenario 4: Simulation Analysis
- (i)
- Profit Distribution and Incentives: While users gain a significant share of the redistributed profits, the power grid’s lower share discourages cooperation. This imbalance highlights the importance of designing equitable distribution mechanisms to incentivize all participants.
- (ii)
- High-Cost Barrier: The high initial costs associated with renewable energy generation and consumption impose significant constraints on cooperative behavior. For the power grid, the incremental profits are insufficient to justify the associated costs, leading to a preference for non-cooperative strategies.
- (iii)
- System Optimization: The simulation underscores the need for optimization in system design to reduce costs and improve efficiency. Technological innovations and policy interventions, such as subsidies or tax incentives, could help offset the high costs and encourage cooperation.
- (i)
- Policy Implications: To promote cooperation, policymakers should implement measures such as subsidies, cost-sharing mechanisms, or differential pricing to reduce the economic burden on participants.
- (ii)
- Engineering Solutions: From an engineering perspective, reducing the costs of renewable energy generation and grid-connected peak shaving projects through improved technology and system design is essential for fostering cooperation.
- (iii)
- Sensitivity to Cost–Profit Ratios: The equilibrium points are highly sensitive to the ratios of costs to profits. Achieving stability requires careful calibration of these parameters to ensure mutual benefits for all parties.
- (i)
- Economic Incentives for Cooperation: The redistribution of profits, particularly the share received by the power grid (b = 1176 yuan), plays a crucial role in incentivizing cooperative strategies.
- (ii)
- The incremental profits (c, f) for both the user group and the power grid are sufficient to offset their respective costs (e, d), creating a favorable environment for cooperation.
- (iii)
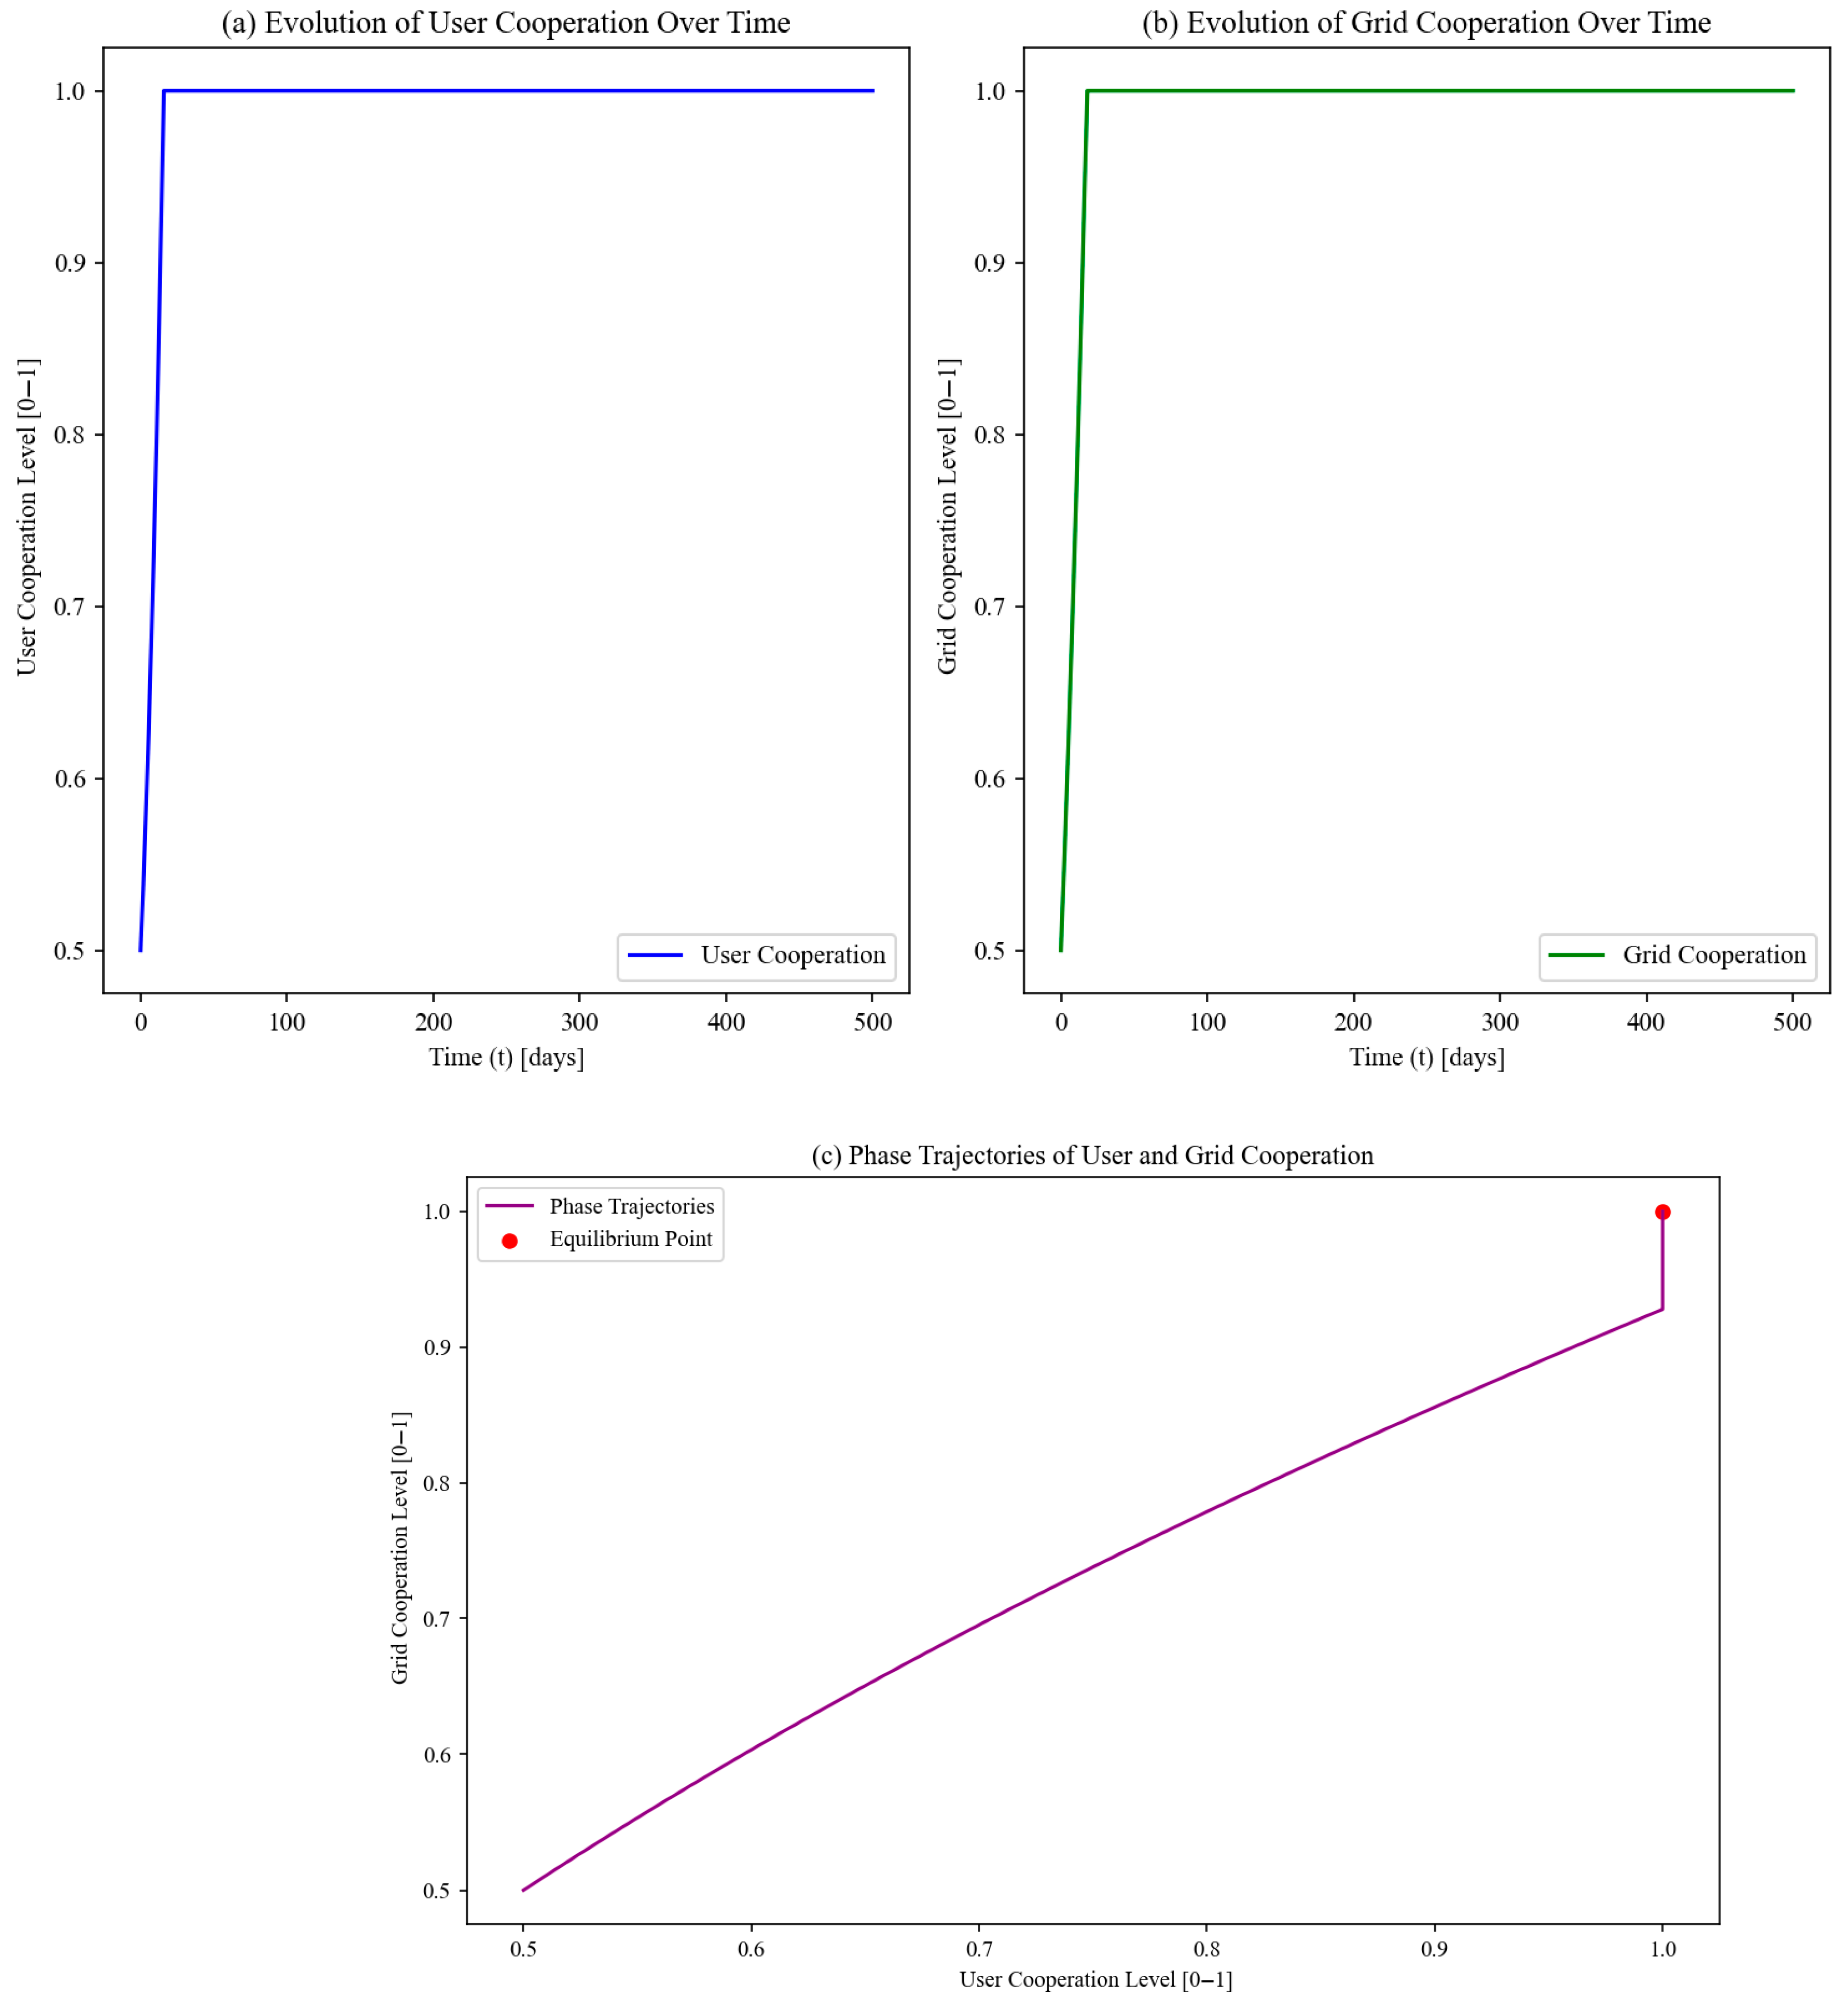
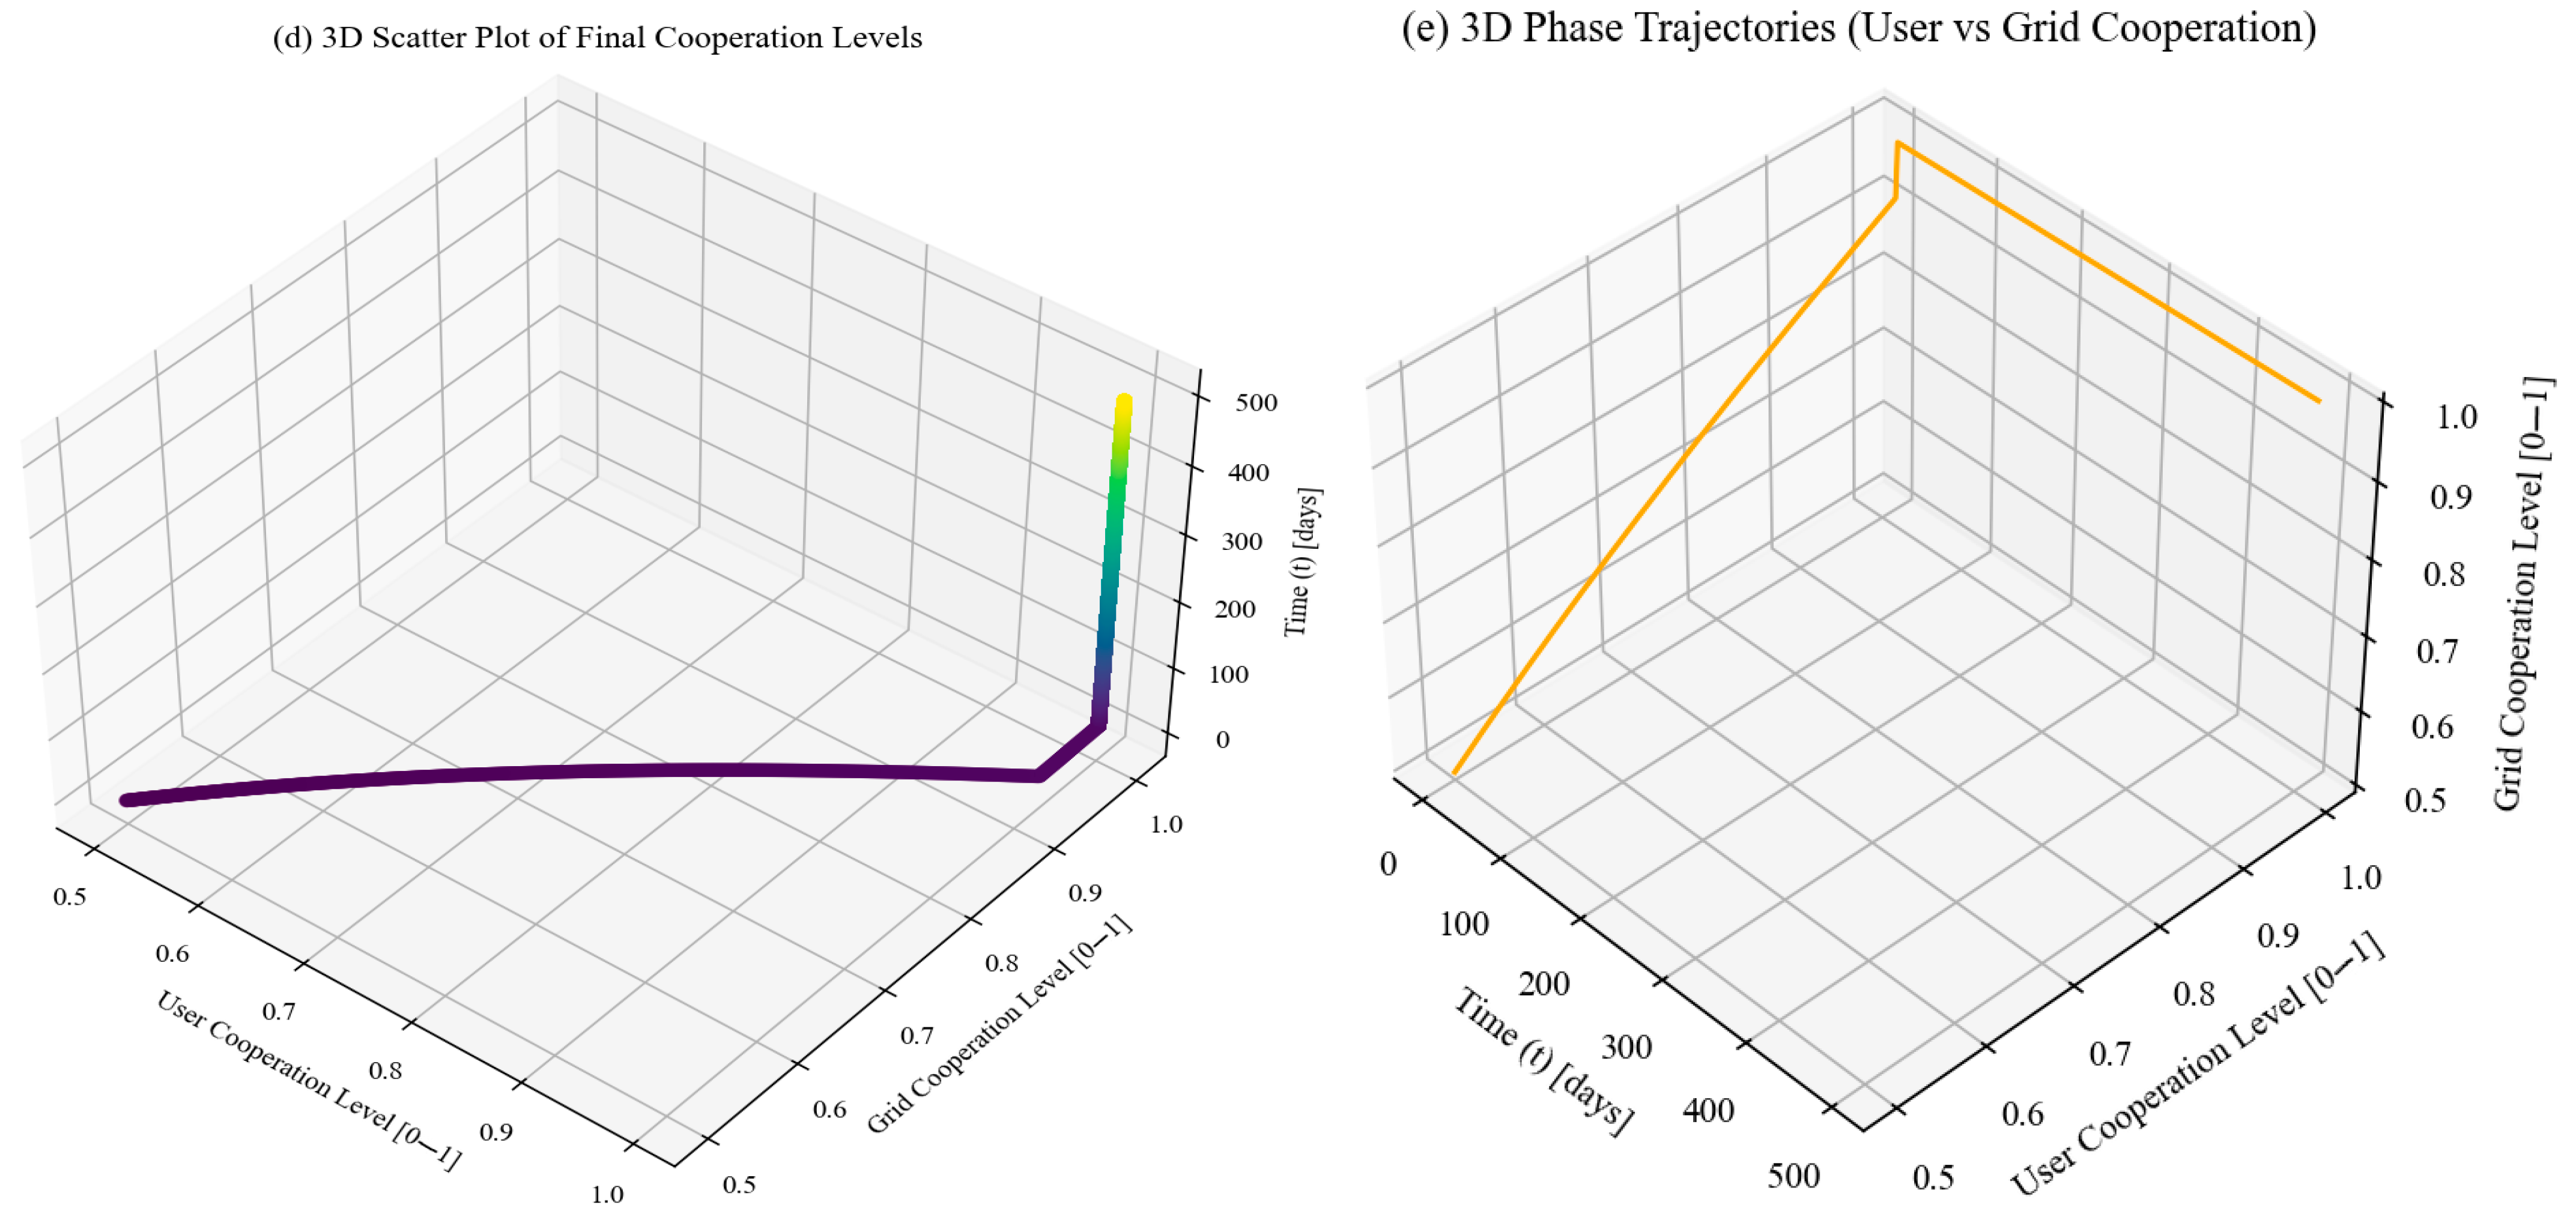
- Stability of Cooperative Behavior: The simulation results reveal that the system evolves toward a stable cooperative equilibrium. This is particularly evident in Cases 4, 5, and 6, where the trajectories clearly show convergence toward full cooperation (x = 1, y = 1). The stability of cooperation depends on ensuring that both parties perceive mutual benefits. This is achieved through equitable profit distribution and manageable cost structures.
- (iv)
- Cost–Profit Dynamics: The high profits gained from renewable energy generation and consumption make cooperation attractive, even when initial investment costs are significant. The relative magnitudes of γg, γf, lg, and lf determine the feasibility of cooperation. In this scenario, the benefits (γg, γf) exceed the costs (lg, lf), tipping the balance toward cooperative strategies.
- (i)
- Economic Feasibility: The simulation demonstrates that cooperative strategies are economically viable when the incremental profits outweigh the associated costs. This is critical for fostering long-term cooperation.
- (ii)
- Importance of Profit Distribution: Equitable distribution of profits is essential for ensuring that both parties are motivated to cooperate. The allocation ratio (α = 0.6) strikes a balance between the interests of the user group and the power grid.
- (iii)
- Policy Recommendations: Policy interventions, such as subsidies or tax incentives, can further enhance the attractiveness of cooperative strategies by reducing the financial burden on participants.
- (iv)
- Engineering Design: From an engineering perspective, optimizing the efficiency of renewable energy systems and reducing investment costs are critical for achieving sustainable cooperation. This can be achieved through technological innovation and improved system design.
4.5. Scenario 5: Simulation Analysis
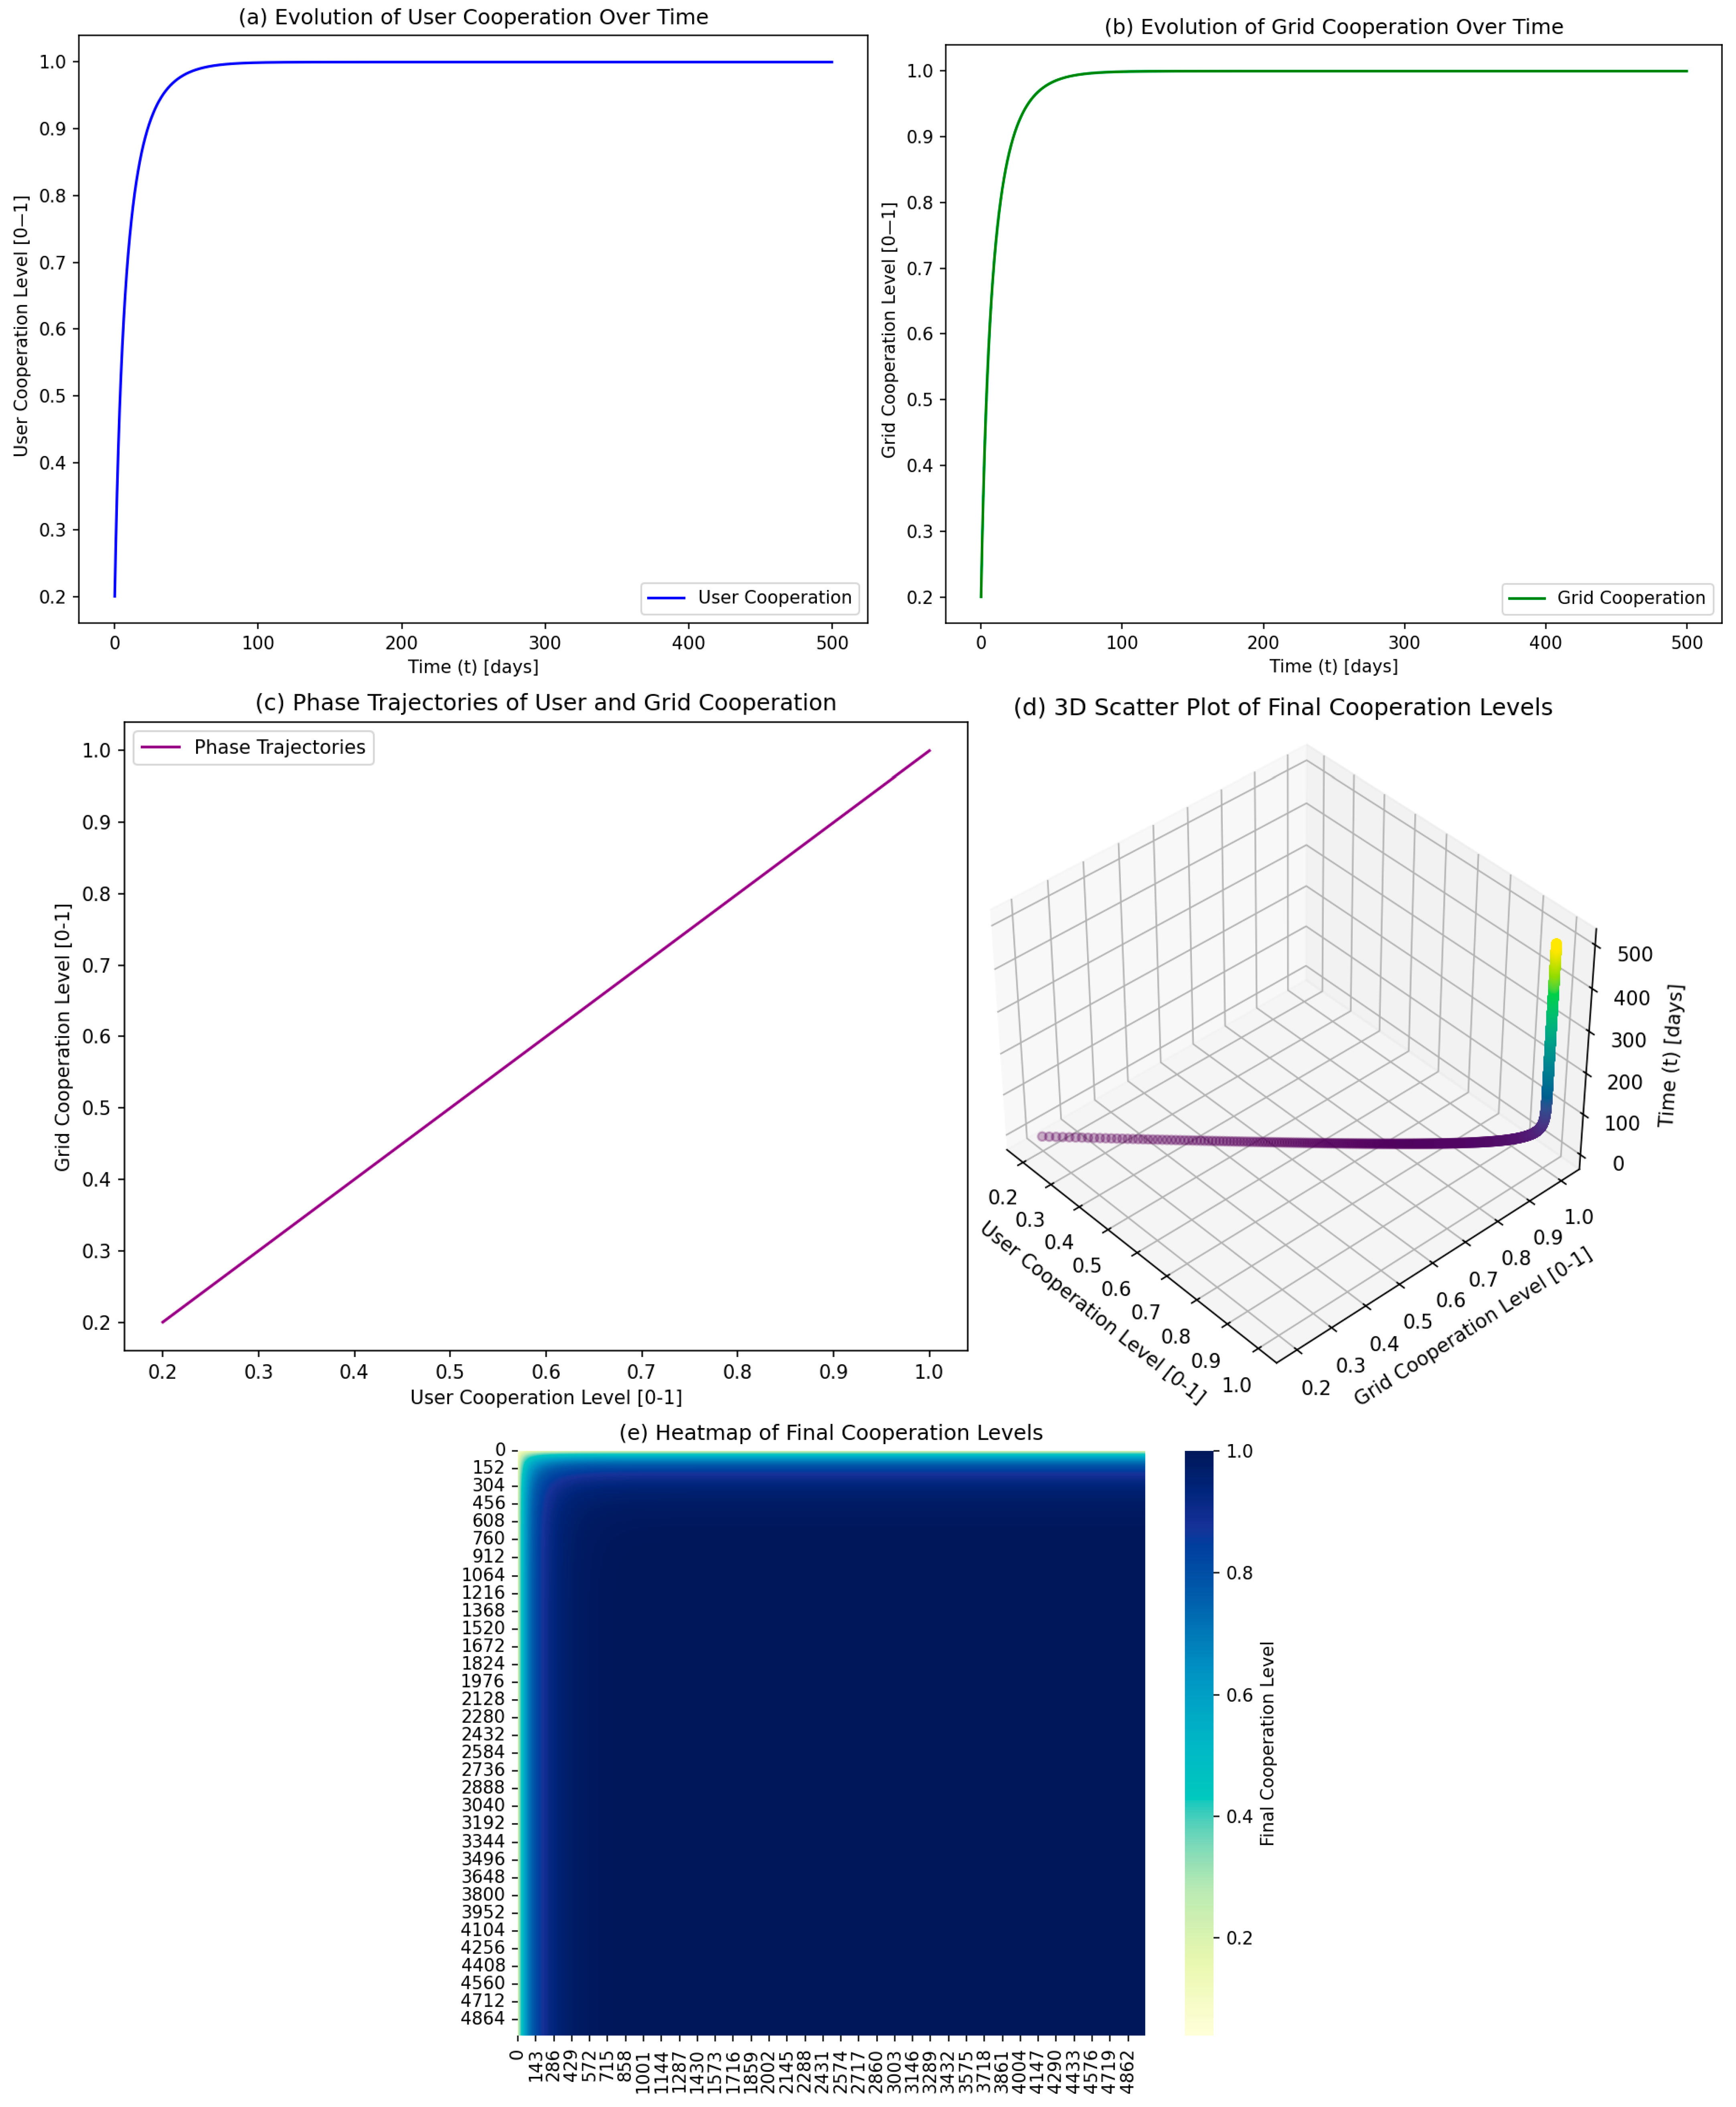
- (i)
- Economic Viability of Cooperation: The results clearly demonstrate that cooperation becomes unsustainable when the price of renewable energy fails to provide a competitive advantage over conventional energy. Both users and the power grid experience diminishing returns from cooperative strategies, with profits (c, f) failing to offset costs (d, e).
- (ii)
- Profit Distribution and Incentive Misalignment: The allocation ratio (α = 0.55) provides limited relief to either party. The user group’s share (a = 135) and the power grid’s share (b = 165) are insufficient to justify cooperation. These findings suggest that profit redistribution alone is not enough to incentivize cooperative behavior in high-cost scenarios.
- (iii)
- Barriers to Adoption of Renewable Energy: The high costs associated with renewable energy generation and consumption remain a significant barrier. Parameters such as lg, lf, and γg play a pivotal role in determining the feasibility of cooperation.
- (iv)
- Implications for System Design: From a system design perspective, reducing the costs of renewable energy technologies is critical. This includes innovations in generation efficiency, storage solutions, and grid integration. Policy measures, such as subsidies or carbon pricing, may also be necessary to level the playing field between renewable and conventional energy sources.
- (i)
- Economic Constraints: Cooperation between users and the power grid is unattainable when renewable energy prices are uncompetitive. This highlights the need for targeted interventions to improve cost efficiency and profitability.
- (ii)
- Role of Profit Redistribution: While profit redistribution can mitigate some economic disparities, it is not sufficient to overcome the high costs associated with renewable energy projects. This underscores the importance of addressing cost structures directly.
- (iii)
- Policy and Engineering Solutions: Policymakers must implement strategies such as subsidies, tax incentives, and carbon pricing to reduce the economic burden on stakeholders. Engineers must focus on advancing technologies that lower the costs of renewable energy generation and grid integration.
- (iv)
- System Optimization: Optimizing the allocation of resources and improving the operational efficiency of renewable energy systems are critical for achieving long-term sustainability and cooperation.
- (v)
- Practical Implications: The results emphasize the importance of aligning economic incentives with environmental objectives. By addressing the cost barriers and ensuring equitable profit distribution, renewable energy projects can achieve greater acceptance and integration into the energy market.
- (i)
- Importance of Profit Distribution: Equitable profit-sharing mechanisms are crucial for promoting cooperation. Scenarios 2 and 4, in particular, demonstrate that rational redistribution can offset economic disparities and enable cooperative outcomes, even when the initial conditions are not ideal.
- (ii)
- Role of Cost Reduction: Scenarios 3 and 5 emphasize that high costs are a major barrier to cooperation. Reducing the costs of renewable energy generation and integration is critical for ensuring that the associated profits are sufficient to justify investment and collaboration.
- (iii)
- Economic and Policy Interventions: To enhance the feasibility of cooperation, policymakers should consider implementing targeted interventions, such as subsidies, tax incentives, and carbon pricing. These measures can help level the playing field for renewable energy and make it more competitive with conventional energy sources.
- (iv)
- Engineering and Technological Innovations: From an engineering perspective, advancing technologies that improve the efficiency and reduce the costs of renewable energy systems is essential. Innovations in storage solutions, grid infrastructure, and energy management systems can significantly enhance the economic viability of renewable energy projects.
- (i)
- Inspiration for Energy Policy Design: The insights gained from these scenarios highlight the need for policy frameworks that incentivize cooperation while addressing economic disparities. Policymakers can use these findings to design mechanisms that encourage renewable energy adoption and foster collaborative behavior across stakeholders.
- (ii)
- Broader Applicability of Evolutionary Game Models: The evolutionary game model employed in this study proves to be a robust tool for analyzing complex energy systems. Future research can extend this approach to explore interactions in other contexts, such as regional energy markets, international energy trade, and multi-stakeholder collaborations.
- (iii)
- Integration of Environmental and Social Factors: While this study focuses on economic factors, future research should consider incorporating environmental and social dimensions. For example, the long-term benefits of reduced carbon emissions and improved energy security could provide additional incentives for cooperation.
- (iv)
- Exploration of Adaptive Strategies: This study assumes static strategies for the user group and the power grid. Future work could explore dynamic, adaptive strategies that allow stakeholders to respond to changing market conditions, technological advancements, and policy interventions in real-time.
4.6. Scenario 6: Considering Both Internal and External Factors
- (i)
- Enhanced Realism: Incorporate a broader range of factors affecting user and grid behaviors to more accurately model real-world interactions.
- (ii)
- Nonlinear Dynamics: Utilize nonlinear mathematical functions (e.g., sigmoid and logarithmic functions) to represent diminishing returns and saturation effects typical in economic and technological systems.
- (iii)
- Interdependency Representation: Reflect the interdependent nature of user and grid strategies, where the decisions of one party dynamically influence the payoffs of the other.
- (iv)
- Policy and Incentive Modeling: Integrate government policies and subsidies to analyze their impact on fostering cooperation and achieving equilibrium.
- (v)
- Comprehensive Analysis: Provide a more detailed framework for analyzing the evolutionary stability conditions and dynamic interactions over time.
- (i)
- Inclusion of Additional Factors: The extended matrix incorporates government subsidies, dynamic pricing, and technological costs, which were absent in the original matrix.
- (ii)
- Nonlinear Payoff Calculations: Transitioning from simple additive or subtractive models to nonlinear functions allows for more nuanced payoff structures that better mimic real-world scenarios.
- (iii)
- Dynamic Interactions: The extended model captures the dynamic interplay between users and the grid, where each party’s strategy evolves based on the other’s actions and external influences.
- (iv)
- Policy Impact Representation: By including parameters for government subsidies and penalties, the model can simulate the effects of regulatory frameworks and incentives on strategic decisions.
- (v)
- Diminishing Marginal Effects: The use of sigmoid and logarithmic functions introduces diminishing marginal returns and penalties, reflecting realistic constraints and behavioral responses.
- (i)
- Greater Analytical Depth: The extended model allows for a more thorough analysis of the conditions under which cooperation between users and the grid can be sustained, considering various influencing factors.
- (ii)
- Policy Formulation Insights: By modeling the impact of subsidies and penalties, policymakers can gain insights into how different regulatory measures might promote or hinder cooperative behaviors in peak shaving.
- (iii)
- Enhanced Predictive Capability: The nonlinear dynamics provide a more accurate prediction of how users and the grid might respond to changing conditions, such as fluctuations in dynamic pricing or variations in technological costs.
- (iv)
- Robust Simulation Framework: A more complex payoff matrix supports sophisticated simulations that can capture a wider range of possible outcomes, facilitating better decision-making and strategic planning.
- (v)
- Alignment with Real-World Scenarios: By reflecting the complexity of actual energy systems, the model becomes a more reliable tool for researchers and practitioners aiming to optimize user–grid interactions and promote sustainable energy practices.
- : Base revenue, which represents the user’s normal revenue without participating in peak shaving. This is the fundamental income derived from regular electricity consumption;
- : Additional revenue from cooperation, influenced by the efficiency factor and dynamic pricing, modeled using a sigmoid function to represent an S-shaped growth trend;
- : User cooperation cost, represented nonlinearly to reflect diminishing marginal costs;
- : Government subsidy for users, influenced by grid cooperation costs, modeled using a sigmoid function to capture the decaying effect of subsidies as grid cooperation costs increase. Here, the impact of government subsidies can be reflected by , which means that government subsidies to users decrease as the grid’s cooperation costs Cg increase, modeled via a sigmoid function to reflect diminishing returns of subsidies at higher cooperation costs. The sigmoid function models the decreasing impact of subsidies as the grid’s cooperation cost Cg rises.
- : Base revenue reduced by penalties due to grid non-cooperation;
- : Penalty term influenced by dynamic pricing, modeled using a logarithmic function to ensure penalties increase with dynamic pricing but at a decreasing rate;
- : Deduction of cooperation costs.
4.7. Scenario 7: Incorporating Evolutionary Game Theory and Whole-Process Democracy
- User Cooperation Level (x): Proportion of users actively engaging in peak shaving and energy-saving behaviors.
- Grid Cooperation Level (y): Proportion of the grid actively participating in facilitating energy transfers and balancing renewable energy fluctuations.
- Time (t): Simulation time in days, ranging from 0 to 500 days.
- Parameter settings: These values dictate the interaction dynamics between users and the grid, such as cost–benefit ratios, profit sharing, and incentives for cooperation. Specific parameters include incremental benefits from cooperation (ΔS), cost coefficients (γg, γf), and time steps for simulation (Δt).
- (i)
- Inclusive Policy Formulation: Governments should promote policies that are based on whole-process democracy, ensuring that all stakeholders—users, grid enterprises, and policymakers—are involved in the decision-making process. This approach would help in identifying optimal solutions for cooperation and resolving potential conflicts. By giving both users and grid enterprises a platform for input, policies would more accurately reflect their needs and interests, leading to greater buy-in and commitment to cooperative initiatives.
- (ii)
- Equitable Benefit Distribution: The simulations emphasize that cooperation is most successful when both parties benefit equitably. Government subsidies and cost-sharing mechanisms should be designed to ensure that both users and grid enterprises share the benefits of cooperation fairly. This might include subsidies for users who adopt energy-efficient practices or participate in peak shaving, while also providing incentives for grid enterprises to invest in infrastructure improvements that support renewable energy integration.
- (iii)
- Incentive-Based Regulation: Policymakers should design incentive mechanisms that align the interests of users and grid enterprises. For instance, financial incentives or tax breaks could encourage grid operators to invest in renewable energy infrastructure, while users could be incentivized to adopt energy-saving technologies and participate in peak regulation programs. These incentives should be structured in a way that fosters long-term cooperation rather than short-term, transactional exchanges.
- (iv)
- Dynamic Policy Adjustment: Given the evolutionary nature of user–grid cooperation, policies must be adaptable to changing circumstances. The game-theoretic model suggests that as both parties learn and adapt, the equilibrium points evolve. Policymakers should establish mechanisms for adaptive policy-making, where adjustments can be made based on real-time data and changing conditions in the energy market. This could involve periodic reviews of policy effectiveness, as well as the flexibility to adjust subsidies or cost-sharing structures as necessary to maintain equilibrium.
- (v)
- Incorporation of Stochastic Factors: Future policy frameworks should also consider the potential for random fluctuations or external shocks (e.g., technological changes, economic shifts, or environmental disruptions). The evolutionary game model can be extended to incorporate stochastic elements, allowing policymakers to simulate the effects of unexpected changes and adjust their strategies accordingly. This would provide a more resilient framework for managing cooperation in renewable energy systems, ensuring that both users and the grid can adapt to unforeseen challenges.
- (vi)
- Long-Term Stakeholder Engagement: To ensure the success of cooperative strategies, long-term engagement with stakeholders is essential. Policymakers should engage in continuous dialogue with both users and grid enterprises to monitor the effectiveness of cooperation initiatives and address emerging concerns. This could be achieved through regular consultative forums, stakeholder surveys, or feedback loops that allow for the identification and resolution of issues before they become barriers to cooperation.
5. Discussion and Future Research Directions
5.1. Model Enhancements
- (i)
- Inclusion of External Shocks and Uncertainties: Real-world scenarios often involve stochastic elements such as fluctuations in energy demand or policy changes. Future models can integrate stochastic differential equations to simulate these external influences.
- (ii)
- Dynamic Network Effects: Future studies could explore the spatial and temporal network effects of user–grid interactions, considering how decisions in one region impact neighboring regions.
- (iii)
- Behavioral Considerations: The model can be extended to include behavioral factors such as user preferences, risk aversion, and social norms, providing a more holistic understanding of decision-making dynamics.
5.2. Technological Innovations and Applications
- (i)
- Advanced Energy Storage Solutions: The integration of cost-effective energy storage systems can alleviate the intermittency challenges of renewable energy, enabling more reliable participation in peak-shaving programs.
- (ii)
- (iii)
6. Conclusions and Policy Implications
6.1. Main Conclusions
- (i)
- Profit Allocation Dynamics: The study emphasizes that cooperation between users and grid operators can only be sustained if the profit allocation mechanism is perceived as fair by both parties. Equitable distribution of benefits is essential for fostering long-term cooperation, and imbalances in profit-sharing mechanisms can undermine the willingness of either party to participate in the program. Hence, well-designed incentive structures that align the interests of both users and grid operators are crucial for ensuring sustained collaboration.
- (ii)
- Profit Margins and Costs: The study finds that cooperation will be unsustainable if the costs associated with renewable energy generation and participation in peak-shaving programs exceed the attainable profits. In such scenarios, either party might withdraw from the cooperation due to economic infeasibility. The research suggests that policy interventions are required to reduce the costs of participation and ensure that the economic benefits of collaboration are sufficient to incentivize both parties to engage in long-term cooperation.
- (iii)
- Competition with Conventional Energy: The analysis reveals that renewable energy prices must be competitive with those of conventional energy for cooperation to persist. In scenarios where renewable energy is not economically viable compared to traditional sources, grid operators and users are less likely to cooperate, as the costs of participating in renewable energy programs outweigh the benefits. This underscores the need for policies that level the playing field and make renewable energy more competitive with conventional energy sources.
- (iv)
- A Comprehensive Modeling Approach: This study introduces a comprehensive evolutionary game framework for analyzing the strategic interactions between users and the grid in peak shaving. This model can be expanded to address other critical aspects of user–grid interaction, such as demand response, energy storage, and the integration of additional renewable energy sources like wind and solar. By providing a rigorous theoretical model, the study lays the foundation for future research in understanding the broader dynamics of energy systems.
- (v)
- Importance of Incentive Policies: The study highlights the critical role of government policies in ensuring the success of cooperative peak-shaving programs. Without appropriate incentives, both users and grid operators may be unwilling to participate in such programs. The study suggests that policies such as subsidies, tax incentives, and improved energy pricing mechanisms can ensure that both parties are incentivized to participate and cooperate, making renewable energy systems economically sustainable.
- (vi)
- Sustainability of Long-Term Cooperation: The research suggests that long-term cooperation requires more than just short-term profit maximization. Trust-building mechanisms, clear communication, and policy stability are essential to maintaining cooperation over extended periods. The study finds that the evolutionary stability of cooperation relies not only on immediate financial incentives but also on long-term policy frameworks that can adapt to changing energy demands, environmental factors, and technological advancements.
6.2. Policy Implications
- (i)
- Regulatory Interventions for Renewable Energy Pricing: Governments must implement regulatory measures to ensure that renewable energy pricing remains competitive with conventional energy sources. In China, where the government has made substantial investments in renewable energy, dynamic pricing could align with the evolving energy market by incentivizing consumers to shift their demand to off-peak periods, which is critical in a rapidly developing energy sector. Similarly, in the EU, where energy markets are increasingly integrated, dynamic pricing can help balance supply and demand across member states, fostering cooperation among grid operators and users. Our simulations suggest that such pricing mechanisms could complement existing subsidies and incentive programs, leading to more efficient and sustainable renewable energy integration. Our simulations indicate that dynamic pricing strategies, where prices are adjusted based on real-time demand, could be effective in fostering cooperation between users and grid operators. In Scenario 4, we observe that dynamic pricing significantly reduces peak demand, especially when combined with user incentives that encourage flexible participation. This result suggests that dynamic pricing could be a potent tool to enhance participation in peak-shaving programs, particularly when real-time pricing aligns with grid operator needs. Direct subsidies, tax incentives, and other financial tools can be used to reduce the production costs of renewable energy, making it economically attractive for both grid operators and users. In addition to these incentives, governments can support long-term contracts for renewable energy purchases, ensuring a stable market for renewable energy while providing price parity with fossil fuels. This will not only encourage the adoption of renewable energy but also ensure that cooperative strategies between users and grid operators can be sustained.
- (ii)
- Fair Allocation Mechanisms: Policies must ensure that profits generated from peak-shaving systems are allocated in an equitable manner. One key aspect of fostering cooperation is to design profit-sharing mechanisms that account for both the immediate and long-term benefits to each party. For example, grid operators could receive a share of the profits from reduced peak load while users could be compensated for their participation in energy conservation efforts. Policies should also consider how the implementation of subsidies or government incentives can offset the initial capital investment costs for renewable energy technologies, such as solar panels, wind turbines, or battery storage systems. The key to sustaining cooperation is to ensure that both sides feel that their contributions are rewarded adequately.
- (iii)
- Incentives for Peak Shaving Participation: Policies that encourage renewable energy participation in peak-shaving programs should focus on reducing the initial investment costs and ensuring financial viability for both users and grid operators. Our simulations show that subsidy programs play a crucial role in driving adoption of peak-shifting strategies. In Scenario 2, we find that subsidies covering 50% of initial investment costs lead to x > 0.8, indicating high user participation. This result suggests that financial incentives targeting the reduction of initial costs can significantly increase participation rates in peak-shaving programs. Governments can provide tax incentives or offer subsidies for the installation of renewable energy technologies, thus reducing the upfront costs for users. Additionally, grid operators should be incentivized to integrate renewable energy sources into the grid by offering financial rewards for successfully reducing peak demand and maintaining grid stability. Furthermore, incentive programs could reward users who contribute to grid stability through energy storage and demand-side management programs.
- (iv)
- Development of Adaptive Feedback Mechanisms: Governments and grid operators should work together to develop adaptive feedback mechanisms that respond to dynamic conditions in the energy market. Dynamic pricing strategies should be developed that adjust based on real-time energy demand. Feedback loops can also be implemented that adjust subsidies and incentives based on the cooperative behavior of both users and grid operators. Such mechanisms will help to ensure that cooperation remains sustainable, even when external factors, such as energy demand, climate change, or market conditions, evolve. These adaptive systems will ensure that cooperative relationships can evolve dynamically over time, reflecting changing market conditions and technological advancements.
- (v)
- Promotion of Whole-Process Democracy in Energy Policy: The concept of whole-process democracy must be integrated into the formulation of energy policies. Simulation results underscore the importance of inclusive decision-making, where all stakeholders—users, grid operators, and government bodies—are involved in policy design. In Scenario 5, we observe that when users and grid operators have an equal say in policy development, the system reaches a more stable equilibrium, with higher levels of participation in peak-shaving programs. This highlights the importance of whole-process democracy in ensuring that policies are both effective and widely supported. This democratic approach ensures that all stakeholders, including users, grid operators, and government bodies, participate in the decision-making process. Inclusive and transparent decision-making fosters trust and social legitimacy, leading to more effective and widely supported policies. This democratic framework will help ensure that energy policies are socially just and equitable, particularly in addressing concerns around distributional fairness. Through consultation and equal participation, decision-makers can better align the interests of all parties, thereby fostering cooperation and creating a more sustainable and equitable energy future.
- (vi)
- Promotion of Long-Term Cooperation: Sustainable cooperation requires long-term policy stability. Governments and grid operators must develop frameworks that ensure consistent and predictable policies, enabling both users and grid operators to plan and invest with confidence. Policies should include long-term contracts, investment guarantees, and the possibility of adaptation to emerging technological trends, such as smart grids and energy storage technologies. This stability will help build the trust necessary for cooperation, particularly in contexts where high initial investments are required. Additionally, to ensure long-term cooperation, governments must provide regular reviews of incentive structures, adjusting them to reflect changing energy dynamics, technological advancements, and evolving social preferences.
Author Contributions
Funding
Data Availability Statement
Acknowledgments
Conflicts of Interest
Glossary
| Term | Definition/Description |
| Agent-Based Model (ABM) | A computational model for simulating the actions and interactions of autonomous agents to assess their effects on the system as a whole. |
| Carbon Trading | A market-based mechanism designed to reduce greenhouse gas emissions by allowing entities to buy and sell carbon credits. |
| Clean Energy Transition | The shift from fossil fuel-based energy systems to renewable and low-carbon energy sources such as solar, wind, and hydropower. |
| Distributed Energy Resources (DERs) | Small-scale energy generation and storage technologies located close to the point of consumption, such as rooftop solar panels or home batteries. |
| Dynamic Pricing | A flexible pricing mechanism where energy prices fluctuate based on supply, demand, and time of use, incentivizing energy efficiency. |
| Evolutionarily Stable Strategy (ESS) | A strategy in game theory that, if adopted by a population, cannot be invaded by an alternative strategy due to its higher or equal fitness. |
| Evolutionary Game Theory (EGT) | A theoretical framework for modeling strategic interactions in evolving populations where agents adapt their strategies over time. |
| Feedback Mechanism | A process where the output of a system affects its inputs, often used to regulate or stabilize system dynamics. |
| Jacobian Matrix | A mathematical matrix of partial derivatives used to assess the stability of equilibrium points in dynamic systems. |
| Low-Carbon Energy System | An energy system that minimizes carbon emissions through the use of renewable energy sources and energy-efficient technologies. |
| Multi-Population Dynamics | The study of interactions and strategic adaptations among multiple groups or populations within a system. |
| Nash Equilibrium | A game-theoretic concept where no player can gain by unilaterally changing their strategy, given that others keep their strategies unchanged. |
| Payoff Matrix | A table that represents the potential outcomes (or payoffs) for each player in a strategic game, given the combination of strategies chosen. |
| Peak Shaving | The process of reducing energy demand during periods of high consumption to stabilize the grid and reduce costs. |
| Renewable Portfolio Standards (RPS) | A regulatory mandate requiring a certain percentage of electricity to be generated from renewable sources. |
| Replicator Dynamics | A mathematical model used in evolutionary game theory to describe how the proportion of strategies in a population evolves over time. |
| Smart Grid | An electricity network that uses digital technology and advanced analytics to monitor and manage energy generation, distribution, and consumption efficiently. |
| Social Networks | Interconnected systems of individuals or groups that influence behavior, information dissemination, and decision-making processes in energy systems. |
| Stochastic Differential Equation (SDE) | A differential equation incorporating random processes, used to model systems affected by uncertainty or noise. |
| Sustainability | Meeting present needs without compromising the ability of future generations to meet their own needs, particularly in energy contexts. |
| System Dynamics | A modeling methodology used to study and analyze complex systems and their behavior over time through feedback loops and time delays. |
| Time-of-Use Pricing | An electricity pricing scheme where the cost of electricity varies based on the time of day, encouraging consumers to shift usage to off-peak hours. |
| Utility-Scale Renewable Energy | Large-scale renewable energy projects, such as solar farms or wind parks, that generate power for distribution through the grid. |
| User–Grid Interaction | The bidirectional relationship between energy consumers and the power grid, often facilitated by demand-side management and smart technologies. |
| Virtual Power Plant (VPP) | A system that integrates and controls decentralized energy resources, such as solar panels and batteries, to operate as a single power plant. |
| Whole-Process Democracy (WPD) | An inclusive, transparent, and participatory decision-making framework that actively involves all stakeholders—such as users, grid operators, and policymakers—throughout the entire process of energy system planning, implementation, and regulation to foster equitable cooperation and sustainable outcomes in renewable energy integration. |
References
- Wang, Z.; Qin, H.; Lewis, J.I. China’s wind power industry: Policy support, technological achievements, and emerging challenges. Energy Policy 2012, 51, 80–88. [Google Scholar] [CrossRef]
- Dai, J.; Yang, X.; Wen, L. Development of wind power industry in China: A comprehensive assessment. Renew. Sustain. Energy Rev. 2018, 97, 156–164. [Google Scholar] [CrossRef]
- Xing, Y.; Yang, Y.; Lyu, M.; Yang, B.; Liu, X. Evolved gambling analysis of power industry innovation alliance under the chain leader system. In Proceedings of the 2024 7th International Conference on Power and Energy Applications (ICPEA), Taiyuan, China, 18–20 October 2024; pp. 735–740. [Google Scholar] [CrossRef]
- Alizadeh, A. Designing a transactive energy framework for harnessing local flexibilities under high penetration of renewables. Ph.D. Thesis, Université Laval, Québec, QC, Canada, 2024. Available online: https://corpus.ulaval.ca/bitstreams/97e75d6a-3538-420c-8720-fb828b601e60/download (accessed on 23 January 2024).
- Zuo, Y.; Zhao, X.; Zhang, Y.; Ling-Zhi, R. From feed-in tariff to renewable portfolio standards: An evolutionary game theory perspective. J. Clean. Prod. 2019, 213, 1274–1289. [Google Scholar] [CrossRef]
- Aziz, A.; Oo, A.T.; Stojcevski, A. Frequency regulation capabilities in wind power plant. Sustain. Energy Technol. Assess. 2018, 26, 47–76. [Google Scholar] [CrossRef]
- Gallard, A.J.; Albritton, F.; Morgan, M.W. A comprehensive cost/benefit model: Developmental student success impact. J. Dev. Educ. 2010, 34, 10. [Google Scholar]
- Raju, B.; Mohan Reddy, P.; Vuddanti, S. Decentralized coordination of electric vehicle charging in microgrids using game theory. In Proceedings of the 2024 IEEE 3rd International Conference on Electrical Power and Energy Systems (ICEPES), Bhopal, India, 21–22 June 2024; pp. 1–5. [Google Scholar] [CrossRef]
- Reuter, W.H.; Szolgayová, J.; Fuss, S.; Obersteiner, M. Renewable energy investment: Policy and market impacts. Appl. Energy 2012, 97, 249–254. [Google Scholar] [CrossRef]
- Hashemizadeh, A.; Ju, Y.; Abadi, F.Z.B. Policy design for renewable energy development based on government support: A system dynamics model. Appl. Energy 2024, 376, 124331. [Google Scholar] [CrossRef]
- Dong, Z.; Tan, C.; Zhang, W.; Zhang, L.; Zhang, L. Are natural resources a blessing or a curse for renewable energy? Uncovering the role of regulatory quality and government effectiveness in mitigating the curse. Resour. Policy 2024, 98, 105346. [Google Scholar] [CrossRef]
- Stigka, E.K.; Paravantis, J.A.; Mihalakakou, G.K. Social acceptance of renewable energy sources: A review of contingent valuation applications. Renew. Sustain. Energy Rev. 2014, 32, 100–106. [Google Scholar] [CrossRef]
- Cheng, L.; Yu, T. Game-theoretic approaches applied to transactions in the open and ever-growing electricity markets from the perspective of power demand response: An overview. IEEE Access 2019, 7, 25727–25762. [Google Scholar] [CrossRef]
- Cheng, L.; Yin, L.F.; Wang, J.H.; Shen, T.; Chen, Y.; Liu, G.Y.; Yu, T. Behavioral decision-making in power demand-side response management: A multi-population evolutionary game dynamics perspective. Int. J. Electr. Power Energy Syst. 2021, 129, 106743. [Google Scholar] [CrossRef]
- Cheng, L.; Liu, G.Y.; Huang, H.Q.; Wang, X.G.; Chen, Y.; Zhang, J.; Meng, A.B.; Yang, R.; Yu, T. Equilibrium analysis of general N-population multi-strategy games for generation-side long-term bidding: An evolutionary game perspective. J. Clean. Prod. 2020, 276, 124123. [Google Scholar] [CrossRef]
- Song, M.; Xu, H.; Shen, Z.; Pan, X. Energy market integration and renewable energy development: Evidence from the European Union countries. J. Environ. Manag. 2022, 317, 115464. [Google Scholar] [CrossRef] [PubMed]
- Johansson, T.B.; Turkenburg, W. Policies for renewable energy in the European Union and its member states: An overview. Energy Sustain. Dev. 2004, 8, 5–24. [Google Scholar] [CrossRef]
- Cheng, L.; Yu, T. Nash equilibrium-based asymptotic stability analysis of multi-group asymmetric evolutionary games in typical scenario of electricity market. IEEE Access 2018, 6, 32064–32086. [Google Scholar] [CrossRef]
- Weitemeyer, S.; Kleinhans, D.; Vogt, T.; Agert, C. Integration of Renewable Energy Sources in future power systems: The role of storage. Renew. Energy 2015, 75, 14–20. [Google Scholar] [CrossRef]
- Manousakis, N.M.; Karagiannopoulos, P.S.; Tsekouras, G.J.; Kanellos, F.D. Integration of renewable energy and electric vehicles in power systems: A review. Processes 2023, 11, 1544. [Google Scholar] [CrossRef]
- Dudiak, J.; Kolcun, M. Integration of renewable energy sources to the power system. In Proceedings of the 2014 14th International Conference on Environment and Electrical Engineering, Krakow, Poland, 10–12 May 2014; IEEE: New York, NY, USA, 2014; pp. 148–151. [Google Scholar]
- Zheng, Z.; Shafique, M.; Luo, X.; Wang, S. A systematic review towards integrative energy management of smart grids and urban energy systems. Renew. Sustain. Energy Rev. 2024, 189, 114023. [Google Scholar] [CrossRef]
- Shahzad, S.; Jasińska, E. Renewable revolution: A review of strategic flexibility in future power systems. Sustainability 2024, 16, 5454. [Google Scholar] [CrossRef]
- Kohlhepp, P.; Harb, H.; Wolisz, H.; Waczowicz, S.; Müller, D.; Hagenmeyer, V. Large-scale grid integration of residential thermal energy storages as demand-side flexibility resource: A review of international field studies. Renew. Sustain. Energy Rev. 2019, 101, 527–547. [Google Scholar] [CrossRef]
- Worighi, I.; Maach, A.; Hafid, A.; Hegazy, O.; Van Mierlo, J. Integrating renewable energy in smart grid system: Architecture, virtualization and analysis. Sustain. Energy Grids Netw. 2019, 18, 100226. [Google Scholar] [CrossRef]
- Cheng, L.; Chen, Y.; Liu, G.Y. 2PnS-EG: A general two-population n-strategy evolutionary game for strategic long-term bidding in a deregulated market under different market clearing mechanisms. Int. J. Electr. Power Energy Syst. 2022, 142 Pt A, 108182. [Google Scholar] [CrossRef]
- Colman, A.M. Cooperation, psychological game theory, and limitations of rationality in social interaction. Behav. Brain Sci. 2003, 26, 139–153. [Google Scholar] [CrossRef] [PubMed]
- Roca, C.P.; Cuesta, J.A.; Sánchez, A. Evolutionary game theory: Temporal and spatial effects beyond replicator dynamics. Phys. Life Rev. 2009, 6, 208–249. [Google Scholar] [CrossRef] [PubMed]
- Cressman, R.; Tao, Y. The replicator equation and other game dynamics. Proc. Natl. Acad. Sci. USA 2014, 111 (Suppl. S3), 10810–10817. [Google Scholar] [CrossRef] [PubMed]
- Holland, J.N.; DeAngelis, D.L.; Schultz, S.T. Evolutionary stability of mutualism: Interspecific population regulation as an evolutionarily stable strategy. Proc. R. Soc. Lond. B Biol. Sci. 2004, 271, 1807–1814. [Google Scholar] [CrossRef] [PubMed]
- Wang, G.; Chao, Y.; Cao, Y.; Jiang, T.; Han, W.; Chen, Z. A comprehensive review of research works based on evolutionary game theory for sustainable energy development. Energy Rep. 2022, 8, 114–136. [Google Scholar] [CrossRef]
- Feng, T.J.; Li, C.; Zheng, X.D.; Lessard, S.; Tao, Y. Stochastic replicator dynamics and evolutionary stability. Phys. Rev. E. 2022, 105, 044403. [Google Scholar] [CrossRef] [PubMed]
- Cheng, L.; Huang, P.; Zou, T.; Zhang, M.; Peng, P.; Lu, W. Evolutionary game-theoretical approaches for long-term strategic bidding among diverse stakeholders in large-scale and local power markets: Basic concept, modelling review, and future vision. Int. J. Electr. Power Energy Syst. 2025, 166, 110589. [Google Scholar] [CrossRef]
- Cheng, L.; Peng, P.; Lu, W.; Sun, J.; Wu, F.; Shi, M.; Yuan, X.; Chen, Y. The evolutionary game equilibrium theory on power market bidding involving renewable energy companies. Int. J. Electr. Power Energy Syst. 2025, 167, 110588. [Google Scholar] [CrossRef]
- Karaki, A.; Al-Fagih, L. Evolutionary game theory as a catalyst in smart grids: From theoretical insights to practical strategies. IEEE Access 2024, 12, 186926–186940. [Google Scholar] [CrossRef]
- Cheng, L.; Peng, P.; Lu, W.; Huang, P.; Chen, Y. Study of flexibility transformation in thermal power enterprises under multi-factor drivers: Application of complex-network evolutionary game theory. Mathematics 2024, 12, 2537. [Google Scholar] [CrossRef]
- Zhu, Z.; Cheng, L.; Shen, T. Spontaneous formation of evolutionary game strategies for long-term carbon emission reduction based on low-carbon trading mechanism. Mathematics 2024, 12, 3109. [Google Scholar] [CrossRef]
- Cheng, L.; Huang, P.; Zhang, M.; Yang, R.; Wang, Y. Optimizing electricity markets through game-theoretical methods: Strategic and policy implications for power purchasing and generation enterprises. Mathematics 2025, 13, 373. [Google Scholar] [CrossRef]
- Cheng, L.; Wei, X.; Li, M.; Tan, C.; Yin, M.; Shen, T.; Zou, T. Integrating evolutionary game-theoretical methods and deep reinforcement learning for adaptive strategy optimization in user-side electricity markets: A comprehensive review. Mathematics 2024, 12, 3241. [Google Scholar] [CrossRef]
- Ko, T.; Lee, J.; Ryu, D. Blockchain technology and manufacturing industry: Real-time transparency and cost savings. Sustainability 2018, 10, 4274. [Google Scholar] [CrossRef]
- De Filippi, P. The interplay between decentralization and privacy: The case of blockchain technologies. J. Peer Prod. 2016, 7, hal-01382006. [Google Scholar]
- Chen, Y.; Bellavitis, C. Blockchain disruption and decentralized finance: The rise of decentralized business models. J. Bus. Ventur. Insights 2020, 13, e00151. [Google Scholar] [CrossRef]
- Ertemel, A.V. Implications of blockchain technology on marketing. J. Int. Trade Logist. Law 2018, 4, 35–44. [Google Scholar]
- Sundaram, A. Multiobjective multi verse optimization algorithm to solve dynamic economic emission dispatch problem with transmission loss prediction by an artificial neural network. Appl. Soft Comput. 2022, 124, 109021. [Google Scholar] [CrossRef]
- Yun, P.; Wu, H.; Alsenani, T.R.; Bouzgarrou, S.M.; Alkhalaf, S.; Alturise, F.; Almujibah, H. On the utilization of artificial intelligence for studying and multi-objective optimizing a compressed air energy storage integrated energy system. J. Energy Storage 2024, 84, 110839. [Google Scholar] [CrossRef]
- Hamid, M.; Ganne, A. Artificial intelligence in energy markets and power systems. J. Eng. Technol. Manag. 2023, 5, 2582–5208. [Google Scholar]
- Mohammad, A.; Mahjabeen, F. Revolutionizing solar energy: The impact of artificial intelligence on photovoltaic systems. Int. J. Multidiscip. Sci. Arts 2023, 2, 591856. [Google Scholar] [CrossRef]
- Raza, M.Q.; Khosravi, A. A review on artificial intelligence based load demand forecasting techniques for smart grid and buildings. Renew. Sustain. Energy Rev. 2015, 50, 1352–1372. [Google Scholar] [CrossRef]
- Chen, X.; Cao, W.; Zhang, Q.; Hu, S.; Zhang, J. Artificial intelligence-aided model predictive control for a grid-tied wind-hydrogen-fuel cell system. IEEE Access 2020, 8, 92418–92430. [Google Scholar] [CrossRef]
- Rojek, I.; Mikołajewski, D.; Mroziński, A.; Macko, M. Machine learning-and artificial intelligence-derived prediction for home smart energy systems with PV installation and battery energy storage. Energies 2023, 16, 6613. [Google Scholar] [CrossRef]
- Zou, X.; Chen, J.; Gao, S. Network effect in shared supply chain platform value co-creation behavior in evolutionary game. J. Intell. Fuzzy Syst. 2021, 41, 4713–4724. [Google Scholar] [CrossRef]
- Du, S. An evolutionary game-theoretic analysis of cooperation strategy between SMEs and cross-border e-commerce platforms considering the cross-network effect. Kybernetes 2024, 53, 1857–1887. [Google Scholar] [CrossRef]
- Yang, H.; Mo, J. Research on the bidding behavior of generation-side enterprises based on stochastic evolutionary games. IEEE Trans. Power Syst. 2021, 37, 3693–3703. [Google Scholar] [CrossRef]
- Gao, X.; Zhong, W.; Mei, S. Stochastic evolutionary game dynamics and their selection mechanisms. Comput. Econ. 2013, 41, 233–247. [Google Scholar] [CrossRef]
- Wang, G.; Su, Q.; Wang, L. Evolution of state-dependent strategies in stochastic games. J. Theor. Biol. 2021, 527, 110818. [Google Scholar] [CrossRef] [PubMed]
- Gao, X.; Shen, J.; He, W.; Sun, F.; Zhang, Z.; Guo, W.; Zhang, X.; Kong, Y. An evolutionary game analysis of governments’ decision-making behaviors and factors influencing watershed ecological compensation in China. J. Environ. Manag. 2019, 251, 109592. [Google Scholar] [CrossRef] [PubMed]
- Zhang, R.; Wei, Z.; Gu, H.; Qiu, S. Behavior evolution of multi-group in the process of pedestrian crossing based on evolutionary game theory. Sustainability 2021, 13, 2009. [Google Scholar] [CrossRef]
- Cheng, L.; Yu, F.; Huang, P.; Liu, G.; Zhang, M.; Sun, R. Game-theoretic evolution in renewable energy systems: Advancing sustainable energy management and decision optimization in decentralized power markets. Renew. Sustain. Energy Rev. 2025, 217, 115776. [Google Scholar] [CrossRef]
- Cheng, L.; Peng, P.; Huang, P.; Zhang, M.; Meng, X.; Lu, W. Leveraging evolutionary game theory for cleaner production: Strategic insights for sustainable energy markets, electric vehicles, and carbon trading. J. Clean. Prod. 2025, 512, 145682. [Google Scholar] [CrossRef]
- Fakhrooeian, P.; Pitz, V. Scheduling the charging and discharging events of electric vehicles for quasi dynamic load flow calculations of a low-voltage distribution grid with regard to stochastic behavior and grid requirements. Electr. Power Syst. Res. 2023, 216, 109021. [Google Scholar] [CrossRef]
- Coban, H.; Lewicki, W.; Sendek-Matysiak, E.; Łosiewicz, Z.; Drożdż, W.; Miśkiewicz, R. Electric vehicles and vehicle–grid interaction in the Turkish electricity system. Energies 2022, 15, 8218. [Google Scholar] [CrossRef]
- Hoffmann, S.; Adelt, F.; Weyer, J. Modelling end-user behavior and behavioral change in smart grids: An application of the model of frame selection. Energies 2020, 13, 6674. [Google Scholar] [CrossRef]
- Hao, H.; Wu, D.; Lian, J.; Yang, T. Optimal coordination of building loads and energy storage for power grid and end user services. IEEE Trans. Smart Grid 2017, 9, 4335–4345. [Google Scholar] [CrossRef]
- Cheng, L.; Sun, R.; Wang, K.; Yu, F.; Huang, P.; Zhang, M. Advancing sustainable electricity markets: Evolutionary game theory as a framework for complex systems optimization and adaptive policy design. Complex Intell. Syst. 2025, 11, 320. [Google Scholar] [CrossRef]
- Jo, J.; Park, J. Demand-side management with shared energy storage system in smart grid. IEEE Trans. Smart Grid 2020, 11, 4466–4476. [Google Scholar] [CrossRef]
- Zhao, C.; Andersen, P.; Træholt, C.; Hashemi, S. Grid-connected battery energy storage system: A review on application and integration. Renew. Sustain. Energy Rev. 2023, 182, 113400. [Google Scholar] [CrossRef]
- Cheng, L.; Zhang, M.; Huang, P.; Lu, W. Game-theoretic approaches for power-generation companies’ decision-making in the emerging green certificate market. Sustainability 2025, 17, 71. [Google Scholar] [CrossRef]


| (x, y) | det(J) | tr(J) | Evolutionary Stability |
|---|---|---|---|
| (0, 0) | 3 | 4 | Evolutionarily unstable (not an ESS) |
| (0, 1) | 3 | −4 | ESS |
| (1, 0) | 12 | −7 | ESS |
| (1, 1) | 12 | 7 | Evolutionarily unstable (not an ESS) |
| (2/5, 3/7) | −6/5 | 0 | A saddle point (evolutionarily unstable) |
| Strategy Selection | The Grid Group | ||
|---|---|---|---|
| Cooperation | Non-Cooperation | ||
| The user group | Cooperation | (, ) | (, ) |
| Non-cooperation | (, ) | (, ) | |
| Parameter | Definition | Description |
|---|---|---|
| Basic revenue obtained by the grid when no renewable energy peak-shaving project is implemented (yuan) | The fundamental profit for the grid without implementing renewable energy generation and peak-shaving integration projects. | |
| Basic revenue obtained by the user when no renewable energy peak-shaving project is implemented (yuan) | The fundamental profit for users without participating in renewable energy generation and peak-shaving integration projects. | |
| Additional profit generated by the grid from adopting a cooperative strategy (yuan) | Extra profit achieved by the grid when choosing a cooperative strategy. | |
| Additional profit generated by users from adopting a cooperative strategy (yuan) | Extra profit achieved by users when choosing a cooperative strategy. | |
| Total additional profit generated by implementing a renewable energy peak-shaving project (yuan) | The cumulative additional profit achieved through implementing renewable energy peak-shaving projects with user participation. | |
| Grid’s allocation coefficient for the total additional profit | The proportion of total additional profit allocated to the grid. | |
| Price of conventional energy electricity (yuan) | The price per unit of electricity generated by conventional energy sources. | |
| Cost increment generated per unit of renewable energy consumption for users (yuan) | The additional cost incurred for users per unit of renewable energy consumption. | |
| Cost increment generated per unit of renewable energy consumption for the grid (yuan) | The additional cost incurred for the grid per unit of renewable energy consumption. | |
| Additional profit per unit of renewable electricity supply for the grid (yuan) | The extra profit achieved by the grid per unit of renewable electricity supply. | |
| Additional profit per unit of renewable electricity supply for users (yuan) | The extra profit achieved by users per unit of renewable electricity supply. | |
| Incremental power consumption for users under a cooperative strategy (MW) | The additional electricity consumption by users when adopting a cooperative strategy. | |
| Incremental power consumption for users under a non-cooperative strategy (MW) | The additional electricity consumption by users when adopting a non-cooperative strategy. |
| Equilibrium Point | det(J) | tr(J) | Evolutionary Stability Conditions |
|---|---|---|---|
| (0, 0) | |||
| (0, 1) | |||
| (1, 0) | |||
| (1, 1) | |||
| (x′, y′) | 0 | A saddle point (still evolutionarily unstable) |
| Strategy Selection | The Grid Group | ||
|---|---|---|---|
| Grid Cooperation (C) | Grid Non-Cooperation (N) | ||
| The user group | User Cooperation (C) | User payoff: Grid payoff: | User payoff: Grid payoff: |
| User Non-cooperation (N) | User payoff: Grid payoff: | User payoff: Grid payoff: | |
| Parameter | Symbol | Description | Unit | Typical Value Range |
|---|---|---|---|---|
| User’s Normal Revenue | Ru | Normal revenue of the user without participating in peak shaving. | yuan | 50–150 |
| Grid’s Normal Revenue | Rg | Normal revenue of the grid without participating in peak shaving. | yuan | 100–300 |
| User’s Additional Revenue | Su | Additional revenue for the user under cooperation, such as electricity savings. | yuan | 10–50 |
| Grid’s Additional Revenue | Sg | Additional revenue for the grid under cooperation, such as savings from reduced peak load. | yuan | 20–100 |
| User Cooperation Efficiency | UEff,u | Efficiency factor reflecting the degree of technological application and optimization by the user during cooperation. | Dimensionless | 0.5–1.5 |
| Grid Cooperation Efficiency | UEff,g | Efficiency factor reflecting the effectiveness of peak shaving measures implemented by the grid during cooperation. | Dimensionless | 0.5–1.5 |
| User Dynamic Pricing Factor | Dg | Dynamic pricing factor set by the grid, influencing the user’s revenue. | Normalized | 0–1 |
| Grid Dynamic Pricing Factor | Du | Dynamic pricing factor set by the user, influencing the grid’s revenue. | Normalized | 0–1 |
| User Dynamic Pricing Sensitivity | ku | Sensitivity coefficient representing the impact of dynamic pricing on the user’s additional revenue. | Dimensionless | 5–15 |
| Grid Dynamic Pricing Sensitivity | kg | Sensitivity coefficient representing the impact of dynamic pricing on the grid’s additional revenue. | Dimensionless | 5–15 |
| User Cooperation Cost | Cu | Cost incurred by the user for cooperation, influenced by technological investments. | yuan | 10–50 |
| Grid Cooperation Cost | Cg | Cost incurred by the grid for cooperation, influenced by technological investments. | yuan | 10–50 |
| User Technological Cost | Tu | Technological cost for the user, such as investments in smart meters and energy management systems. | yuan | 1000–10,000 |
| Grid Technological Cost | Tg | Technological cost for the grid, such as investments in peak shaving infrastructure. | yuan | 1000–10,000 |
| User Government Subsidy | USub,u | Government subsidy provided to the user for cooperation. | yuan | 5–30 |
| Grid Government Subsidy | USub,g | Government subsidy provided to the grid for cooperation. | yuan | 5–30 |
| User Subsidy Incentive | θu | Incentive effect of government subsidies on the user. | Dimensionless | 0.1–1 |
| Grid Subsidy Incentive | θg | Incentive effect of government subsidies on the grid. | Dimensionless | 0.1–1 |
| User Subsidy Sensitivity | mu | Sensitivity coefficient determining the threshold and decay rate of subsidy effects on the user. | Dimensionless | 5–15 |
| Grid Subsidy Sensitivity | mg | Sensitivity coefficient determining the threshold and decay rate of subsidy effects on the grid. | Dimensionless | 5–15 |
| External Revenue | B | Additional revenue from government or other external sources, such as returns on infrastructure investments. | yuan | 20–100 |
| External Revenue Coefficient | γ | Coefficient reflecting the contribution of external revenues to the grid’s revenue. | Dimensionless | 0.1–0.5 |
| User Penalty | Pu | Penalty or additional cost incurred by the user due to grid non-cooperation. | yuan | 10–50 |
| Grid Penalty | PPenalty,g | Penalty or additional cost incurred by the grid due to user non-cooperation. | yuan | 10–50 |
| User Penalty Sensitivity | αu | Impact coefficient determining how dynamic pricing influences the penalties faced by the user. | Dimensionless | 5–15 |
| Grid Penalty Sensitivity | αg | Impact coefficient determining how dynamic pricing influences the penalties faced by the grid. | Dimensionless | 5–15 |
Disclaimer/Publisher’s Note: The statements, opinions and data contained in all publications are solely those of the individual author(s) and contributor(s) and not of MDPI and/or the editor(s). MDPI and/or the editor(s) disclaim responsibility for any injury to people or property resulting from any ideas, methods, instructions or products referred to in the content. |
© 2025 by the authors. Licensee MDPI, Basel, Switzerland. This article is an open access article distributed under the terms and conditions of the Creative Commons Attribution (CC BY) license (https://creativecommons.org/licenses/by/4.0/).
Share and Cite
Wang, K.; Cheng, L.; Wang, R. Evolutionary Game-Theoretic Approach to Enhancing User-Grid Cooperation in Peak Shaving: Integrating Whole-Process Democracy (Deliberative Governance) in Renewable Energy Systems. Mathematics 2025, 13, 2463. https://doi.org/10.3390/math13152463
Wang K, Cheng L, Wang R. Evolutionary Game-Theoretic Approach to Enhancing User-Grid Cooperation in Peak Shaving: Integrating Whole-Process Democracy (Deliberative Governance) in Renewable Energy Systems. Mathematics. 2025; 13(15):2463. https://doi.org/10.3390/math13152463
Chicago/Turabian StyleWang, Kun, Lefeng Cheng, and Ruikun Wang. 2025. "Evolutionary Game-Theoretic Approach to Enhancing User-Grid Cooperation in Peak Shaving: Integrating Whole-Process Democracy (Deliberative Governance) in Renewable Energy Systems" Mathematics 13, no. 15: 2463. https://doi.org/10.3390/math13152463
APA StyleWang, K., Cheng, L., & Wang, R. (2025). Evolutionary Game-Theoretic Approach to Enhancing User-Grid Cooperation in Peak Shaving: Integrating Whole-Process Democracy (Deliberative Governance) in Renewable Energy Systems. Mathematics, 13(15), 2463. https://doi.org/10.3390/math13152463