1. Introduction
The emergence of credit cards in the 1960s has gradually supplanted cash and check transactions, resulting in a considerable and swift rise in both credit card users and transaction volumes, which has consequently triggered a persistent surge in credit card fraud [
1]. As a result, financial institutions are increasingly focused on identifying potential borrowers and evaluating the associated credit risks stemming from defaults [
2]. Credit card fraud refers to the unauthorized use of a credit card account that happens without the knowledge of the cardholder or the issuing institution regarding a third party engaging in such activities. Fraud perpetrators engage in various unlawful activities which involve acquiring goods or services without making a payment or improperly taking funds from the account of another person. Among these activities are several types of fraud including offline fraud, application fraud, and bankruptcy fraud [
3]. The detection and prevention of credit card fraud are vital components of the financial system because they aim to identify and stop all fraudulent transactions that can lead to significant losses for both consumers and institutions. Effective measures in fraud detection are crucial for safeguarding customer trust and ensuring the overall integrity of financial operations [
4].
Implementing effective fraud monitoring strategies is a crucial step that can significantly reduce economic losses faced by financial institutions while also greatly enhancing customer trust in their services [
5]. These strategies play a vital role in minimizing complaints by proactively addressing fraudulent activities before they escalate. Furthermore, it is essential for financial institutions to rapidly develop and implement robust credit card fraud detection systems that can swiftly identify suspicious transactions, as this will help prevent substantial financial losses associated with these fraudulent actions, which can affect both consumers and businesses. Data integration or generation involves the comprehensive process of consolidating data from various different sources in order to provide users with a coherent and unified view of the information available. Despite the extensive research that has been conducted on the integration of heterogeneous information systems across multiple domains, it remains that most commercial solutions still fall short of achieving full data integration [
6]. This persistent issue is compounded by the fact that missing data continues to represent a pervasive challenge that affects many contemporary scientific and engineering domains, resulting in significant obstacles for accurate data analysis and decision-making processes. Missing data continues to represent a pervasive and significant challenge that is prevalent across many contemporary scientific and engineering fields. The occurrence of missing data can lead to the introduction of substantial biases in the information that is processed, thereby resulting in errors during data processing and analysis. This situation ultimately diminishes overall statistical efficiency, impacting the validity and reliability of the results obtained from such analyses. It is crucial for researchers and engineers to address this challenge effectively in order to maintain the integrity of their findings and to ensure that decision-making processes are based on accurate and complete datasets [
7].
Generally, missing data is categorized into three main classifications, which include missing completely at random (MCAR), missing at random (MAR), and not missing at random (NMAR) [
8]. Under the MCAR mechanism, data absence is entirely independent of both observed and unobserved variables; thus, missing values do not depend on any specific data value within the dataset. Conversely, the missing at random (MAR) mechanism dictates that the missing data pattern relies exclusively on observed variables, indicating that the missingness can be explained by the available data. This distinction is critical for researchers to select suitable missing data handling techniques, as these choices can significantly affect analysis outcomes and research conclusions. Alternatively, NMAR suggests that the missing data is influenced not only by observed variables but also by the missing values themselves. This dependency introduces significant complexity into the analysis of data completeness, as the reasons for missingness are intrinsically linked to the unobserved data. Simultaneously, the field of credit card fraud detection has witnessed a surge in the adoption of diverse machine learning models, driven by rapid advancements in machine learning techniques. These models are trained and validated using multiple datasets, often sourced from varied origins, to enhance their generalizability and robustness. The primary objective of these techniques is to improve both the accuracy and efficiency of fraud detection systems, thereby providing enhanced support to financial institutions in their efforts to proactively prevent fraudulent transactions and mitigate financial losses. Furthermore, the deployment of these advanced machine learning systems contributes to a more secure and reliable financial ecosystem. Building upon prior studies that have employed extensive credit card datasets for model training, this work proposes integrating two distinct credit card datasets and imputing the resulting missing data to identify potential borrowers and assess their default risk. Specifically, the European Cardholders Dataset and the American Express credit dataset are utilized for data integration, missing data imputation, and subsequent training of machine learning models, as detailed in [
3,
9]. With the exponential growth of data generation and the proliferation of data sources, processing and integrating data have become increasingly challenging for businesses.
Companies face challenges that include ensuring data accuracy and timeliness, compounded by the fact that traditional data warehouse approaches can lead to data silos, thereby diminishing the overall effectiveness and benefits of data warehouses [
10]. Data holds minimal value for organizations if it cannot be effectively accessed, observed, and utilized. The data integration process facilitates the merging of information from disparate databases and sources, thereby presenting business users with a consolidated and comprehensive view of the data landscape. A robust and well-executed data integration strategy empowers companies to effectively leverage information originating from diverse sources, thereby supporting their overarching business objectives and strategic initiatives. Data integration assumes a pivotal role in contemporary business intelligence systems, impacting not only the precision and timeliness of information but also directly influencing a capacity of a company to make informed decisions in a rapidly evolving market environment. The ability to synthesize and analyze data from various sources enables organizations to respond swiftly to market trends, anticipate customer needs, and maintain a competitive edge. Ultimately, effective data integration is essential for fostering data-driven decision-making and achieving sustainable business success. For efficient business operations, companies must prioritize the design and implementation of robust data integration strategies to better support real-time decision-making processes [
11].
Integrating data from diverse business functions, including finance, manufacturing, sales, and marketing, enhances financial transparency and optimizes supply chain operational efficiency. Through comprehensive data integration, businesses can leverage customer behavior information derived from merged datasets to maximize customer satisfaction, foster customer loyalty, and enhance overall profitability [
12]. Furthermore, companies can analyze and utilize this integrated data to improve its availability, reliability, and overall quality, thereby ensuring that decision-makers have access to accurate and timely insights. By effectively integrating data assets, businesses are better positioned to leverage their information resources, sustain a competitive advantage in the marketplace, and drive innovation across the organization. This holistic approach to data management and utilization is essential for achieving long-term success and adapting to evolving market dynamics.
This article is further organized into three sections.
Section 2 details the preliminaries, focusing on the theoretical underpinnings of this study, including data balancing techniques and various machine learning algorithms previously employed in related research. This section also provides a brief overview of mode-based generative data methods and introduces a novel feature reduction approach utilizing hypothesis testing. The performance of the mode-based generative data method is evaluated using hypothesis testing at different confidence levels.
Section 3 presents the experimental results, comparing several machine learning algorithms and feature reduction methods with the mode imputation technique. Finally,
Section 4 summarizes the performance comparisons with statistical data generation methods.
2. Preliminaries
The experiments utilizes two publicly available credit card datasets selected from Kaggle. The first selected dataset is the European credit cardholders dataset, which includes 284,807 non-fraud transactions and 492 fraud transactions (i.e.,
out of the total samples) and contains 30 features. The second selected dataset is the American Express credit dataset, which contains 42,579 non-fraud transactions and 2949 fraud transactions (i.e.,
out of the total samples) and includes 18 features [
13]. These two publicly available datasets have been extensively utilized in related research studies [
14,
15,
16]. During the merging process, all features from the European dataset were retained, while two irrelevant features from the American Express dataset were removed.
2.1. Data Set
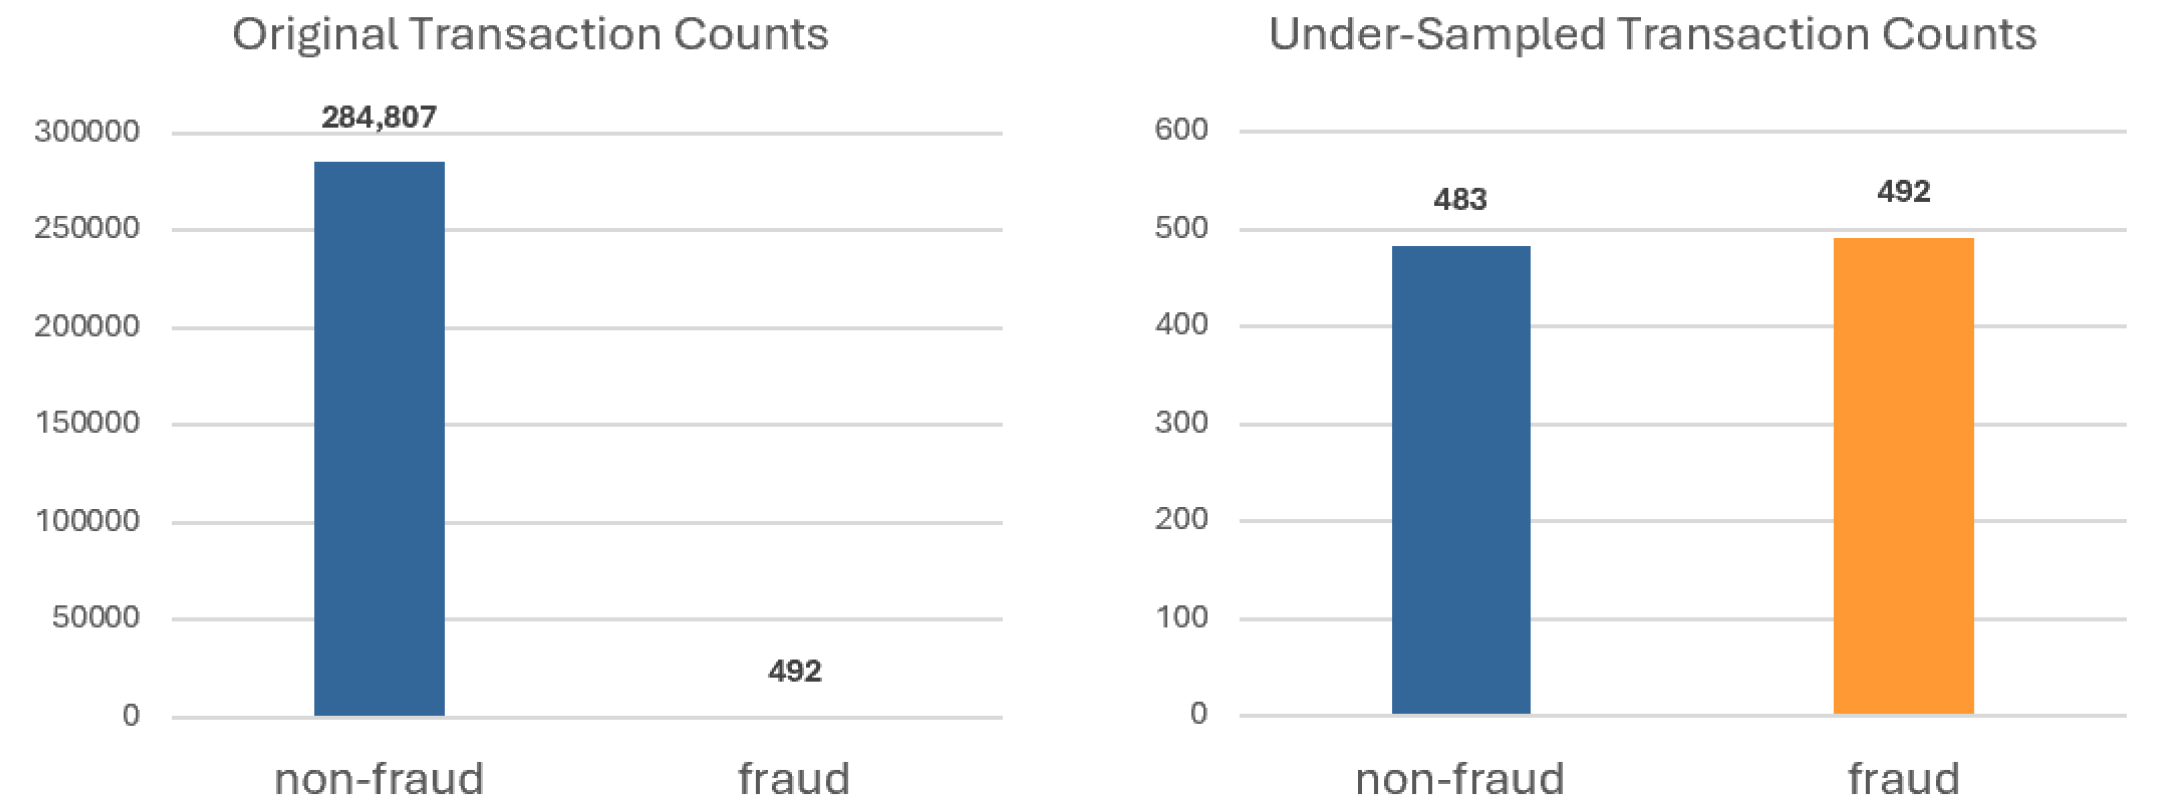
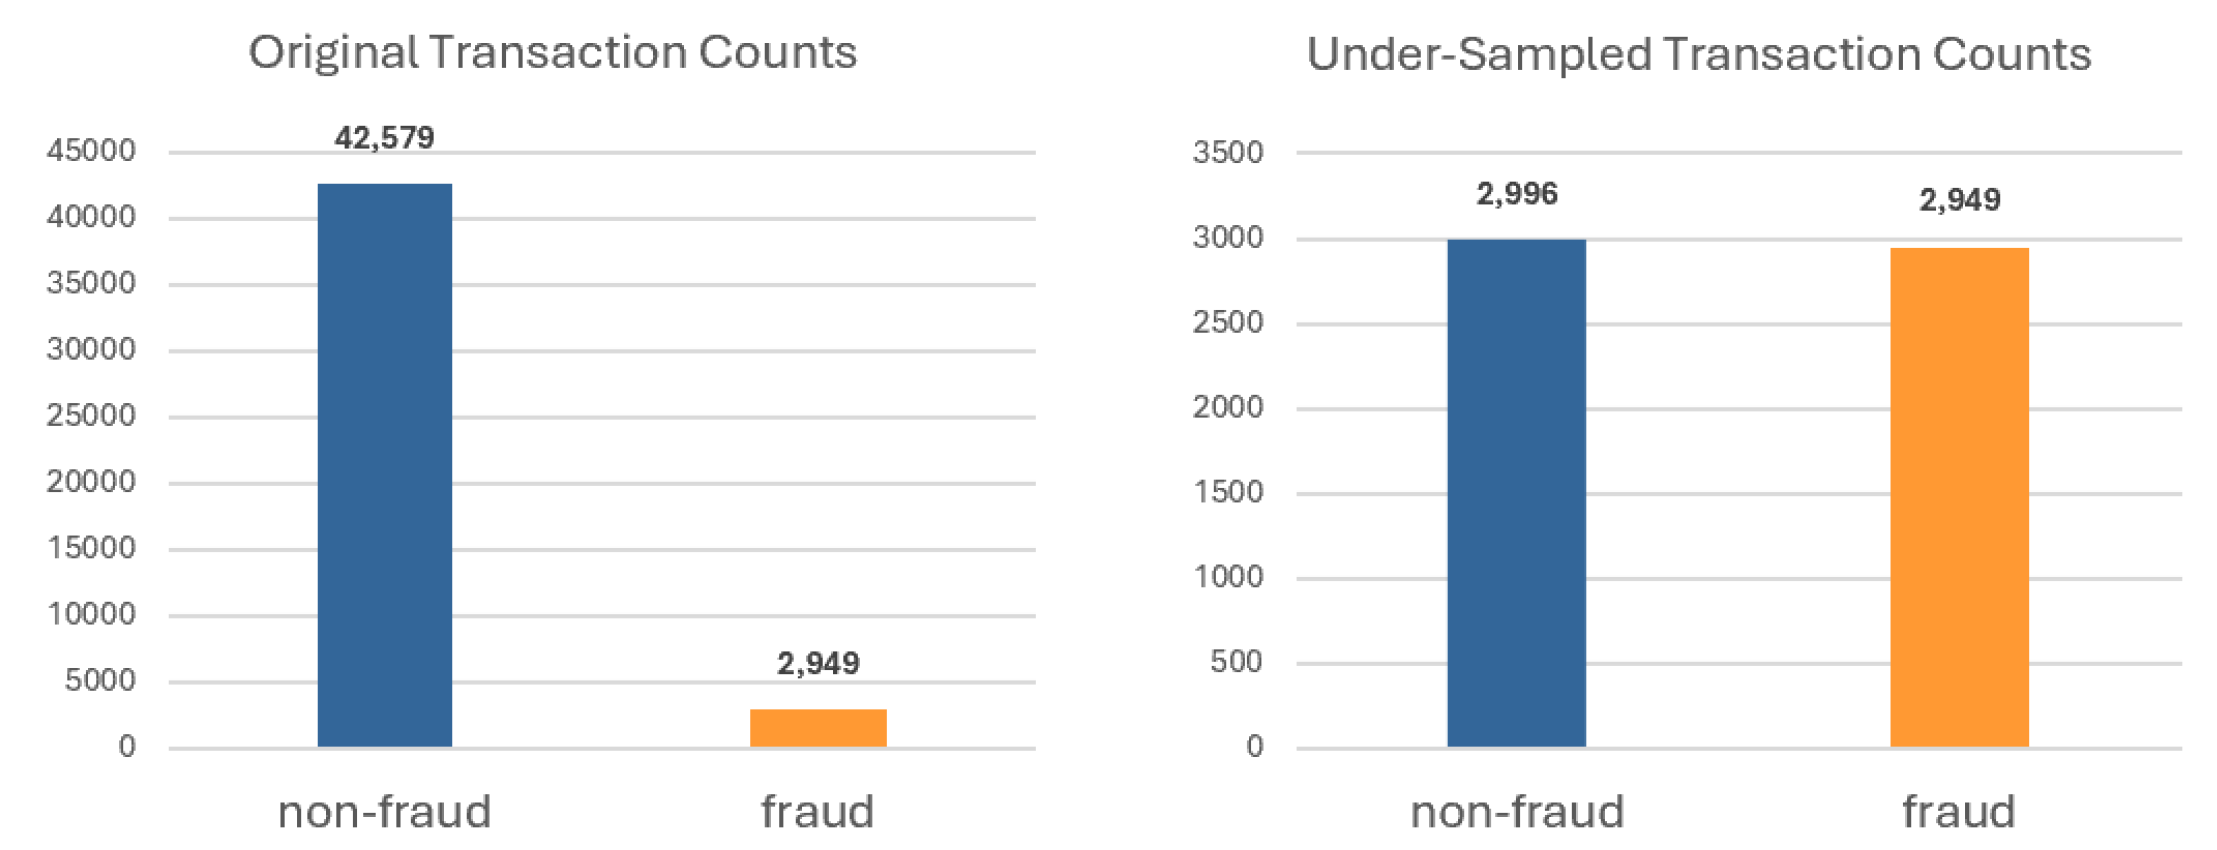
The resampling strategy includes both over-sampling and under-sampling techniques, which are commonly employed to address data imbalance issues. Over-sampling through the duplication of minority class samples may lead to overfitting or exacerbate the noise inherent in the dataset [
4]. Under-sampling is a technique used to reduce the computational load in order to enhance efficiency. This method can be implemented by either randomly removing samples from the majority class or substituting samples with cluster centroids obtained from a subset of the dataset [
4,
17]. In this study, we employed random under-sampling techniques on both datasets to mitigate the prevalence of non-fraud samples, with the objective of achieving a nearly equal distribution between fraud and non-fraud classes, each constituting approximately 50%. Utilizing the random under-sampling approach, the European credit cardholders dataset was adjusted to contain 483 non-fraud transactions and 492 fraud transactions (see
Figure 1), whereas the American Express credit dataset was modified to include 2966 non-fraud transactions and 2949 fraud transactions (see
Figure 2).
These two selected datasets have been divided into training and testing subsets to train and evaluate various machine learning models.
Table 1 presents detailed information on the training and testing datasets for European credit cardholders, including the respective counts for non-fraud and fraud cases. Additionally, it provides the values for both the training and testing datasets of the American Express credit dataset.
Although reducing data samples may negatively impact key performance indicators, such as accuracy, precision, recall, and so on, it is essential to recognize that imbalanced training datasets can result in bias within machine learning algorithms. Therefore, it is imperative to address the issue of imbalance in training datasets to develop robust machine learning systems. In the subsequent phase of our research, we will utilize various machine learning models to train the categorized dataset. These algorithms will be trained on a balanced classification dataset to ensure adequate representation of all classes. This balanced approach is crucial for enhancing the performance and reliability of the models in predictive tasks.
2.2. Hypothesis Testing
The fundamental principle of a statistical hypothesis test is to determine whether a given data sample is typical or atypical in relation to a specified population, under the assumption that a formulated hypothesis about that population is valid [
19]. In scenarios where the sample size is sufficiently large (typically
), the population standard deviation
is known, and the underlying data distribution can be assumed to be normal, a Z-test is appropriate. The Z-test facilitates the evaluation of whether the sample mean significantly differs from the hypothesized population mean, thereby providing insights into the validity of the null hypothesis within the context of the study.
In this study, we employed a two-tailed Z-test to assess whether the sample mean significantly differs from the hypothesized population mean. This approach allows us to evaluate deviations in both directions, providing a comprehensive analysis of potential differences. The two-tailed Z-test is utilized to compare the means of two independent samples. The procedure commences with the formulation of hypotheses. The null hypothesis
asserts that there is no significant difference between the two population means, which is mathematically expressed as follows [
20]:
and, alternatively, the hypothesis
indicates the presence of a significant difference between the two population means, which can be described as follows:
and the test statistic
Z can be calculated as follows:
by using an alternative form of the Z-test formula where
and
denote the sample means of the first and second groups, respectively;
and
are the population standard deviations; while
and
represent the sample sizes. The numerator reflects the difference between the sample means, and the denominator computes the standard error associated with this difference, incorporating the variances of both populations and their sample sizes. Following this computation, the critical value is established based on a predetermined significance level
, typically set at
,
, or
. This critical value is derived from the standard normal distribution table corresponding to the chosen
. For two-tailed tests, it is denoted as
. If the absolute value of the computed
Z exceeds the critical value (i.e.,
), the null hypothesis is rejected. Conversely, if
is less than or equal to the critical value, the null hypothesis is not rejected.
2.3. Mode-Based Generative Data
Mode-based generative data, also known as mode-based data imputation, replaces missing values with the mode, defined as the most frequent value in a variable. This method is a commonly employed technique for addressing missing data [
21]. Identifying the mode in this process typically involves utilizing a histogram distribution. A systematic approach to mode imputation, where missing values are replaced with the mode of variables, is presented as a method for handling missing data resulting from merging two datasets. This method proves particularly effective for categorical data by preserving distribution characteristics and maintaining consistency, especially when repeated values are prominent. The process of merging two datasets and performing imputation to generate a complete dataset is illustrated in
Figure 3.
The process of mode imputation is analyzed and documented here through a series of mathematical formulas. Let
be the dataset with missing values. Construct a histogram to visualize the frequency distribution of the observed values in
. The histogram will categorize the data into bins. For each bin
, calculate the frequency
which is of the count of values in bin. The highest frequency of the bin
can be found as follows:
where
is the set of the histogram bins and
is the frequency of the bin
b. The mean for the value set
falling within the bin
can be determined as follows:
The mode-based generative set
which imputes the missing dataset from the dataset
can be determined as follows:
and the complete dataset
can be found as follows:
which includes all original and imputed values. The above process effectively imputes missing values using the mode determined from the histogram of the dataset, thereby enhancing the integrity of the data for further analysis. For each feature within the merged dataset, imputed values were derived from the same data source, thereby ensuring consistent units post-imputation. Subsequently, non-numeric data underwent label encoding during the preprocessing stage. The European dataset comprises exclusively numeric data, whereas the American Express dataset includes four non-numeric features; label encoding was applied to these, as detailed in
Table 2. Prior to model training,
StandardScaler was systematically deployed for comprehensive data standardization [
22]. This essential preprocessing step normalized the features, a measure instrumental in mitigating the influence of varying data scales and thereby ensuring a substantial enhancement in the overall predictive capabilities of the model [
23].
2.4. Preliminary Performance Comparison for Various ML Models
For model training and analysis, six notable machine learning models, including both traditional and deep learning approaches, have been chosen. The traditional models incorporate ensemble-based learning techniques. Notably, four of these selected machine learning algorithms have been previously applied to the same dataset, as documented in prior research [
24,
25,
26,
27]. The following machine learning models are employed in this research:
Artificial Neural Networks (ANNs) [
28] are mathematical models that emulate the functioning of the biological brain. They consist of interconnected artificial neurons that process input data through a series of weighted sums and nonlinear decision functions. ANNs are typically organized into layers: an input layer that receives external data, one or more hidden layers that facilitate nonlinear modeling by processing signals between neurons, and an output layer that generates final responses.
Convolutional Neural Network (CNN) [
26] represent a deep learning methodology extensively utilized across various domains, including image processing, natural language processing, audio analysis, and time series data. The CNN architecture comprises six distinct layers: the input layer, convolutional layer, pooling layer, fully connected layer, SoftMax/Logic layer, and output layer. Notably, the hidden layers, which share a common structural framework, can accommodate varying numbers of channels within each layer.
Gradient Boosted Decision Tree (GBDT) [
25] is an ensemble learning algorithm that constructs a powerful predictive model by iteratively training a series of decision trees. In prior research, GBDT has also been employed as a base learner for fixed-size decision trees, effectively addressing the challenges associated with limited tree depth caused by exponential growth.
K-Nearest Neighbor (KNN) [
26] constructs the classifier function by performing voting among its local neighboring data points [
27,
29,
30]. The user specifies the number of neighbors, denoted as k, and the initial selection of neighboring points is made randomly. However, this selection can be refined through iterative evaluation.
Long Short-Term Memory (LSTM) [
31] networks represent an advanced class of recurrent neural networks designed to retain sequential data over time. They incorporate gates and a memory cell that capture and store historical trends. Each LSTM consists of multiple cells functioning as modules, where data is conveyed along a transport line from one cell to another. This architecture enables LSTMs to effectively manage long-range dependencies in sequential data.
Support Vector Machines (SVMs) [
27] are employed for both classification and regression tasks and are widely recognized for their capacity to delineate optimal decision boundaries between distinct class distributions. However, SVMs tend to demonstrate suboptimal performance when confronted with datasets characterized by imbalanced class distributions, the presence of noise, and the overlap of class samples.
The analysis allows for a detailed comparison of the four evaluation metrics—accuracy, precision, recall, and F1-score—in relation to their respective training times. The following tables present the performance and records of two separate datasets across six algorithms, enabling a better observation and comparison of the effectiveness of merged imputed datasets in further experiments.
Table 3 illustrates the performance results of the European cardholders dataset, utilizing the six methodologies previously discussed. The results show that the accuracy ranged from 90% to 94%, with SVM achieving the highest accuracy of 93.91%. All methods executed their processes in under 10 s.
The American Express credit dataset performance results are detailed in
Table 4. GBDT achieved the highest accuracy at 97.43%, while other methods ranged from 95% to 98% accuracy. KNN showed the lowest accuracy at 90.60%, alongside the shortest execution time, approaching 0 s. In contrast, CNN exhibited the longest average execution time, approximately 100 s.
3. Experiment Results
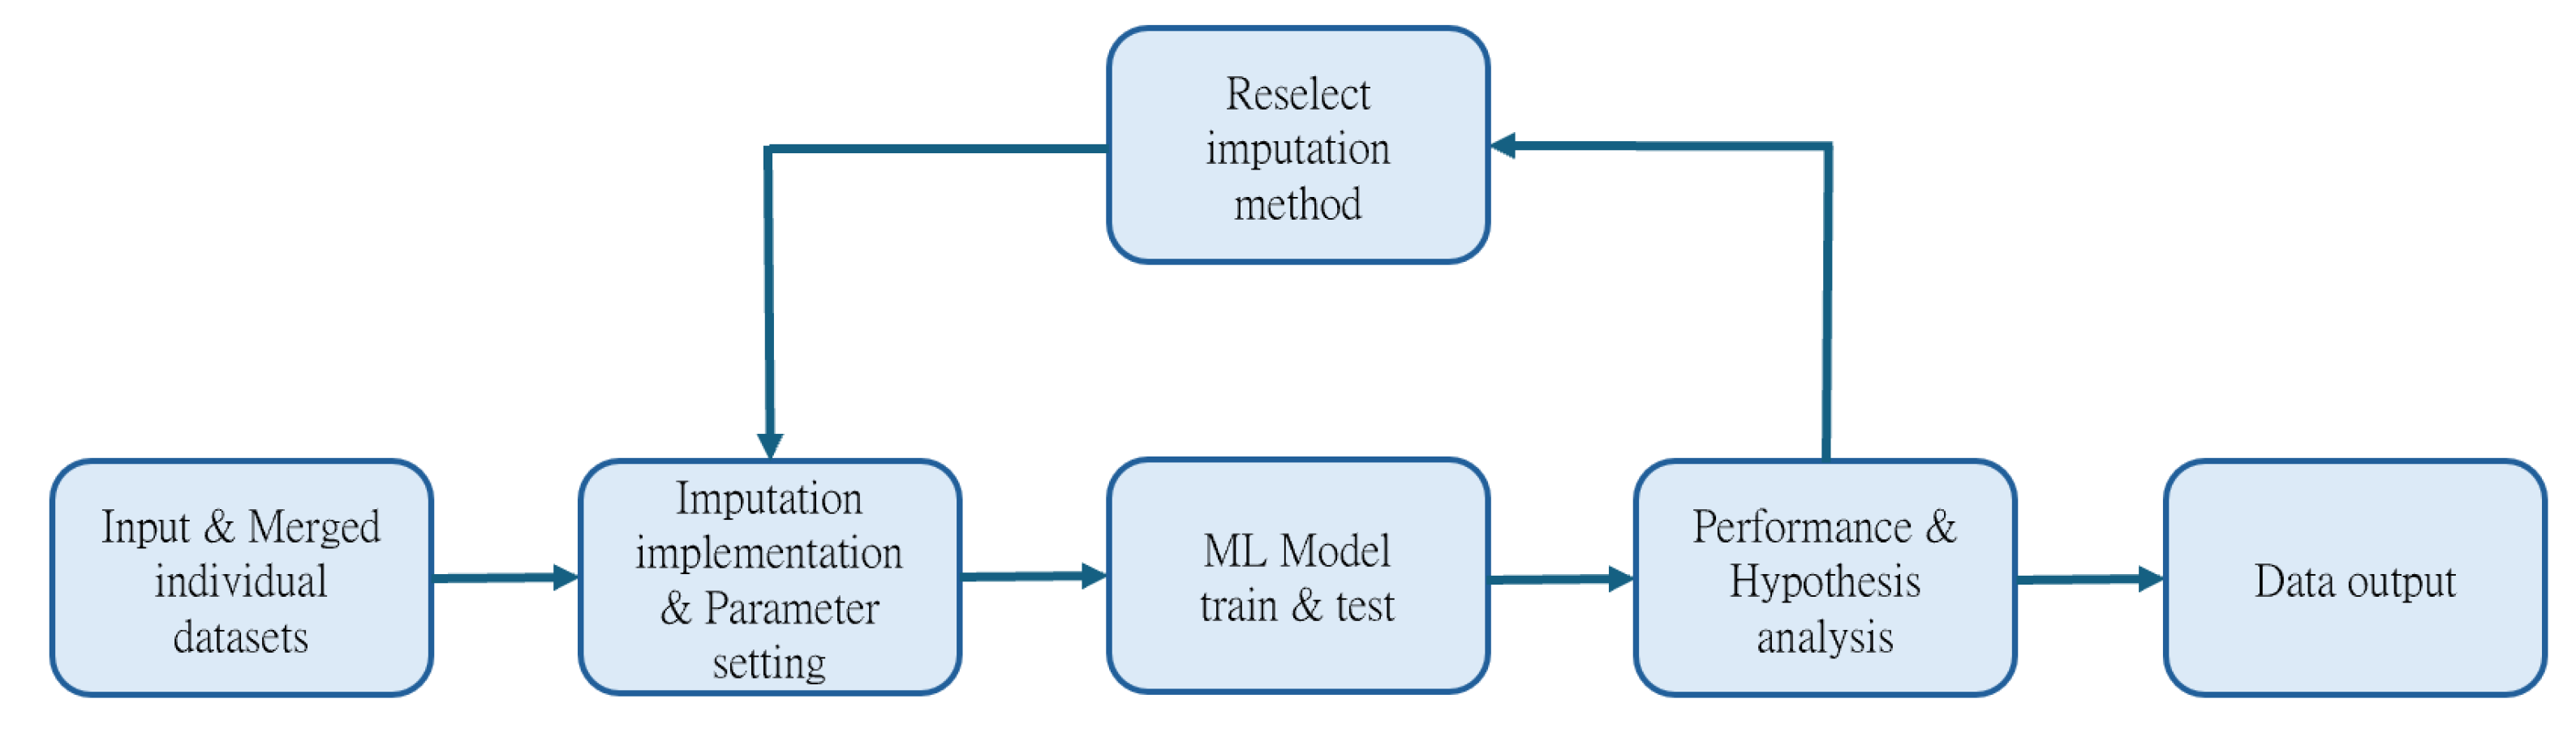
This section employed various statistical methods for imputation and compared their performance outcomes. Mode imputation achieved the highest accuracy among the numerous machine learning algorithms evaluated, with the GBDT algorithm demonstrating the highest accuracy across all results. Consequently, mode imputation was selected as the optimal method for subsequent data imputation in this research. Given that this study combined two entirely distinct features from credit card datasets, the proportion of missing values reached 50% after merging. The imputed values for different features were calculated using the corresponding histograms to determine the mode values, and subsequent imputation was performed on the relevant features. The entire data imputation technique is depicted in
Figure 4.
Initially, the two datasets intended for merging are input. Next, the chosen imputation method is applied to fill in the missing values in the merged dataset, resulting in a complete dataset without any gaps. Following this, model training and prediction are conducted, with the predicted results analyzed through performance evaluation and hypothesis testing. Finally, if the analysis indicates that the performance of the merged dataset is similar to or significantly improved compared to the original dataset, the results and model will be output. Otherwise, the imputation method will be reselected, and relevant parameters will be adjusted to retrain the model.
3.1. Result of the Mode-Based Imputation
A test dataset comprising 46 features and 1316 data samples has been used to perform a performance analysis, and the resulting data was subsequently applied in the hypothesis testing phase. The performance results of the mode-based imputation method are presented in
Table 5.
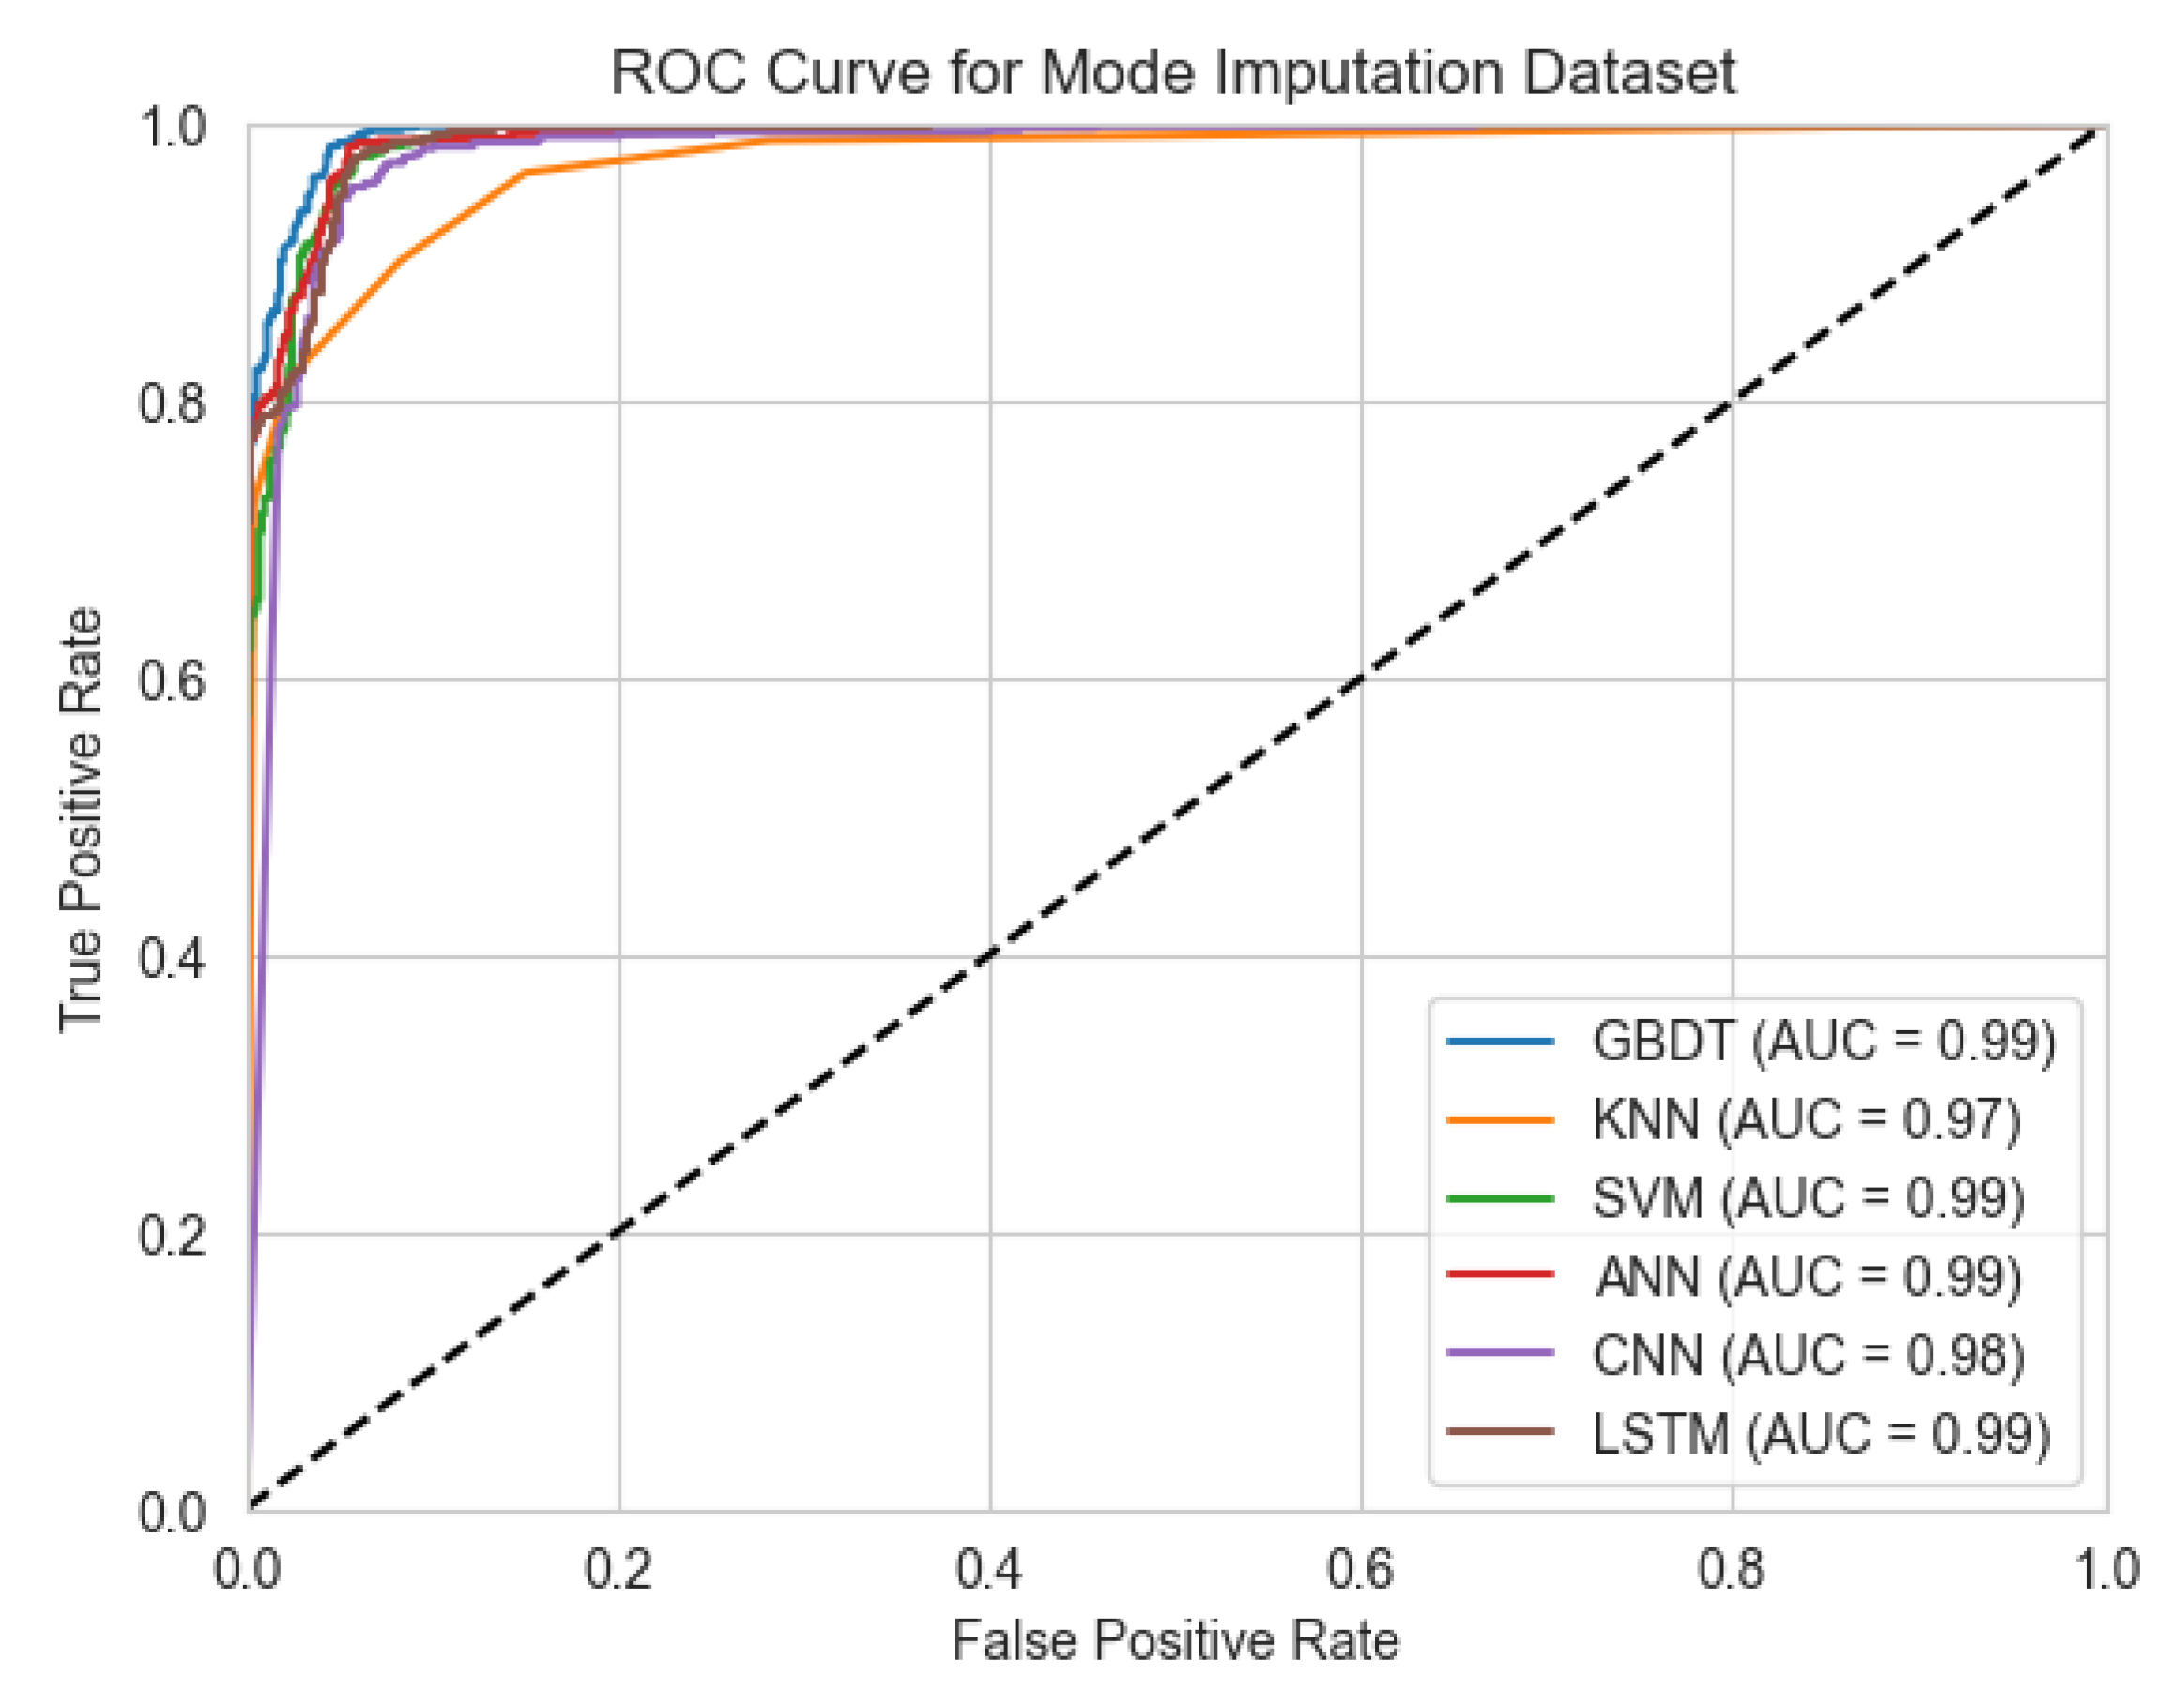
It is evident that all key evaluation metrics—including accuracy, precision, and recall—exceed 90%, with F1-score values spanning from 0.90 to 0.97. KNN achieves the lowest metrics at approximately 90.90%, while the other algorithms all exceed 94%. Importantly, GBDT achieved the highest accuracy, precision, and recall, with values of 96.92%, 96.95%, and 96.93%, respectively, and an F1-score of 0.97. Overall, the results from the merged dataset demonstrate stability and reliability, indicating that the imputation process was successful in enhancing data quality. In terms of runtime, although CNN took twice as long to run compared to the time required for the American Express credit dataset, this increase can be attributed to the larger number of parameters involved. In contrast, the runtimes for all other algorithms showed no substantial change. This suggests that despite a 50% increase in data volume, our mode-based imputation model maintained efficient runtime performance, reflecting its effectiveness in handling larger datasets. The performance evaluation of the merged dataset revealed outstanding results from various models in both Receiver Operating Characteristic Area Under Curve (ROC-AUC) and Precision–Recall Curve (PR-AUC) metrics [
32,
33]. Specifically, GBDT, SVM, CNN, and LSTM consistently achieved ROC-AUC values of 0.99 (see
Figure 5), evidencing their high discriminatory capability in differentiating positive from negative samples and capturing complex data patterns. KNN also performed effectively, attaining a ROC-AUC value of 0.97, reflecting strong classification performance.
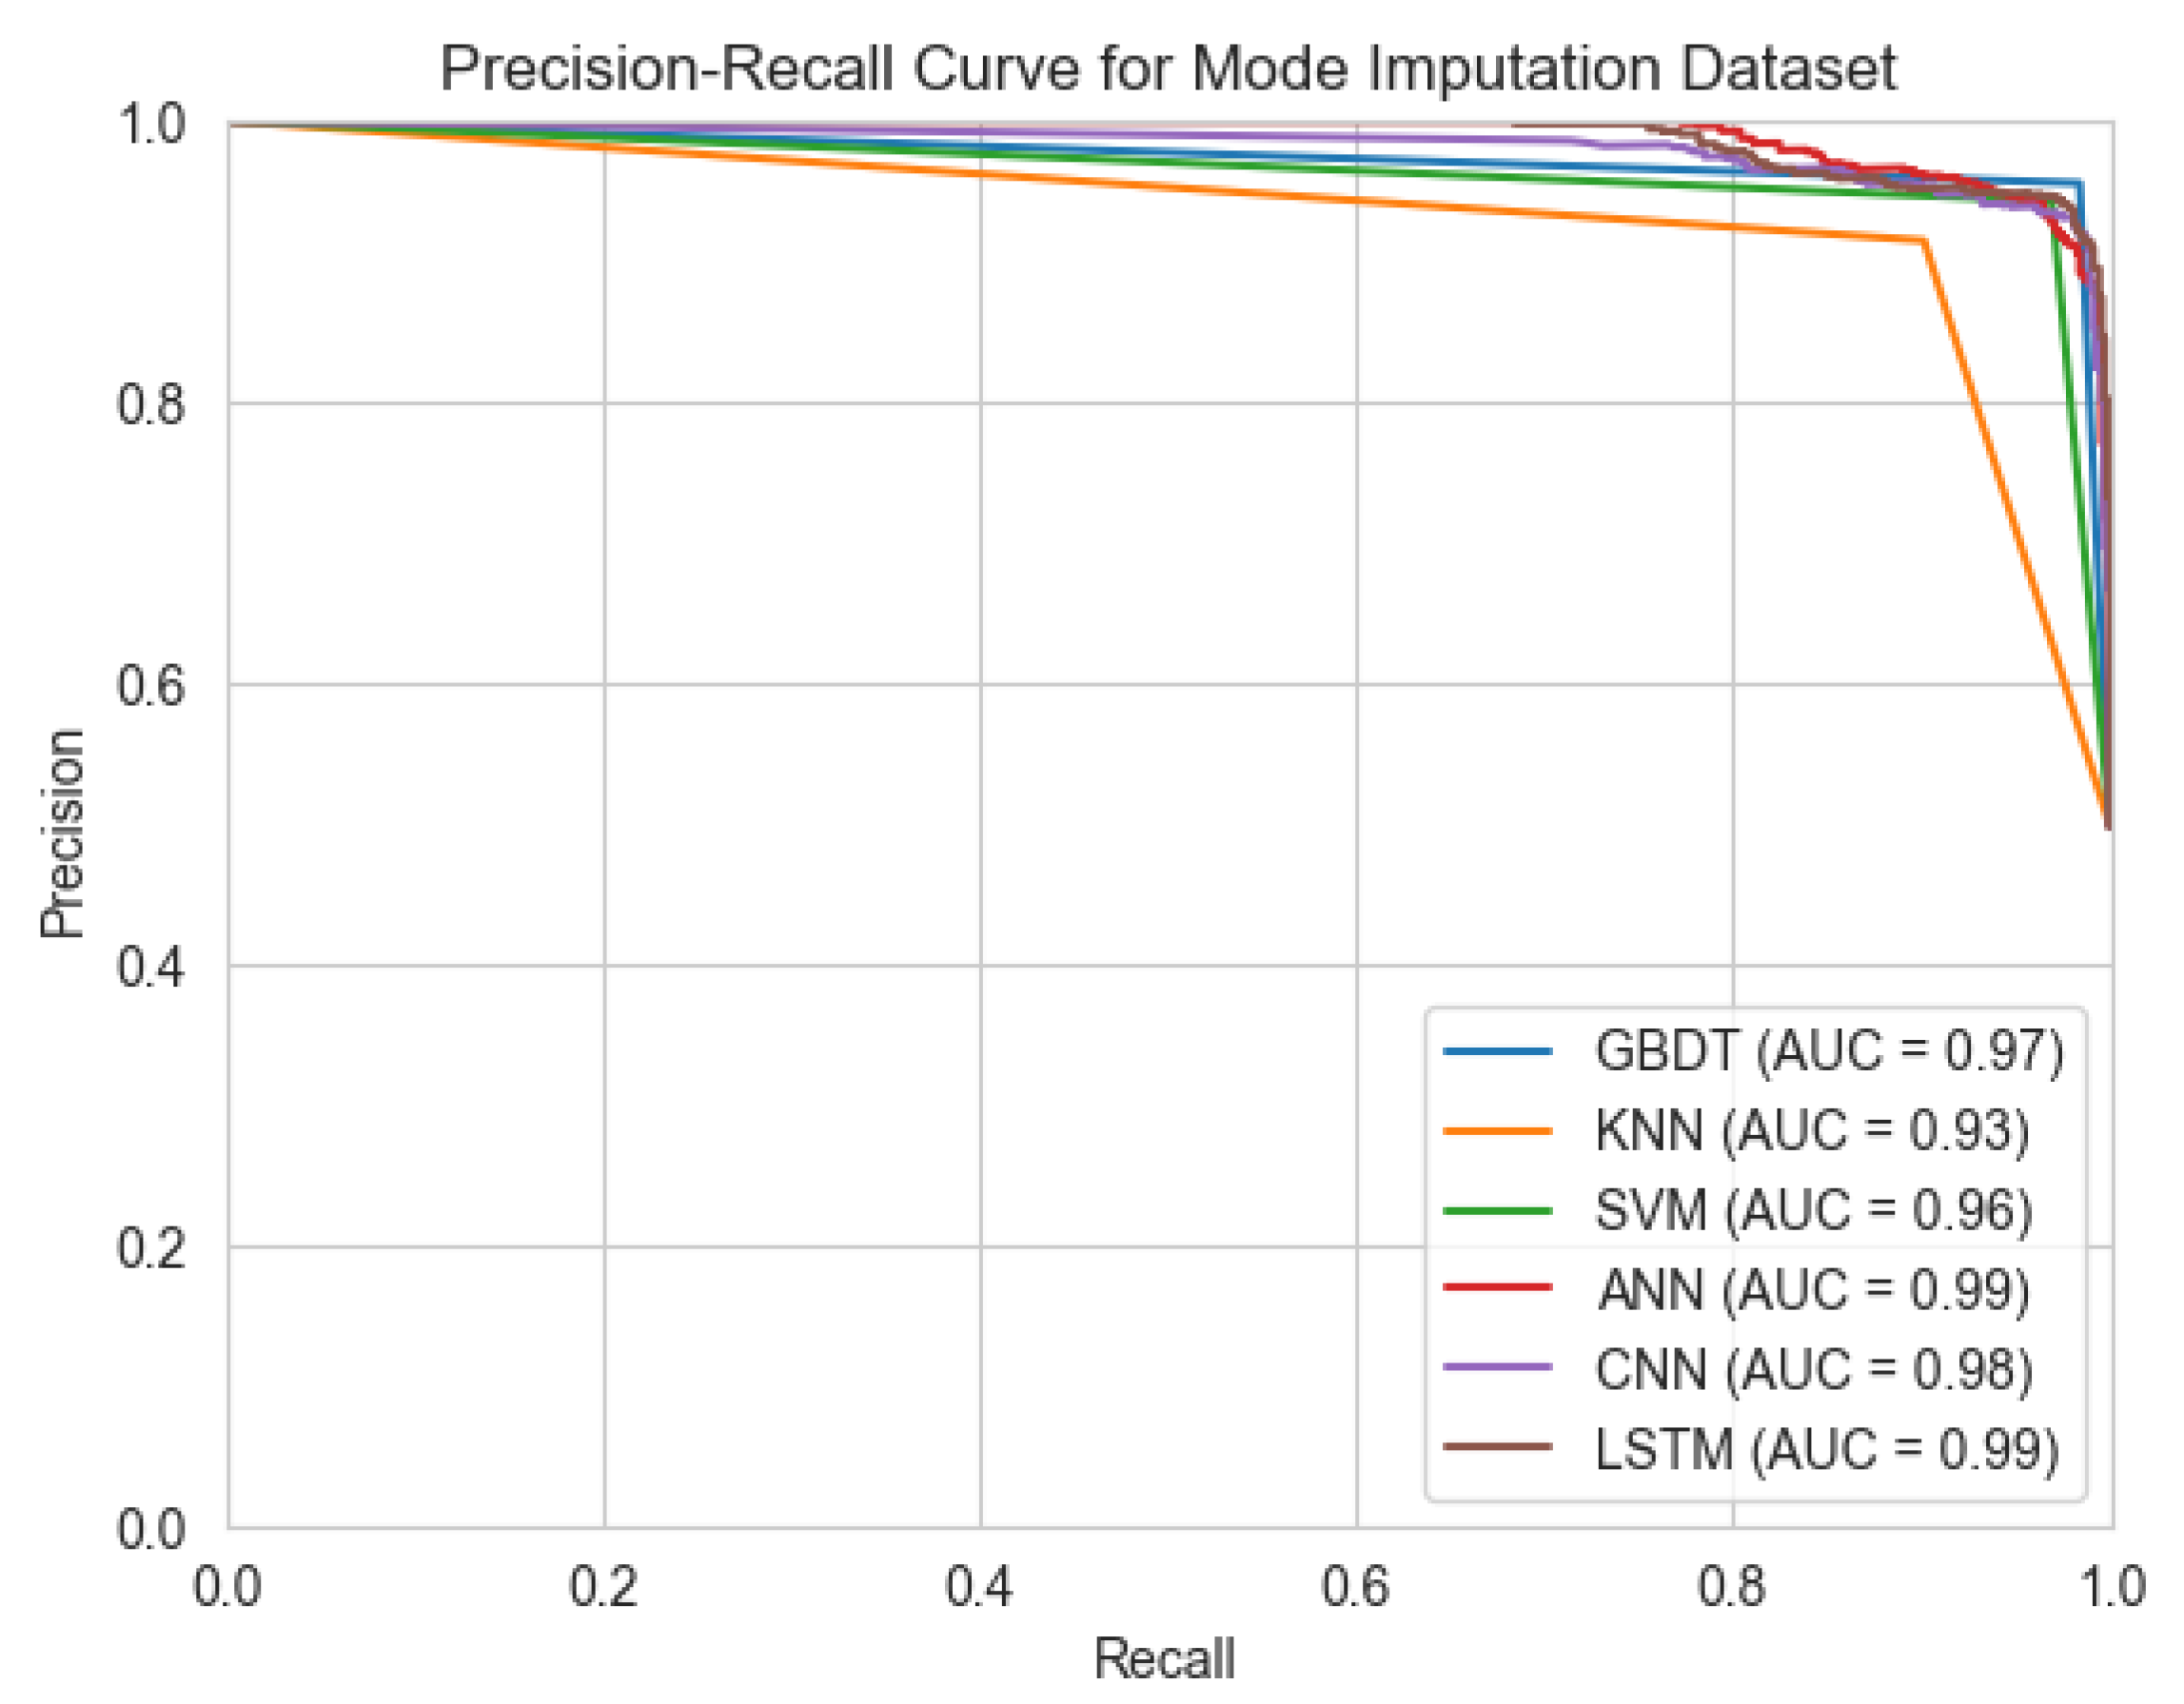
Regarding PR-AUC, the assessed models (e.g., GBDT, SVM, CNN, and LSTM) consistently demonstrated robust performance, with values spanning from 0.96 to 0.99 (as depicted in
Figure 6). This range definitively reinforces their notable efficacy in adeptly managing and predicting outcomes within inherently imbalanced datasets, a critical consideration in real-world applications. While the PR-AUC for KNN registered a slightly reduced value of 0.93, this metric remains within an acceptable and practically viable operational spectrum for classification tasks.
The outcomes demonstrate that models from the merged dataset exhibit strong overall accuracy and offer considerable benefits in addressing imbalanced datasets.
3.2. Hypothesis Testing Results
To evaluate the effectiveness of the merged dataset, we employed hypothesis testing. This method systematically evaluates whether the data support a specific hypothesis, allowing for informed conclusions. We used varying significance levels to compare the merged dataset with the original dataset. Compared to the American Express dataset, there is a slight decline in performance. To confirm that the merged dataset is not significantly different from the American Express dataset, we set a significance level of 0.1, which means we are lowering the threshold for rejecting the null hypothesis
. We reject
when the
p-value is less than 0.1.
Table 6 presents the accuracy results of the American Express dataset compared to the merged and imputed dataset. The accuracies of KNN and SVM showed slight improvements, whereas GBDT, ANN, and LSTM experienced minor declines, all of which were less than 1%. However, CNN exhibited a decrease of 1.17%. In the hypothesis testing conducted at
= 0.1, which indicates 90% of the confident level, all models showed non-significant changes except for CNN, which demonstrated a significant decline. Therefore, while the null hypothesis
is not accepted for CNN, it is accepted for the remaining algorithms.
To validate the effectiveness of the comparison between the merged dataset and the European dataset, we employed a significance level of 0.01 during hypothesis testing. This was done to confirm that the overall performance of the merged dataset significantly improved compared to the European dataset. This approach ensured that the
value was set at a high standard, allowing us to identify strong evidence that supports the observed effect as statistically significant. Specifically, we reject the null hypothesis
when the
p-value is less than
, thereby accepting the alternative hypothesis
, which indicates that the performance of the merged dataset is indeed significantly better than that of the European dataset.
Table 7 presents the accuracy of the European dataset in comparison to the merged and imputed dataset. The results were evaluated using the hypothesis testing method, which revealed a significant overall improvement in accuracy for the merged dataset. Specifically, the accuracies of GBDT, SVM, ANN, CNN, and LSTM increased by 4.53%, 1.61%, 5.83%, 4.08%, and 1.75%, respectively. In the hypothesis testing conducted at
= 0.01, which indicates 99% of the confident level, all these models demonstrated significant improvements, leading to the acceptance of the alternative hypothesis
. However, KNN experienced a slight decline that was not statistically significant, resulting in the rejection of the alternative hypothesis
. This indicates that the observed data from the merged dataset shows a statistically significant improvement in accuracy compared to the null hypothesis for the European dataset.
The adoption of a stricter significance level (i.e.,
) and a stricter similarity threshold (i.e.,
) for hypothesis testing in this study is supported by several considerations. A primary reason is the critical need to minimize Type I errors, especially pertinent in credit risk assessments where falsely rejecting a valid null hypothesis could lead to unwarranted risks and flawed conclusions. A more stringent significance level thus bolsters the findings’ robustness. Furthermore, employing the stricter significance enhances the research outcomes’ credibility, implying that the null hypothesis is rejected only with substantial supporting evidence. The use of the stricter significance is also common in diverse financial evaluations, notably in models demanding high precision to curtail erroneous conclusions [
34,
35].
3.3. Advanced Data-Generative Machine Learning System
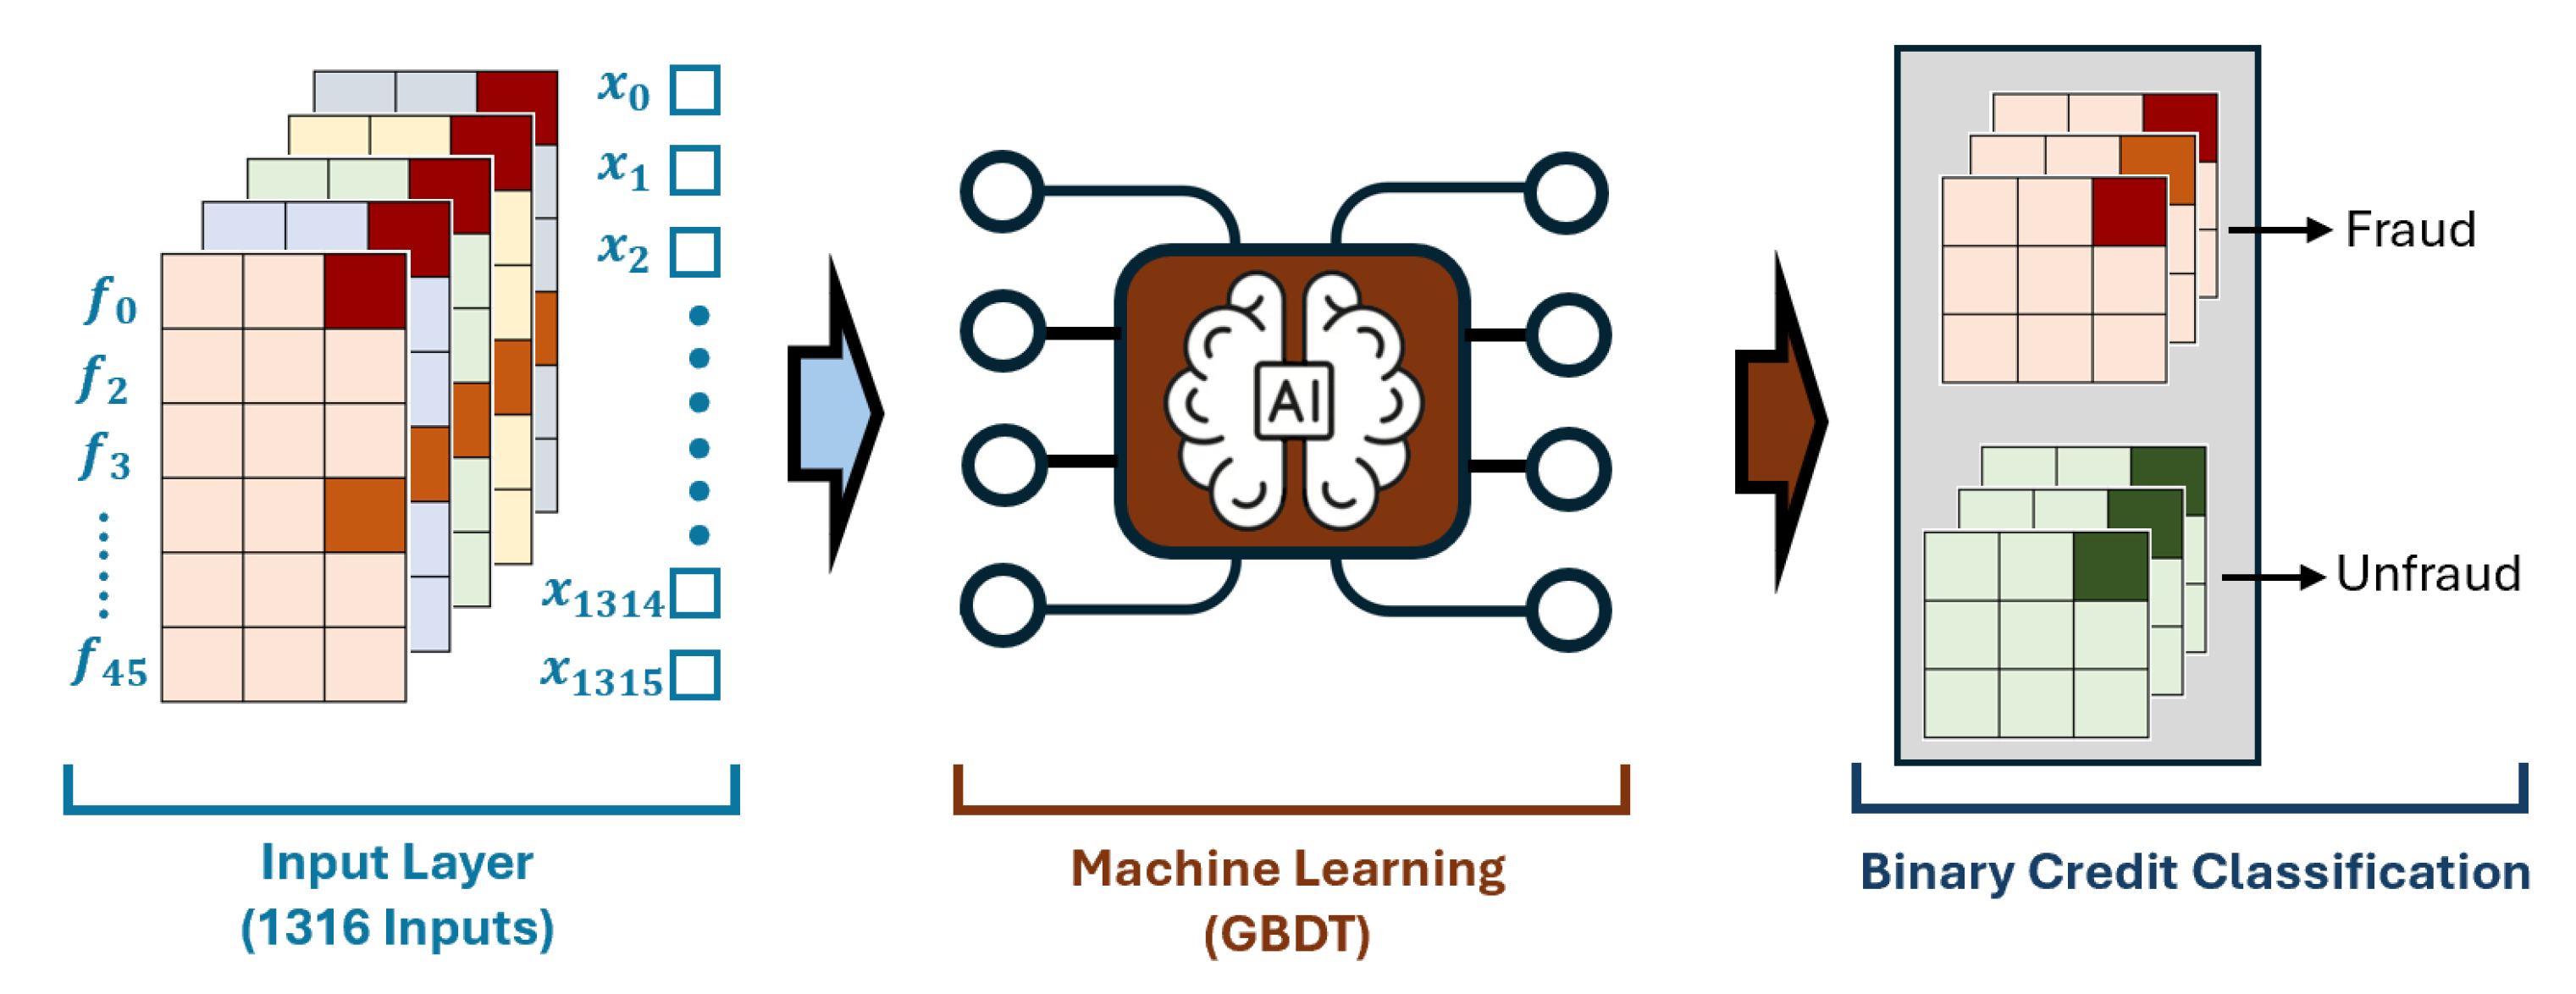
In comparison to the original dataset, the merged dataset exhibited consistent performance when evaluated against the American Express dataset, while showing notable improvement relative to the European dataset. This observation not only affirms the efficacy of mode imputation within the experiments but also underscores the success achieved through merging two distinctly different feature datasets. The study employed a merged dataset comprised of 1316 transactions (i.e.,
), which integrated a total of 46 features (i.e.,
). This comprehensive approach facilitates enhanced data quality, thereby supporting more robust analysis and model training outcomes. The process of mode imputation in the context of merging two datasets for enhancing data integrity has been illustrated on
Figure 7.
It showcases how missing values arising from the integration of disparate datasets are systematically filled using the mode, which is the most frequently occurring value in a given data set. This technique is especially beneficial for handling categorical data, as it retains the underlying distribution characteristics and aids in maintaining consistency within the dataset. The figure likely depicts a histogram to visualize the frequency distribution of observed values, identifying the mode effectively. By employing this method, the research aims to create a complete dataset that can be utilized for further analysis, including training models to detect credit card fraud. Ultimately, mode imputation contributes to improving the performance and reliability of machine learning algorithms in fraud detection while ensuring a robust dataset for accurate predictions. All missing values resulting from the merging process were effectively imputed using mode-based data generation. Following the evaluation of model training performance, the GBDT model, which demonstrated the highest accuracy, was chosen for training and prediction. This model successfully identified high-risk transactions among users and generated binary classification outputs, facilitating more accurate risk assessments in financial contexts.


