1. Introduction
The need for composite laminates has gradually increased in the automotive, aerospace, naval, and energy fields due to their unique properties, such as high specific strength, high toughness, high flexibility, and low density [
1,
2]. Composite materials are prone to intricate flaws during manufacturing and assembly processes. Moreover, they are subjected to harsh environmental conditions and various cyclic loadings, which adversely affect their performance and can lead to structural integrity failure [
3,
4]. To detect flaws in composite materials, nondestructive testing using ultrasonic guided waves, also known as Lamb waves, has been used in the past decades because of their ability to propagate over long distances with minimal attenuation, a larger inspection range, and high sensitivity to small damages [
5].
The basic principle of NDT-based structural health monitoring (SHM) is to assess the condition of a structure by collecting signal responses from multiple sensor networks, analyzing them, and determining whether the structure is healthy or damaged, using either a physics-based (model-driven) or data-driven approach. Physics-based models typically rely on mathematical formulations and physical principles to define structural characteristics and predict damage. However, owing to their computational intensity, reliance on accurate material properties and boundary conditions, and limited adaptability to real-world uncertainties, the quantitative analysis of the physical behavior of guided waves remains challenging [
6]. On the contrary, data-driven approaches utilize machine learning and artificial intelligence to learn complex patterns from collected time-series data without requiring expert knowledge or exact structural information [
2,
7]. Supervised data-driven approaches have been extensively used for Lamb wave-based damage detection in SHM, achieving good performance for both image and time-series datasets. However, supervised learning relies on labeled data from both healthy and damaged states of a structure, which can be time-consuming, labor-intensive, and sometimes impractical to obtain in real-life scenarios. To tackle this problem, unsupervised approaches have been successful in detecting abnormalities at an early stage before catastrophic failure occurs. Unsupervised anomaly detection for SHM does not require damaged data to train the model. Instead, the model only requires normal data, and it solely uses a small portion of the damaged data for testing [
8]. Khan et al. [
9] proposed the processing of guided waves using a sparse autoencoder to extract unsupervised autonomous damage features. The unsupervised features, when applied in supervised learning, demonstrated that the sparse autoencoder (SAE) could distinguish between pristine and damaged conditions with 99% accuracy. Abbassi et al. [
10] evaluated four unsupervised dimensionality reduction methods (PCA, KPCA, t-SNE, and AE) for detecting and localizing damage under varying temperature conditions. Through the dimensionality reduction strategy, the AE outperformed the other models in detecting and localizing damage, whereas the others succeeded in detecting damage at low temperatures. Additionally, using the strategy involving the Q and T
2 indices, all the methods successfully detected damage across all temperature ranges. The effectiveness of the unsupervised autoencoder was also highlighted in [
11], as it eliminated the use of labeled data by proposing a CNN autoencoder for damage localization. They validated their method using numerical and experimental datasets. The proposed method demonstrated excellent results compared to the tomography method.
Guided-wave-based SHM presents significant complexities and heterogeneity, which primarily affect models’ ability to extract meaningful features. To address this challenge, various deep learning models have been proposed for feature differentiation; however, these approaches require a substantial number of learning parameters in addition to the computational complexity of the task. Sawant et al. [
4] utilized raw Lamb wave time-series data to identify and localize damage through unsupervised transfer learning using a convolutional autoencoder (TL-CAE). The proposed unsupervised model outperformed its supervised counterpart trained on the same dataset. In SHM, gathering a sufficient dataset to train deep learning models can be challenging, costly, and time-consuming, particularly for damage-related data. To minimize the negative impact of an imbalanced dataset on anomaly detection, Zhao et al. [
12] proposed an SGAD-GAN model to perform data augmentation and anomaly detection simultaneously. The issue of data scarcity in SHM was also addressed by Furkan et al. [
13] by employing a generative adversarial network with a gradient penalty to generate synthetic labeled acceleration data. The data generated were augmented using varying ratios and were used to train a 1D-CNN. Training GANs is not an effortless task, and it often produces misleading samples or fails to capture the important patterns in the signals. To identify and filter such low-quality samples, different clustering-based techniques have been employed, including DBSCAN [
14], K-means [
15], and discriminative fuzzy K-means [
16].
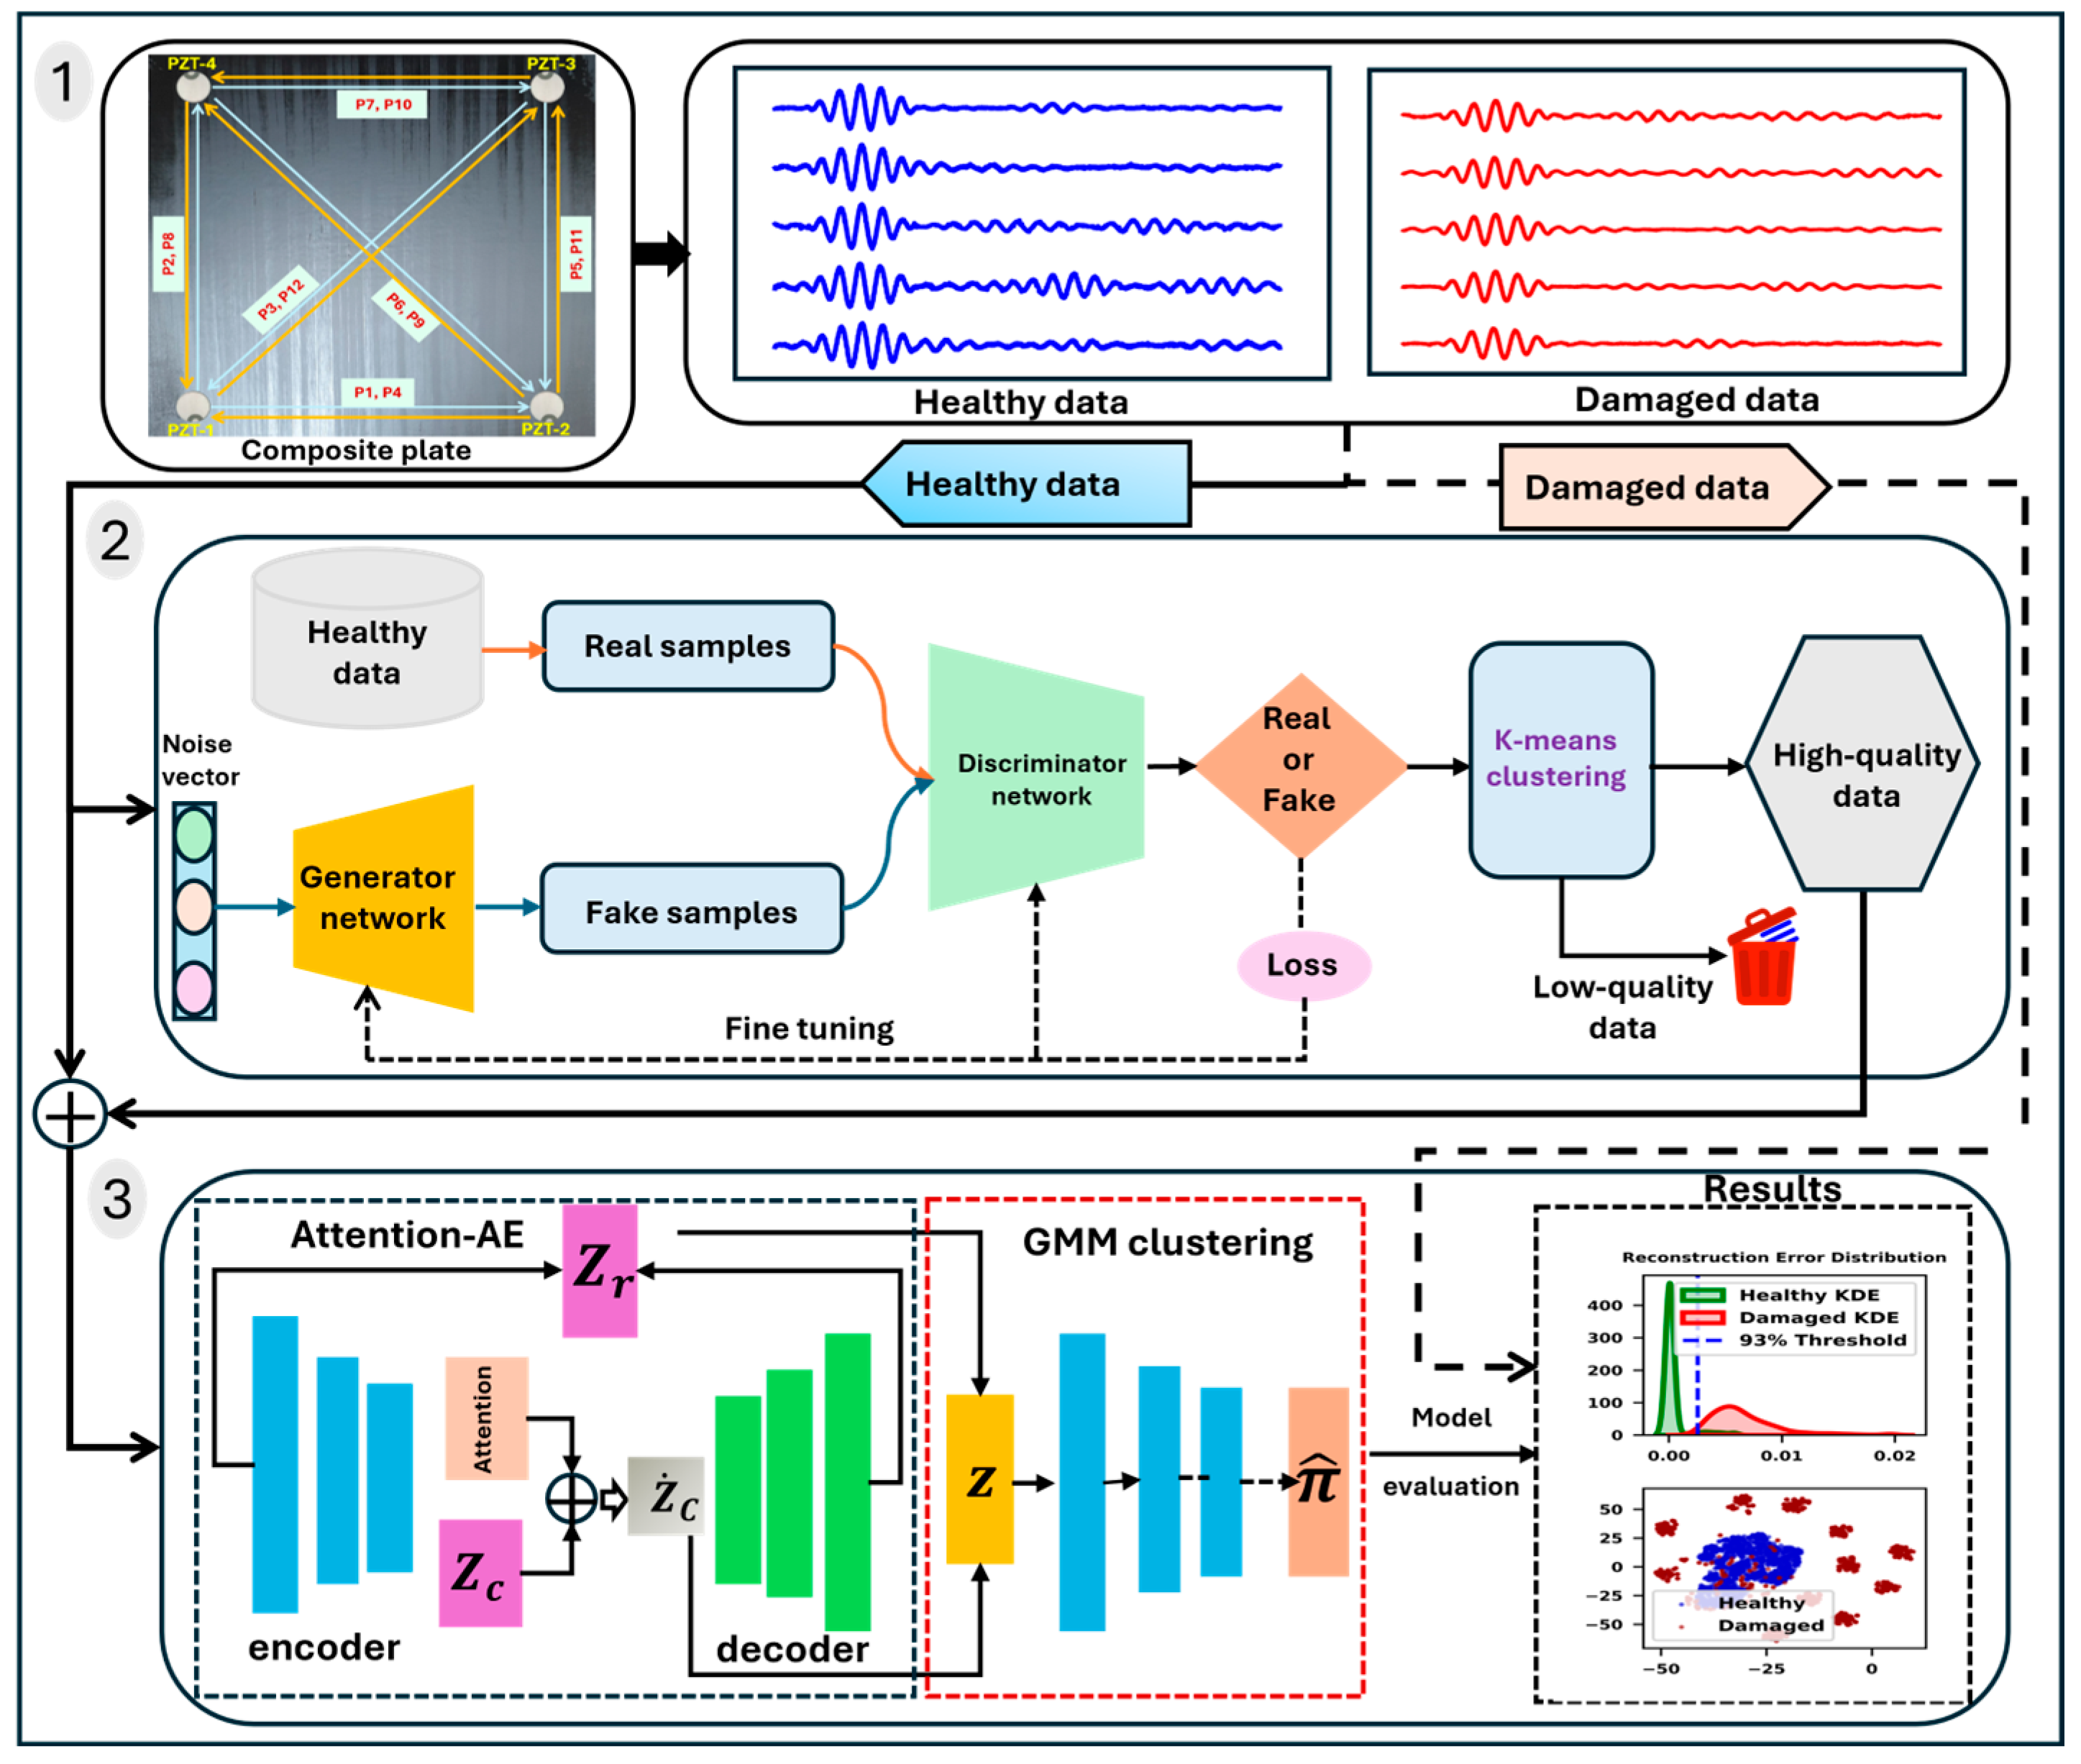
In this study, a self-attention autoencoder combined with a Gaussian mixture model (SAE-GMM) for unsupervised anomaly detection in laminated composite plates was proposed. The model was trained exclusively on the original healthy data and synthetic data generated using a GAN. A deep autoencoder was employed to extract the low-dimensional latent features and compute the reconstruction errors for each input signal. Additionally, a self-attention mechanism was integrated to enhance the performance of the deep autoencoder by dynamically prioritizing the most relevant parts of the input signal. Finally, the extracted latent features and reconstruction error outputs from the AE were input into the estimation network for density estimation via a GMM. This combination provides a full anomaly detection model, capable of detecting damage with high accuracy and inference time compared to conventional models. The key contributions of this study are summarized as follows:
The developed SAE-GMM architecture was trained solely on healthy Lamb wave data, enabling reliable damage detection without requiring labeled damage samples.
The proposed unsupervised framework was specifically designed to minimize false positive rates, thereby improving the robustness and reliability of damage detection.
A GAN was employed to generate high-fidelity synthetic signals, filtered via K-means clustering, to enrich healthy training data and overcome data shortage issue in SHM.
The self-attention mechanism was integrated into the encoded network, enhancing sensitivity to subtle signal distortions, improving representation quality and reconstruction fidelity.
Leveraged Gaussian mixture modeling combined latent features and reconstruction errors to effectively separate healthy and damaged signals.
We achieved state-of-the-art anomaly detection performance on an experimental composite plate, with validated generalization under varied Gaussian noise levels.
3. Experiments and Analysis
3.1. Experimental Verification on Laminated Composite Plate
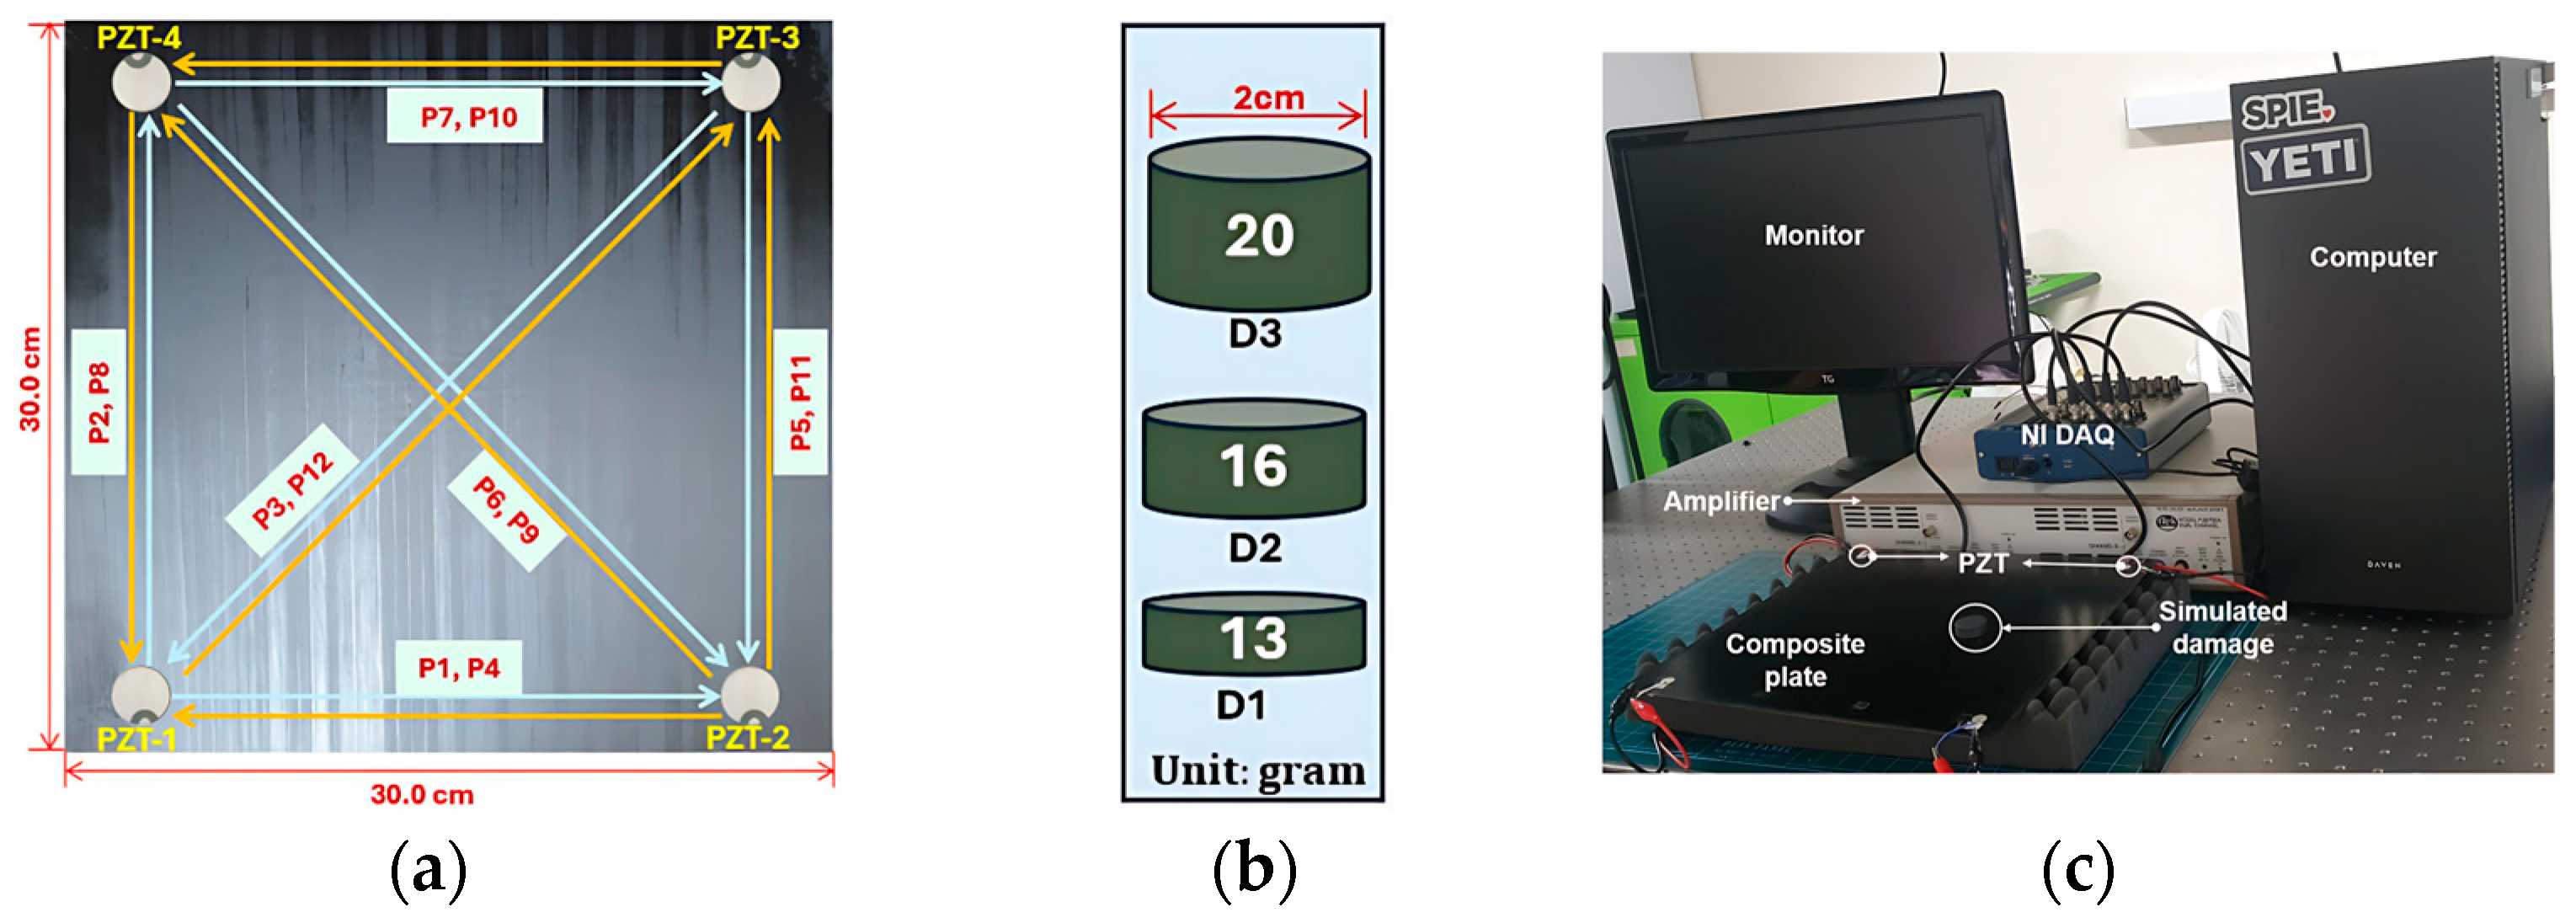
To validate the proposed model, a laminated composite plate with dimensions of was fabricated using an epoxy-based carbon fiber prepreg with a cross-ply orientation of . The composite laminates were manufactured using a hot-press machine and carefully cured to achieve the desired mechanical properties: a tensile strength of , tensile modulus of , thermal conductivity of , and density of . After trimming the composite plate to its final dimensions, four piezoelectric transducers (PZTs) from the PI ceramics were mounted diagonally at the four corners of the laminate plate using Loctite 401 adhesive to monitor the structure. Each PZT had a diameter of and thickness of .
3.2. Data Acquisition
The configuration consisting of four piezoelectric transducers, each with the dual functions of actuation and sensing, attached to a laminated plate is presented in
Figure 2a. Twelve sensing paths (P1–P12) were used for data acquisition. The composite plate was segmented into nine grid zones, each measuring 90 mm × 90 mm. To simulate varying damage severity levels, as presented in
Figure 2b, three distinct masses (13 g, 16 g, and 20 g) were simultaneously placed at the center of each grid zone. A disk magnet was chosen to simulate the damage because it was non-destructive, easy to position, and capable of altering the local stiffness and acoustic impedance of the laminate, thereby affecting the propagation of Lamb waves. This approach also allowed for a reversible process that enabled the collection of both healthy and damaged data under controlled conditions. The experimental setup, as shown in
Figure 2c, comprised an NI-USB 6341 series data acquisition system, a dual-channel PZT amplifier, and a LabVIEW-controlled PC for signal generation and data acquisition.
The excitation signal and measured Lamb wave signals are presented in
Figure 3. As shown in
Figure 3a, a five-cycle sinusoidal tone burst, modulated by a Hanning window and centered at 150 kHz, was employed as the excitation signal. Signals were transmitted and recorded at a sampling rate of 500 kHz per sample. As shown in
Figure 3b–f, healthy and damaged responses (D1–D3) were acquired sequentially using the pitch–catch method. The signals were collected along path 3 between PZT-1 and PZT-3, with all damage cases introduced simultaneously at the center of the plate. The influence of the damage was evident in the direct-wave packet region (index 0–400), where noticeable amplitude reductions and signal distortions were observed in the damaged signal compared to the healthy one (see
Figure 3c–e). The damaged responses exhibited reduced amplitudes owing to the scattering effects induced by the defects. Subtle differences were observed among the three damage cases. As shown in
Figure 3f, damage case D3 resulted in greater energy loss than D1 and D2, indicating more severe disruptions.
To ensure experimental repeatability, each test cycle was repeated ten times. A total of 3240 damaged signals (12 paths × 10 repetitions × 9 locations × 3 damage levels) and 600 healthy signals (12 paths × 10 repetitions × 5 trials) were collected. Due to the limited quantity of healthy signals and the risk of overfitting, a generative adversarial network (GAN), described in
Section 2.2, was employed to generate new high-fidelity samples rather than simply replicating the existing data patterns. Moreover, to ensure the quality of the generated signals, K-means clustering was used to distinguish between high- and low-quality synthetic samples.
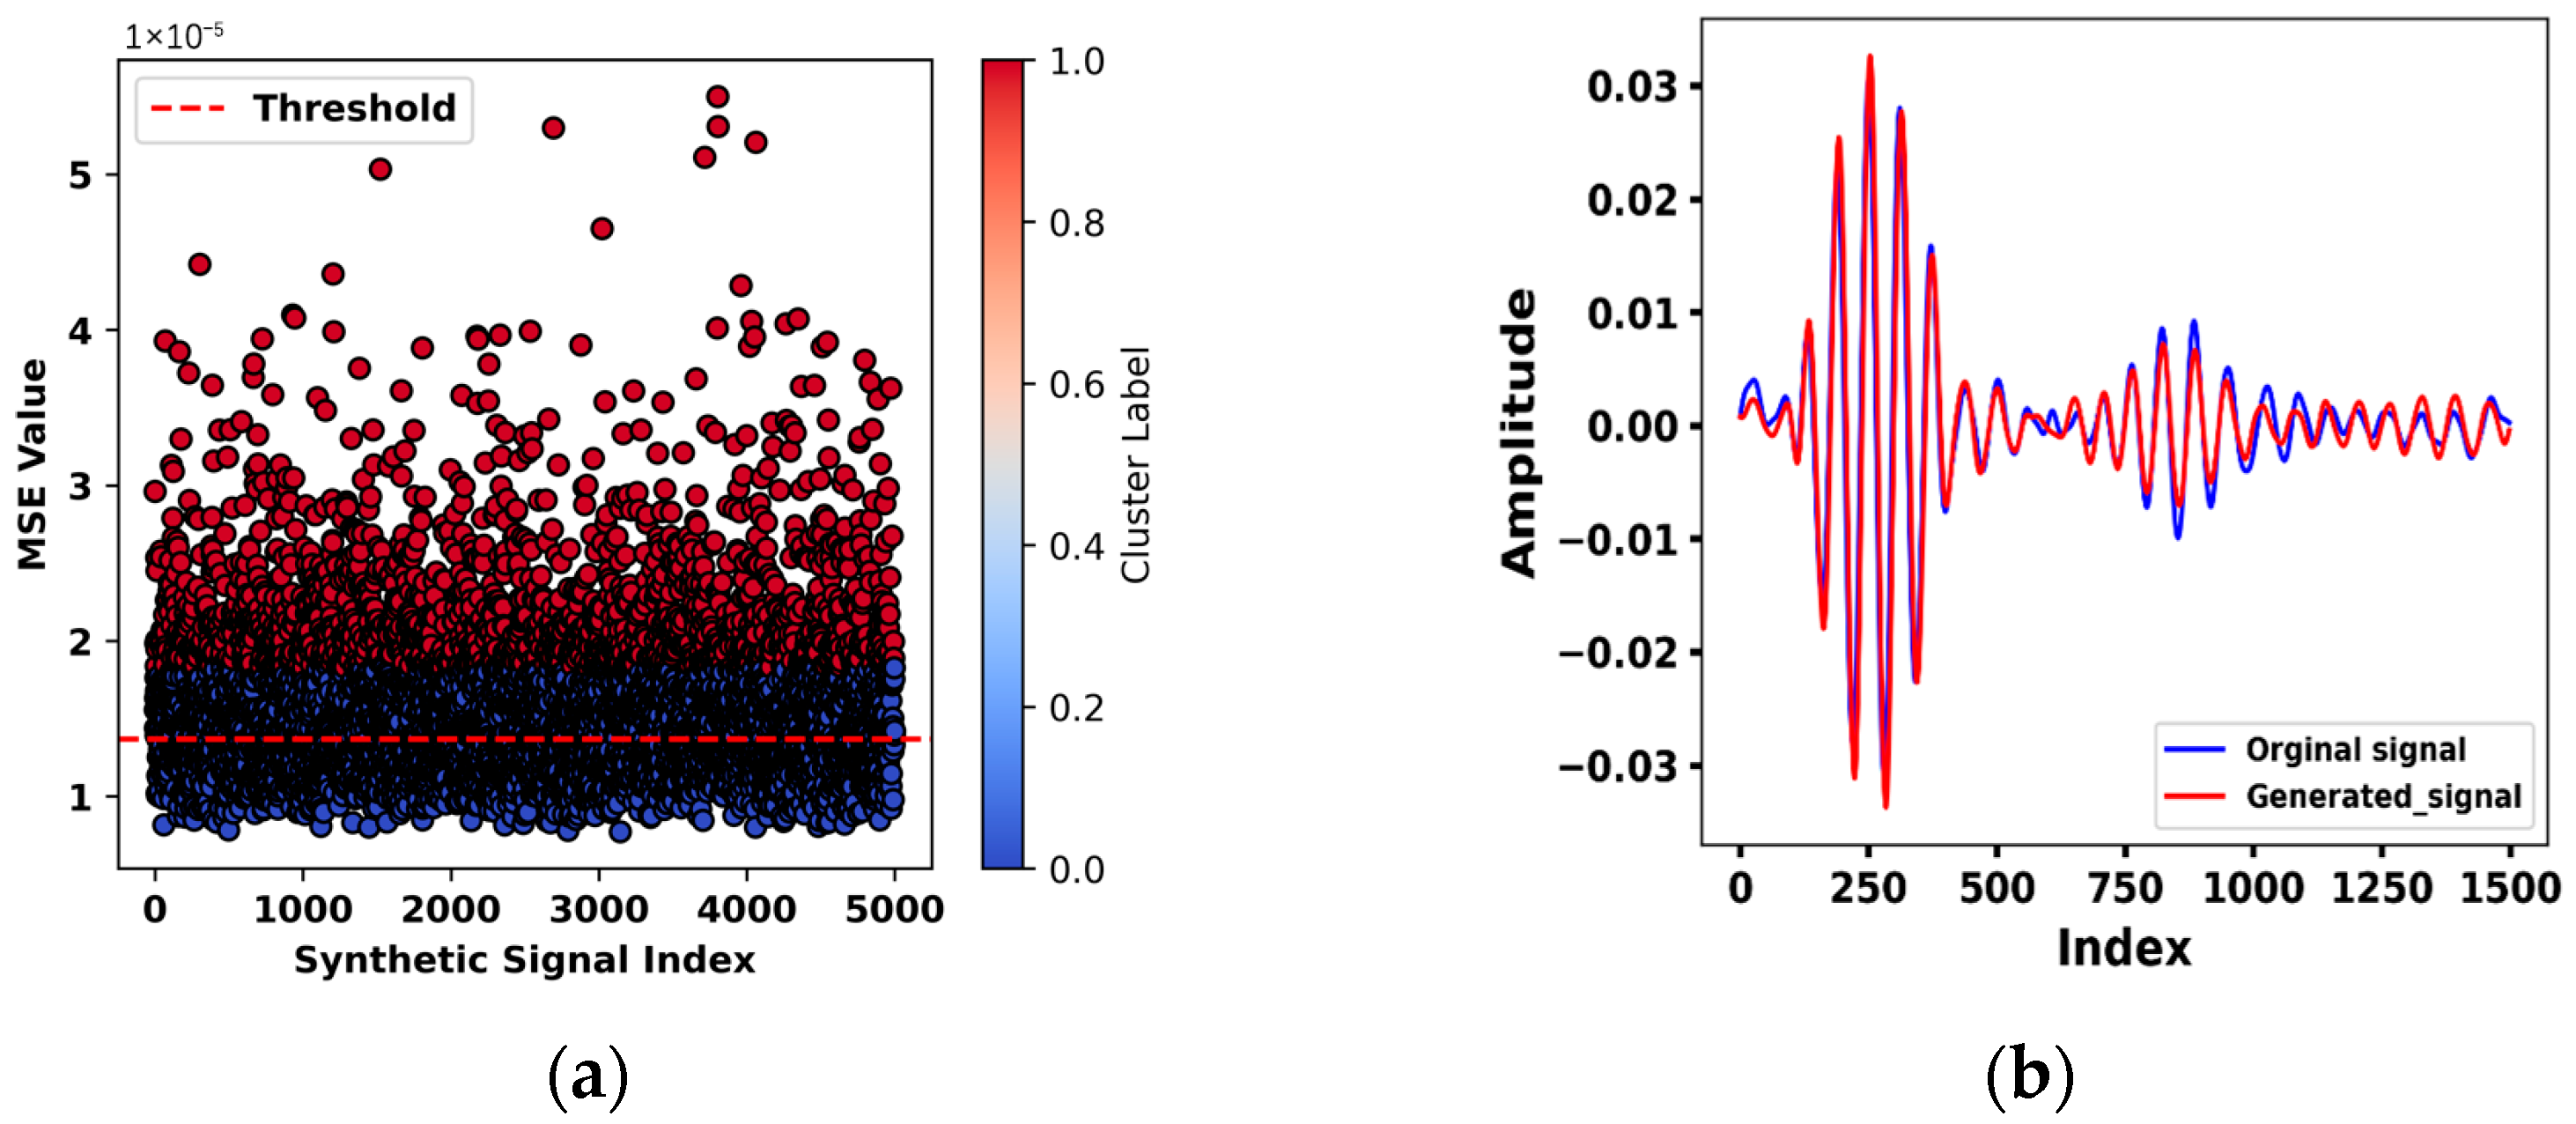
Specifically, the root mean square (RMS) of each generated signal was compared with that of the original healthy signal. A threshold was established based on the minimum distance between the centroids of two clusters. Synthetic signals with mean squared error (MSE) values below this threshold were classified as high-quality, as shown in
Figure 4a. A representative comparison between a generated signal and an original healthy signal is shown in
Figure 4b, demonstrating a close resemblance in both amplitude and temporal structure, with only minor deviations observed in the second-wave packet. In total, 3270 high-quality synthetic signals were generated and combined with the original healthy data, yielding a final dataset comprising 3870 samples.
3.3. Baseline Methods and Evaluation Metrics
To demonstrate the effectiveness of our model, we compared it with various state-of-the-art models that are widely used for anomaly detection. These include shallow machine learning and deep learning approaches. Some of the models evaluated were the One-Class Support Vector Machine (Oc-SVM) [
24], IsoForest [
25], Local Outlier Factor (LOF) [
26], and K-nearest neighbor (KNN) [
27]. To ensure a fair comparison, latent features from the pretrained autoencoder were extracted and used to train the selected shallow models. Although shallow machine learning algorithms have demonstrated effectiveness in certain tasks, they often struggle with complex datasets. Therefore, in this study, we considered several deep learning models as the baseline for our proposed approach. These deep models include the Variational Autoencoder (VAE) [
28], Invariant Representation Anomaly Detection (IRAD) [
29], Deep support vector data description (Deep-SVDD) [
30], and the transformer autoencoder (TAE) [
31].
3.4. Implementation Details
To ensure a fair comparison between shallow machine learning and deep learning models, features were extracted using an autoencoder to train the KNN, IsoForest, Oc-SVM, and LOF models. The autoencoder, with an input shape of 1500 and a 64-dimensional latent representation, was trained exclusively on healthy data. All experiments were conducted on a workstation equipped with an NVIDIA GeForce RTX 3060 GPU, an Intel Core i7-10700F CPU, and 32 GB of RAM. All models were trained using the same hyperparameters: the Adam optimizer, a batch size of 32, and 50 training epochs. For KNN and LOF, the neighborhood size was set to five based on trial-and-error experimentation. In contrast, the number of estimators for IsoForest was set to 30, and the radial basis function (RBF) kernel was selected for Oc-SVM. Fully connected layers were used to construct deep learning-based models such as VAE, IRAD, and Deep-SVDD, all trained exclusively on healthy data with identical training parameters. Anomaly detection in both the VAE and IRAD models is based on reconstruction errors, which serve as the anomaly score via the mean squared error (MSE). In the case of VAE, Kullback–Leibler (KL) divergence is added to the loss function to enforce a standard normal distribution in the latent space, whereas Deep-SVDD initializes its center point based on features extracted from healthy data. The transformer autoencoder model was constructed with a dense layer of 64 units, two attention heads, a feed-forward network with a hidden size of 128 and dropout rate of 0.25.
The proposed model, summarized in
Table 1, identified abnormalities by initially training an attention-enhanced autoencoder solely on healthy data. This allowed the model to learn a compact latent representation and accurately reconstruct normal signal patterns. Subsequently, a Gaussian mixture model (GMM) with four components was then fitted to the latent features extracted from the healthy data. The number of components was selected based on a trial-and-error approach rather than exhaustive parameter optimization. Anomaly scores were then computed using the negative log-likelihood of each sample under the GMM. Samples with scores exceeding 95th percentile of the healthy data were classified as having anomalies, indicating potential damage.
To assess the contribution of the attention mechanism to our proposed model, we conducted a comparative experiment by retraining the SAE-GMM model with the attention module excluding from the encoder section. The modified model (AE-GMM) was evaluated under similar conditions, and its performance metrics were compared to those of the original architecture.
3.5. Evaluation Metrics
To evaluate the performance of the proposed model, four key metrics were selected: the F1-score, recall (R), the false positive rate (FPR), and inference time. According to [
25], recall indicates the proportion of correctly classified damaged instances, whereas the FPR assesses the model’s reliability by measuring how often healthy data are misclassified as damaged. Inference time tells how long it takes for a trained model to analyze new data.
4. Experimental Results
4.1. Influence of Synthetic GAN Data on Proposed Model’s Performance
To evaluate the influence of synthetic data on our model’s performance, we designed four different scenarios, as summarized in
Table 2. The first scenario is composed exclusively of real data (100% real samples). The second scenario includes a balanced mix of real and synthetic samples, consisting of 100% real and 20% synthetic data. The third scenario features a complete mix of real and synthetic data. Lastly, the fourth scenario consists solely of synthetic data (100% synthetic samples). Each scenario was evaluated using the same set of 1080 damaged samples.
From
Table 2, it is clearly seen that the model trained solely on real data achieved low accuracy and a high false positive rate. This suggests that the model struggles to generalize well to unseen datasets due to the scarcity of real samples.
In contrast, the inclusion of synthetic data on real samples (scenario 3) demonstrated the best F1-score and the lowest false positive rate, highlighting the quality of the synthetic signals filtered by K-means clustering. Finally, the fourth scenario showed also strong anomaly detection; however, it suffered from low precision and an increased FPR, likely due to the absence of real data during training. Overall, the results indicate that synthetic data enhanced our model’s performance, with scenario 3 exhibiting optimal performance.
4.2. Anomaly Detection Results
To train the proposed and baseline models, 5-fold cross-validation was employed to split the healthy data into training and validation sets. For each damage category, 35% of the corresponding data were randomly selected to minimize imbalances during the testing phase. The selected samples from the three damage severities were concatenated to construct the damage dataset. Subsequently, the damaged dataset was combined with validation healthy dataset to form the testing dataset.
Table 3 lists the average performance metrics of the proposed and baseline models. For each metric, the highest score is indicated in bold, and the second-highest score is underlined. Among traditional models, Isolation Forest delivered the best performance with an F1-score of 91.4% and a recall of 93.8%, though it suffered from a relatively high false positive rate (FPR) of 11.3%. The K-nearest neighbor (KNN) model achieved an almost perfect recall (99.4%) but was undermined by the highest FPR (31.8%), indicating poor discrimination of healthy signals. Both One-Class SVM and Local Outlier Factor (LOF) performed poorly across all metrics. These findings suggest that while traditional machine learning models offer faster inference, they lack the feature extraction capacity required for complex signals such as Lamb waves. In contrast, deep learning models demonstrated superior feature extraction capabilities. The Variational Autoencoder (VAE) stood out among the baselines, achieving an F1-score of 96.1%, a recall of 98.3%, and a moderate FPR of 5.16%. However, its inference time (0.75 s)—nearly double that of the proposed model—limits its practicality in real-time settings. The transformer autoencoder (TAE) attained a moderate F1-score of 90.0% and a recall of 94.0% but exhibited the longest inference time (5.56 s), reflecting high computational demand despite decent detection performance. Both Deep-SVDD and IRAD failed to strike a balance across metrics. Deep-SVDD achieved the lowest FPR (0.8%) but suffered from extremely low recall (44.0%) and a corresponding F1-score of 60.6%, indicating severe overfitting and poor anomaly detection capability.
The proposed SAE-GMM model outperformed all baselines, achieving the highest F1-score (97.1%), nearly perfect recall (99.9%), and the lowest FPR (4.99%). Additionally, it maintained a fast inference time of 0.37 s, offering an ideal balance between speed and accuracy. The trained model without the self-attention module (AE-GMM) achieved perfect recall but suffered from a higher FPR (7.01%). In addition, SAE-GMM provides a clear balance between recall and false alarms. These results clearly demonstrate that integrating self-attention improves robustness and reduces false positives, with only a slight increase in runtime.
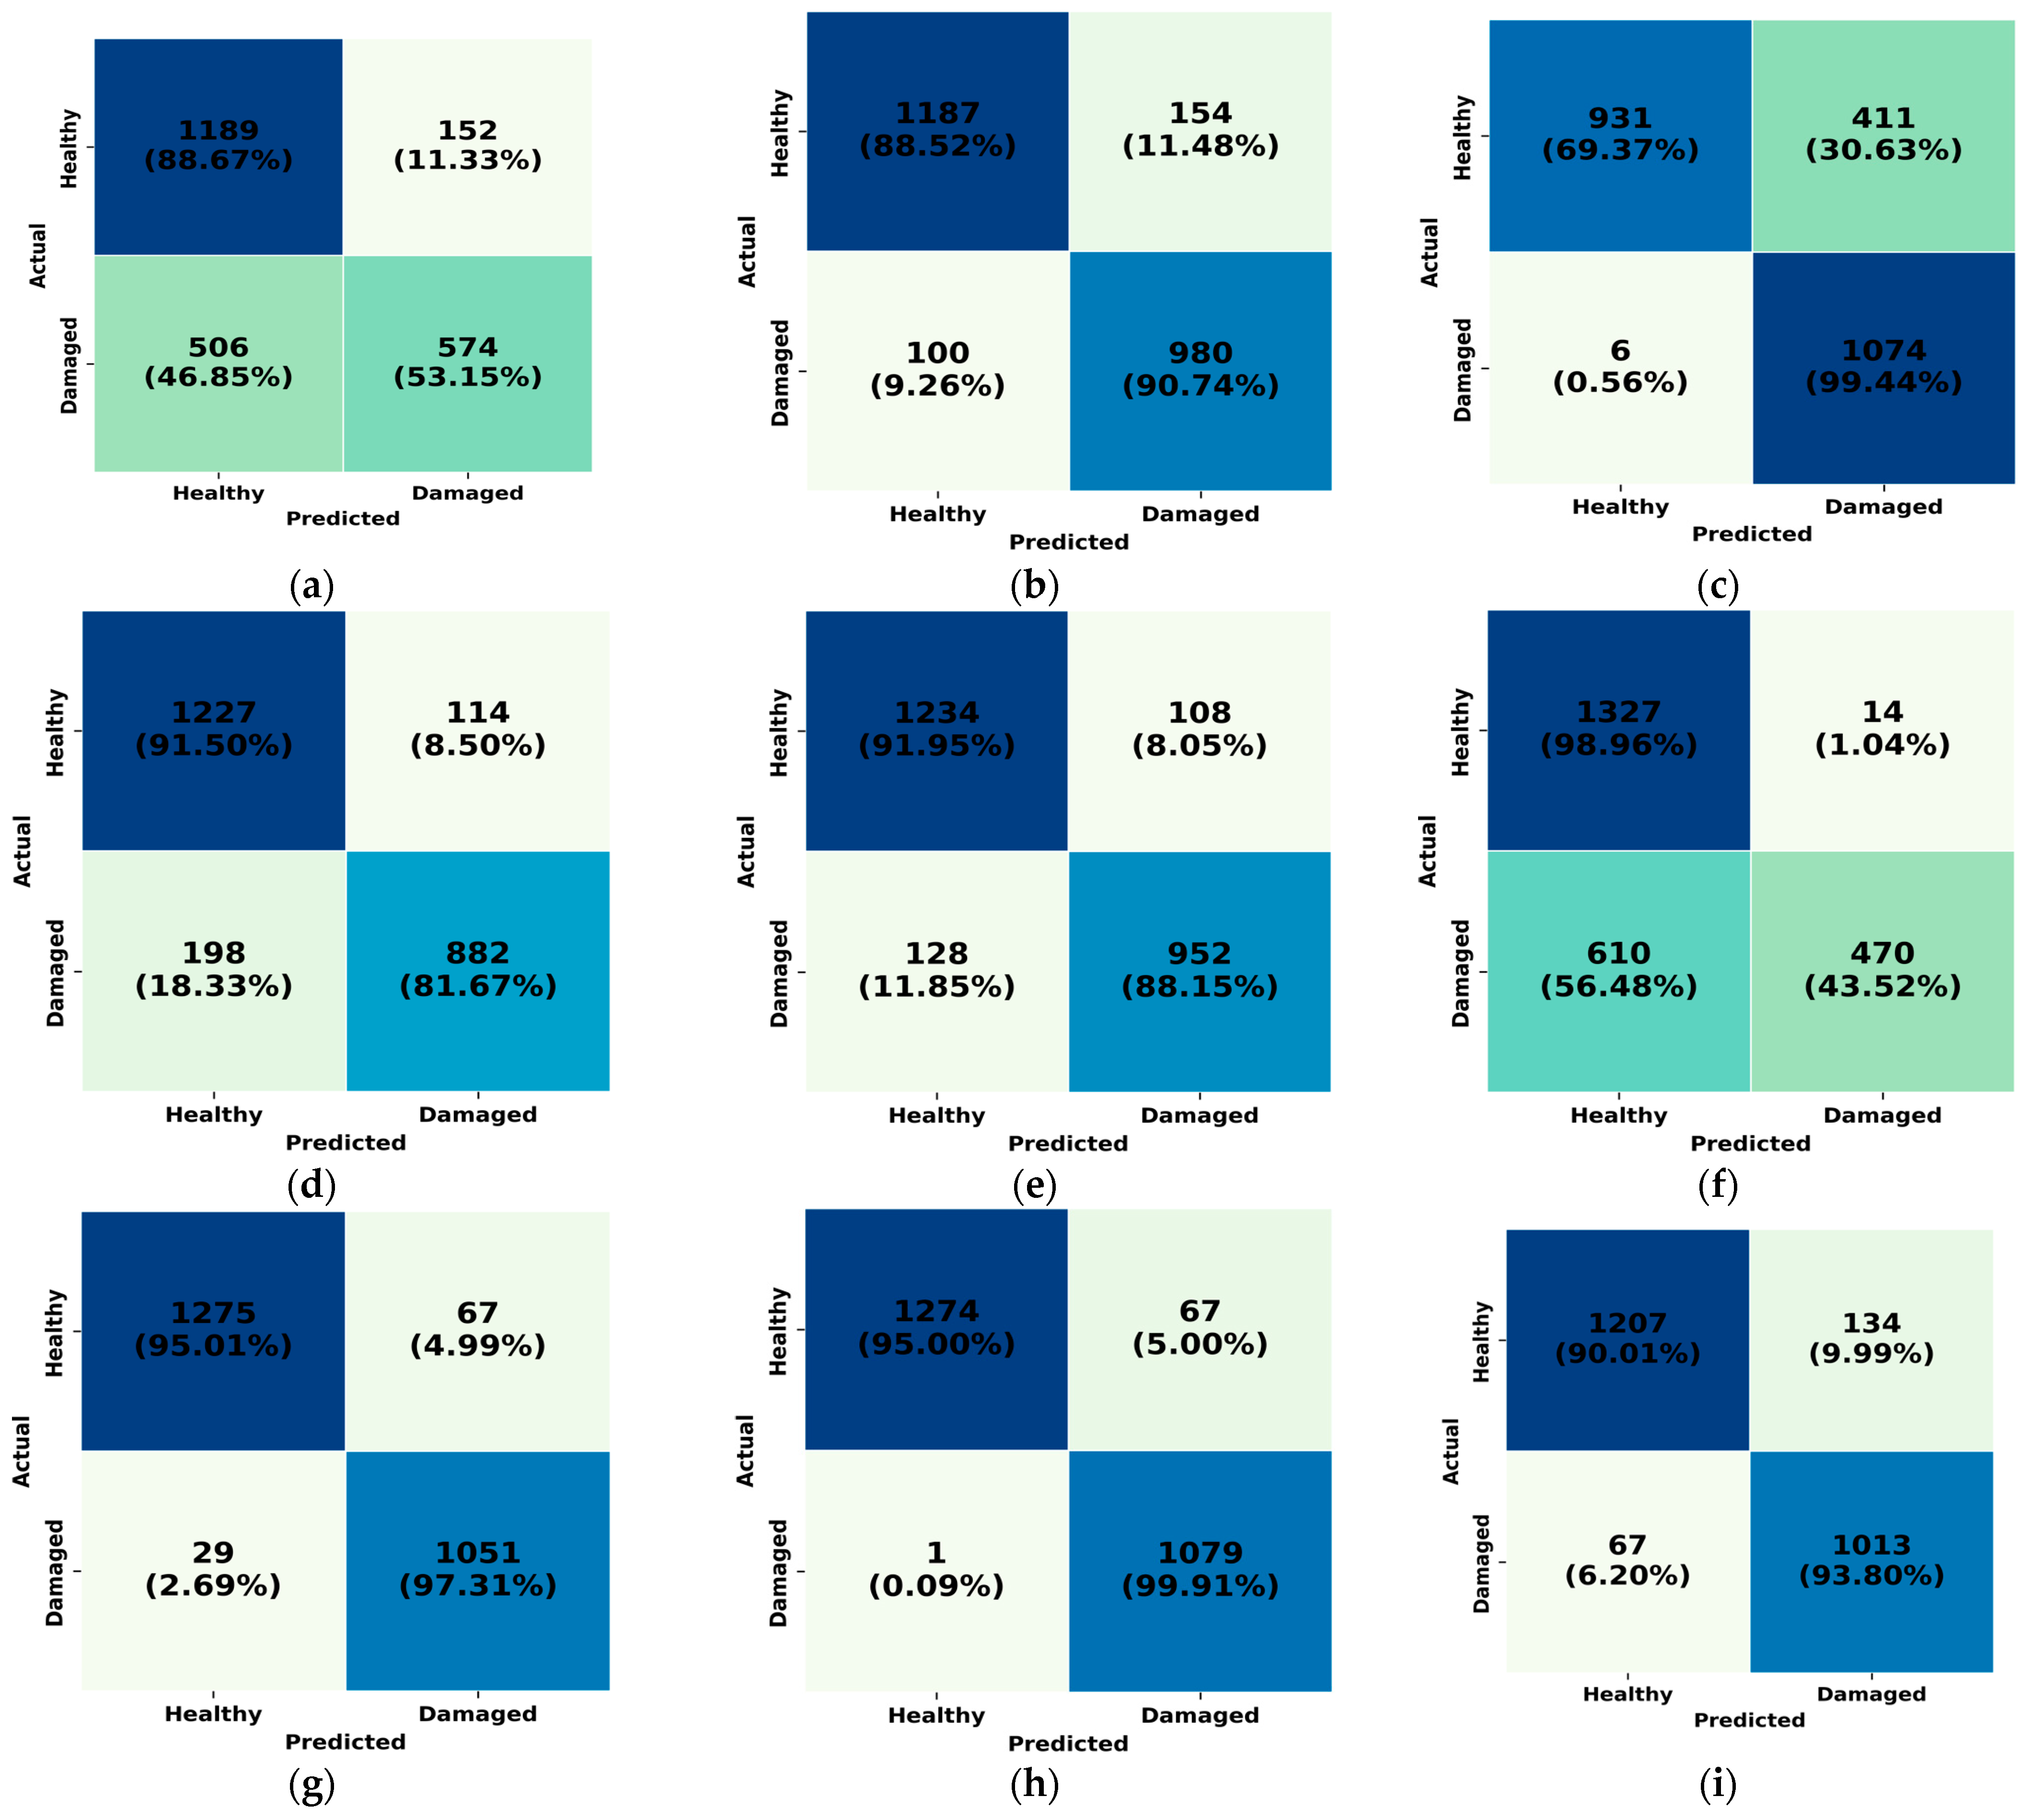
Figure 5 shows the confusion matrices for all baseline models and the proposed model, highlighting the effectiveness of each in distinguishing between healthy and damaged samples. The Oc-SVM and Deep-SVDD models exhibited limited capabilities, misclassifying nearly half of the damaged samples. Although Deep-SVDD achieved the lowest FPR, its overall detection performance was inadequate for practical applications. Models such as IsoForest, LOF, and IRAD demonstrated moderate performance in detecting true positives.
The KNN model achieved the second-highest number of true positives, correctly identifying 1074 out of 1080 damaged samples; however, it suffered from a high false positive rate, misclassifying 33.6% of the healthy signals. The VAE also performed well, misclassifying only 29 damaged samples and yielding a low FPR of 5.04%. The transformer autoencoder (TAE) achieved decent classification performance, correctly identifying 1013 damaged samples (93.8% recall) and 1207 healthy samples (90.01%). However, it misclassified 67 damaged and 134 healthy instances, indicating a moderate trade-off between detection and precision.
In contrast, the proposed SAE-GMM model outperformed all baselines, achieving the highest number of true positives—correctly classifying 1079 out of 1080 damaged samples and misclassifying only one sample. This highlights its robustness in differentiating between healthy and damaged signals. These results demonstrate that the superior performance of the proposed model stems from its ability to effectively capture the underlying structure of healthy data through a combination of deep representation learning, self-attention mechanisms, and GMM-based clustering in the latent space.
4.3. Visualization of the Results
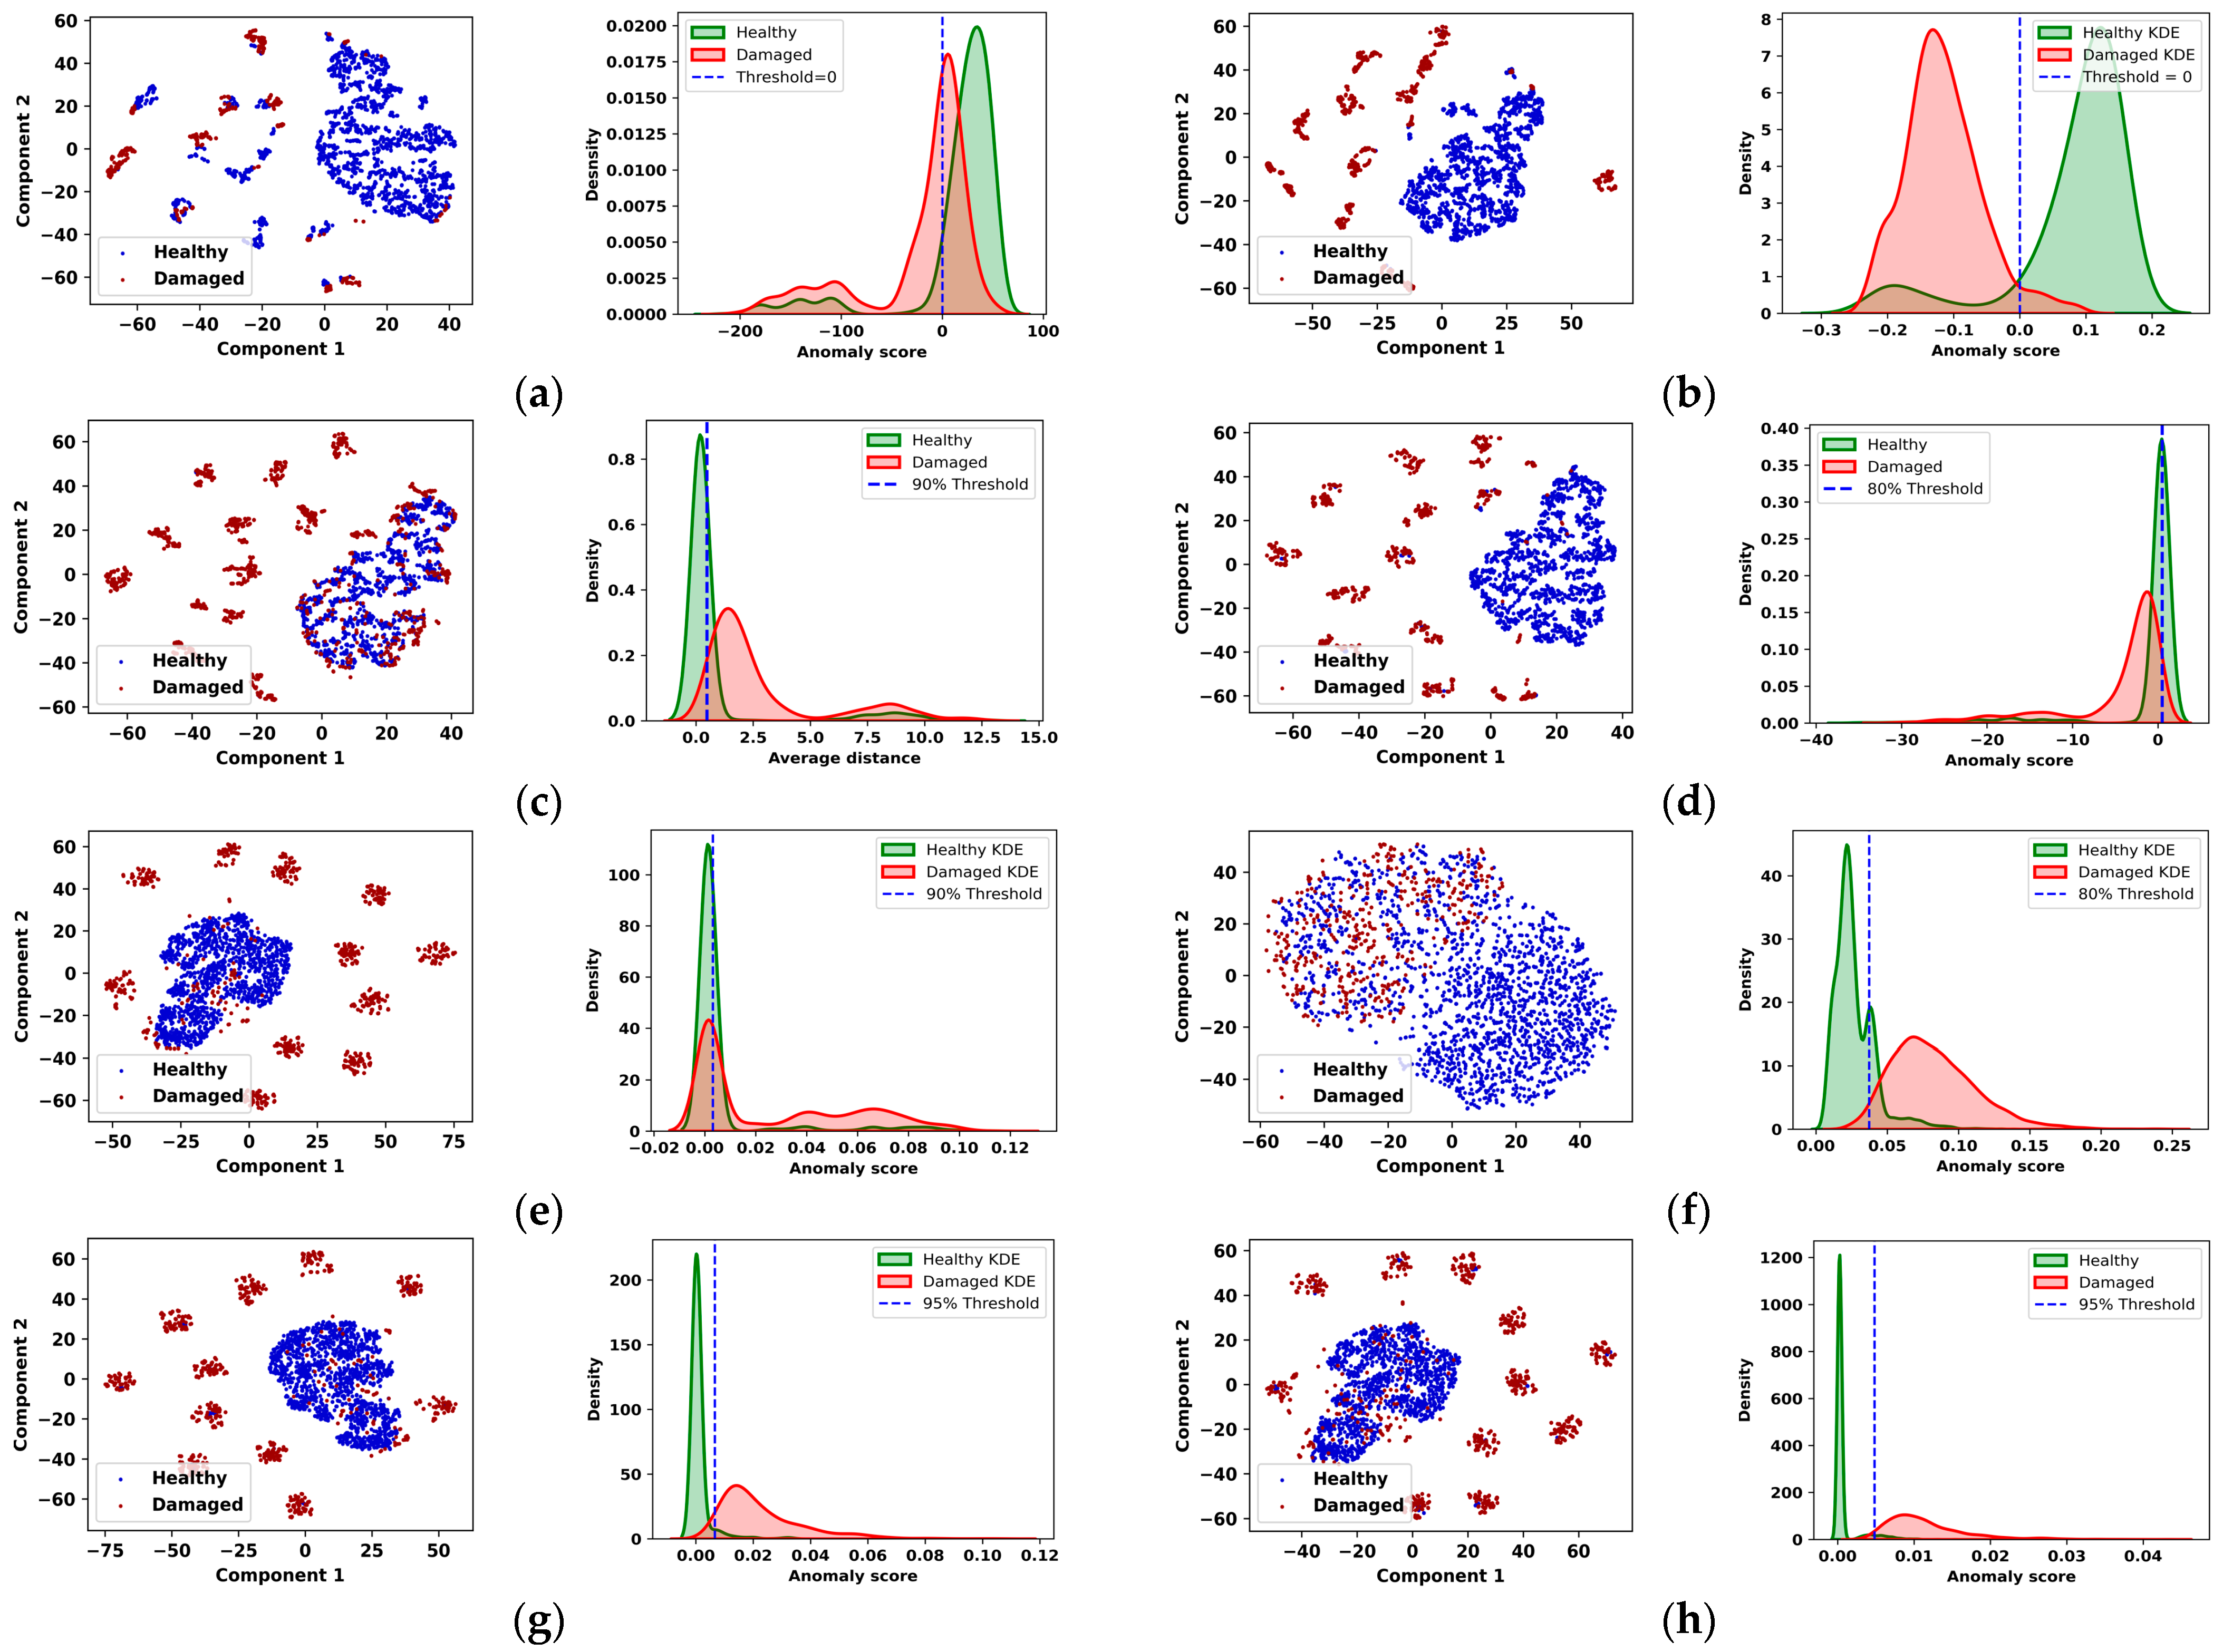
To further evaluate the separation capabilities of the proposed model relative to baseline approaches, we employed t-distributed Stochastic Neighbor Embedding (t-SNE) and Kernel Density Estimation (KDE) visualizations. As shown on the left side of
Figure 6, the t-SNE results indicate that both Deep-SVDD and Oc-SVM exhibited a limited ability to discriminate between healthy (blue) and damaged (red) samples in the latent space. A significant portion of the damaged samples were incorrectly clustered with healthy samples, reflecting suboptimal separation. In contrast, the KNN model tended to misclassify a large number of healthy samples as damaged. Deep learning-based models, including the VAE, IRAD, and LOF demonstrated improved class separation with reduced overlap between healthy and damaged sample distributions compared with shallow machine learning methods. Among these, the proposed model achieved the most distinct separation, followed by the VAE model. In the t-SNE plot, the healthy samples form a compact cluster, whereas the damaged samples are more widely distributed and separated. This clear delineation suggests that the proposed model is more effective in learning discriminative features, thereby enhancing its capacity for reliable and accurate damage detection. Additionally, the KDE plots shown on the right side of
Figure 6 are used to illustrate the distribution of anomaly scores and reconstruction errors for the two classes. Note that the Oc-SVM achieved the worst separation between healthy and damaged samples, whereas the proposed model exhibited the best separation. The healthy (green) and damaged samples (red) show a clearer overlap around the decision threshold at zero, suggesting the limited ability of the Oc-SVM model to separate false positives and false negatives.
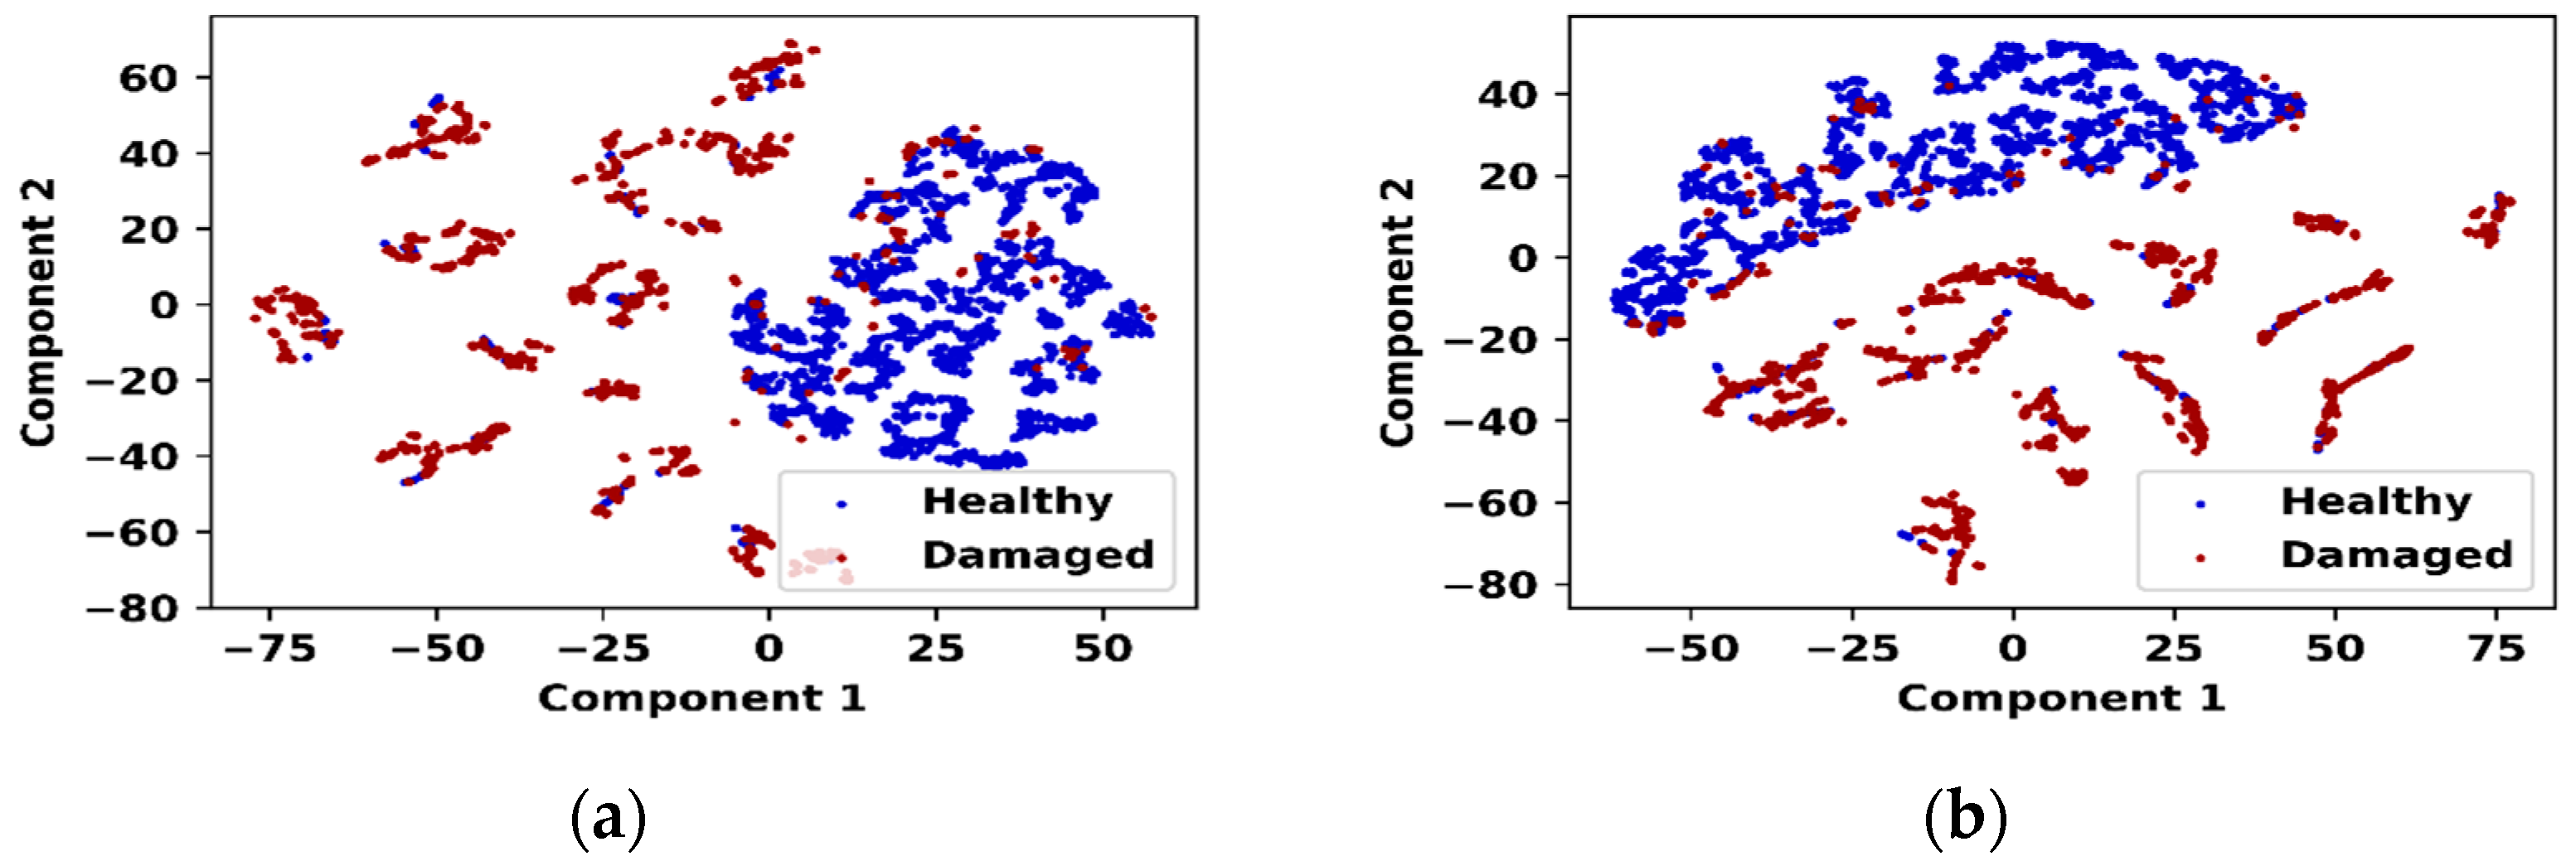
To highlight the impact of the attention mechanism on the proposed model, the feature distributions before and after applying attention are shown in
Figure 7.
Figure 7a shows the t-SNE plot of the features before the implementation of the attention mechanism, where a significant overlap between healthy and damaged samples is observed, indicating a poor class distribution. By contrast,
Figure 7b shows the feature distribution after applying attention, demonstrating an improved separation between the two classes with a distinct gap. This indicates that the attention mechanism effectively enhances the feature representation for the proposed SAE-GMM model, resulting in better class separation compared to other models that do not utilize attention.
The proposed model outperformed all baseline models, with a much more distinct separation between the samples. It is evident that the healthy samples were concentrated near very low anomaly scores, whereas the damaged samples were spread over a broader range of high anomaly scores. The 95% threshold determined from healthy samples cleanly separated the most damaged samples with a small overlap. Overall, the SAE-GMM model achieved superior class separability and a more reliable threshold margin for identifying structural damage.
4.4. Robust Analysis Under Varying Gaussian Noise Levels
To evaluate the generalization capability of the proposed SAE-GMM model under noisy conditions, Gaussian noise with three standard deviations (σ = 0.05, 0.075, 0.1) was added to training data. Rather than augmenting the dataset with additional noisy samples, 50% of the original training data were perturbed to mitigate computational overhead. The model’s performance under each noise condition was evaluated and compared to its baseline performance on clean data, as summarized in
Table 4. Under moderate noise levels (σ = 0.05 and σ = 0.075), the model retained stable F-1 scores of 0.97 and 0.96 with strong recall values of 97% and 95%, respectively. At the highest noise level (σ = 0.1), the model demonstrated notable resilience, achieving an F1-score of 0.93 and recall of 90%, highlighting its effectiveness in anomaly detection. The false positive rate (FPR) experienced a steady increase with noise level, from 4.99% (clean data) to 6.10% (
σ = 0.1), yet remained within an acceptable range. These results validate the robustness of the proposed model under realistic signal perturbations.
5. Conclusions
This study presents a robust unsupervised anomaly detection framework for laminated composite plates, combining GAN-based data augmentation, a self-attention autoencoder, and Gaussian mixture modeling. The proposed model successfully captures complex signal patterns and separates damaged signals with high metric scores. Compared to traditional and deep learning baseline models, SAE-GMM achieves high detection accuracy, low false positive rates, low computational time, and strong generalization under noisy conditions. The attention mechanism enriches the model’s capability of separating features, while the Gaussian mixture model (GMM) provides a reliable decision boundary. These obtained results emphasize the proposed model’s potential for real-world structural health monitoring applications. For the future, we plan to explore cross-plate validation and real-time deployment further to evaluate scalability and adaptability across diverse composite structures.


