Abstract
As a pivotal economic province in China, Jiangsu’s efforts in civil building energy conservation are critical to achieving the national “dual carbon” goals. This paper proposes a hybrid model that integrates wavelet transform, support vector regression (SVR), and extreme learning machine (ELM) to predict the civil building energy consumption of Jiangsu Province. Based on data from statistical yearbooks, the historical energy consumption of civil buildings is calculated. Through a grey relational analysis (GRA), the key factors influencing the civil building energy consumption are identified. The wavelet transform technique is then applied to decompose the energy consumption data into a trend component and a fluctuation component. The SVR model predicts the trend component, while the ELM model captures the fluctuation patterns. The final prediction results are generated by combining these two predictions. The results demonstrate that the hybrid model achieves superior performance with a Mean Absolute Percentage Error (MAPE) of merely 1.37%, outperforming both individual prediction methods and alternative hybrid approaches. Furthermore, we develop three prospective scenarios to analyze civil building energy consumption trends from 2023 to 2030. The analysis reveals that the observed patterns align with the Environmental Kuznets Curve (EKC). These findings provide valuable insights for provincial governments in future policy-making and energy planning.
Keywords:
energy consumption; civil building; wavelet transform; support vector regression; extreme learning machine MSC:
68T07
1. Introduction
The global warming and the energy crisis have emerged as a growing concern for countries worldwide in recent years. As the world’s largest developing country, China has experienced a surge in energy demand driven by rapid urbanization. This growth has precipitated a sustained rise in carbon dioxide and other greenhouse gas emissions, positioning the nation as a major contributor to global emissions [1]. To address with the urgent challenges of global climate change, China has assumed its responsibilities as a major global power by establishing the “dual carbon” goals.
Currently, civil building energy consumption in China accounts for 21% of the national total energy consumption [2], representing a critical component of it. The high energy consumption and carbon emissions of civil buildings have triggered a series of environmental issues. Promoting energy-efficient building development is essential for China’s energy transition and green recovery, as well as for global sustainable development. As a major economic province with its total energy consumption ranking among the highest nationally, Jiangsu Province faces particularly prominent energy consumption issues in civil buildings. The accurate forecasting of civil building energy consumption is therefore imperative for achieving provincial energy conservation and emission reduction targets while also reducing building operational costs.
Energy consumption forecasting has long been an active research field, with scholars proposing a variety of methods. The IPAT equation, initially formulated by Ehrlich and Holdren to assess the environmental impacts of population, affluence, and technology [3], suffers from inherent limitations due to its assumption of uniform elasticity across these three drivers. To address the constraints of the IPAT model, scholars have expanded it to develop the STIRPAT model by introducing exponential parameters [4,5]. Statistical methods are widely used, such as linear regression, exponential smoothing, and the autoregressive integrated moving average model (ARIMA) [6,7,8]. However, the nonlinear relationships in energy consumption data are often not captured by these models. The grey prediction model is suitable for situations with incomplete data or small sample sizes; nevertheless, it tends to have noticeable errors in medium-term to long-term forecasting [9]. Machine learning methods, including BPNN, XGBoost, and LSTM [10,11,12,13,14], have demonstrated exceptional capability in predicting complex nonlinear relationships. However, these methods generally require large datasets and are prone to overfitting when applied to predictions with small samples.
Due to the complexity of time-series generation, reliance on a single forecasting model may lead to substantial prediction errors. Combined forecasting methods that integrate multiple different individual models often outperform single models [15]. Methods for determining weights in ensemble models include linear and nonlinear combinations [16]. With the continuous development of combination methods, approaches such as the variance reciprocal method [17], particle swarm optimization (PSO) [18], and the generalized induced ordered weighted average (GIOWA) operator [19] have been successively applied to weight determination. However, these methods merely aggregate the prediction results of individual models without addressing the inherent complexity of time-series data. In contrast, hybrid models that decompose the time series first and then forecast the sub-series separately have shown enhanced performance. Early studies predominantly employed classical decomposition methods, utilizing moving averages (MA) to extract trends and seasonal components [20]. Seasonal-Trend decomposition using LOESS (STL) achieves non-parametric decomposition via a local weighted regression [21]. Empirical Mode Decomposition (EMD) exhibits good adaptive features [22]. Variational Mode Decomposition (VMD) enhances the stability of the decomposition [23]. However, these methods suffer from sensitivity to high-frequency noise, mode mixing, or high computational complexity [24]. Compared with the aforementioned methods, wavelet decomposition performs a multi-resolution analysis through time–frequency localized basis functions, which can effectively capture transient high-frequency fluctuations while preserving low-frequency trends [25]. The synergy between wavelet decomposition and machine learning models can significantly reduce prediction errors for energy consumption forecasting [26,27].
Given the limited data samples and the complex nonlinear relationship between the energy consumption of civil buildings and its influencing factors, the accurate prediction of the energy consumption of civil buildings faces great challenges. To enhance prediction accuracy and model applicability, this study proposes a hybrid approach integrating wavelet transform (WT), support vector regression (SVR), and extreme learning machine (ELM) within a cohesive ‘decomposition–specialized modeling–reconstruction’ framework. Wavelet transform is first employed to dissect the original energy consumption data. It stably and robustly separates the low-frequency trend components from high-frequency fluctuations, even with limited sample sizes. Crucially, it overcomes the limitations of endpoint effects and mode mixing that are inherent in alternative decomposition methods, ensuring reliable signal isolation. The extracted low-frequency trend component is modeled using SVR. Leveraging kernel functions and the principle of structural risk minimization in high-dimensional feature space, SVR robustly captures and fits the underlying trend pattern. The high-frequency fluctuation component is modeled using ELM. ELM’s efficient single-hidden-layer feedforward architecture with random weights excels at rapidly learning the complex, nonlinear patterns characteristic of these fluctuations. Finally, the predictions from the SVR and ELM models are reconstructed to produce the complete energy consumption forecast. This WT-SVR-ELM hybrid model directly addresses the core challenges of civil building energy consumption prediction by leveraging the complementary strengths of each component: WT’s stable decomposition capability, SVR’s robustness in capturing smooth trends, and ELM’s efficiency in modeling complex nonlinear fluctuations.
2. Methodology
2.1. Wavelet Transform
Wavelet transform comprises two types: the continuous wavelet transform (CWT) and the discrete wavelet transform (DWT).
The CWT operates as a multi-resolution analytical approach, capturing both spectral and temporal characteristics of signals through continuous shifting and dilation of a mother wavelet. Given a signal and a wavelet function , the CWT is defined as follows [28]:
where is the scale factor that determines the dilation of the wavelet function; is the translation factor that determines the temporal location of the wavelet; denotes the complex conjugate of the wavelet function; and represents the wavelet coefficient of the signal at scale and position , reflecting the characteristics of the signal at that particular scale and position.
While the CWT demands significant computational resources and large datasets, the DWT achieves comparable accuracy with markedly improved efficiency [26], leading to its broader adoption for time-series decomposition. The Mallat algorithm is a classical DWT algorithm [25], and its computational process is shown in Figure 1. In the initial decomposition stage, complementary low-pass and high-pass filters process the raw signal , generating two distinct components: the low-frequency approximation coefficients and the high-frequency detail coefficients . The approximation coefficients can then be iteratively decomposed further, generating a series of hierarchical coefficients and :
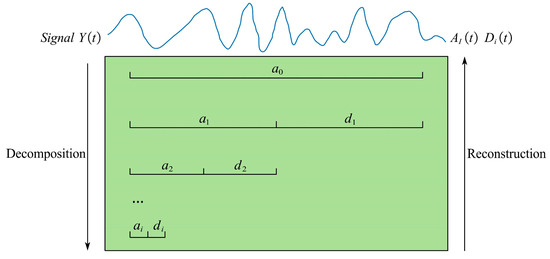
Figure 1.
Schematic diagram of discrete wavelet transform.
In the formulation, represents the low-pass filter, represents the high-pass filter, denotes the level of decomposition, and and are the indexes of the sequence. Each decomposition yields approximation coefficients and detail coefficients with half the length of the original signal.
By reconstructing the approximation coefficients and detail coefficients, low-frequency and high-frequency signals, respectively, with the same length as the original signal can be obtained [29].
Let the highest-level approximation coefficients and the detail coefficients from all decomposition levels serve as the initial inputs. The approximation coefficients of the current level are subjected to inverse transformation via a low-pass filter, while the detail coefficients undergo inverse transformation through a high-pass filter. These processed coefficients are then superimposed to reconstruct the approximation coefficients of the previous level:
In the above formula, . By recursively applying this process from the highest decomposition level until , the reconstructed signal is obtained:
By setting all detail coefficients to zero and applying Equations (5) and (6), the approximation signal sequence can be obtained. Similarly, by setting all detail coefficients and approximation coefficients except to zero and implementing Equations (5) and (6), the detail signal sequence for each level can be derived.
The original time series can be reconstructed by summing the approximation signal sequence and all detail signal sequences [30]:
After wavelet decomposition and reconstruction, the time series is decomposed into a low-frequency sequence and high-frequency sequences . The low-frequency signal sequence retains the trend information of the original time series, while the high-frequency signal sequences capture the periodic and fluctuation component of the original time series .
2.2. SVR Model
SVR is a type of nonlinear regression method that is built upon the principle of structural risk minimization, which is a key concept within the broader framework of statistical learning theory [31]. Unlike traditional regression methods, SVR constructs an epsilon-insensitive zone to disregard certain errors, thereby enhancing the model’s generalization capability. This approach endows SVR with robustness against outliers [32], making it suitable for regression problems with small sample sizes.
Given a training set , where are input variables and are output variables, a nonlinear mapping function is used to project the samples into a high-dimensional feature space. In this space, a linear regression equation is constructed:
Here, represents the predicted value, represents the coefficient vector, and is the bias term.
The uniqueness of SVR lies in its ability to disregard the loss when the prediction error is less than . This means that in the high-dimensional feature space, an optimal hyperplane is sought, ensuring that each sample point is positioned as closely as possible to the hyperplane and , while minimizing the loss. The objective function and constraints are given by the following formulas:
where controls the model complexity, is the penalty coefficient, and are non-negative slack variables, and is the regression tolerance that defines the width of the epsilon-insensitive zone.
By introducing Lagrange multipliers, this optimization problem can be converted into its dual form, allowing the derivation of the optimal hyperplane’s expression [33]:
In the formulation, and are the Lagrange multipliers, and is the kernel function. allows the computation of the inner product without explicitly mapping the data into that space, thereby enhancing computational efficiency [34].
Common kernel functions include polynomial, sigmoid, and Gaussian kernels. The Gaussian kernel has emerged as the most prevalent choice due to its exceptional nonlinear mapping capabilities [35,36,37]. Its mathematical expression is given by the following:
2.3. ELM Model
As a special single-hidden-layer feedforward neural network, ELM is a machine learning algorithm that offers a fast and efficient training process [38]. The structure of ELM is visualized in Figure 2. Notably, the core principle of ELM is to transform the iterative parameter optimization in traditional neural networks into a linear system solution problem by randomly initializing the connection weights and biases between the input layer and the hidden layer. Compared with the traditional backpropagation (BP) algorithm, ELM significantly enhances training efficiency while maintaining good generalization performance [39,40,41].
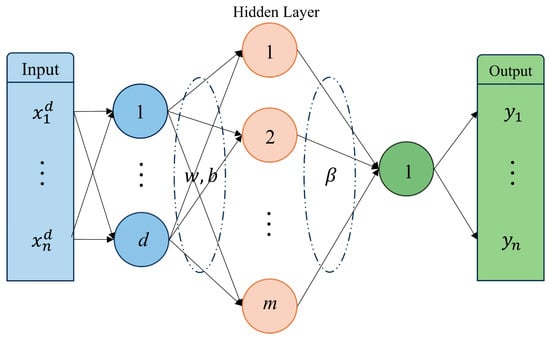
Figure 2.
Diagram of ELM architecture.
Given a training set , where are the input values and are the output values, the matrix form of an ELM with input neurons and hidden neurons for a single output neuron is as follows:
Here, is the weight vector between the hidden layer and the output layer, is the output variable vector, and is the hidden layer output matrix. The computation of is given by the following formula [42]:
where is the weight vector connecting the input layer neurons to the i-th hidden layer neuron, is the bias of the i-th hidden layer neuron, and is the activation function of the hidden layer.
The following three steps can summarize the solution algorithm of ELM:
Step 1 Select an appropriate number of hidden neurons. Then, randomly initialize the weights and biases that link the input neurons to the hidden neurons;
Step 2 Calculate the hidden neurons output matrix by applying the activation function to the inputs;
Step 3 Compute the Moore–Penrose generalized inverse matrix of , and then multiply it by to obtain the minimum-norm least-squares solution of Equation (13) [43,44]:
2.4. The WT-SVR-ELM Hybrid Model
The proposed hybrid forecasting model (WT-SVR-ELM) in this study is based on the idea of signal decomposition and heterogeneous model fusion. It implements time-series forecasting through a four-tier cascaded structure of “preprocessing–decomposition–prediction–reconstruction” (as shown in Figure 3). The detailed procedure for implementing the model is provided below:
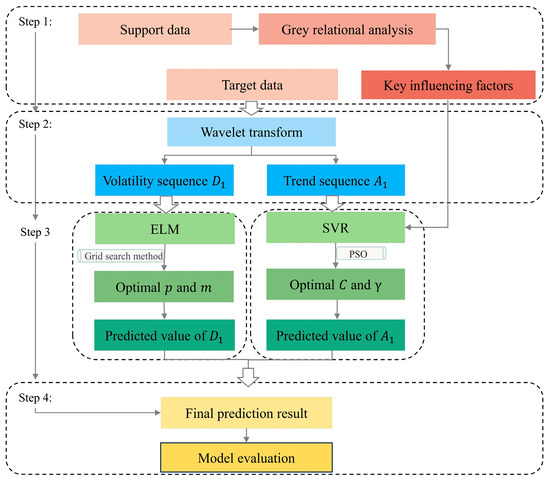
Figure 3.
Flowchart of WT-SVR-ELM hybrid model.
(1) Data preprocessing layer: Select time-series data and their influencing factors, and conduct grey relational analysis (GRA) to determine the required regression independent variables.
(2) Wavelet transform layer: For the time–frequency characteristics of non-stationary time series, perform discrete wavelet decomposition and reconstruction on the time-series data. Using the Mallat algorithm, decompose the time-series data into approximation coefficients and detail coefficients . Then, conduct wavelet reconstruction to obtain the trend sequence and the fluctuation sequence .
(3) Trend component and fluctuation component prediction layer: Given that the trend component is significantly influenced by external environmental variables (such as economic indicators and population factors), construct a multivariate SVR model. Select Gaussian kernel as the kernel function K (⋅), and optimize the penalty coefficient and kernel width using PSO. For the nonlinear characteristics of the fluctuation component , formulate an ELM prediction model. Utilize a sliding window approach, where the input layer constructs autoregressive features using historical data from the time window . The window size p and the number of hidden layer neurons m are determined through grid search.
(4) Combined prediction layer: Combine the predicted trend sequence with the predicted fluctuation sequence to obtain the final prediction result.
The model innovatively integrates signal processing techniques with machine learning algorithms by explicitly considering the non-stationary characteristics of time series and the variation differences among components, thereby effectively improving forecasting accuracy. Its technical advantages are reflected in the following aspects: (1) Wavelet decomposition is used to decouple sequence features, reducing modeling complexity; (2) The collaborative prediction approach of heterogeneous models incorporates both external factors and intrinsic time-series characteristics.
In this study, the precision of the model is evaluated using the Mean Absolute Percentage Error (MAPE), Mean Absolute Error (MAE), and Root Mean Square Error (RMSE):
where represents the predicted value and represents the actual value.
3. Case Study
3.1. Accounting of Civil Building Energy Consumption of Jiangsu Province
The energy consumption of civil buildings generally refers to the energy consumed during the operational phase, excluding the production and transportation stage of building materials, the construction stage, and the demolition stage [45]. In China’s energy statistical work, energy consumption is classified into four major sectors based on economic activities: the primary industry, the secondary industry, the tertiary industry, and the residential sector. The energy consumption data of civil buildings is distributed across multiples sectors, making it impossible to obtain directly. Therefore, based on the “China Energy Statistical Yearbook” [46] and the “General Rules for Calculation of Comprehensive Energy Consumption (GB/T 2589-2020)” [47], this study calculated the civil building energy consumption by adjusting the energy balance table. The specific calculation methods are shown in Table 1.

Table 1.
Calculation method for civil building energy consumption.
Based on the calculation methods presented in Table 1, the energy consumption data of civil buildings from 2004 to 2022 are presented in Figure 4. The energy consumption of civil buildings in Jiangsu Province exhibited an overall upward trend from 2004 to 2022. This trend is closely linked to economic development, the advancement of urbanization, and the improvement of living standards of the population.
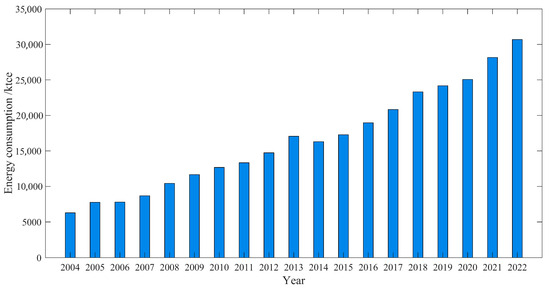
Figure 4.
Civil building energy consumption of Jiangsu Province.
3.2. Selection of Influencing Factors
As a complex system, the civil building energy consumption is inevitably affected by other systems within the broader social system. The STIRPAT equation [4] has been widely applied to analyze the relationship between resource consumption or pollutant emissions and macro-level factors. It can be expressed by the following equation:
In the formula, represents the consumption of resources or the emission of pollutants, denotes the population size, indicates the level of economic development, signifies the level of science and technology, is the model coefficient, and and are the indices of the driving forces of population, economy, and science and technology, respectively.
Based on the STIRPAT equation and the specific conditions of Jiangsu Province, this study categorized the influencing factors of civil building energy consumption into three types: population, economic development, and science and technology. Thirteen influencing factors were screened from these three types, as detailed in Table 2.

Table 2.
Selection of influencing factors.
This study extracted the annual time-series data of all influencing factors between 2004 and 2022 from the “Jiangsu Statistical Yearbook” [50]. In analyzing correlations between the variables, GRA exhibits superior performance, especially with small sample sizes and irregular data [51]. The basic idea is to determine the degree of correlation by comparing the geometric shape similarity of the curves formed by the data series [52]. The energy consumption of civil buildings in Jiangsu Province was taken as the reference sequence, and the 13 influencing factors were the comparative sequences. To reduce the sensitivity to minor differences and improve the robustness and interpretability of the model, the resolution coefficient was set to 0.7 [53]. After the initial value processing of the data, grey correlation degrees were calculated. The results are shown in Table 3. We also conducted a sensitivity analysis on the resolution coefficient , which indicated that when varies between 0.1 and 0.9, the ranking of the 13 influencing factors remains consistent.

Table 3.
Calculation results and ranking of grey correlation.
The strength of correlation between energy consumption and its influencing factors can be quantitatively assessed through a grey relational degree analysis. A grey relational degree ranging from 0.8 to 1.0 indicates a statistically significant strong correlation, while values between 0.6 and 0.8 suggest a moderate correlation, and coefficients below 0.6 demonstrate a weak correlation [54]. Six influencing factors with grey relational degrees greater than 0.8 were retained for the subsequent model research and accuracy analysis.
The data of the six selected influencing factors are presented using descriptive statistics in Table 4.

Table 4.
Descriptive statistics of influencing factors.
3.3. Prediction Based on the WT-SVR-ELM Hybrid Model
The energy consumption data spanning the period 2004–2022 were selected as the target time series for forecasting. The wavelet basis function used was the Daubechies 4 wavelet. In the research field of decomposing energy consumption sequences using wavelet transformation, the Daubechies 4 wavelet has been widely applied and has been proven to have excellent performance [55,56,57]. Its compact support enables the effective localization of transient features, while its four vanishing moments allow for the efficient capture and separation of underlying complex nonlinear trends within the signal. This combination of properties optimally balances the time–frequency resolution for this type of energy consumption series. Using the Mallat algorithm, the data were decomposed into a trend sequence and a fluctuation sequence .
Figure 5 shows the two components after a single level of decomposition. The sequence captures the long-term trend information of civil building energy consumption, which has increased from 6415 in 2004 to 30,087 in 2022. The sequence ranges from −793 to 787, reflecting the high-frequency fluctuation information of the data.
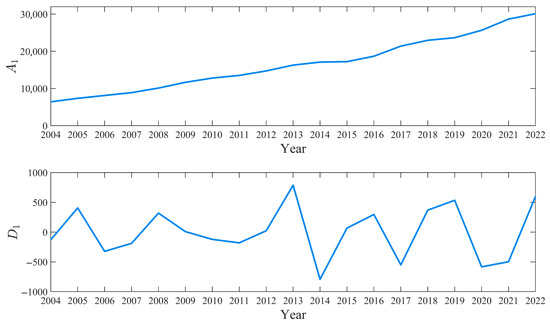
Figure 5.
Results of wavelet decomposition.
For the trend sequence , the SVR model was used for prediction. The data of the six influencing factors selected in Section 3.2 were used as inputs, and the energy consumption data were set as the output. The data were divided into two parts: a training set (2004–2018) and a testing set (2019–2022). The SVR model was trained with a Gaussian kernel, and the optimization ranges for the penalty coefficient and the kernel width were set to and , respectively.
The Particle Swarm Optimization (PSO) algorithm was employed to identify the optimal combination of and . To robustly estimate model performance during optimization and mitigate overfitting to the training set, the fitness function was defined as the MAPE calculated using Leave-one-out cross-validation (LOOCV) on the training set. In LOOCV, the model is iteratively trained on all but one data point from the training set and validated on the left-out point. This process is repeated for each data point in the training set, and the final evaluation metrics are averaged across all iterations.
The PSO algorithm was configured with the parameters in Table 5. After PSO optimization, the optimal hyperparameters identified were = 99.729 and = 0.513. The results of the LOOCV are shown in Table 6 and the predictive outcomes of sequence are shown in Figure 6.

Table 5.
PSO parameter setting.

Table 6.
Prediction errors of on different datasets.
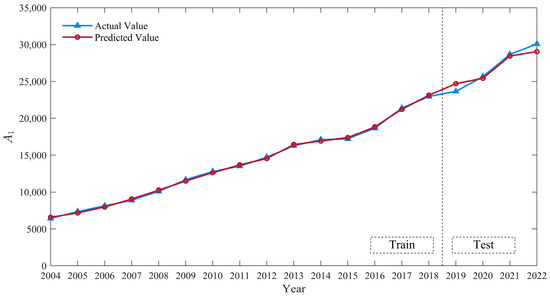
Figure 6.
Predictive outcomes of .
For the fluctuation sequence , the ELM model was employed for prediction. To achieve this, the time step and the number of hidden layer nodes needed to be determined. Given the limited number of samples, the model is susceptible to overfitting, thus requiring careful adjustment of the parameters and . Considering the periodic information in Figure 5 and the constraints on the number of samples, the range of was set to [3, 8] and the range of was set to [1, 8]. In machine learning, when the data contain true values close to zero, using the MAPE as an evaluation metric can lead to numerical instability and even extreme values [58], such as when the denominator approaches zero, causing the percentage error to tend towards infinity. In such cases, the MAPE should be avoided in favor of more robust metrics. Therefore, the MAE was used as the evaluation metric for the model. We allocated 70% of as the training set and 30% as the testing set, and employed a grid search to optimize and . To evaluate the model performance without data leakage, expanding window cross-validation (EWCV) was adopted. This method is particularly robust for time-series data as it mimics real-world forecasting scenarios: the training set grows incrementally while the validation set remains in the future. The result of the EWCV is shown in Table 7. The cross-validation MAE was minimized when the time step and the number of hidden layer nodes . Based on these optimal parameters, the best ELM model for predicting was established. The predictive outcomes of sequence are shown in Figure 7.

Table 7.
Prediction errors of on different datasets.
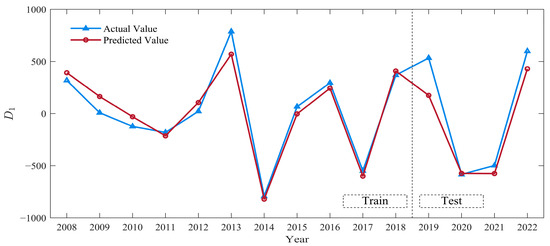
Figure 7.
Predictive outcomes of .
The prediction results of from the SVR model and the prediction results of from the ELM model were combined through wavelet reconstruction to obtain the final prediction of civil building energy consumption, as presented in Table 8.

Table 8.
Prediction results of WT-SVR-ELM hybrid model.
To validate the prediction performance of the proposed WT-SVR-ELM hybrid model, we conducted additional predictions using the SVR, ELM, MA-SVR-ELM, and EMD-SVR-ELM models for civil building energy consumption. Table 9 presents the errors of predictions using the SVR and ELM models and two other hybrid models for the civil building energy consumption of Jiangsu Province.

Table 9.
Errors of different models.
As shown in Table 9, the errors of the single prediction models SVR and ELM are the highest. Compared with the single prediction models, the errors of MA-SVR-ELM and EMD-SVR-ELM have been reduced, which verifies the necessity of sequence decomposition for energy consumption prediction. The MAPE of the WT-SVR-ELM hybrid model is reduced by 0.56% and 1.01% compared to the MA-SVR-ELM and EMD-SVR-ELM models, respectively. Additionally, the MAE and RMSE of the WT-SVR-ELM model are significantly lower than other models. These results indicate that the WT-SVR-ELM hybrid model achieves higher accuracy in predicting civil building energy consumption. The superior performance of the WT-SVR-ELM model originates from its capacity to decompose and reconstruct the time series through wavelet analysis, thereby separating the underlying complex relationships within the data. By employing different models for different sequences, the WT-SVR-ELM model integrates the strengths of SVR and ELM. The combination of these two models effectively enhances the ability to handle complex nonlinear relationships, thereby improving prediction accuracy. Therefore, the WT-SVR-ELM model demonstrates stronger robustness and greater potential for application in such complex prediction tasks.
3.4. Scenario Analysis
3.4.1. Scenario Parameter Setting
Considering the current economic and social development status of Jiangsu Province, three scenarios were set: baseline, high-speed development, and low-speed development. For each influencing factor, the scenario parameters were configured as follows:
(1) PCE and PDI: According to the “Outline of the 14th Five-Year Plan and Long-Range Objectives Through the Year 2035 for the National Economic and Social Development of Jiangsu Province” [59] and “the 14th Five-Year Plan for Promoting Consumption in Jiangsu Province” [60], the Jiangsu Provincial Government has established clear targets for the 14th Five-Year Plan period. These include an average annual GDP growth rate of approximately 5.5%, an average annual growth rate exceeding 6% in the total retail sales of consumer goods, and an average annual growth rate of around 5.5% in per capita consumption expenditures. Meanwhile, to further promote income growth, the average annual growth rate of per capita disposable income is consistent with the GDP growth rate. Therefore, the baseline growth rate for both per capita consumption expenditure and per capita disposable income was set at 5.5%.
(2) PGDP: Per capita GDP is influenced by both economic and demographic factors. In recent years, population aging in Jiangsu Province has been continuously intensifying, and the growth of the resident population has slowed down. However, with the advancement of population policies such as attracting talents and easing the conditions for household registration, the total resident population in Jiangsu Province is projected to stabilize. In the baseline scenario, we assumed that the growth rate of per capita GDP is 5.5%.
(3) NHA: With the improvement in people’s living standards, the consumption of various household appliances has also grown rapidly. From 2004 to 2022, the number of common household appliances per 100 households in Jiangsu Province increased from 580.0 to 1179.2, with an average annual growth rate of 4.12%. Thus, the baseline growth rate of 4.0% was taken for the number of common household appliances.
(4) PFSRB: A historical data analysis revealed that the per capita floor space of residential building in Jiangsu Province has exhibited subdued growth in recent years, particularly averaging only 1.44% annually from 2020 to 2022. The per capita floor space of residential buildings is projected to maintain a gradual upward trajectory, prompting our adoption of a 1.5% baseline annual growth rate for the scenario analysis.
(5) UR: “The 14th Five-Year Plan for New-Type Urbanization in Jiangsu Province” [61] envisions that the urbanization rate will rise to approximately 80% in 2035, while the urbanization rate in Jiangsu Province has already reached 75% in 2023. Given the above data, the baseline growth rate for the urbanization rate was configured at 0.5%.
The growth rates of each influencing factor in the high-speed development scenario and the low-speed development scenario were obtained by adjusting the baseline growth rates upward or downward by a certain percentage. The specific growth rate settings are presented in Table 10.

Table 10.
Setting of influencing factor change rates.
3.4.2. Discussion of Scenario Analysis
The prediction results for civil building energy consumption under three scenarios are shown in Figure 8. Scenarios 1 to 3 refer to the baseline scenario, the high-speed development scenario, and the low-speed development scenario, respectively. As illustrated in the figure, in all three scenarios, the energy consumption of civil buildings peaks in 2023 and subsequently shows a downward trend. Notably, in Scenario 2, while the economy grows faster than in the baseline scenario, energy consumption drops more rapidly. In Scenario 3, due to the relatively slow speed of development, the energy consumption remains high for a brief period and then slowly declines after 2023. By 2030, the energy consumption of civil buildings is expected to be between 19,154 ktce and 23,498 ktce. The civil building energy consumption does not follow a simple linear growth trajectory with the development of the economy and society. Instead, it shows an inverted U-shaped trend. This phenomenon can be interpreted through the Environmental Kuznets Curve (EKC) [62,63]. The EKC indicates that in the early stages of economic development, the expansion of economic scale will intensify both resource consumption and pollutant emissions, consequently deteriorating the environmental quality. With the further development of the economy, technological progress will enhance the efficiency of resource utilization and reduce pollution emissions per unit of output, thereby improving the environmental quality [64].
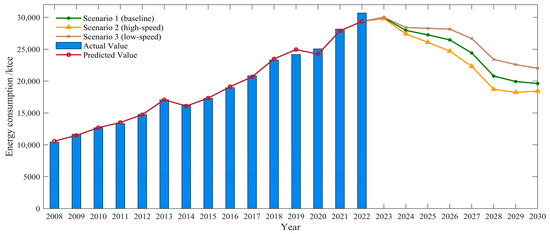
Figure 8.
Scenario prediction results.
The observed inverted U-shaped relationship emerges from several interconnected factors. First, Jiangsu’s economic advancement has enabled stricter energy conservation policies in the construction sector, facilitating the widespread adoption of energy-efficient technologies and robust institutional support for sustainable buildings. Second, increased per capita income and expanded residential space have fundamentally altered consumption patterns, as evidenced by the proliferation of high-efficiency appliances and smart home systems that reduce discretionary energy use. Third, accelerated urbanization has encouraged centralized energy infrastructure development, diminishing dependence on decentralized energy sources. This relationship highlights the pivotal role of energy conservation and technological innovation in economic development, offering critical implications for future policy making and energy planning.
Jiangsu Province is an important economic province in China. Its economic scale, industrial structure, and urbanization level all rank among the top in the country. The energy consumption of civil buildings in Jiangsu Province not only reflects the current status of energy utilization in economically developed regions but also illustrates the energy demand characteristics associated with high-density urbanization and high living standards. The inverted U-shaped relationship between energy consumption and economic development also holds true in specific regions and industries, providing empirical evidence for other provinces. Other provinces can draw on the experience of Jiangsu Province, adapt policies to local circumstances, and formulate scientific and rational energy conservation and emission reduction measures to promote coordinated economic and environmental development.
4. Conclusions
This study proposes a novel hybrid model, combining wavelet transform, SVR, and ELM, which demonstrates superior accuracy in forecasting civil building energy consumption. Leveraging the proposed hybrid model, we predict the civil building energy consumption from 2023 to 2030 under three different scenarios. The conclusions drawn from this study were as follows:
- (1)
- By using the GRA, 6 key factors were screened out from 13 factors influencing the civil building energy consumption. They are per capita consumption expenditure, per capita disposable income, number of common household appliances, per capita GDP, per capita floor space of residential building, and urbanization rate. The selected factors exert a substantial influence on the accuracy and predictive performance of the hybrid model.
- (2)
- The MAPE of the WT-SVR-ELM hybrid model is 1.37%, which is 1.81% and 1.37% lower than that of the conventional SVR and ELM single models, respectively. This indicates that the hybrid model has significant superiority in forecasting the civil building energy consumption.
- (3)
- Applying the WT-SVR-ELM model to forecast civil building energy consumption (2023–2030) revealed a peak value in 2023, followed by a consistent decline through 2030. The civil building energy consumption of Jiangsu Province exhibits an inverted U-shaped trajectory consistent with the EKC theory amid sustained economic growth. This trend emphasizes the vital role of technological progress and policy regulation in social development, and holds important guiding significance for future policy-making and energy planning. Drawing on the experience of Jiangsu Province, other provinces can further promote energy efficiency standards, encourage the use of renewable energy, optimize the structure of energy consumption, and facilitate the adoption of energy conservation technologies in the construction industry in order to reduce the energy consumption of civil buildings and contribute to the realization of the “dual carbon” goals.
- (4)
- Although the WT-SVR-ELM model presents with exceptional performance, it can still be enhanced and refined in the future. Given the relatively small dataset used in this study and the observation that higher-level decompositions yielded no significant accuracy improvements while increasing the computational complexity, we employed only a single-level decomposition. In the case of larger datasets, a multi-level decomposition of the series can be considered to further capture the complex relationships within the time series. In addition, the calculation of transportation energy consumption employed a fixed-percentage approach derived from existing studies, which may not accurately capture how transportation energy consumption changes over time. Future research could explore incorporating broader data sources and more precise calculation methods. Finally, in terms of the selection of influencing factors, other factors that have influences on energy consumption, such as climatic conditions and equipment energy efficiency, can be investigated to achieve higher accuracy in the model.
Supplementary Materials
The following supporting information can be downloaded at https://www.mdpi.com/article/10.3390/math13142293/s1.
Author Contributions
Conceptualization, X.C.; Formal analysis, X C. and J.M.; Methodology, X.C.; Visualization, X.C. and Z.S.; Writing—original draft, X.C., J.M., and Z.S.; Writing—review and editing, X.C. and J.M.; Data curation, J.M. and Z.S.; Formal analysis, X.C. and J.M.; Software, X.C.; Validation, J.M.; Supervision, X.G.; Project administration, X.G.; Resources, X.G. All authors have read and agreed to the published version of the manuscript.
Funding
This research received no external funding.
Data Availability Statement
The original contributions presented in this study are included in the Supplementary Materials. Further inquiries can be directed to the corresponding authors.
Conflicts of Interest
The authors declare no conflicts of interest.
References
- Liu, X.; Wang, X.; Meng, X. Carbon Emission Scenario Prediction and Peak Path Selection in China. Energies 2023, 16, 2276. [Google Scholar] [CrossRef]
- China Association of Building Energy Efficiency. Research Report on Building Energy Consumption and Carbon Emissions in China (2023). Constr. Archit. 2024, 2, 46–59. [Google Scholar]
- Ehrlich, P.R.; Holdren, J.P. Impact of Population Growth: Complacency Concerning This Component of Man’s Predicament Is Unjustified and Counterproductive. Science 1971, 171, 1212–1217. [Google Scholar] [CrossRef] [PubMed]
- Dietz, T.; Rosa, E.A. Effects of Population and Affluence on CO2 Emissions. Proc. Natl. Acad. Sci. USA 1997, 94, 175–179. [Google Scholar] [CrossRef]
- Lei, F.; Yan, Y.; Yue, Y.; Bi, W.; Ni, P. The Pathway of Regional Carbon Peak in Building Sector: A Case Study of Central China. J. Build. Eng. 2023, 80, 108031. [Google Scholar] [CrossRef]
- Ciulla, G.; D’Amico, A. Building Energy Performance Forecasting: A Multiple Linear Regression Approach. Appl. Energy 2019, 253, 113500. [Google Scholar] [CrossRef]
- Meng, P.; Shen, J.; Shen, C.; Li, J.; Kang, J.; Li, T. Construction Engineering in China under Green Transition: Policy Research Topic Clusters and Development Forecasts. Energy Build. 2024, 323, 114758. [Google Scholar] [CrossRef]
- Ferbar Tratar, L.; Strmčnik, E. The Comparison of Holt–Winters Method and Multiple Regression Method: A Case Study. Energy 2016, 109, 266–276. [Google Scholar] [CrossRef]
- Champahom, T.; Banyong, C.; Janhuaton, T.; Se, C.; Watcharamaisakul, F.; Ratanavaraha, V.; Jomnonkwao, S. Deep Learning vs. Gradient Boosting: Optimizing Transport Energy Forecasts in Thailand through LSTM and XGBoost. Energies 2025, 18, 1685. [Google Scholar] [CrossRef]
- Tso, G.K.F.; Yau, K.K.W. Predicting Electricity Energy Consumption: A Comparison of Regression Analysis, Decision Tree and Neural Networks. Energy 2007, 32, 1761–1768. [Google Scholar] [CrossRef]
- Wang, Z. Building Thermal Load Prediction through Shallow Machine Learning and Deep Learning. Appl. Energy 2020, 263, 114683. [Google Scholar] [CrossRef]
- Luo, C.; Gao, Y.; Jiang, Y.; Zhao, C.; Ge, H. Predictive modeling of carbon emissions in Jiangsu Province’s construction industry: An MEA-BP approach. J. Build. Eng. 2024, 86, 108903. [Google Scholar] [CrossRef]
- Liu, Z.; Yu, J.; Feng, C.; Su, Y.; Dai, J.; Chen, Y. A Hybrid Forecasting Method for Cooling Load in Large Public Buildings Based on Improved Long Short Term Memory. J. Build. Eng. 2023, 76, 107238. [Google Scholar] [CrossRef]
- Mishra, A.; Lone, H.R.; Mishra, A. DECODE: Data-Driven Energy Consumption Prediction Leveraging Historical Data and Environmental Factors in Buildings. Energy Build. 2024, 307, 113950. [Google Scholar] [CrossRef]
- Kourentzes, N.; Barrow, D.; Petropoulos, F. Another Look at Forecast Selection and Combination: Evidence from Forecast Pooling. Int. J. Prod. Econ. 2019, 209, 226–235. [Google Scholar] [CrossRef]
- Wang, X.; Hyndman, R.J.; Li, F.; Kang, Y. Forecast Combinations: An over 50-Year Review. Int. J. Forecast. 2023, 39, 1518–1547. [Google Scholar] [CrossRef]
- Lyu, X.; Yin, K.; Li, X. Grey Multivariate Variable Weight Combination Prediction Model and Its Application. Stat. Decis. 2022, 38, 25–29. [Google Scholar] [CrossRef]
- Wu, D.; Lu, B.; Xu, Z. Price Forecasting of Marine Fish Based on Weight Allocation Intelligent Combinatorial Modelling. Foods 2024, 13, 1202. [Google Scholar] [CrossRef]
- Wang, H.; Wei, Z.; Fang, T.; Xie, Q.; Li, R.; Fang, D. Carbon Emissions Prediction Based on the GIOWA Combination Forecasting Model: A Case Study of China. J. Clean. Prod. 2024, 445, 141340. [Google Scholar] [CrossRef]
- Guo, X.; Yin, X.; Zhang, Y. The Analysis Method of Seasonal Index Number of Time Sequence of Seasonal Fluctuation. J. Appl. Stat. Manag. 2000, 6, 60–64. [Google Scholar] [CrossRef]
- Rojo, J.; Rivero, R.; Romero-Morte, J.; Fernández-González, F.; Pérez-Badia, R. Modeling Pollen Time Series Using Seasonal-Trend Decomposition Procedure Based on LOESS Smoothing. Int. J. Biometeorol. 2017, 61, 335–348. [Google Scholar] [CrossRef] [PubMed]
- Yuzgec, U.; Dokur, E.; Balci, M. A Novel Hybrid Model Based on Empirical Mode Decomposition and Echo State Network for Wind Power Forecasting. Energy 2024, 300, 131546. [Google Scholar] [CrossRef]
- Chen, J.; Li, S.; Zhu, J.; Liu, M.; Li, R.; Cui, X.; Li, L. Significant Wave Height Prediction Based on Variational Mode Decomposition and Dual Network Model. Ocean Eng. 2025, 323, 120533. [Google Scholar] [CrossRef]
- Sanchez-Vazquez, M.J.; Nielen, M.; Gunn, G.J.; Lewis, F.I. Using Seasonal-Trend Decomposition Based on Loess (STL) to Explore Temporal Patterns of Pneumonic Lesions in Finishing Pigs Slaughtered in England, 2005–2011. Prev. Vet. Med. 2012, 104, 65–73. [Google Scholar] [CrossRef]
- Mallat, S.G. A Theory for Multiresolution Signal Decomposition: The Wavelet Representation. IEEE Trans. Pattern Anal-Ysis Mach. Intell. 1989, 11, 674–693. [Google Scholar] [CrossRef]
- Alipour, M.; Aghaei, J.; Norouzi, M.; Niknam, T.; Hashemi, S.; Lehtonen, M. A Novel Electrical Net-Load Forecasting Model Based on Deep Neural Networks and Wavelet Transform Integration. Energy 2020, 205, 118106. [Google Scholar] [CrossRef]
- Fan, G.; Li, J.; Peng, L.; Huang, H.; Hong, W. The Bi-Long Short-Term Memory Based on Multiscale and Mesoscale Feature Extraction for Electric Load Forecasting. Appl. Soft Comput. 2024, 162, 111853. [Google Scholar] [CrossRef]
- Agyemang, E.F. A Gaussian Process Regression and Wavelet Transform Time Series Approaches to Modeling Influenza a. Comput. Biol. Med. 2025, 184, 109367. [Google Scholar] [CrossRef]
- Liu, X.; Wang, X. Research on High Frequency Data Forecasting of Stock Index Futures Market Based on Wavelet Analysis. Syst. Eng.-Theory Pract. 2015, 35, 1425–1432. [Google Scholar]
- Li, S.; Goel, L.; Wang, P. An Ensemble Approach for Short-Term Load Forecasting by Extreme Learning Machine. Appl. Energy 2016, 170, 22–29. [Google Scholar] [CrossRef]
- Balogun, A.-L.; Rezaie, F.; Pham, Q.B.; Gigović, L.; Drobnjak, S.; Aina, Y.A.; Panahi, M.; Yekeen, S.T.; Lee, S. Spatial Prediction of Landslide Susceptibility in Western Serbia Using Hybrid Support Vector Regression (SVR) with GWO, BAT and COA Algorithms. Geosci. Front. 2021, 12, 101104. [Google Scholar] [CrossRef]
- Wang, C.; Li, M.; Yan, J. Forecasting Carbon Dioxide Emissions: Application of a Novel Two-Stage Procedure Based on Machine Learning Models. J. Water Clim. Change 2023, 14, 477–493. [Google Scholar] [CrossRef]
- Wang, N.; Xie, M.; Deng, J.; Liu, M.; Li, J.; Wang, Y.; Liu, S. Mid-Long Term Temperature-Lowering Load Forecasting Based on Combination of Support Vector Machine and Multiple Regression. Power Syst. Prot. Control 2016, 44, 92–97. [Google Scholar]
- Gao, Z.; Liu, B.; Crupi, G.; Cai, J. Hyperparameter Optimized SVR Model Based on Particle Swarm Algorithm for RF Power Transistors. Int. J. Numer. Model. Electron. Netw. Devices Fields 2025, 38, e70013. [Google Scholar] [CrossRef]
- Zhang, Z.; Hong, W.-C. Application of Variational Mode Decomposition and Chaotic Grey Wolf Optimizer with Support Vector Regression for Forecasting Electric Loads. Knowl.-Based Syst. 2021, 228, 107297. [Google Scholar] [CrossRef]
- Fan, G.; Yu, M.; Dong, S.; Yeh, Y.; Hong, W. Forecasting Short-Term Electricity Load Using Hybrid Support Vector Regression with Grey Catastrophe and Random Forest Modeling. Util. Policy 2021, 73, 101294. [Google Scholar] [CrossRef]
- Deng, G.; Chen, H. Research on Short-Term Air Quality Prediction Based on Unequal Weight Clustering Hybrid PSO-SVR. Oper. Res. Manag. Sci. 2023, 32, 106–111. [Google Scholar]
- Huang, G.; Zhu, Q.; Siew, C. Extreme Learning Machine: Theory and Applications. Neurocomputing 2006, 70, 489–501. [Google Scholar] [CrossRef]
- Chen, W.; Chen, X.; Lin, Y. Homogeneous Ensemble Extreme Learning Machine Autoencoder with Mutual Representation Learning and Manifold Regularization for Medical Datasets. Appl. Intell. 2023, 53, 15476–15495. [Google Scholar] [CrossRef]
- Shi, S.; Liu, B.; Ren, L.; Liu, Y. Short Time Solar Power Forecasting Using P-ELM Approach. Sci. Rep. 2024, 14, 30999. [Google Scholar] [CrossRef]
- Xu, Z.; Gao, X.; Fu, J.; Li, Q.; Tan, C. A Novel Fault Diagnosis Method under Limited Samples Based on an Extreme Learning Machine and Meta-Learning. J. Taiwan Inst. Chem. Eng. 2024, 161, 105522. [Google Scholar] [CrossRef]
- Wang, Z.; Wei, Y.; Wang, S. Forecasting the Carbon Price of China’s National Carbon Market: A Novel Dynamic Interval-Valued Framework. Energy Econ. 2025, 141, 108107. [Google Scholar] [CrossRef]
- Zhang, C.; Bian, X.; Liu, P.; Tan, X.; Fan, Q.; Liu, W.; Lin, L. Subagging for the Improvement of Predictive Stability of Extreme Learning Machine for Spectral Quantitative Analysis of Complex Samples. Chemom. Intell. Lab. Syst. 2017, 161, 43–48. [Google Scholar] [CrossRef]
- Zhang, B.; Liu, W.; Cai, Y.; Zhou, Z.; Wang, L.; Liao, Q.; Fu, Z.; Cheng, Z. State of Health Prediction of Lithium-Ion Batteries Using Particle Swarm Optimization with Levy Flight and Generalized Opposition-Based Learning. J. Energy Storage 2024, 84, 110816. [Google Scholar] [CrossRef]
- Cai, W.; Wei, H.; Wang, X.; Li, X. Building Energy Consumption Measurement Data Differences and Causes. Heat. Vent. Air Cond. 2017, 47, 35–39. [Google Scholar] [CrossRef]
- National Bureau of Statistics. China Energy Statistical Yearbook; China Statistics Press: Beijing, China, 2023. [Google Scholar]
- Standardization Administration of the People’s Republic of China. General Rules for Calculation of the Comprehensive Energy Consumption(GB/T 2589-2020); Standards Press of China: Beijing, China, 2020. [Google Scholar]
- Gu, L.; Yu, C. Analysis of the current situation of building energy consumption data and energy consumption statistics issues in China. Energy China 2011, 33, 38–41. [Google Scholar] [CrossRef]
- Wang, Q. Terminal energy consumption and energy efficiency in China calculated in accordance with international standards. Energy China 2006, 12, 5–9. [Google Scholar]
- Jiangsu Provincial Bureau of Statistics. Jiangsu Province Statistical Yearbook 2023; China Statistics Press: Beijing, China, 2023. [Google Scholar]
- Jin, Y.; Sharifi, A.; Li, Z.; Chen, S.; Zeng, S.; Zhao, S. Carbon Emission Prediction Models: A Review. Sci. Total Environ. 2024, 927, 172319. [Google Scholar] [CrossRef]
- Liu, S.; Cai, H.; Yang, Y.; Cao, Y. Advance in grey incidence analysis modelling. Syst. Eng. Theory Pract. 2013, 33, 2041–2046. [Google Scholar] [CrossRef]
- Chen, L.; Pan, Y.; Zhang, D. Prediction of Carbon Emissions Level in China’s Logistics Industry Based on the PSO-SVR Model. Mathematics 2024, 12, 1980. [Google Scholar] [CrossRef]
- Huang, Y.; Shen, L.; Liu, H. Grey Relational Analysis, Principal Component Analysis and Forecasting of Carbon Emissions Based on Long Short-Term Memory in China. J. Clean. Prod. 2019, 209, 415–423. [Google Scholar] [CrossRef]
- Wang, M.; Qi, T. Application of wavelet neural network on thermal load forecasting. Int. J. Wirel. Mob. Comput. 2013, 6, 608–614. [Google Scholar] [CrossRef]
- Fang, C.; Gao, Y.; Ruan, Y. Improving Forecasting Accuracy of Daily Energy Consumption of Office Building Using Time Series Analysis Based on Wavelet Transform Decomposition. IOP Conf. Ser. Earth Environ. Sci. 2019, 294, 012031. [Google Scholar] [CrossRef]
- Gong, M.; Wang, J.; Bai, Y.; Li, B.; Zhang, L. Heat Load Prediction of Residential Buildings Based on Discrete Wavelet Transform and Tree-Based Ensemble Learning. J. Build. Eng. 2020, 32, 101455. [Google Scholar] [CrossRef]
- Hyndman, R.J.; Koehler, A.B. Another Look at Measures of Forecast Accuracy. Int. J. Forecast. 2006, 22, 679–688. [Google Scholar] [CrossRef]
- The People’s Government of Jiangsu Province. Outline of the 14th Five-Year Plan and Long-Range Objectives Through the Year 2035 for the National Economic and Social Development in Jiangsu Province. Available online: https://www.jiangsu.gov.cn/art/2021/3/2/art_46143_9684719.html (accessed on 7 May 2025).
- General Office of the Jiangsu Provincial People’s Government. The 14th Five-Year Plan for Promoting Consumption in Jiangsu Province. Available online: https://www.jiangsu.gov.cn/art/2021/8/23/art_46144_9984126.html (accessed on 7 May 2025).
- General Office of the Jiangsu Provincial People’s Government. The 14th Five-Year Plan for New-Type Urbanization in Jiangsu Province. Available online: https://www.jiangsu.gov.cn/art/2021/8/25/art_46144_9987995.html (accessed on 7 May 2025).
- Kar, A.K. Environmental Kuznets Curve for CO2 Emissions in Baltic Countries: An Empirical Investigation. Environ. Sci. Pollut. Res. 2022, 29, 47189–47208. [Google Scholar] [CrossRef]
- Rasheed, M.; Liu, J. Unraveling the Environmental Kuznets Curve: Interplay between CO2 Emissions, Economic Development, and Energy Consumption. Environ. Sci. Pollut. Res. 2024, 31, 13372–13391. [Google Scholar] [CrossRef]
- Wang, Z.; Li, Q. Modelling the Nonlinear Relationship between CO2 Emissions and Economic Growth Using a PSO Algorithm-Based Grey Verhulst Model. J. Clean. Prod. 2019, 207, 214–224. [Google Scholar] [CrossRef]
Disclaimer/Publisher’s Note: The statements, opinions and data contained in all publications are solely those of the individual author(s) and contributor(s) and not of MDPI and/or the editor(s). MDPI and/or the editor(s) disclaim responsibility for any injury to people or property resulting from any ideas, methods, instructions or products referred to in the content. |
© 2025 by the authors. Licensee MDPI, Basel, Switzerland. This article is an open access article distributed under the terms and conditions of the Creative Commons Attribution (CC BY) license (https://creativecommons.org/licenses/by/4.0/).