1. Introduction
The mental health of college students has gradually become a hot topic of concern for researchers in psychology, sociology, and medicine. Mental stress is a contributing factor to human diseases, especially depression and cardiovascular disease [
1,
2,
3]. There are generally two traditional methods for measuring mental stress: one is through questionnaire surveys, and the other is through wearable devices.
The traditional mental survey method uses authoritative scales for investigation. Commonly used scales in psychology include Stress Response Questionnaire (SRQ) compiled by Jiang Qianjin [
4] and Symptom Checklist-90 (SCL-90) [
5]. Many studies use scales to measure the mental state of college students. For example, Moeller [
6] used the Depression Anxiety Stress Scale-21 (DASS-21) [
7] to assess depression, anxiety, and stress. Their composite DASS score was used to better capture the overall picture of mental health experiences. Wenjuan Gao [
8] used DASS-21 to examine gender differences in depression, anxiety, and stress among college students over four academic years and to explore possible anxiety-related factors among students. However, college students often conceal their personal mental state when filling out questionnaires, which is inconsistent with the actual situation, resulting in low accuracy.
Considering the limitations of questionnaires for assessing mental stress, the researchers used wearable stress measurement devices to assess the subjects’ mental state. For example, N. Rashid [
9] used wrist-worn devices and chest-worn devices, respectively, to obtain an electrocardiogram, blood volume pulse (BVP), electrodermal activity (EDA), and other data to conduct mental stress detection. Barki [
10] designed an ear-worn photoplethysmography (PPG) system to detect mental stress. However, this in-ear measurement instrument will cause discomfort to the subjects. In summary, there are still limitations to using wearable devices to measure mental stress, mainly because individuals are often unwilling to wear sensors for monitoring and the sensors used for data collection may cause physical discomfort to the subjects.
Due to the invasive and disruptive nature of sensors, research on mental stress assessment has begun to use low-invasive smart sensing devices. For example, Park [
11] used a smartphone-based ecological moment assessment method to study the association between park use, physical activity, and psychological stress. They found that both daily park use and leisure time physical activity were associated with lower levels of psychological stress. Piskioulis [
12] used accelerometer and gyroscope sensors in smartphones to detect user emotions. He designed a prototype gaming app to monitor the sensor data of users as they interact with the game. This method may waste part of the user’s time and is not very efficient. Wang [
13] viewed the mental stress assessment problem as a classification problem and used a collaborative training method to extract 26 dimensional features for experiments, which may cause feature redundancy.
While intelligent perception technologies, such as machine learning and computer vision, offer promising capabilities for assessing mental stress, there is a lack of comprehensive integration of these technologies with existing mental stress assessment tools, such as the Mental Stress Scale. Research is needed to explore how intelligent perception data can be effectively incorporated into the Mental Stress Scale to enhance the accuracy and reliability of stress assessment.
This article is different from existing intelligent perception data research methods. Based on the Cognitive Phenomenological-Transactional Model (CPT) [
14], it analyzes the mental stress scale and extracts relevant features in a targeted manner. The intelligent perception data in this paper are obtained by the mobile phone sensor. Using SRQ and SCL-90 scale, we search for four aspects related to the scale and extract a total of 35 dimensional features. When selecting features, information gain and Gini index are further used to screen suitable ones. Among them, 11 dimensional features work better in various models. In this study, the acquisition of mental stress assessment data was transformed from the subject’s subjective self-report to the use of intelligent sensing devices to assess mental stress states. This method can save time and overcome the shortcomings of a traditional subjective questionnaire diagnosis.
The research contributions of this article are in the following aspects:
- (1)
Based on the mental stress scale, the research direction shifted from subjects’ filling into intelligent perception and objective collection, making the data objective and non-invasive.
- (2)
This article only uses 11 dimensional features for prediction and training, reducing data redundancy and interference items. The listed feature items work better in a variety of machine learning models.
- (3)
We use the SHAP model to conduct an interpretable assessment of the impact of 11 dimensional characteristics on mental stress to promote the research work of relevant practitioners.
The overall structure of this article is as follows: In
Section 2, we describe the data sets and methods used in this article. Feature extraction, feature screening, model building, training model, and model evaluation are introduced successively. In
Section 3, we use the SHAP model to explain the model results. In
Section 4, we discuss where we can continue to improve the method in the future.
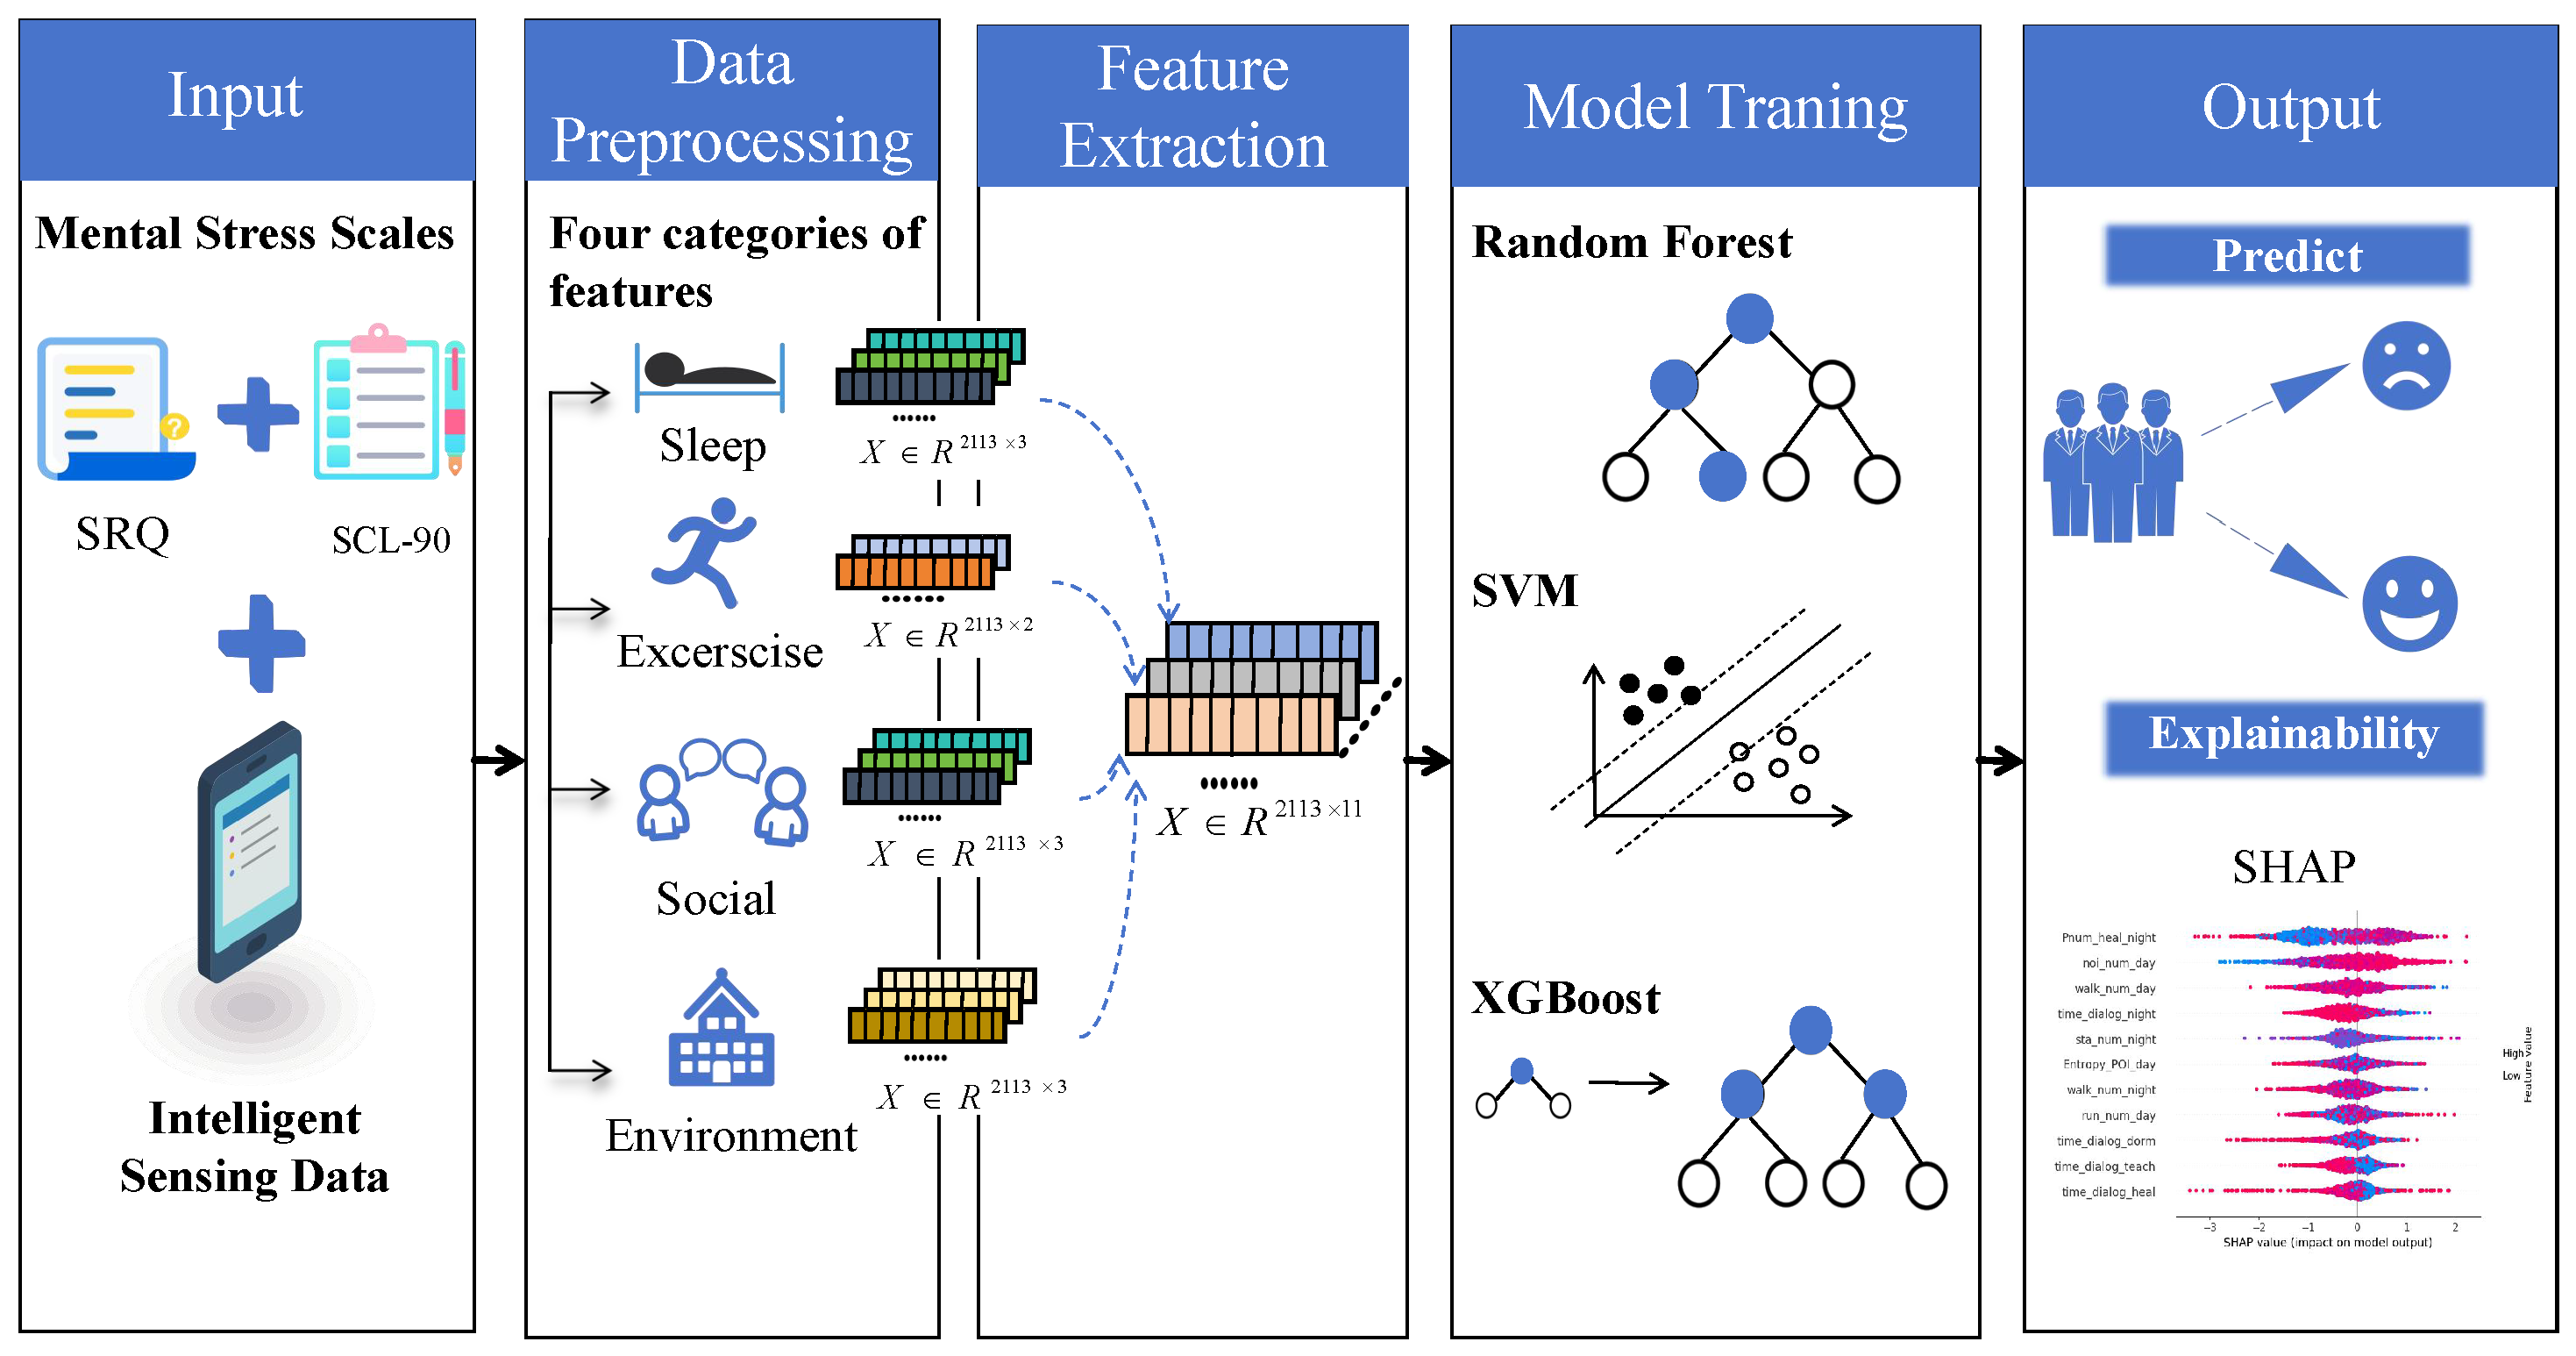
Figure 1 shows the intelligent perception-driven research flow chart.
2. Materials and Methods
First, we integrated factors delineated in the Stress Reaction Questionnaire (SRQ) [
4] and the Symptom Checklist-90 (SCL-90) [
15] to analyze sensory data collected from smartphones. Then, we identified specific feature categories for extraction, encompassing sleep, exercise, social interactions, and environmental influences. After that, a meticulous feature selection process was undertaken to ensure the relevance of the chosen features to mental stress. In the model training stage, the selected features were inputted into classic machine learning models. Ultimately, this model produced predictions of mental stress levels. To enhance the model’s interpretability, we employed the Shapley additive explanations (SHAP) model to dissect the contribution of each feature to the predictive outcomes.
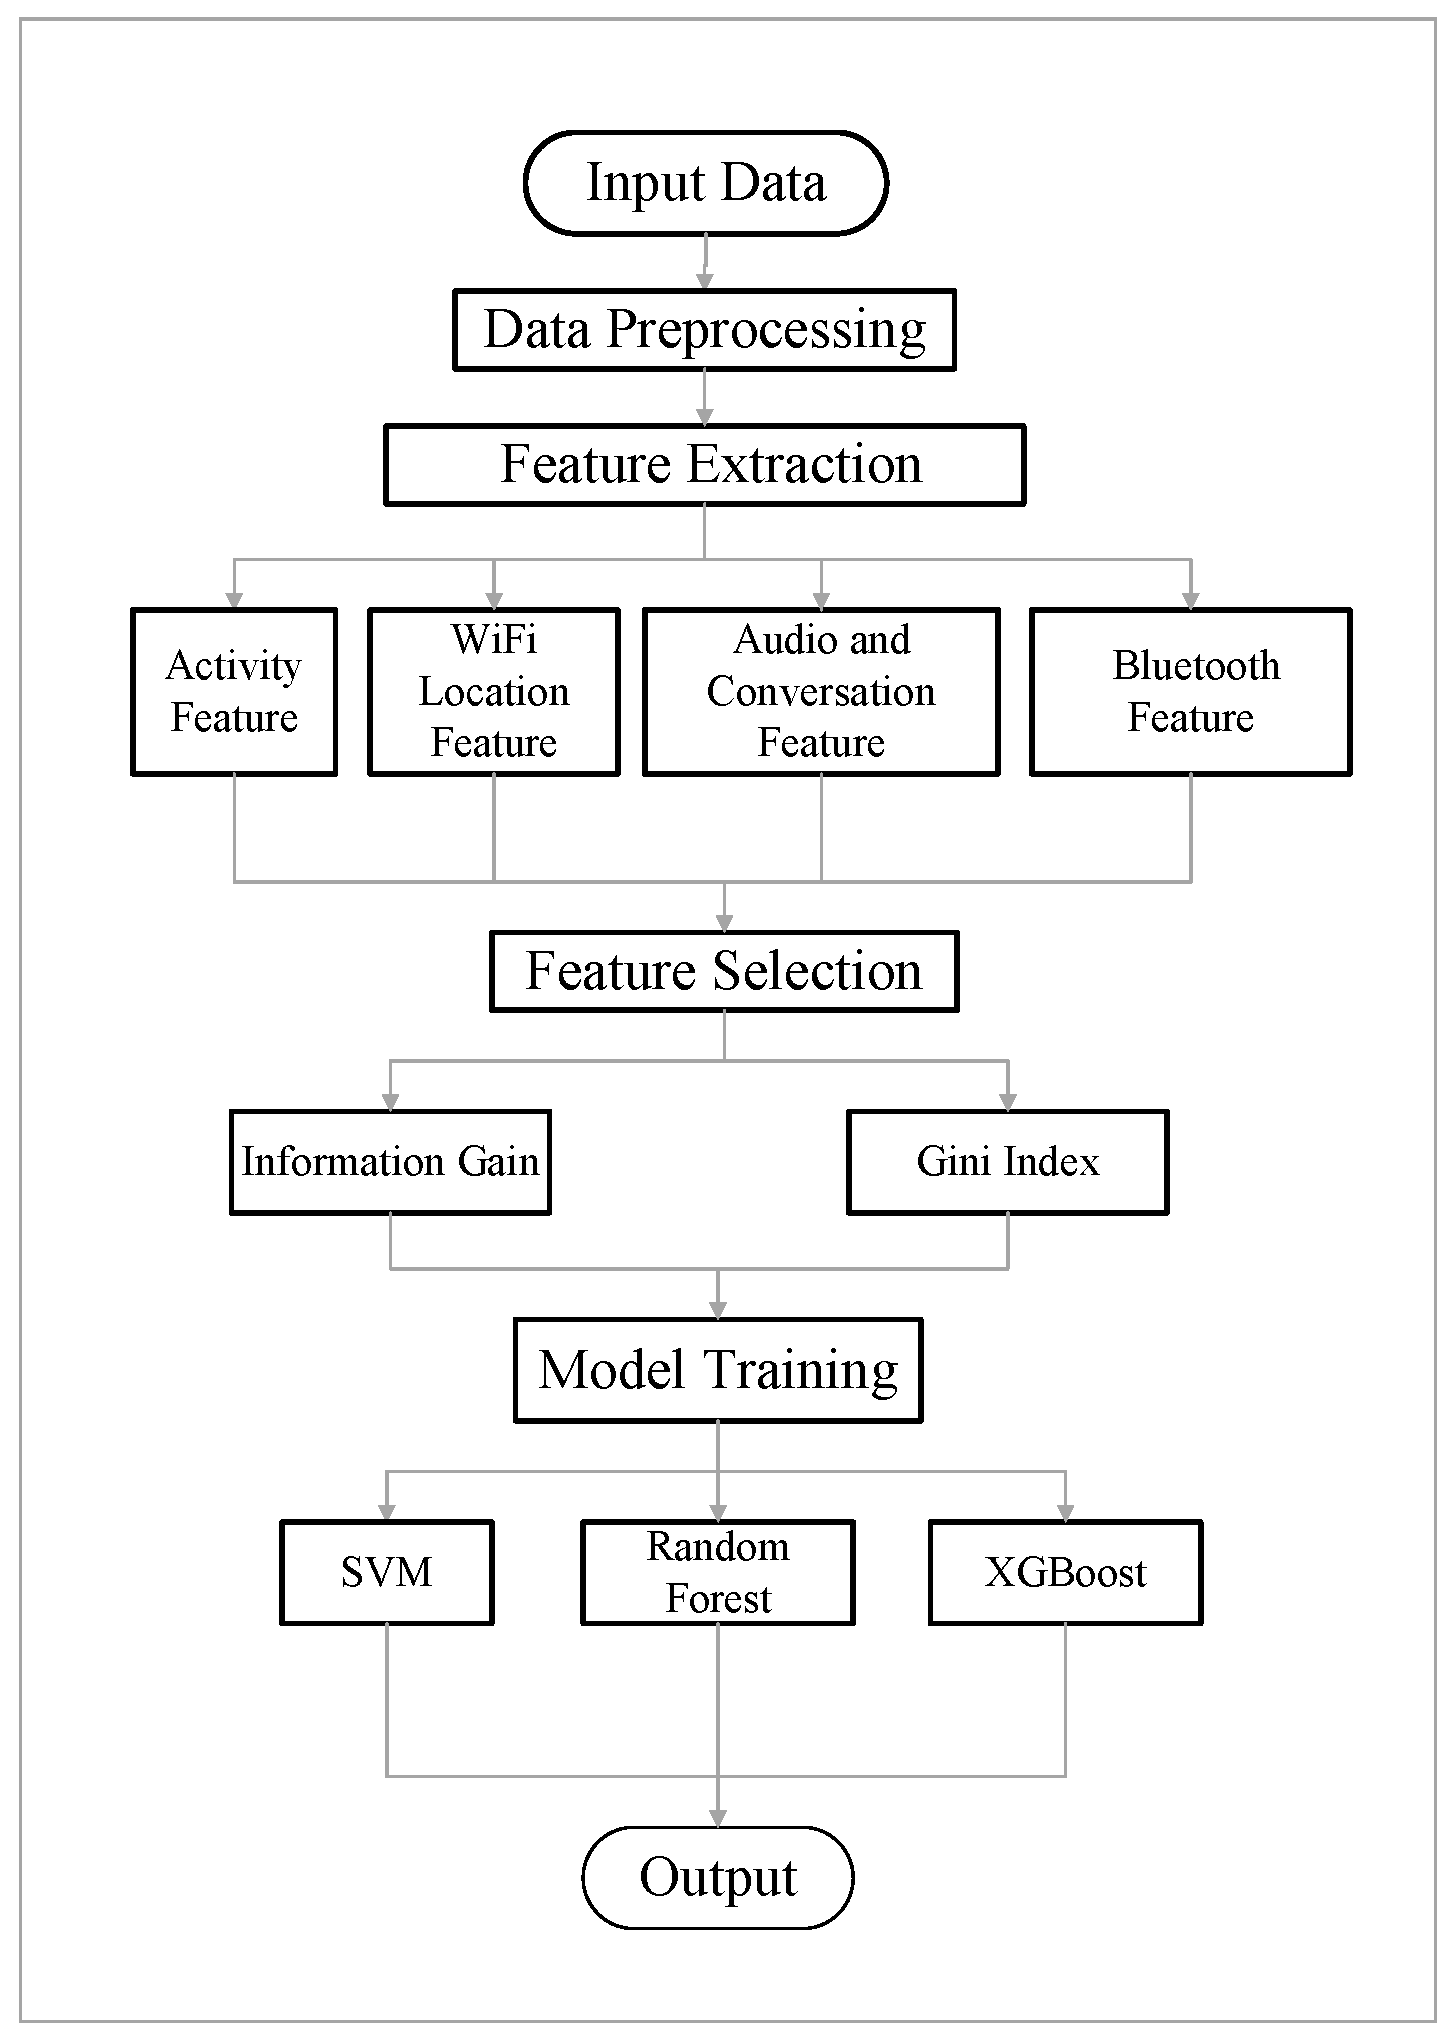
Figure 2 shows the flow chart of the algorithm.
2.1. Data Preprocessing
SRQ reflects three dimensions: mental response, physical physiological response, and behavioral response. SCL-90 has a total of 90 items, covering a wide range of psychiatric symptomatology content, and is analyzed from ten aspects including feelings, emotions, thinking, consciousness, behavior, living habits, interpersonal relationships, diet, and sleep. Some of these answers can be answered by data measured by smart sensors. For example, question 22,
Sleep is worse than before, and question 17,
Too lazy to move, in the Stress Response Questionnaire (SRQ) consider the subject’s sleep and exercise status. Question 13,
Fear of open places or streets, collects preferences of where subjects tend to go. We summarize the measurement issues of the above scales into four aspects, namely sleep, exercise, social interaction, and environment. Then, we replace the subjective data filled out by the subjects with data obtained through intelligent sensing devices. To further demonstrate the effectiveness of this classification in assessing mental stress, we conducted experimental validation using the Studentlife dataset [
16].
The open data set Studentlife (
https://studentlife.cs.dartmouth.edu/, accessed on 13 September 2014) is a data set obtained by the research team of Dartmouth College in 2013 in the Studentlife Study application. They collected data on smartphones from college students during their on-campus life for 70 days, which included sensor data, EMA (Ecological Momentary Assessment) data, survey responses, and education data. It includes over 53 GB of continuous data, 32,000 self-reports, and post-mortem surveys. This data set meets the requirements of the research. This article uses sensor data and EMA data from the Studentlife dataset. A total of 2113 pieces of data were used to train the model. There are ten types of sensor data in total, and this article selects five types of data for analysis, namely, Activity, WiFi location, Audio, Conversation, and Bluetooth. EMA data include mental stress conditions filled in by users every day. In the dataset, stressful situations reported by users are recorded as stressful labels, and other situations are recorded as non-stress labels.
In the sensor data, time-related data are converted to the time in the New York time zone in the United States. The smartphone sensor collection time is a continuous recording and timing collection from the beginning to the end of the experiment. Because the frequency of activities during the day and night is different, 24 h are divided into daytime (8:00 a.m.–18:00 p.m.) and night (18:00 p.m.–8:00 a.m.).
2.2. Feature Extraction
Using SRQ and SCL-90 as a basis, we identified specific categories of features extracted, including sleep, exercise, social interaction, and environmental impact. A total of 35 dimensions of features are extracted, of which 6 dimensions are extracted from the Activity part, 16 dimensions from the Audio and Conversation part, and 5 dimensions from the Bluetooth part.
2.2.1. Activity Feature Extraction
It can be seen from question 17 of the Stress Response Questionnaire (SRQ), titled
Too lazy to move, that the scale focuses on the subject’s physical activity. The extraction of motion dimension features discussed in this article is based on Activity data collected in response to the scale questions. The scale takes into account the impact of physical activity on stress, and relevant studies have been conducted to verify its significance. Nightingale et al. [
17] examined the bidirectional relationship between physical activity and momentary stress in college students and found that sedentary behavior was positively associated with reports of momentary stress. In the Activity part, a total of six dimensional features are extracted from the Activity data component, which encompasses the frequency of stillness, walking, and running during the day, as well as stillness, walking, and running at night.
2.2.2. WiFi Location Feature Extraction
The Cognitive Phenomenological-Transactional Model (CPT) theory of stress model [
14] emphasizes that individual stress is related to specific places and times. Therefore, location data information were selected for extraction. The frequent activity areas of college students include teaching buildings, dormitories, extracurricular activity areas, etc. The length of activity in these different areas is different, which has a corresponding impact on stress. In the original data, researchers are not allowed to release WiFi AP (Access Point) deployment information to the public, only relevant location information. This article divides the location based on the Dartmouth map and divides it into three areas: teaching area, living area, and extracurricular activity area. The teaching area includes all places for teaching activities or learning, such as teaching buildings, laboratories, academic exchange halls, etc.; the living area includes dormitories; the extracurricular activity area includes art areas, playgrounds, etc., as shown in
Table 1.
Using WiFi location data, we extracted the time college students spent in various areas and analyzed the characteristics of their stay durations during both daytime and nighttime. We derived 8 dimensional features from the WiFi location data. To address the distribution issue of multi-category data, we introduced entropy [
18]. By dividing the locations in the data set, the entropy values of the three regional distributions can be obtained.
2.2.3. Audio and Conversation Feature Extraction
Research results by Zhang L and others [
19] show that mental stress is negatively correlated with sleep quality. There exists a robust correlation between sleep quality and mental stress, indicating that the gray matter volume of the bilateral inferior temporal gyrus plays a pivotal role in enhancing sleep quality. Schmickler and others [
20] found that mental stress is an important predictor of sleep quality, and high levels of mental stress put college students at risk for poor sleep quality. Entering the university environment is characterized by academic burden and irregular work and rest times, which may cause sleep difficulties due to mental stress. The degree of quietness at night is related to sleep conditions. A noisy environment will lead to poor sleep quality and shorten sleep time, which will have a negative impact on college students’ academic performance, quality of life, and mental health. In the Studentlife dataset, they used the audio classifier to collect the Audio part of the data. Audio classifier working settings: After 1 min of audio inference, there is a pause for 3 min, then it restarts. If the audio classifier detects a sound, it will continue operating until the sound ceases. Audio inferences are generated every 2 to 3 s, with one of four possible outcomes. The four outcomes are Silence, Sound, Noise, and Unknown. Since the unknown state cannot determine the specific situation, this article extracts a total of 6 dimensional features from the Audio part of the data, which are the number of silences, voices, and noises during the day, and silences, voices, and noises at night.
De Melo Jardim [
21] found that self-efficacy and social skills moderated the relationship between stress and academic adjustment. Therefore, in the conversation part, combined with the division of WiFi location, this article extracts the features of the duration and frequency of meetings during both daytime and nighttime within the three areas and calculates the total session duration and number of sessions during the day and night. A total of 10 dimensional features were extracted. We employed conversational traits to mirror the social situation of college students.
2.2.4. Bluetooth Feature Extraction
From question 13 of the SCL-90 scale, Afraid of empty places or streets, and question 70, Feeling uncomfortable in crowded places such as stores or movie theaters, it can be seen that the places where users stay every day reflect their emotional state. The user’s mobile phone Bluetooth device can provide an estimate of the density of the environment, and the number of devices can reflect the density of the environment. We extract 5 dimensional features in Bluetooth, including the number of scans of Bluetooth in three different areas, as well as the number of scans during the day and night.
Observing the numerical range of the 35 dimensional features, we found that the data are highly volatile, and all non-entropy features need to be normalized. In this process, one is added to the eigenvalue, followed by taking the base-ten logarithm, normalization, and subsequent removal of unlabeled mental pressure data and the data labeled as 0 in the three motion states.
2.3. Feature Selection
The feature screening used in this article is to select the most representative 11 dimensions from the above 35 dimensional features. In order to select features with strong importance and influence, the information gain and Gini index between features are used as research references.
2.3.1. Information Gain
We define the information gain of attribute A on data set
D as InfoGain(
D|
A), which is abbreviated as Info and is equal to the entropy of D itself, minus the conditional entropy of D under the condition of given
A.
Among them,
A = [
,
, …,
], a total of
K values. We calculate the information gain after the introduction of each attribute and select the attribute that brings the largest information gain to
D, which is the optimal partitioning.
2.3.2. Gini Index
The Gini coefficient (Gini(X)) [
22] reflects the inconsistent classification of any two samples within the branch.
The smaller the Gini coefficient, the purer the classification, so the attribute with the smallest Gini coefficient is selected as the optimal dividing attribute. When training an XGboost model, the importance of features is calculated. Combining the above three feature selection criteria, a total of 11 dimensional features were screened out. Based on the practical significance and theoretical support reflected by the features, the 11 dimensions of features are divided into four categories, and abbreviations of feature names are provided, as shown in
Table 2.
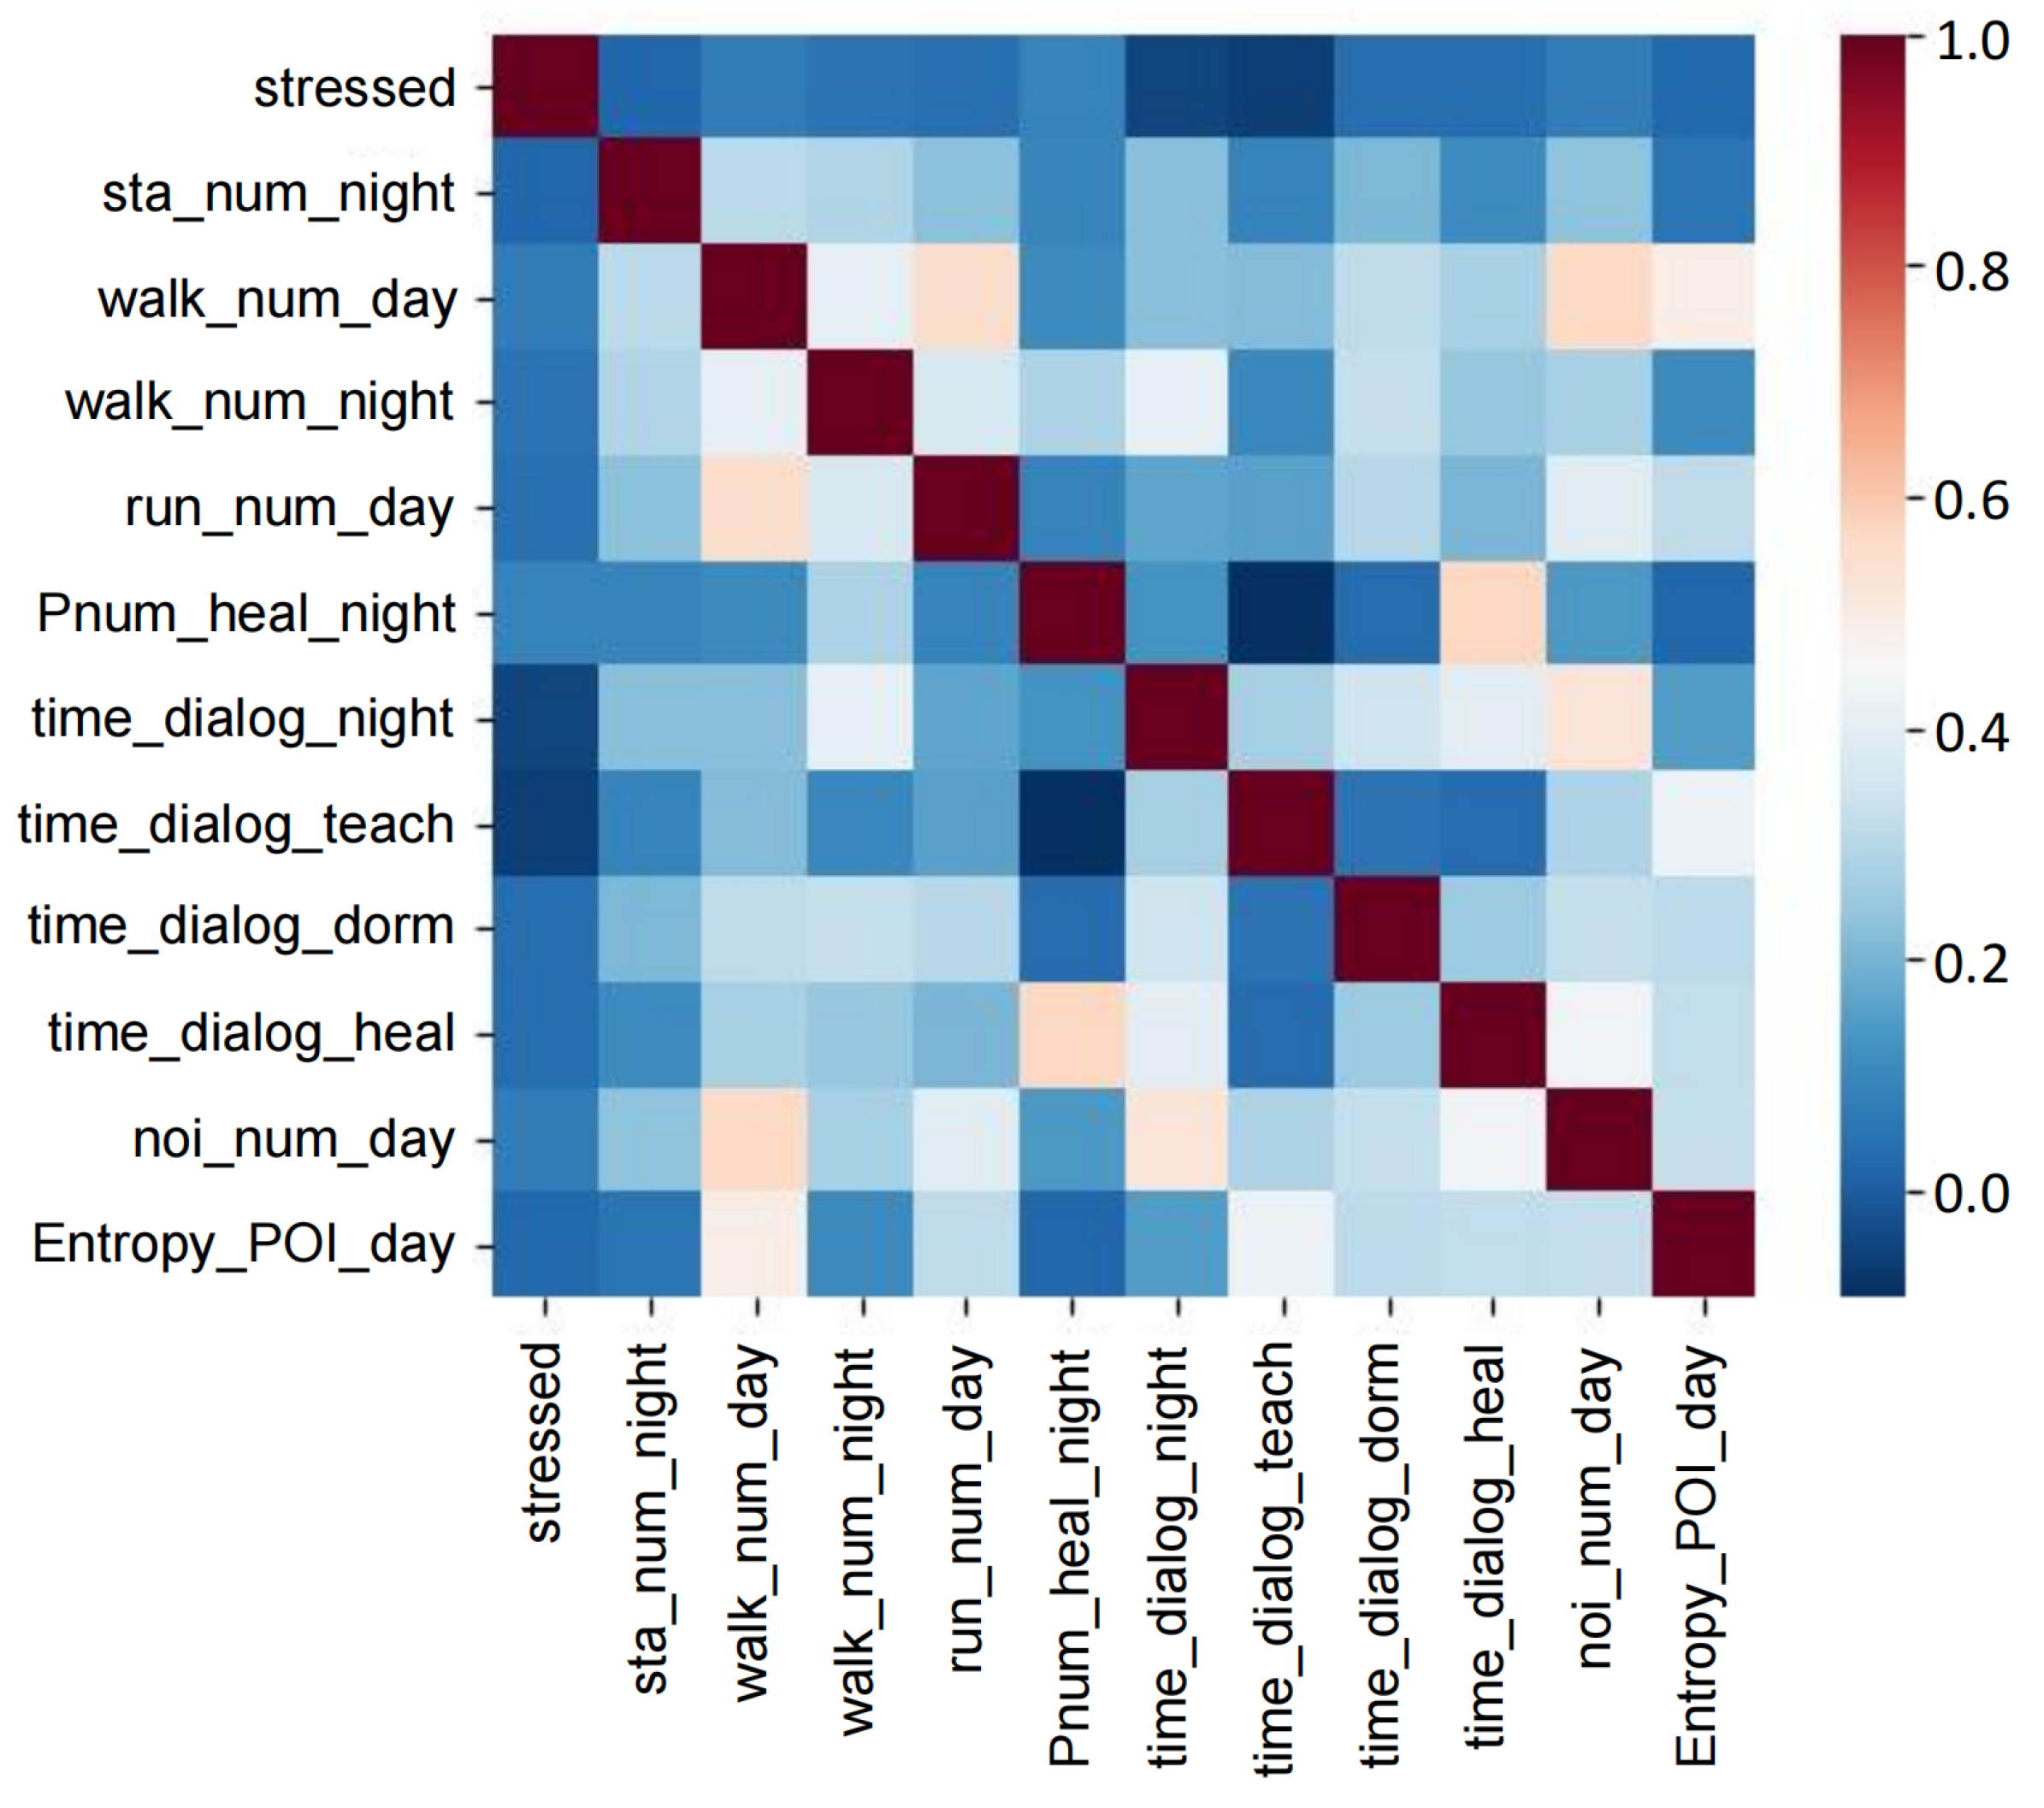
We calculated the correlation coefficient of the 11 dimensional features, as shown in
Figure 3. It can be seen from the heat map that the correlation between features is not high, indicating that the feature redundancy is low and meets the requirements for research.
2.4. Model Building
The problem studied in this article can be regarded as a binary classification problem. Gedam [
23] found that among the various machine learning classifiers used in previous papers, random forests and SVM were found to be the most efficient, with better results than other classifiers. So, we use two classic models of machine learning, which are SVM and random forest. XGBoost (eXtreme Gradient Boosting) is based on the Gradient Boosting Decision Trees (GBDT) algorithm [
24] and makes a series of improvements. Therefore, this article also uses the XGBoost model for training. The support vector machine (SVM) [
25] was first proposed by Cortes in 1964. The SVM adds a regularization term in the solution to optimize the structural risk, which is a classifier with sparsity and robustness. This article chooses the widely used kernel function Sigmoid as the SVM kernel function. The sigmoid kernel formula is shown in the fourth formula.
The random forest model [
26] is a classification algorithm proposed by Breiman and Leo in 2001. We integrate multiple weak classifiers to form a strong classifier. When there is a classification imbalance, random forest can provide an effective method to balance the error of the data set and also has strong anti-interference ability.
XGBoost (eXtreme Gradient Boosting) [
27] is an ensemble of a set of classification regression trees. The XGBoost model draws on the practice of random forest and supports column sampling, which can not only reduce overfitting but also reduce the amount of calculation. This is also a feature that distinguishes XGBoost from traditional GBDT.
2.5. Model Evaluation Metrics
We utilized Precision, Recall, Accuracy, and F-measures (F1) as evaluation indicators to assess the performance of the model. The positive category means that there is pressure, and the negative category means that there is no pressure. There are 4 types of results separated by the classifier, namely
TP (True Positive),
FP (False Positive),
TN (True Negative), and
FN (False Negative).
F1 takes
Precision and
Recall into consideration.
3. Evalutaion
This article employed ten-fold cross-validation to randomly partition the data into 10 subsets, with 9 subsets allocated for training and 1 for testing. We employ the ADASY (Adaptive Synthetic Oversampling) [
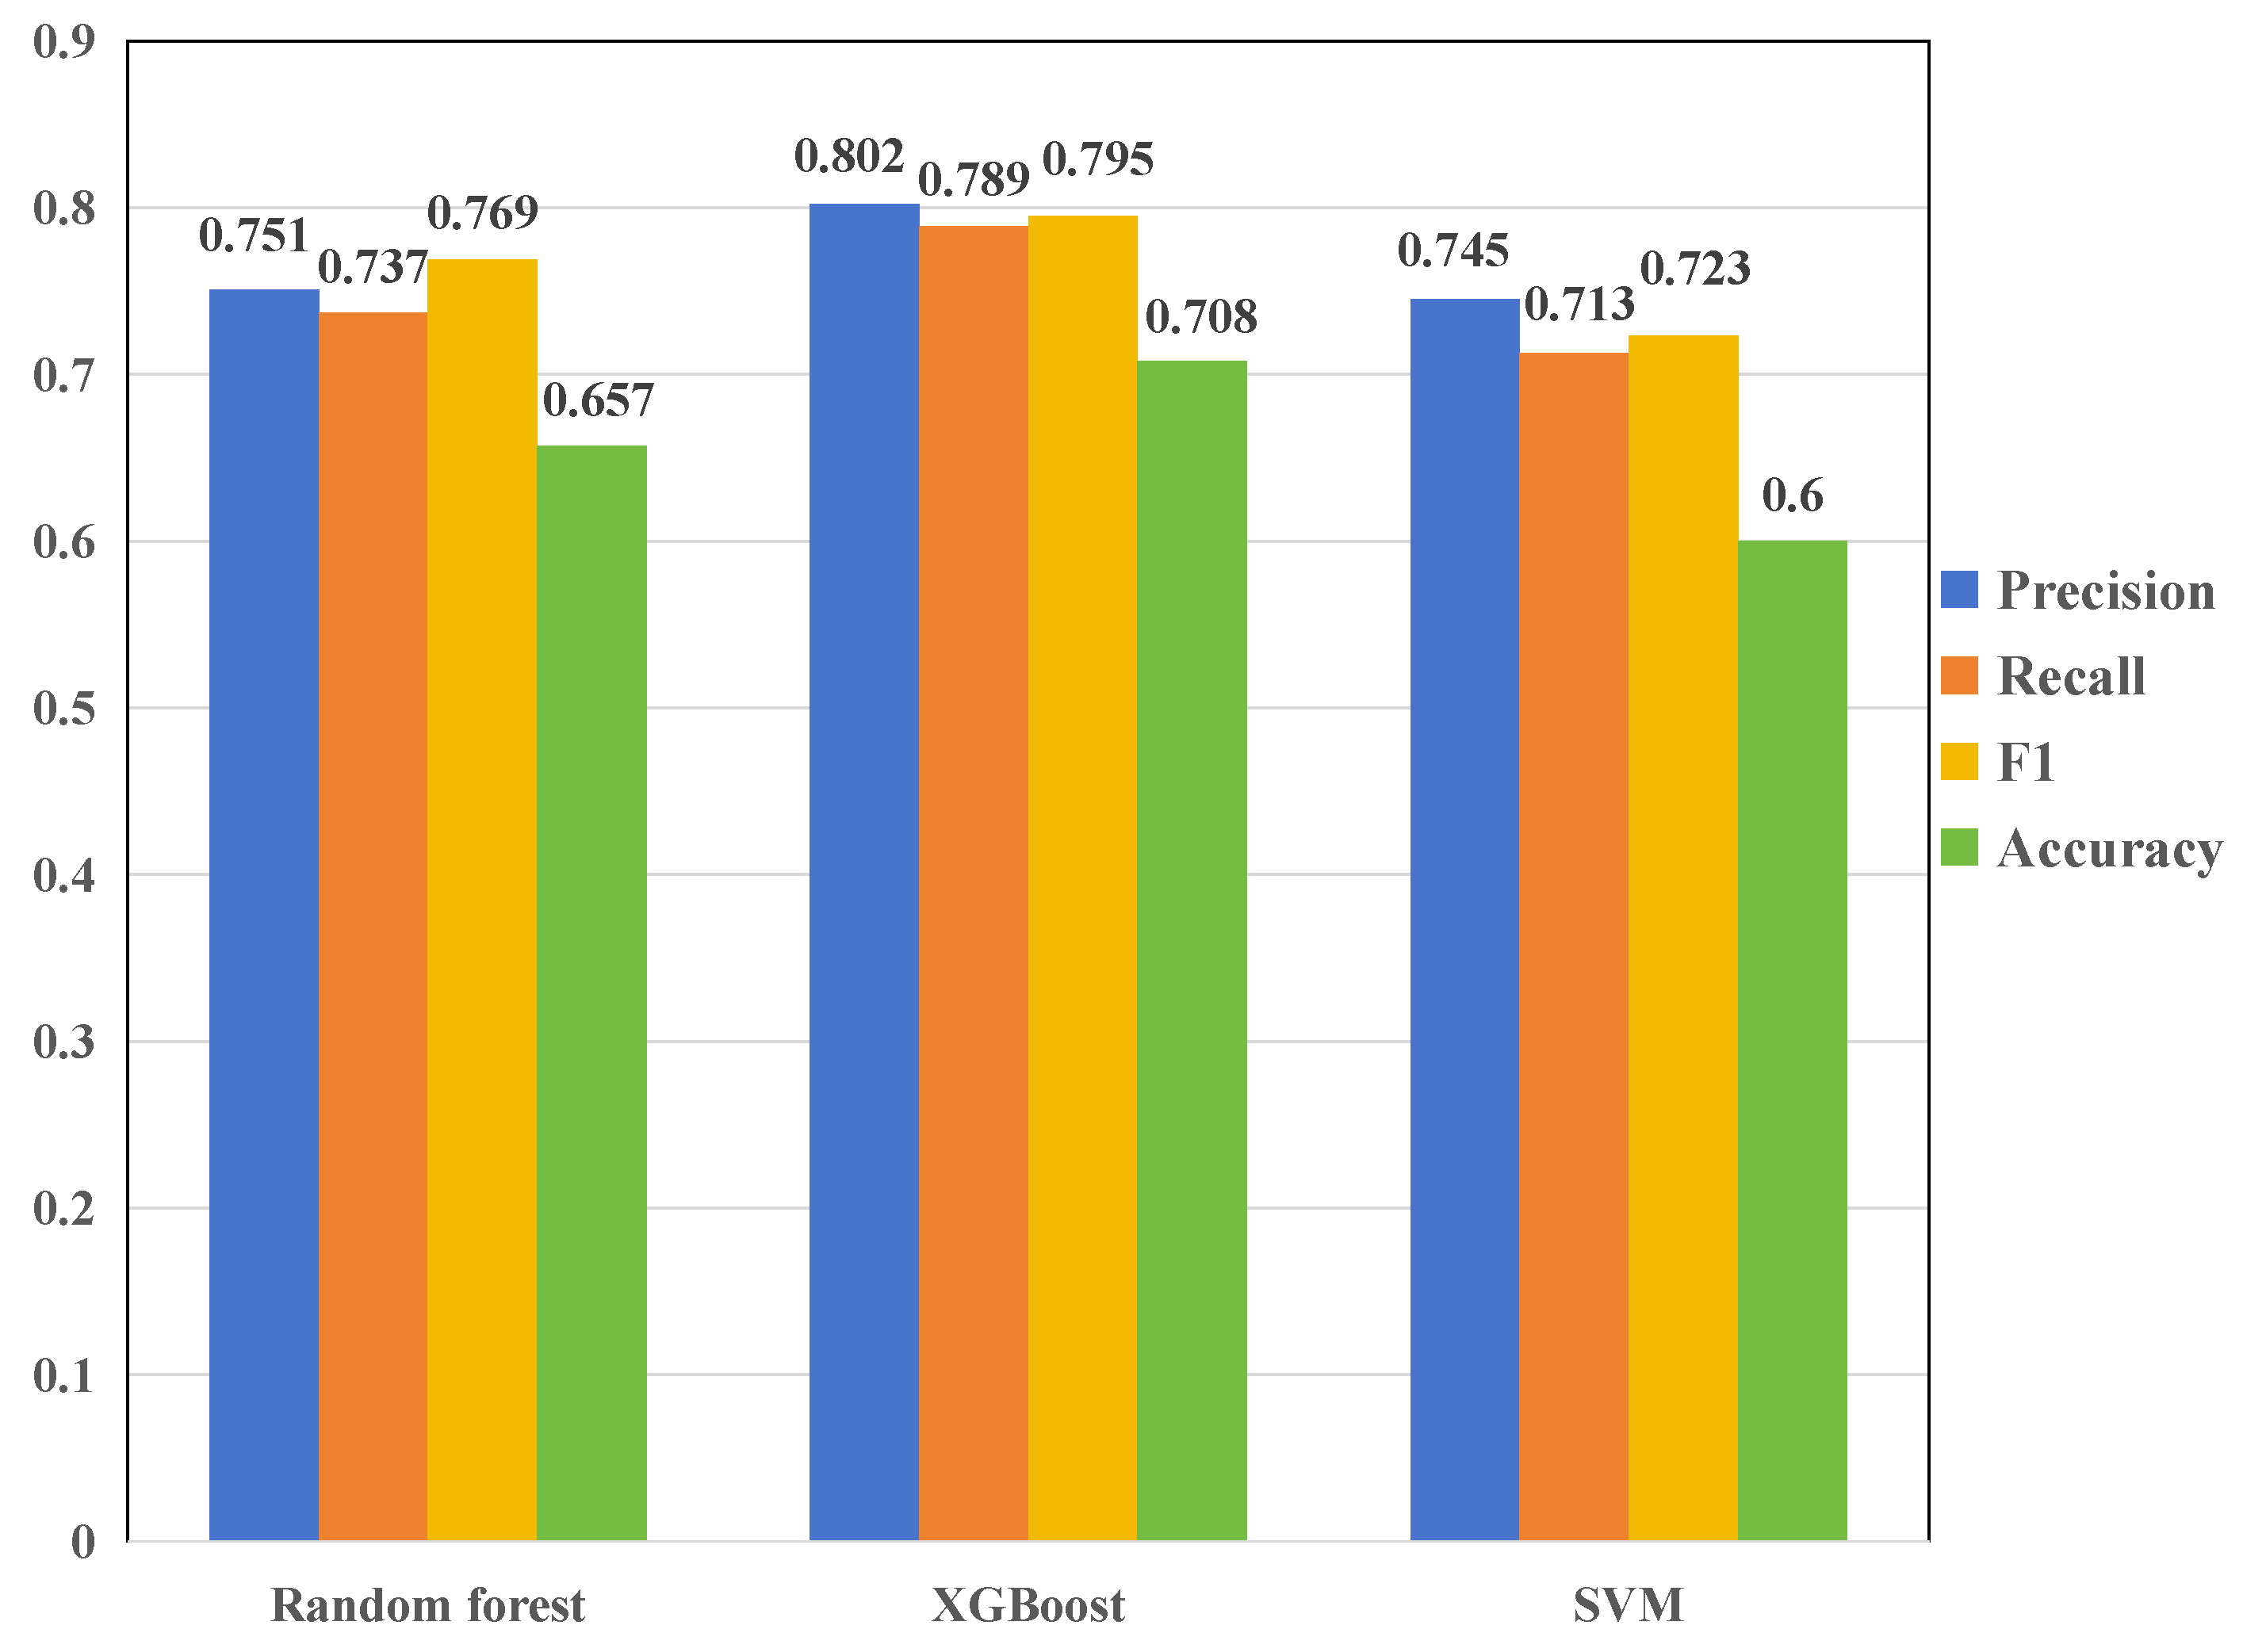
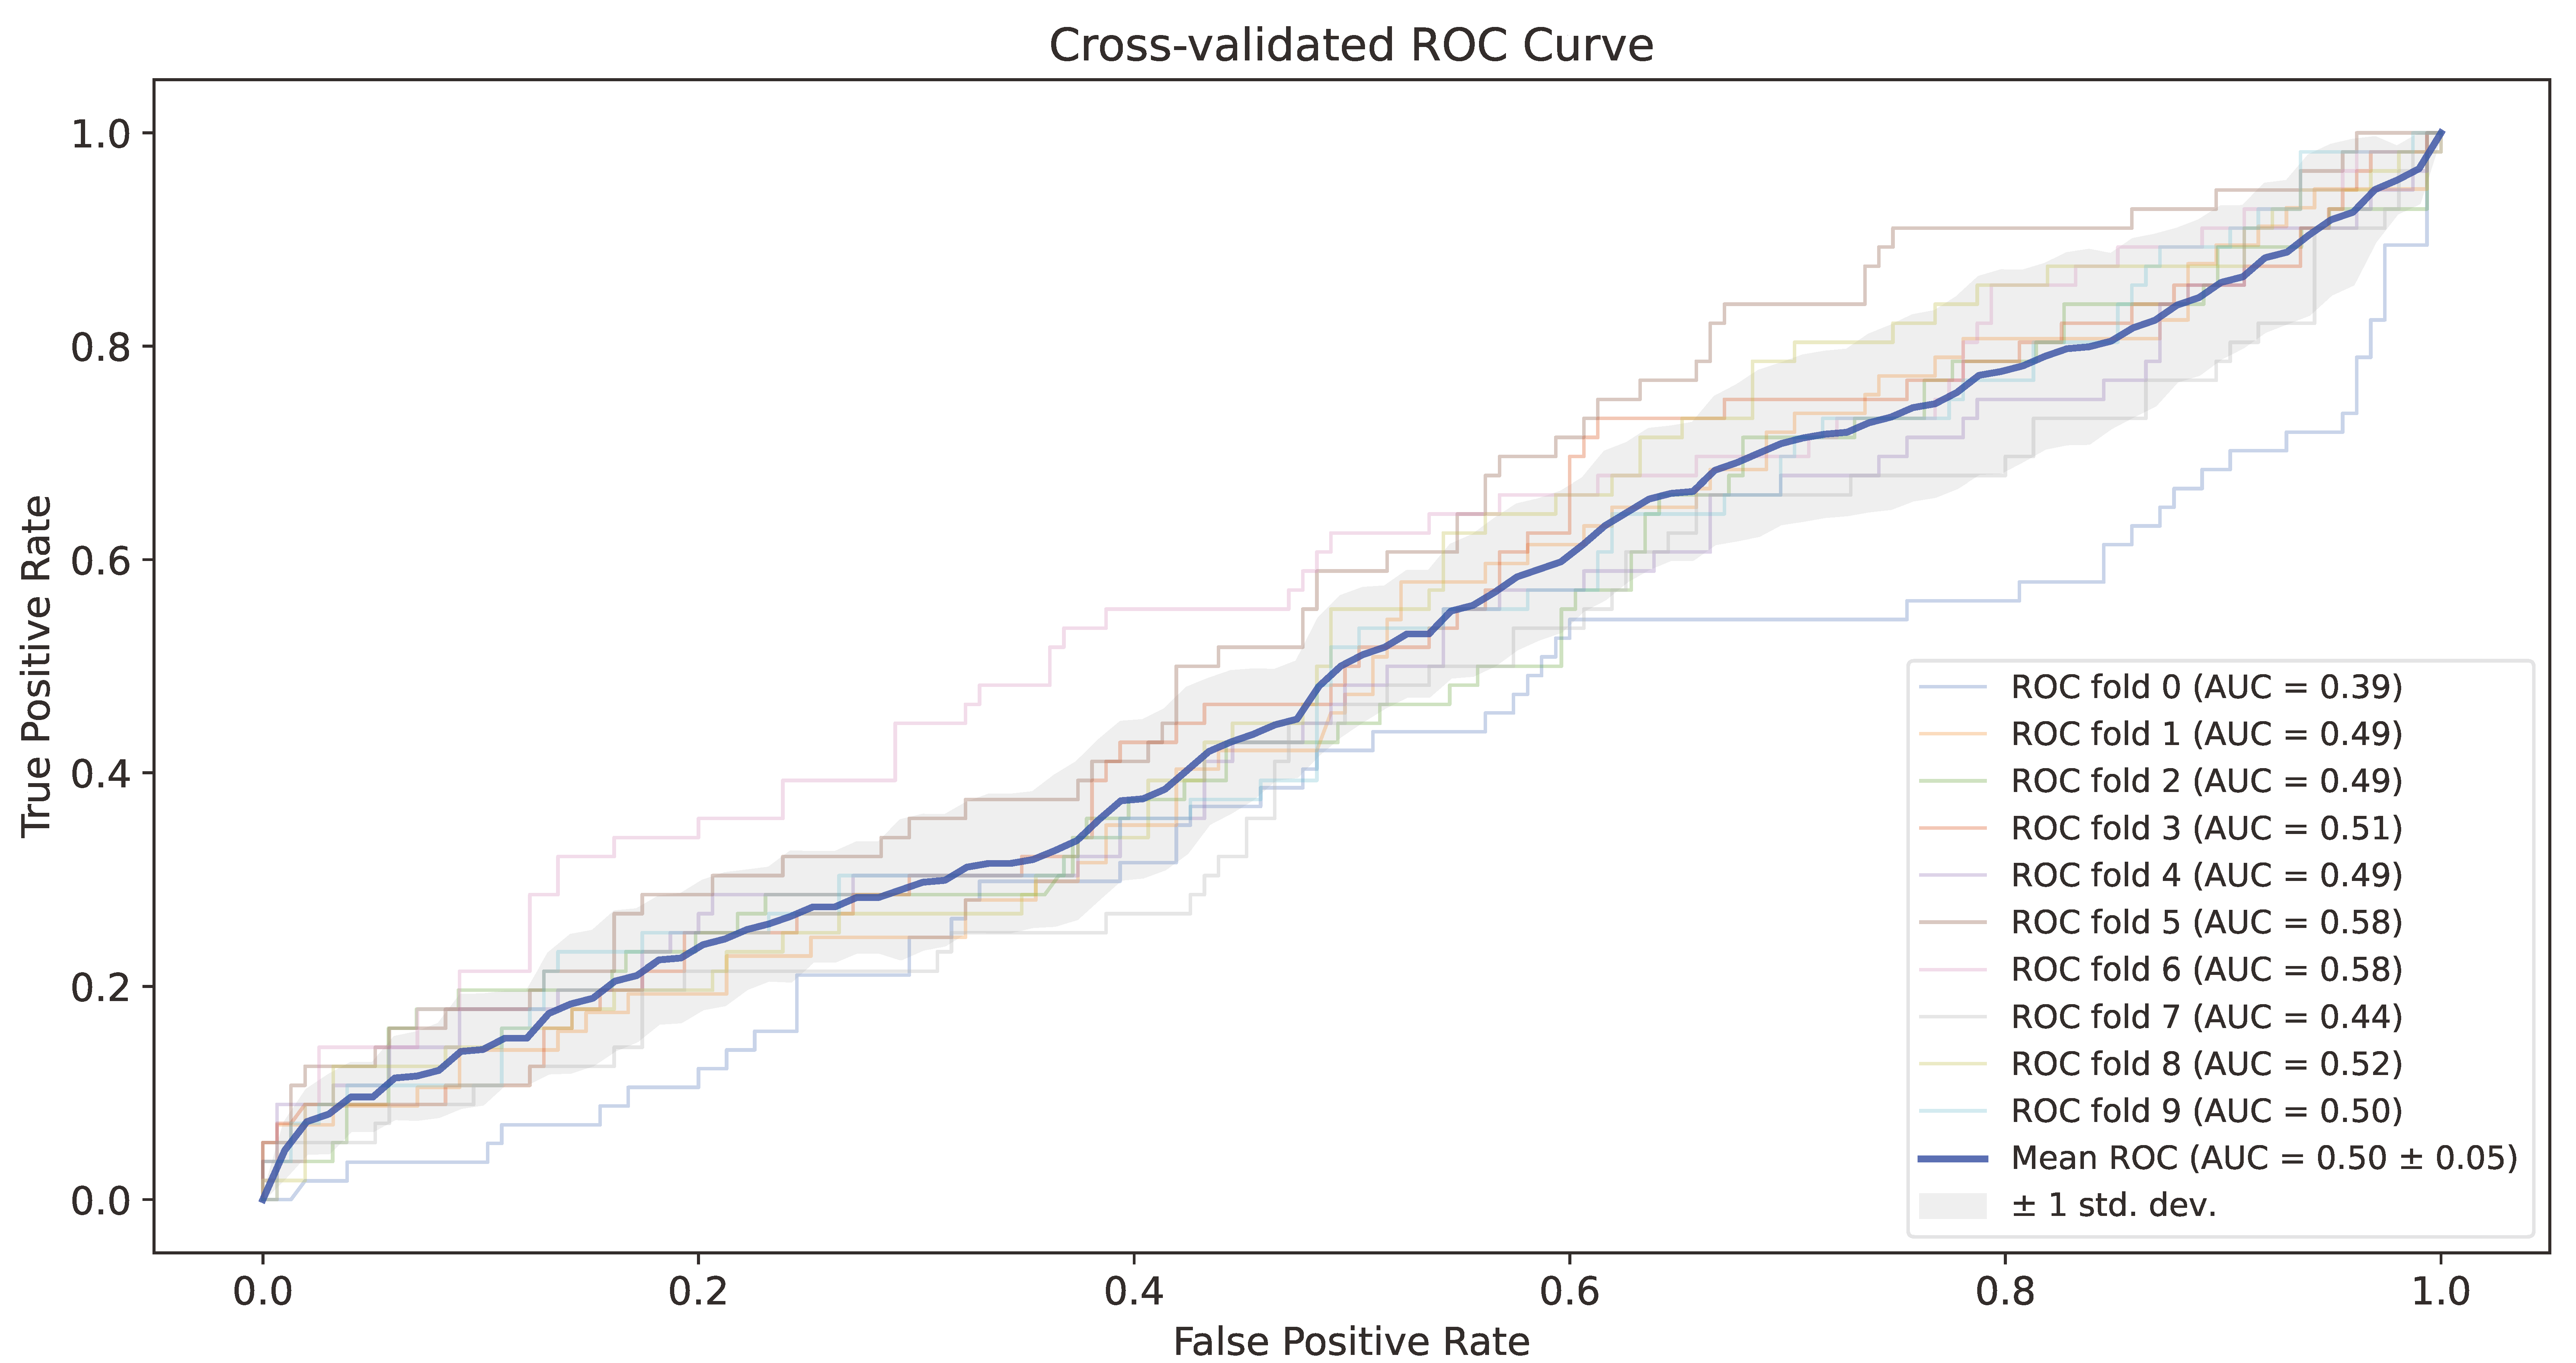
28] method to balance positive and negative samples, aiming to alleviate the learning bias caused by the imbalance in the original data distribution. Additionally, it adaptively adjusts the decision boundary to prioritize learning from more challenging samples. For 11 dimensional features, three models are used for training and testing, namely random forest, XGBoost, and support vector machine. The experimental results are shown in
Figure 4.
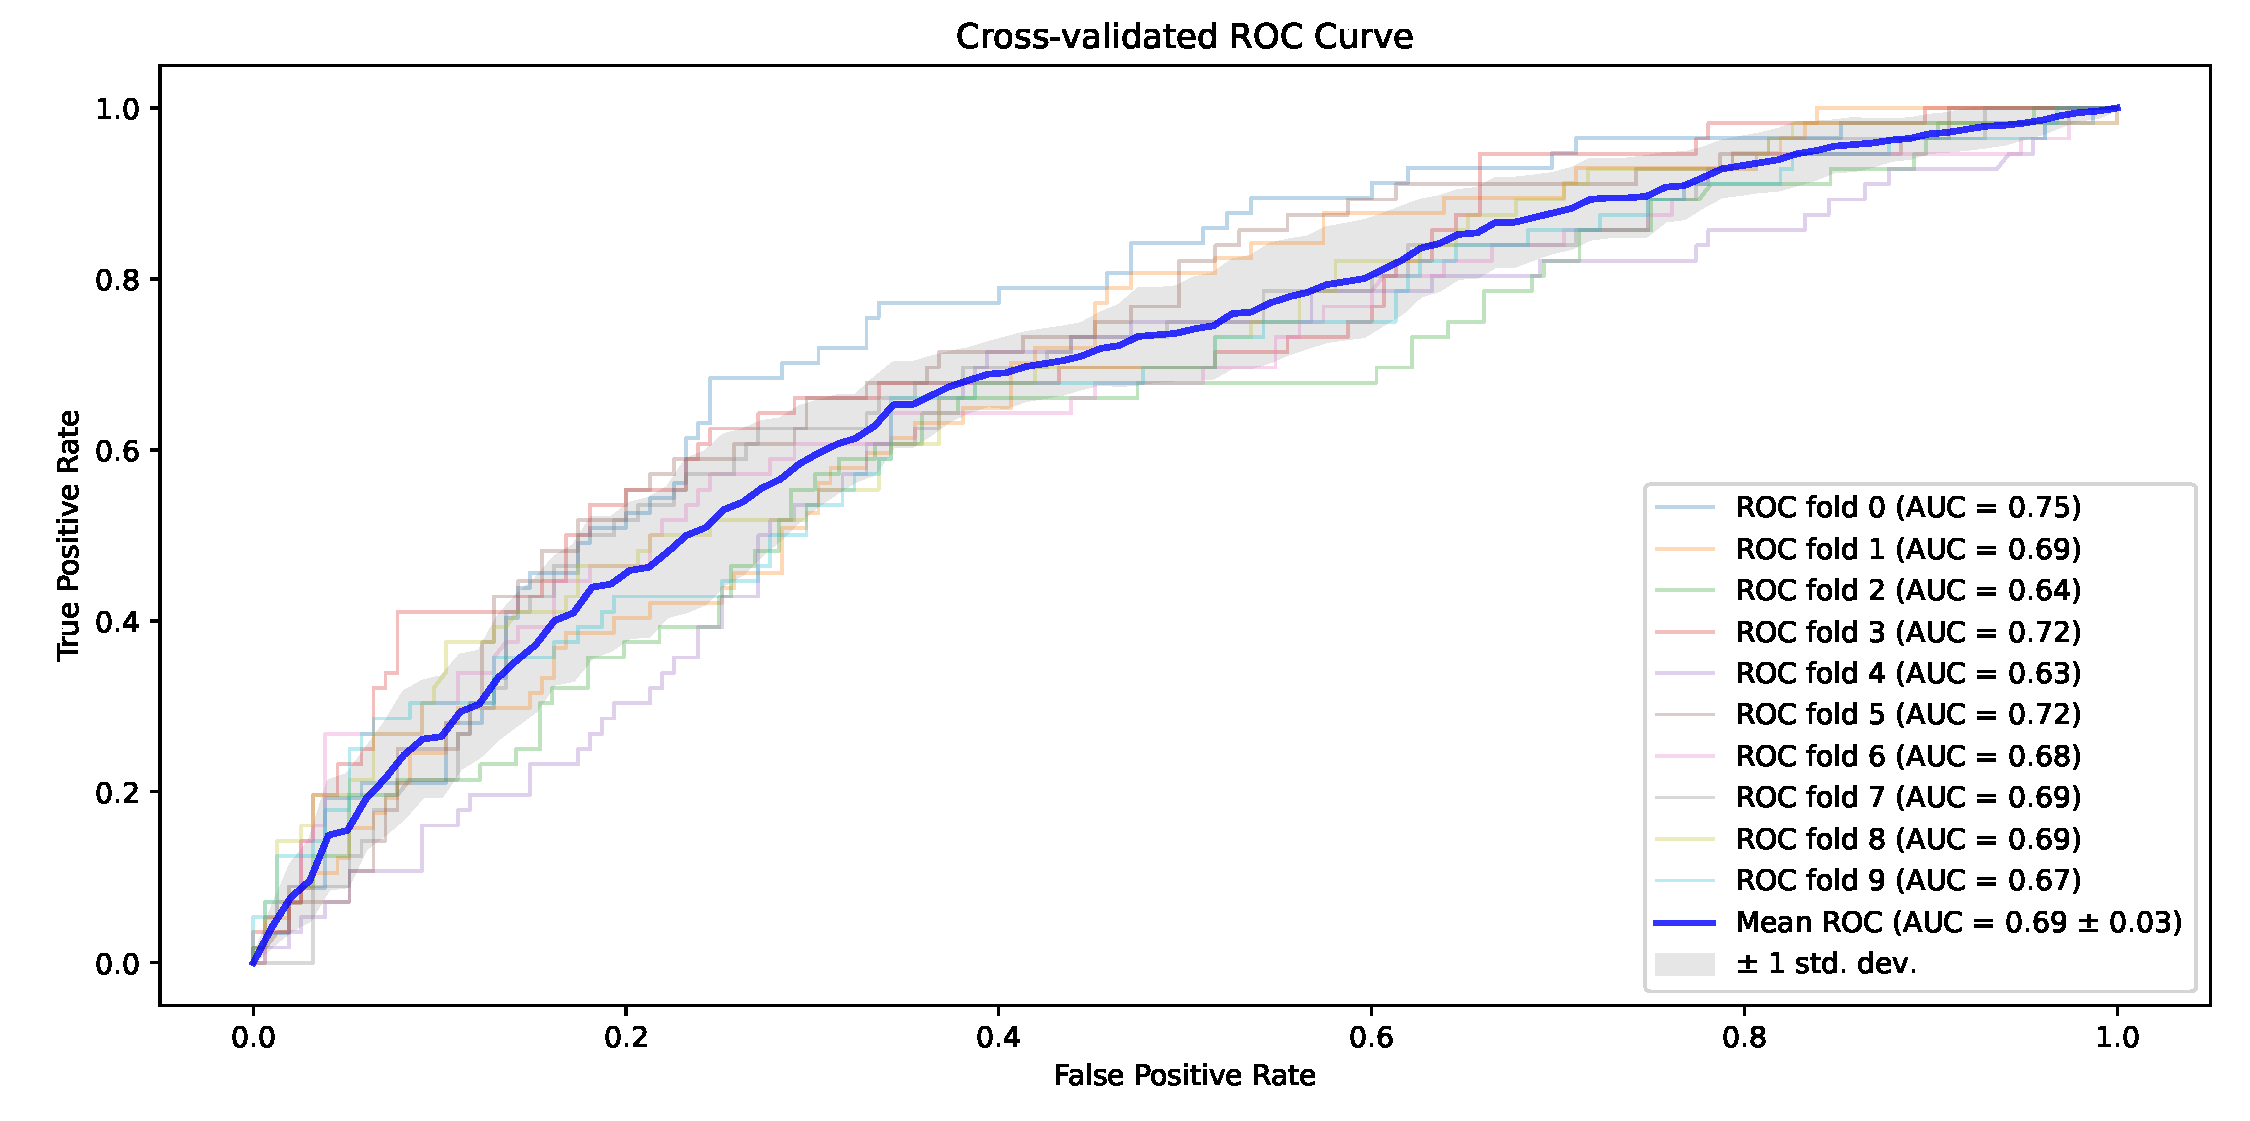
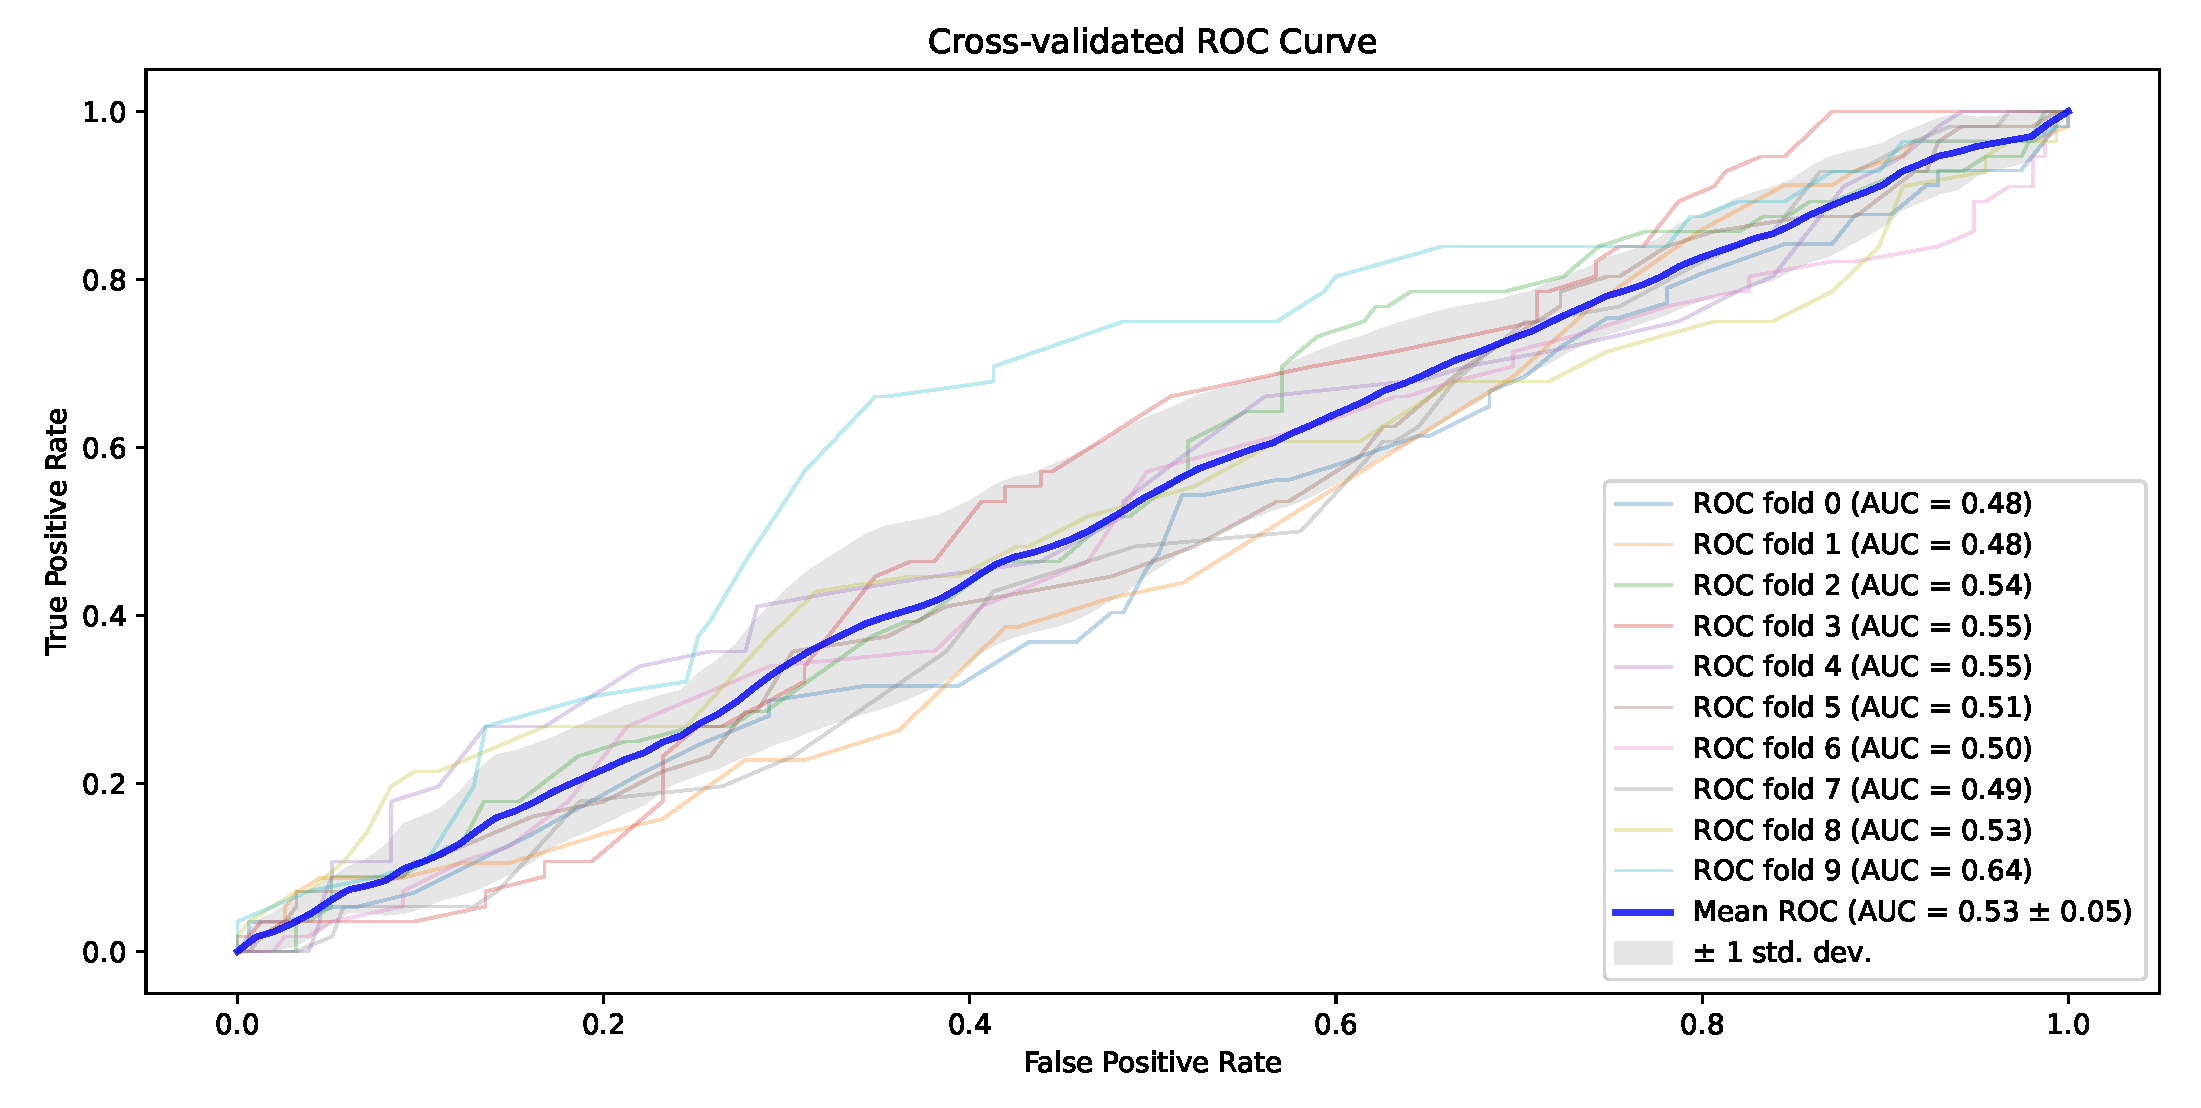
Among the above three models, the XGBoost model has the best performance (Precision = 0.802, Recall = 0.789, F1 = 0.795, Accuracy = 0.708). The XGBoost model has higher Precision and F1 than the random forest model, but the random forest and XGBoost are closer in terms of Recall. The least effective among the three models is the SVM model. However, the three indicators of the SVM model are all above 0.7, indicating that the extracted features can reflect the mental stress of college students. By observing the AUC-ROC curve (
Figure 5,
Figure 6 and
Figure 7), it can be observed that XGBoost performs the best.
Model Interpretability
The traditional method of exploring feature importance only explains the importance of specific features but cannot know how the feature affects the prediction results. This article uses XAI (Explainable Artificial Intelligence) technology to explain the model, namely SHAP (Shapley additive explanations) [
29]. A unified method for interpreting machine learning model predictions was proposed by Lundberg in 2017. The primary advantage of the SHAP value lies in its ability to reflect the influence of individual features within each sample, elucidating both their positive and negative effects. SHAP interprets the predicted values of the model as the sum of attribution values for each input feature:
.
g represents the explanatory model,
represents whether the corresponding feature can be observed (1 or 0), and
M is the number of input features. Here,
M is 11.
is the attribution value (Shapley value) of each feature.
is the constant of the explanatory model. The attribution value
of the feature is calculated as follows:
W is the difference between the predicted values of feature subset
S plus
and without
.
is the set of all input features, and
p is the number of all input features. Here,
p is 11.
is the possible set of all input features excluding
, and
is the prediction of the feature subset
S.
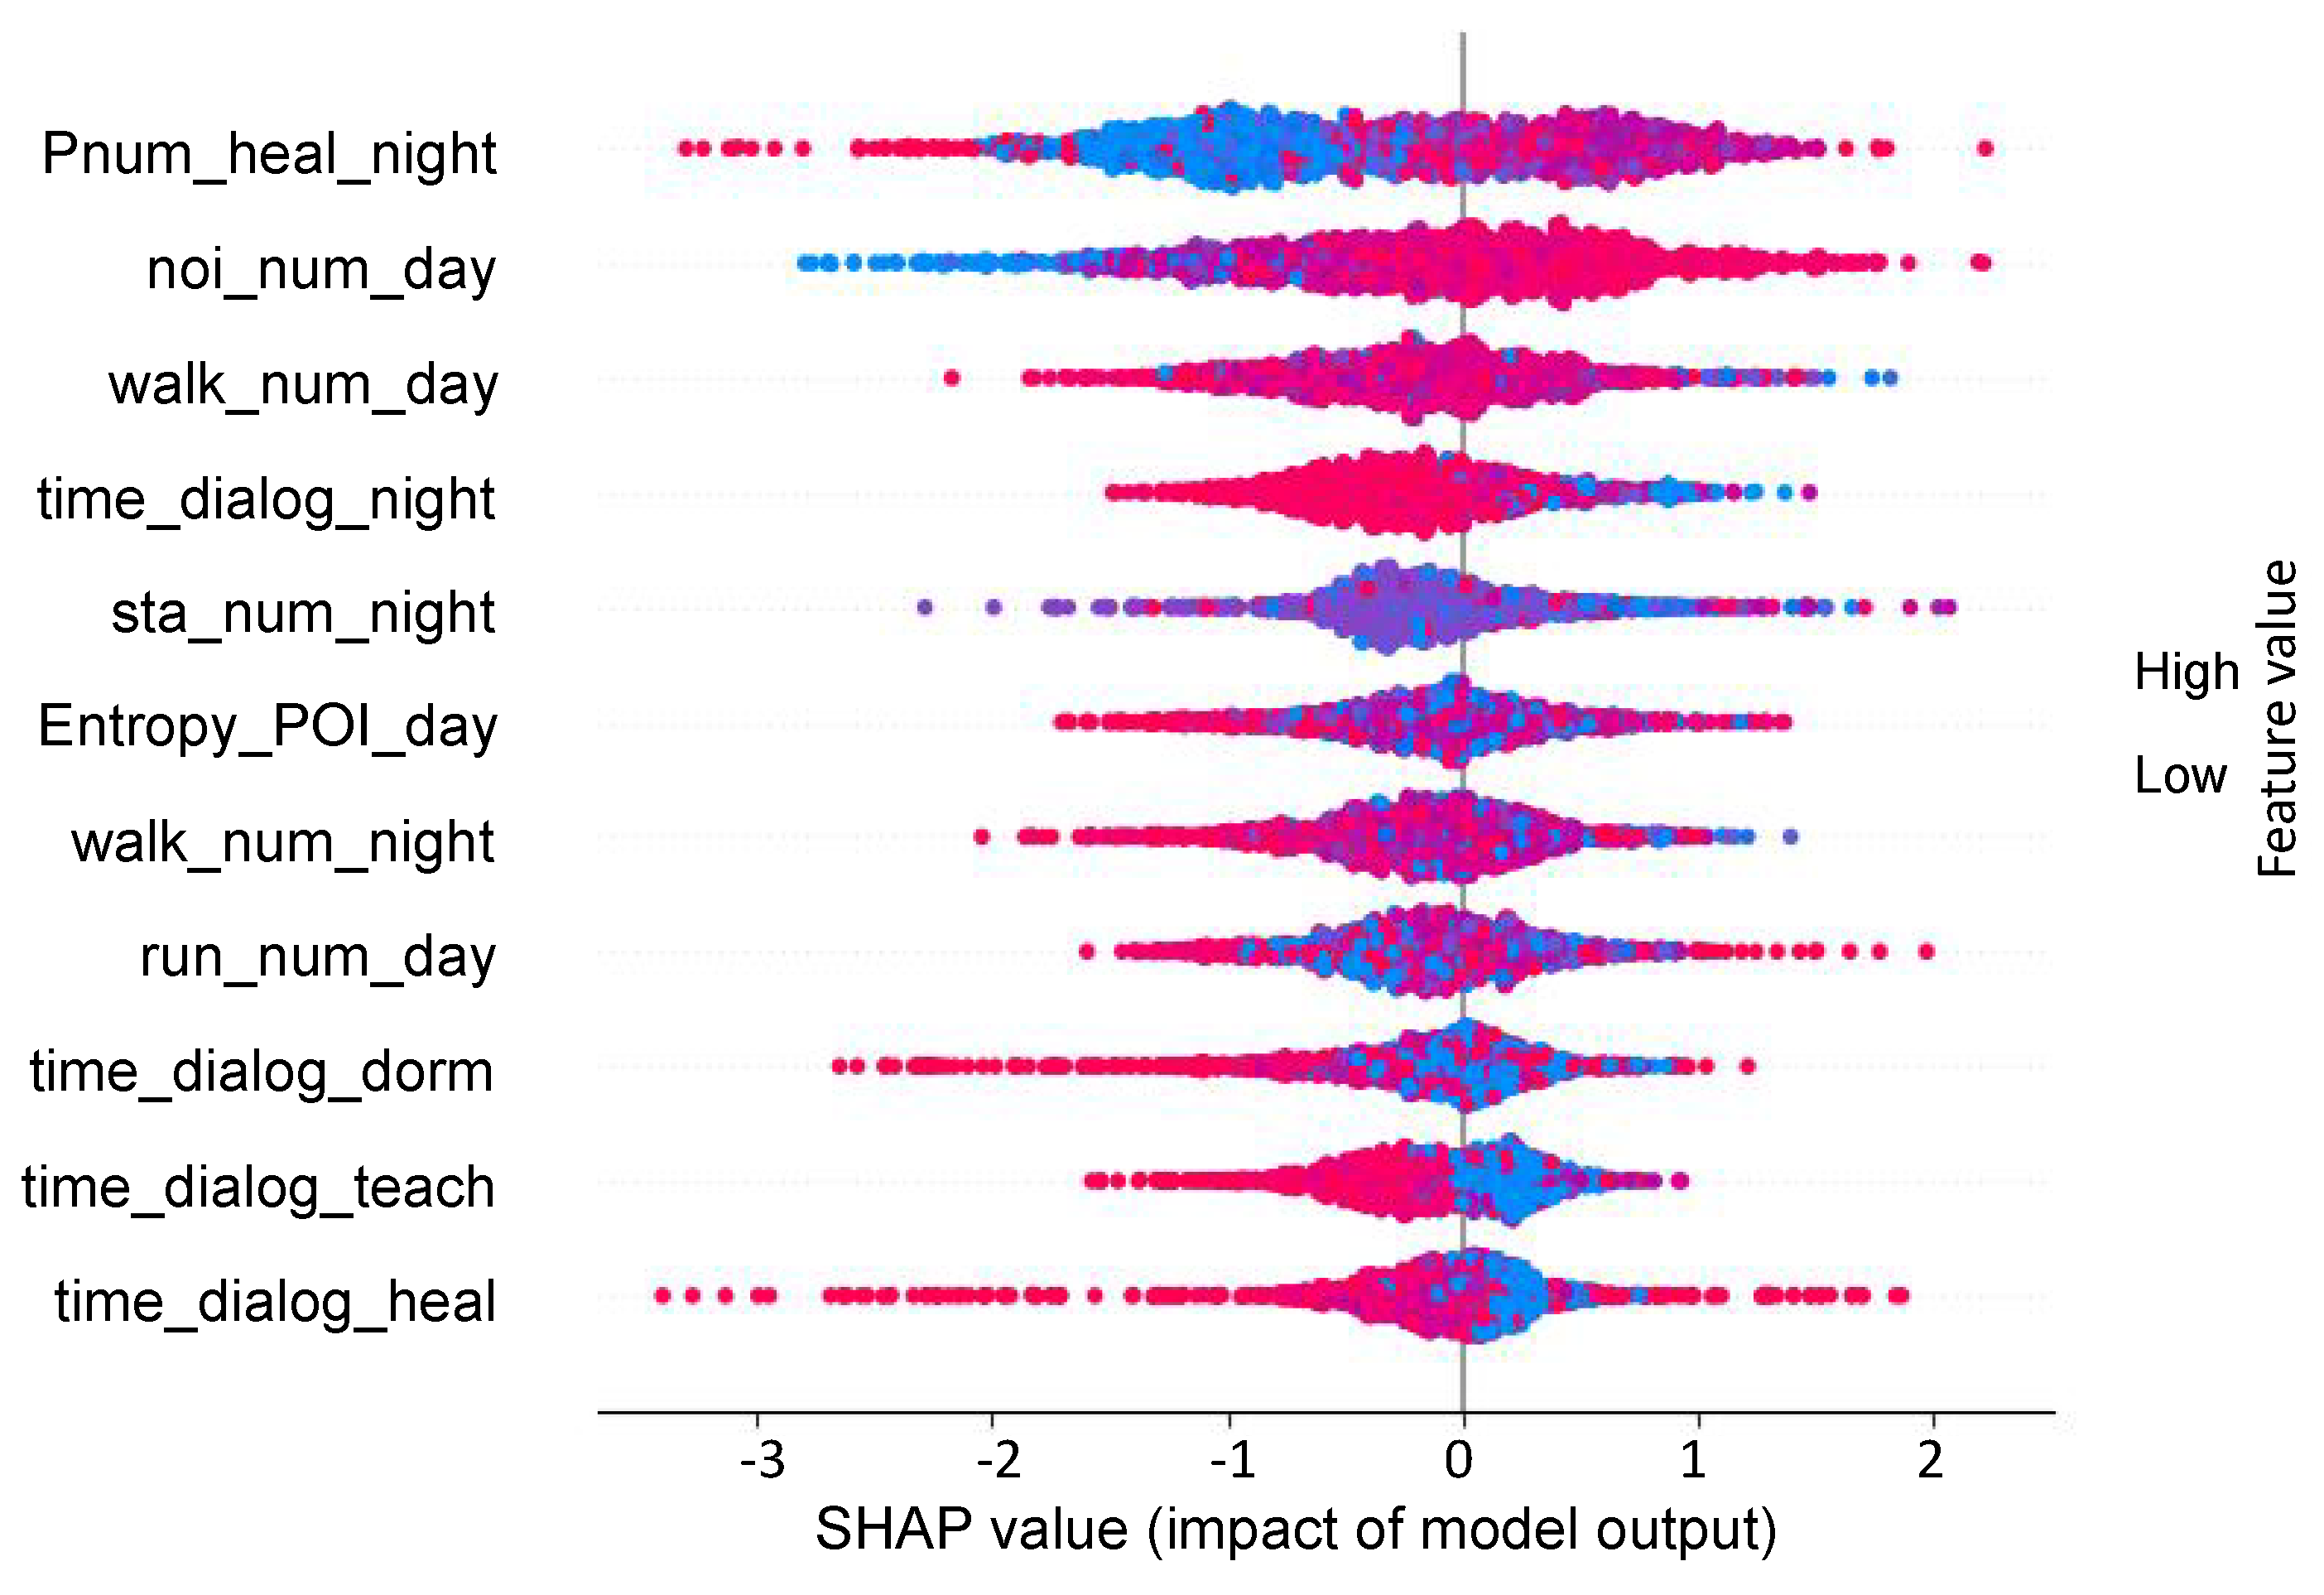
Each fold in the ten-fold cross-validation is analyzed and the SHAP value of the XGBoost model feature is calculated.
Figure 8 shows the global interpretation of the 11 dimensional feature data in one fold. SHAP interprets the model’s predicted value as the sum of the attributed values of each input feature, where the attributed value is the SHAP value. Each feature has a corresponding value. Red indicates high eigenvalues and blue indicates low eigenvalues. For example, the dialogue duration value (red) at high levels has a negative impact on prediction, while the dialogue duration value (blue) at low levels has a positive impact on prediction.
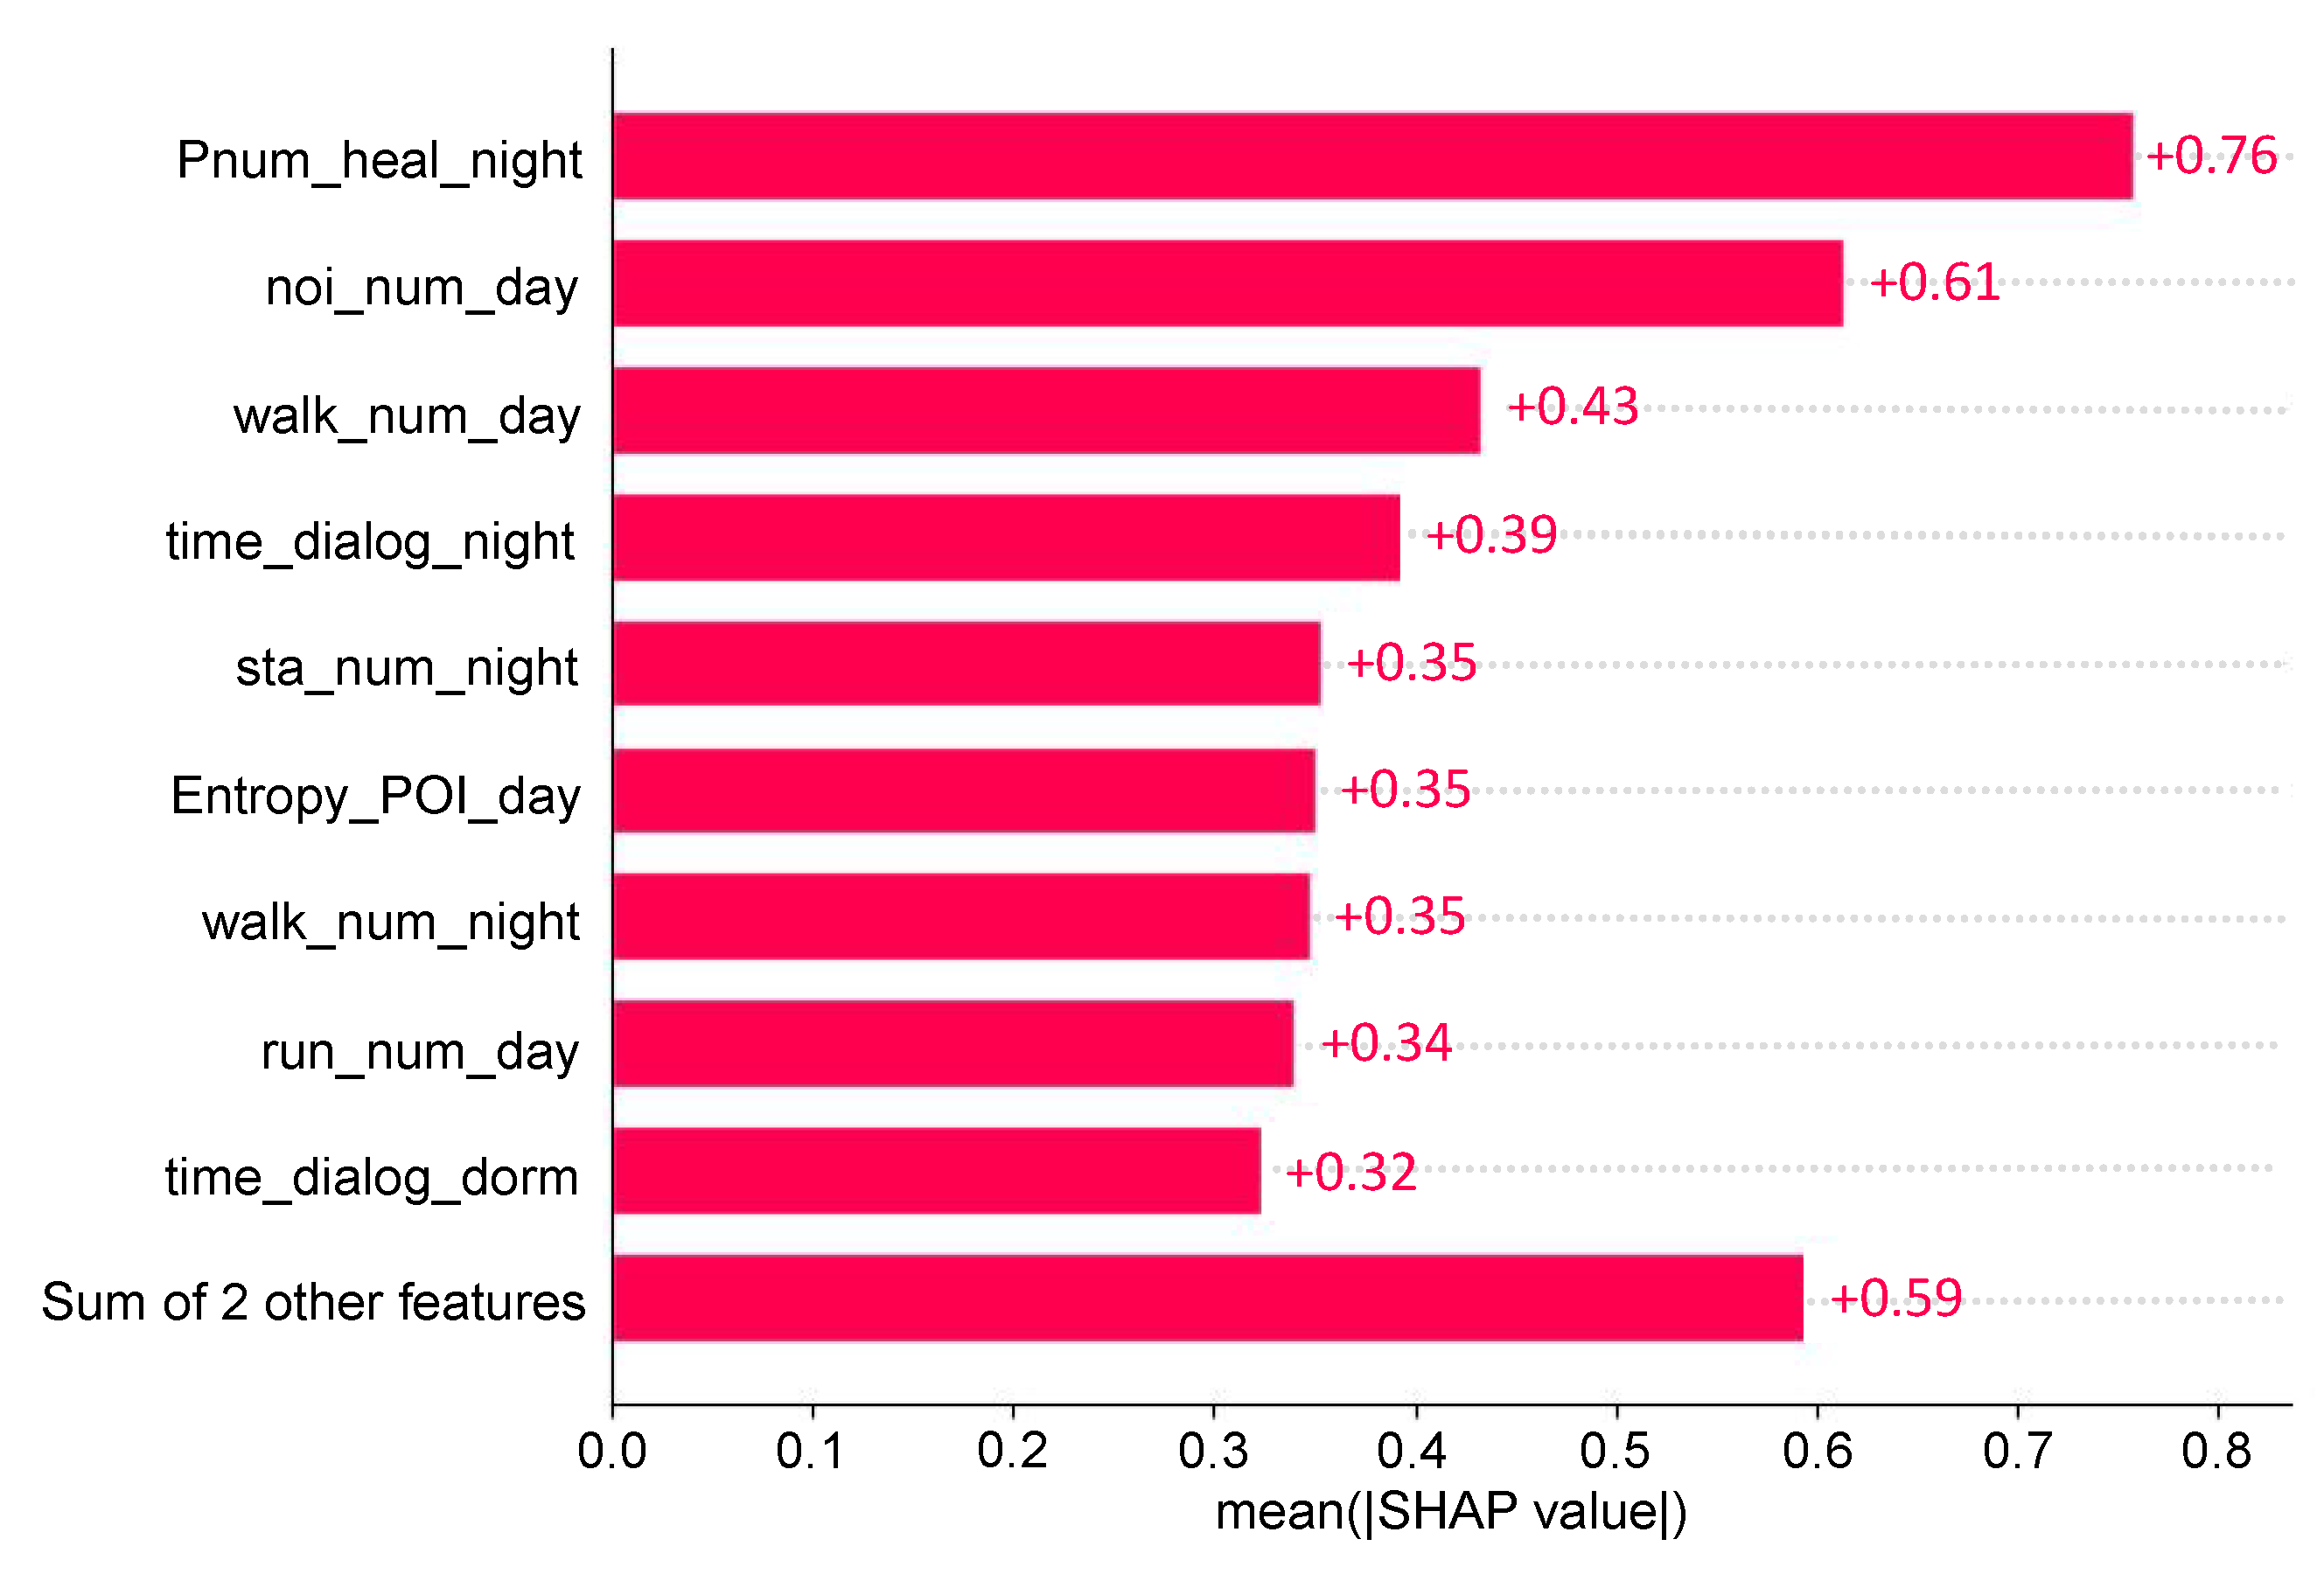
Features in
Figure 9 are sorted by their impact on model predictions. The mean (|SHAP value|) value reflects the relative relationship of feature importance. In this case, the
number of nights in the extracurricular area is the most important feature. The feature importance of other dimensions decreases in sequence.
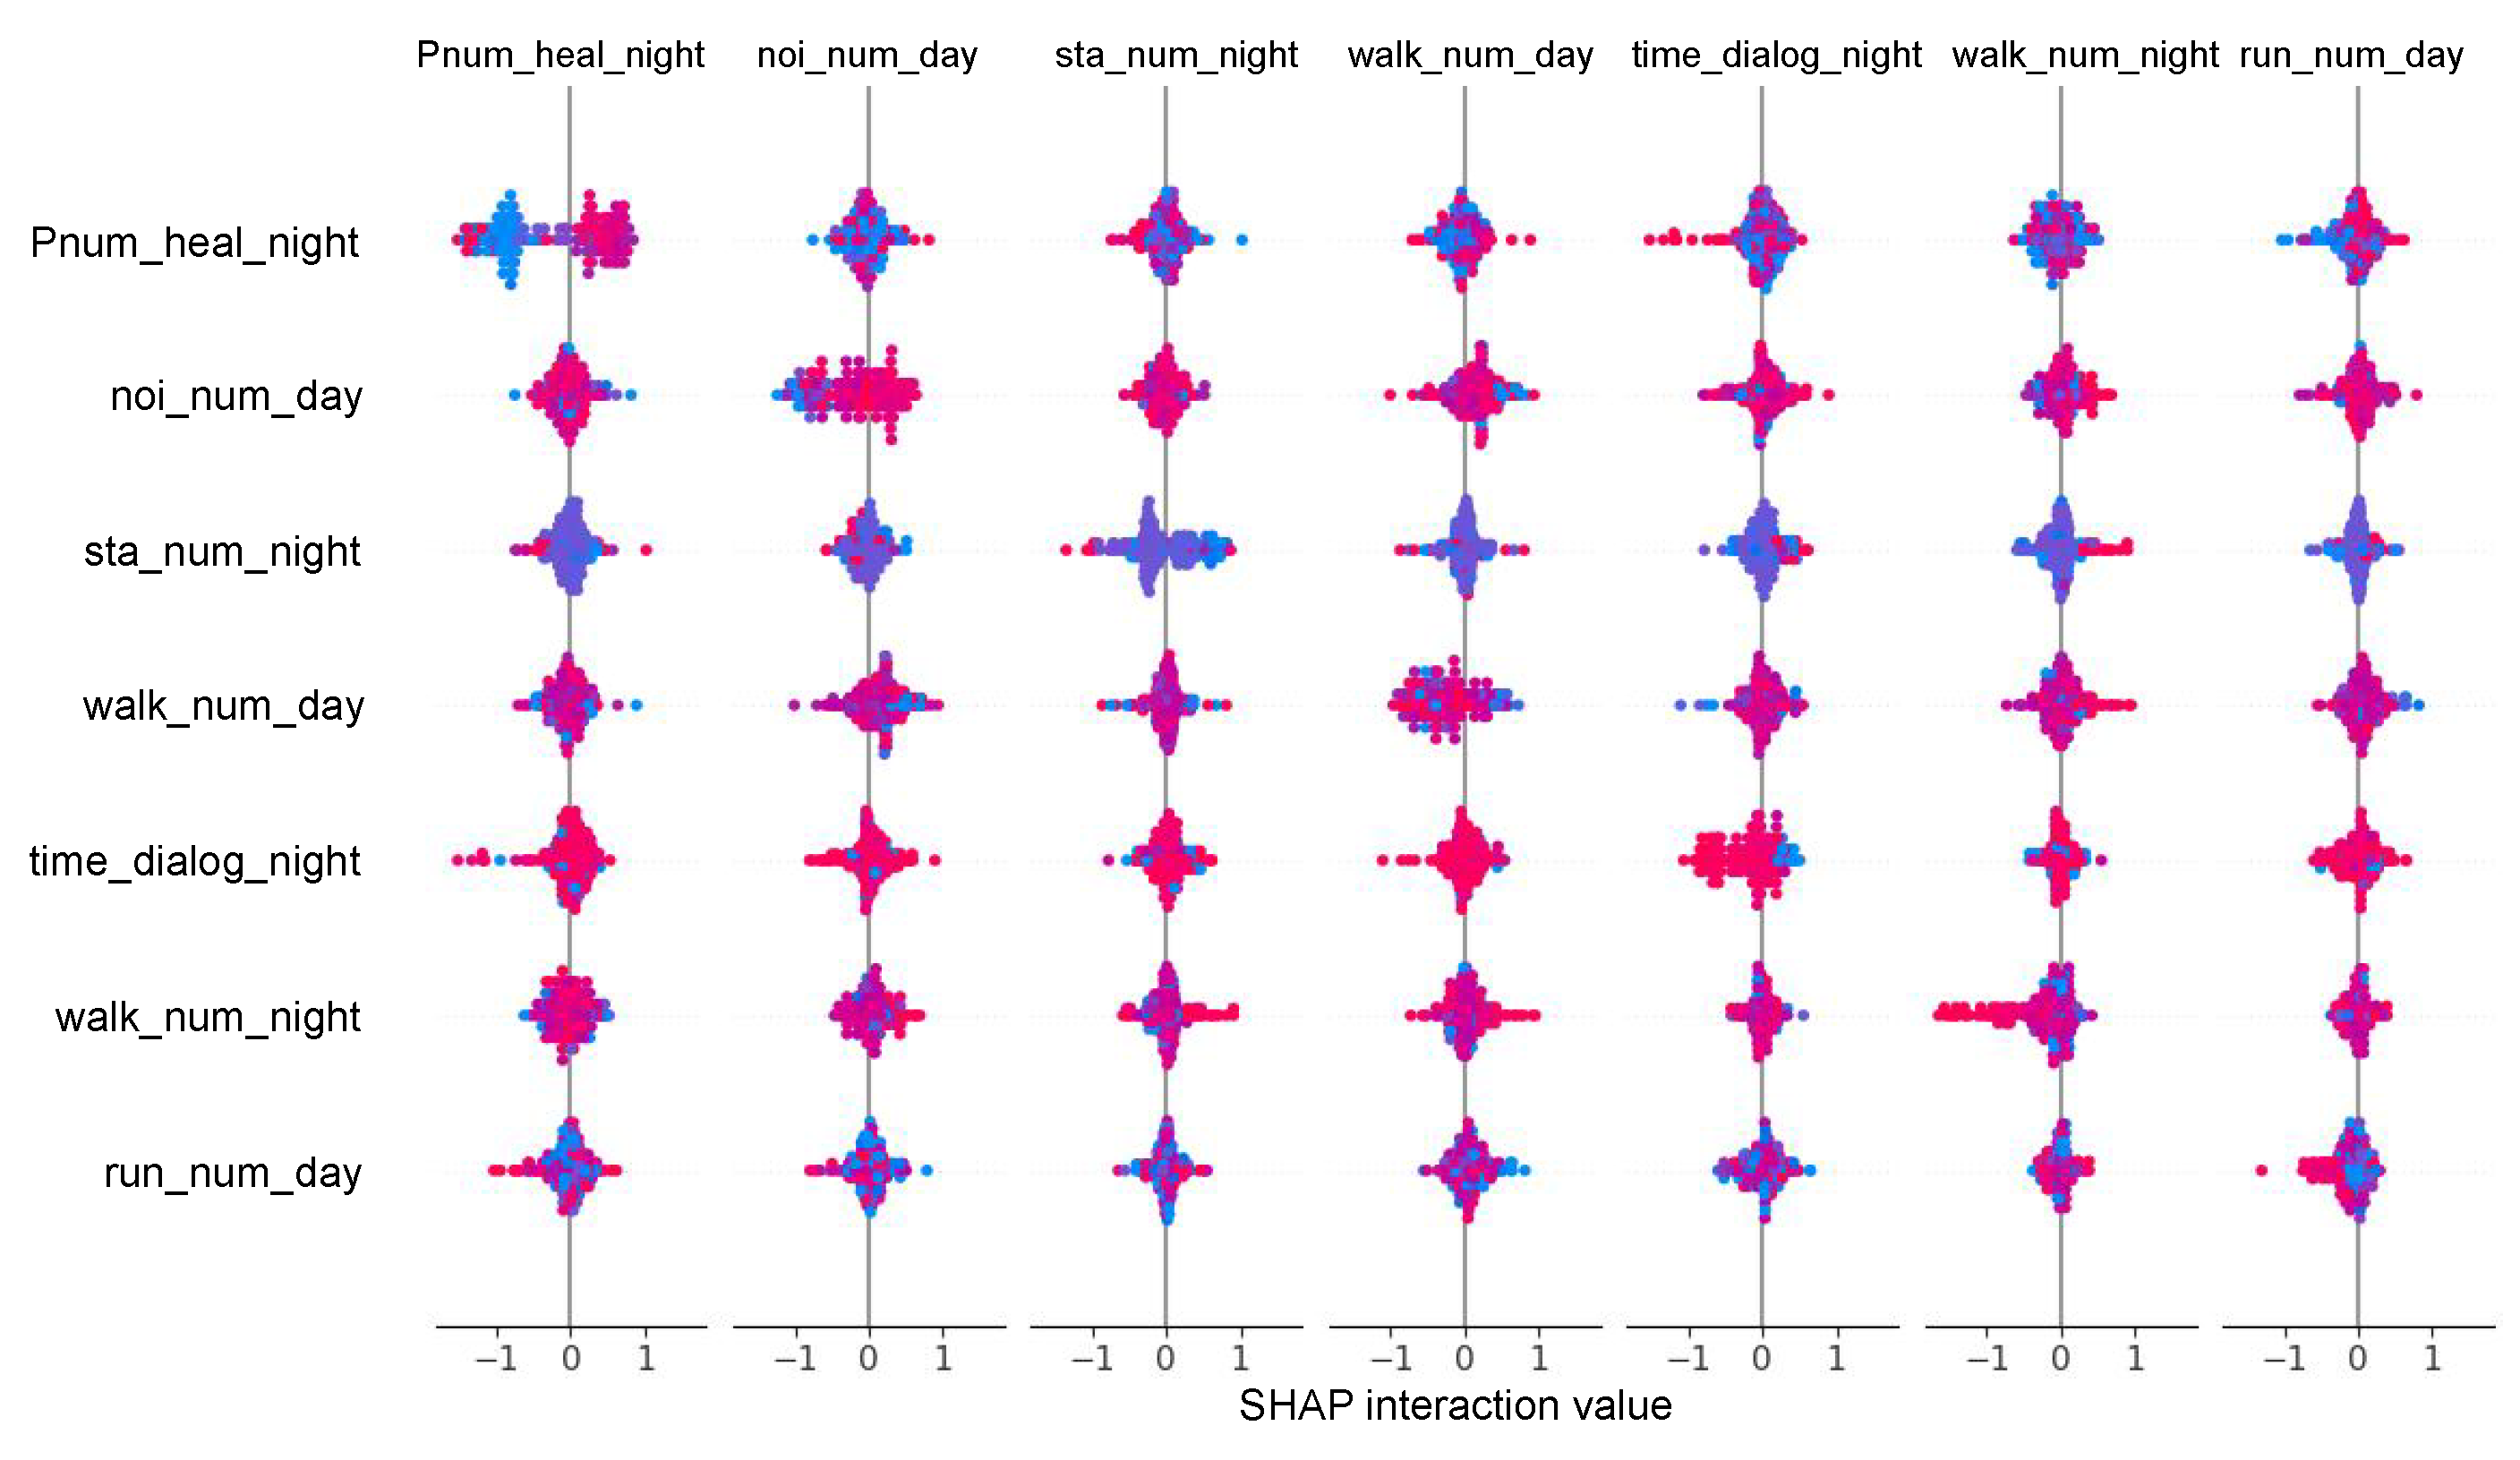
SHAP interaction values are the interaction attribution values between two features, which are used to capture the pairwise interaction effect. In
Figure 10, the X-axis represents SHAP values, and the Y-axis represents the types of features. Each point on the chart is a SHAP value. Red indicates higher feature values. Blue indicates lower feature values. You can get a rough idea of the directional impact of a feature based on the distribution of red and blue points.
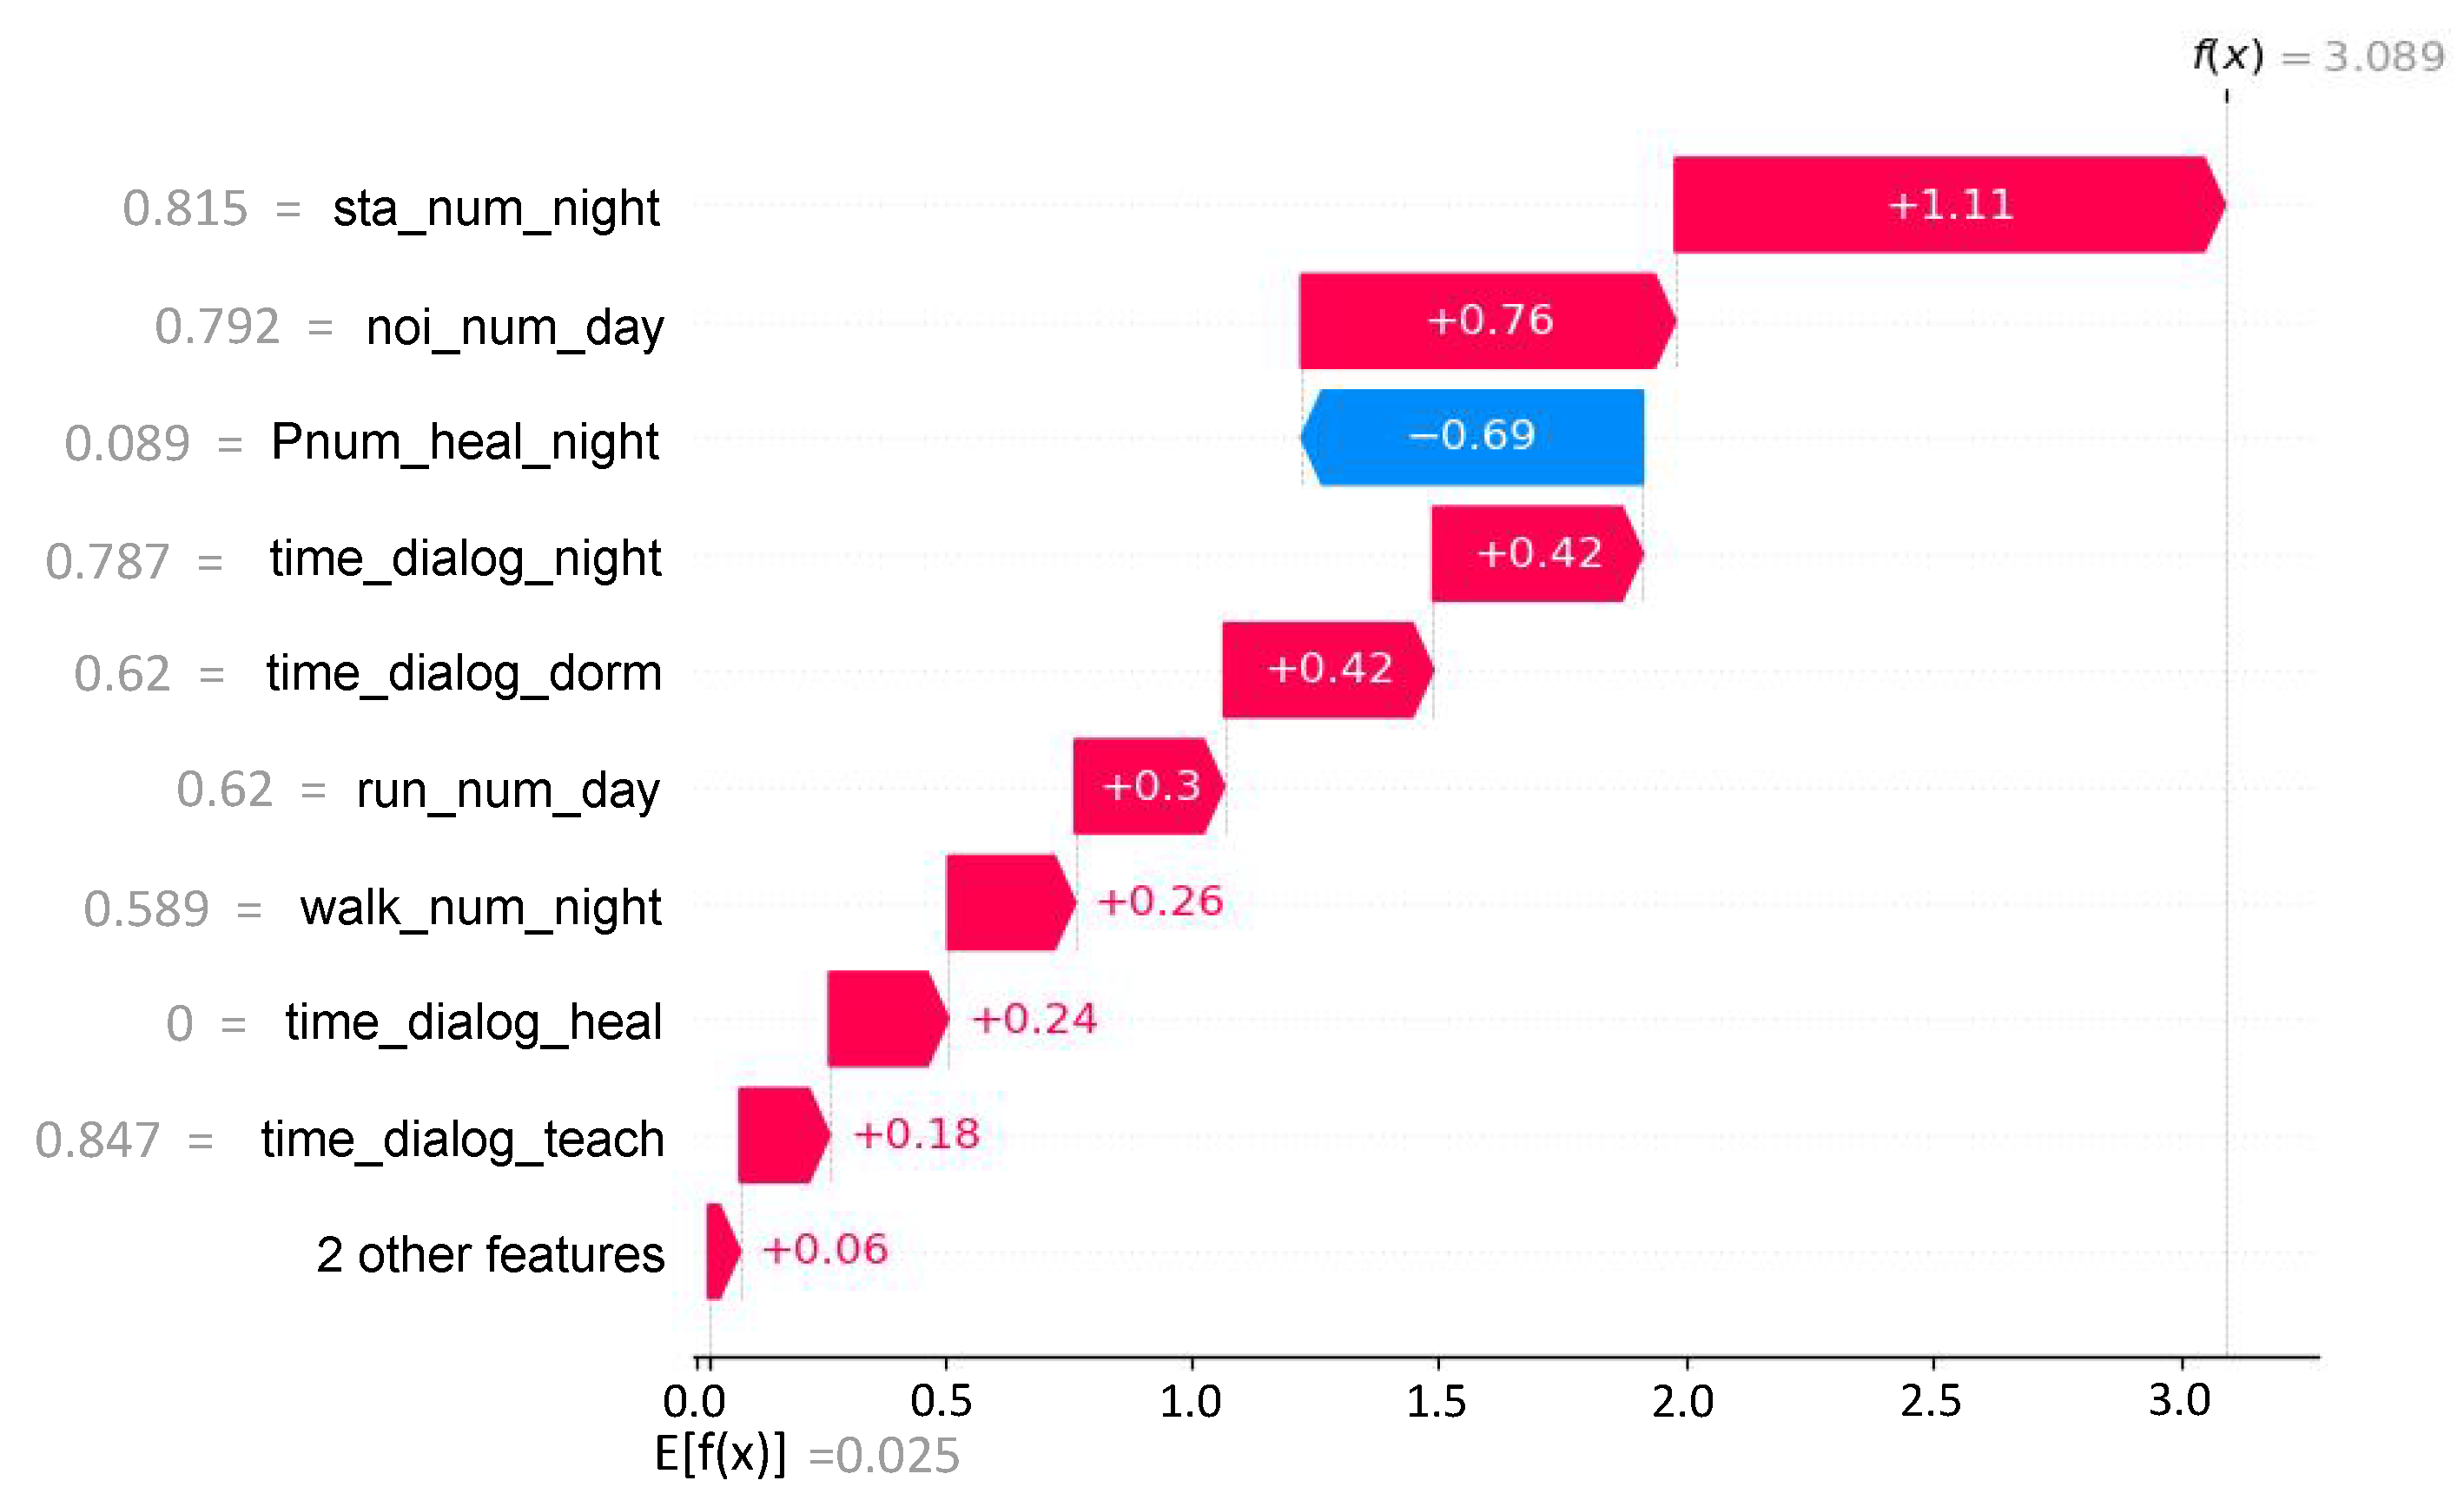
The contribution of each feature to the first prediction can be obtained from the waterfall chart in
Figure 11. When the SHAP value is greater than zero, it means that the feature improves the predicted value and has a positive effect; on the contrary, it means that the feature reduces the predicted value and has a negative effect. The number and span represent the contribution of the feature to the classification.
Using this interpretable model, relevant people can clearly understand the contribution of different features under different types of data without the need for professional computer knowledge. At the same time, they can analyze whether the predictions of the model are consistent with the actual situation.
4. Discussion
From the analysis of the experimental results, the following can be seen: (1) The more exercise undertaken during the day, the longer the stationary time at night, and the shorter the conversation time in the teaching area, the lower the stress level of college students tends to be. This study actually applied the CPT theoretical model to discuss the correlation between stress and behavior. The scale asked whether the subjects were too lazy to move, and the results reflected by the movement characteristics were consistent. (2) In the interpretability part, among the 11 dimensional features, the number of times in the extracurricular activity area at night feature has the highest importance. Secondly, the noise characteristics of the environment indicate that noise affects the mental stress state of college students to a certain extent.
The research method proposed in this article has the following innovations: (1) Using objective data for analysis improves the accuracy of assessing mental stress. (2) The machine learning model automatically calculates the evaluation results to avoid human intervention. (3) Through intelligent sensors, the mental stress status can be obtained in real time, which is conducive to timely detection of mental problems, thereby improving the mental quality of college students.
5. Conclusions
In this study, when assessing the mental stress of college students, some questions in Jiang Qianjin’s Stress Response Questionnaire (SRQ) and Self-Rating Symptom Scale (SCL-90) were filled in using data collected by smart sensors, and the ideas of this article were verified in the Studentlife data set. Based on the measurement dimensions of the scale, feature extraction is performed to avoid subjective extraction of features during research.
After experimental verification, we trained the model using 11 dimensional features, which is a more effective method for evaluating mental stress. The experimental results indicate that using intelligent sensor data to replace some of the subjective questionnaire questions filled out by college students is feasible. The following limitations are acknowledged: The GPS data in the Studentlife data set can only go to specific functional areas and do not locate more accurate locations. In the next step of research, we can consider subdividing location types to improve the idea of feature extraction. This paper only considers the four aspects of the psychological stress detection scale to analyze the intelligent perception data of college students. In future research, intelligent perception data can be collected according to other aspects of the scale.
Future research can consider collecting intelligent perception data of college students around each dimension of the mental stress detection scale, thereby improving the accuracy of mental stress assessment. Through a comparative analysis of objective data and subjective filling, we promote the use of intelligent perception data in mental state measurement research, reduce the impact of human subjective filling, and save time and economic costs.


