Article

Seaport Network Efficiency Measurement Using Triangular and Trapezoidal Fuzzy Data Envelopment Analyses with Liner Shipping Connectivity Index Output

by
Dineswary Nadarajan
1,2,*,
Saber Abdelall Mohamed Ahmed
3 and
Noor Fadiya Mohd Noor
2,4,*
1
Faculty of Business, Accountancy & Law, SEGi University, Petaling Jaya 47810, Malaysia
2
Institute of Mathematical Sciences, Faculty of Science, Universiti Malaya, Kuala Lumpur 50603, Malaysia
3
Department of Applied Statistics, Faculty of Economics & Administration, Universiti Malaya, Kuala Lumpur 50603, Malaysia
4
Center for Data Analytics Consultancy and Services, Faculty of Science, Universiti Malaya, Kuala Lumpur 50603, Malaysia
*
Authors to whom correspondence should be addressed.
Mathematics 2023, 11(6), 1454; https://doi.org/10.3390/math11061454
Submission received: 22 November 2022 / Revised: 18 January 2023 / Accepted: 6 February 2023 / Published: 17 March 2023
(This article belongs to the Special Issue Computing Mathematics with Fuzzy Sets)

Abstract

:
Seaport network efficiency is very crucial for global maritime economic trades and growth. In this work, data of three years (2018–2020) with input variables (time in port, age of vessels, size of vessels, cargo carrying capacity of vessels) and output variables (Liner Shipping Connectivity Index (LSCI) and Gross Domestic Product (GDP)) are collected. Few screening tests are performed to ensure the data are fit for further analyses. Since none of the existing studies has ever considered LSCI as an output variable, the main purpose of this study is to measure seaport network efficiency based on LSCI using data envelopment analysis (DEA), both classical and fuzzy. In fuzzy DEA, triangular fuzzy number (TrFN) and trapezoidal fuzzy number (TpFN) are used to construct the fuzzy sets of efficiency scores with DEA. The comparison between DEA and triangular fuzzy data envelopment analysis (TrFDEA) shows the range of differences in the results ranges from −0.0274 to 0.0105, while the comparison between DEA and trapezoidal fuzzy data envelopment analysis (TpFDEA) yields the differences within the range of −0.0307 to 0.0106. Using DEA as the relative reference, it is further revealed that the TpFDEA has smaller standard deviations and variances than the TrFDEA in 2018 and 2019, whereas the opposites hold true during the pandemic year of 2020. With the use of fuzzy numbers, the uncertainty levels in the seaport network efficiency measurement can further be investigated as the minimum, mean, median and maximum values are taken into consideration. Moreover, the proposed TrFDEA and TpFDEA lead new insights on the boundedness concept of the efficiency scores, which were never reported before by any researcher, especially in the maritime industry research. Fuzzy regression modelling based on the Possibilistic Linear Regression Least Squares (PLRLS) method was also performed to determine the interval of minimum and maximum connectivity efficiencies, which gave a better estimation than the regular regression model.

1. Introduction

The nine challenges in the field of maritime transportation are port infrastructure, global trade, production capacity, finances, regulation compliance, safety and security, sustainability, digitalization and community support [1]. Port congestion, which is a result of stagnated port infrastructure and growing global economy, is another issue that hinders the effectiveness of the seaport network. This can be minimized by smart ports’ use of technology to forecast estimated times of arrivals (ETA). Automation allows containers to be handled faster, enabling the port to accommodate a greater number of vessels and cargo, though with incurred costs. One of the main obstacles that has a negative financial impact is the ports’ inability to seize all production and opportunities as they simply cannot keep up with the ongoing demands. Another challenge concerning the environment and water is in the monitoring of environmental quality indicators to ensure regulatory compliance and to avoid fines. The port employees’ duties can be hazardous as they need to operate large machineries and work near the place of sulfuric plants that may emit harmful fumes, exaggerating security and safety problems. Adapting the 2030 Agenda for Sustainable Development, the ports are being compelled to minimize carbon consumption for better environmental care [1]. Environmental concerns, digital systems and sustainability are becoming increasingly important affairs in maritime transportation since they can improve port productivity, autonomy and energy savings. With pollution, environmental disruption, stress on hinterlands and coastal land usage, imminent supports from the community especially from the government are greatly required.
Maritime transportation connectivity is a fundamental determinant of bilateral exports that concerned under two maritime transportation challenges of port infrastructure and global trade. Since the 2000s, greater number of the world’s freights have been conveyed in mega container ships with container capacities of more than 10,000 twenty-foot equivalent units (TEU). In fact, between 2011 and 2021, the extent of conveying capacity has risen from just 6% to about 40%. Over the same period, there have been 97 new ships within the container capacity range of 15,000 TEU and 19,990 TEU, and 74 new ships of 20,000 TEU and above starting around 2018 [2]. Cargo carrying capacity is a possible cargo load that can occupy a ship. This capacity to hold large containers influences the ships’ size and age. A large container ship separates each container from each other to make things easier for loading of the containers. Raji et al. [3] claimed that the largest container ships can load around 15,000–16,000 TEU at one time.
The maritime connectivity structure and its service supply are tracked by different indicators. Large numbers of potential determinants in the liner shipping rates resembling availability and port framework have been intently corresponded to one another. The pairwise correlation coefficients for Liner Shipping Bilateral Connectivity (LSBC) components indicate a positive relationship between all components, except for the number of transhipments and exports [4]. The Liner Shipping Connectivity Index (LSCI) targets to catch the degree of integration into the current liner shipping network by estimating the liner ship transporting connectivity. It is very well determined at the nation and at the port level in view of five parts: the number of ships, their container-carrying capacity, maximum vessel size, number of services and the number of companies deployed to the country’s ports according to United Nations Conference on Trade and Development (UNCTAD) [5]. The distribution of the port’s LSCI uncovers a high concentration level among the highly connected ports, and it contributes the biggest impact towards the global trade. It is well perceived that the countries are effectively associated with worldwide trade when there is a high connectivity with respect to the LSCI value.
The economic impacts based on import and export activities in the maritime industry frequently engage with input and output models. A study has shown that port features and variables connecting to outputs demonstrate strong positive correlations between port connectivity and port efficiency [6]. According to Sleeper [7], the effectiveness of transportation in ports significantly increases the economic growth of the subjected countries. Continuous port development for bigger vessels, cargo-carrying capacity (CCC), size of vessels (SV), age of vessels (AV) and time in port (TP) improve costs and port efficiencies through economies of scale, which can enhance the financial status of a country, although their viability can still prompt either critical monetary benefits or failures. Gross Domestic Product (GDP) is altogether impacted by the capacity of organizations to universally trade their labour and products. Hence, by considering related factors, port efficiency can be anticipated by measuring how productive are the inputs (TP, AV, SV and CCC) to produce the outputs (GDP and LSCI) in the present study.
The maritime transportation industry is enriched with real data that can be exploited for continuous monitoring and performance advancement efforts. Unfortunately, not all data are complete and can be accessed publicly since many of them contain missing, limited, private and confidential information with respect to certain seaports. Moreover, since the real-world data in maritime transportation keeps changing in nature, the outcomes would be uncertain. Hence, a new strategy of Data Envelopment Analysis (DEA) is needed to handle the data scarcity and prospect. Eventually, the most suitable strategy would be a modified tolerance approach that complements the model’s objective and constrained design. By considering the data of 133 global seaports with 5 years of output variables, the constraint violation of the traditional DEA tolerance approach can be overcome. Additionally, by exploring two fuzzy sets of triangular fuzzy numbers (TrFN) and trapezoidal fuzzy numbers (TpFN), the best method to deal with uncertainties in the DEA model can be determined. At the same time, this fuzzy DEA approach can empower the improvement of the state of the art in the classical fuzzy DEA model, as the weakness in the tolerance approach can be improved. Moreover, intuitionistic fuzzy units, suitable tolerance graphs and bounded tolerance graphs can be developed to produce a variety of fascinating outcomes. All of these comprise the motivation of this study.
The presently proposed fuzzy DEA and efficiency boundedness can be excellent evaluation tools for assessing future port performance and for making effective decision in maritime industry while addressing environmental aspects, sustainable development and eco-designs of seaports and vessels. These measurements with minimum, maximum, mean or/and median scores that promote better efficiency predictions can be used to upgrade state-of-the-art technologies and promote smart shipments that benefit the maritime sector, while taking into account the worldwide economic interests. Shipping will become safer, more effective, reliable and strongly connected to the global supply chains as a consequence of consistent real-time monitoring systems that improve the maritime technology while generating higher revenue and return with the advantage of cost saving [1]. The findings of this work can be useful to maritime industry authorities, investors and practitioners in their operational decision and policy making.
The present study highlights the use of LSCI as one of the outputs for seaport network efficiency measurement, which was never performed in the past by other researchers. Triangular fuzzy data envelopment analysis (TrFDEA) and trapezoidal fuzzy data envelopment analysis (TpFDEA) have been proposed for comparison and as extended studies of the classical DEA tolerance approach. New insights on the boundedness of the efficiency scores have been introduced as well as the exploration of the Possibilistic Linear Regression Least Squares (PLRLS) method on the fuzzy regression technique to deal with interval regression of random variables that are not suitable to be treated with the basic regression method.
The outline of this work is divided into parts. Section 1 introduces the maritime transportation challenges that insist on seaport development and performance, the connection of seaport network efficiency with economic impact, and the motivations and highlights of the present study. Section 2 provides some literature reviews on seaport network efficiency using the DEA technique. The data sources and variables are described in Section 3. In Section 4, the mathematical details of DEA, fuzzy DEA based on TrFN and TpFN as well as the overall employed methodology are presented. Section 5 contains the empirical study’s results and discussion. Finally, the study’s general findings, contributions, limitations and recommendations for future research are concluded in Section 6.

2. Literature Review

A port’s structure has a vital association in general exchanging chains and, therefore, port efficiency is a significant contributor of a country’s worldwide strength [8,9]. Port efficiency has turned into a fundamental piece of microeconomic change in many countries since it is the most significant highlight in transportation expense planning to increase the imports and exports of a country [10]. The efficiency measurement can be performed using DEA based on 133 countries in the world that all have similar inputs and outputs. DEA is an analytic tool that has been used for many years in many different studies to compare efficiencies. The specialty of DEA is that it can handle many inputs and outputs at the same time, which can then be used to measure the relative efficiency of DMUs (Decision Making Units). DEA is a non-parametric method firstly proposed and pioneered by Charnes et al. [11] for evaluating DMU performance. DMU’s special characteristic is that it provides a venue to solve the association of multiple inputs and outputs evaluated based on relative efficiency [12].
There are 116 publications released in scholarly journals between 1993 and October 2021 that proved DEA to be a well-established tool for forecasting future port performance [13]. Among the studies relevant to this subject, few studies stand out. Sun et al. [14] assessed the port performance of 16 Chinese port enterprises using three output variables: container throughput, cargo throughput and net profit. Wang et al. [15] emphasized green ports’ efficiency that takes into account both competition and collaboration factors. De Oliveira et al. [16] used 200 container ports with annual traffics to estimate the extent of competitiveness at various regional and global levels. Another study has gained interest due to its sustainability assessment that created an evaluation framework for nine ports in China using GDP as one of the outputs [17]. The feasibility of the suggested technique was demonstrated by the case of the supplier evaluation of a collaborative manufacturing firm with certain sensitivities in an article by Feng et al. [18] with Tian and Fathollahi-Fard as co-authors. This article contains some suggestions for future research, proposing on different sorts of fuzzy numbers and correlation coefficients, as well as redefining them.
Fuzzy set theory has been generally used to formalize and address the impreciseness of uncertainty in human decision-making. The importance of fuzzy characteristics in DEA is that they can permit flexible and quite accurate results. A general effectiveness examination was performed with a relative efficiency analysis of a set of DMUs. A fuzzy number is necessary for the study since the efficiency is calculated based on a real set of data, while the classical way of measuring efficiency is often inconsistent with reality. A study conducted on port efficiency based on Taiwan’s international ports by Wang et al. [19] that utilized fuzzy DEA to measure DMUs based on fuzzy number features gave more information than the standard DEA with crisp values. Additionally, fuzzy DEA calculation can indeed avoid input or output orientation during execution. Another study conducted by Wanke et al. [20] highlighting factors (operator type, cargo type, accessibility, berth usage, port service quality etc.) and port efficiency predicted by using fuzzy regression, shows the association between them in the case of a Nigerian port. In standard linear regression, the coefficient of determination ( R 2 ) indicates the variance in the output variable that can be explained by the independent variable’s variation, whereas in fuzzy regression the goodness of fit measure is the mean squared distance between the fuzzy responses and the model predictor [21]. Skrabanek and Martinkova [22] reported that the low value of mean square error indicates that the model is close to observation. To adapt fuzzy linear regression techniques, the probabilistic and statistical approaches can be combined with least squares, which is known as the Possibilistic Linear Regression Least Squares (PLRLS) technique. This technique, firstly proposed by Lee and Tanaka [23] to manage fresh data sources and fuzzy outputs, fits the model’s central tendency prediction and the spreads (lower and upper bounds) via the possibilistic approach.
According to Hatami et al. [24], there are four different approaches of fuzzy set theory than can be applied with DEA: tolerance, α -level based, fuzzy ranking and possibility approaches. In the first approach, the tolerance levels are instilled into the DEA model to create fuzzy uncertainty with input–output flexibility, although the fuzzy objective function and fuzzy constraints may not be fully satisfied due to the model’s limited tolerance design. The famous α -level based approach converts the fuzzy DEA model into two parametric mathematic programs to create interval fuzziness efficiency values that fluctuate between the impossible lower boundary and the risk-free upper boundary using the α -level membership of the efficiency scores. In the fuzzy ranking approach, the interval efficiency is enhanced by imposing the α -level fuzziness and ranking onto the constraints. According to Soleimani-Damaneh et al. [25], the possibility method that involves more difficult numerical calculations is applied on models that might not be applicable for solutions by other DEA methods. In order to evaluate each DMU using this method, one must solve the provided model for different possibility levels, which requires solving multiple linear programming models. In solving the primal and dual models, the upper and lower bounds for each DMU for a specific possibility level are provided by the efficiency values that are then changed to fuzzy variables in the credibility method to account for the uncertainty in both fuzzy objective and fuzzy constraints [25].
Studies on data envelopment analysis (DEA) for efficiency measurements are abundant in many fields, but they are, especially, still quite limited in the maritime transportation field. The present research identifies gaps where the DEA approach was not used for evaluation and analysis in some regions such as in African ports and in some Asian and European ports. Even worse, nothing was applied to study the seaports in the least developed countries [13]. In fact, to our best knowledge, none of the existing studies have measured the global seaport network efficiency using the pair of Liner Shipping Connectivity Index (LSCI) and Gross Domestic Product (GDP) as the output variables for DEA. The previous closest work was performed on the connection between China and countries along the 21st century Maritime Silk Road [26], where LSCI was not employed as an output variable but, rather, as an input variable.
The port efficiency input variables have a greater impact on LSCI, which was constructed based on the intention to quantify maritime trade facilitation. Although prior studies focused on rivalry among hub ports from the same region, competitiveness may still be developed as a cross-regional issue, as is the case with Colombo and the Southeast Asian hub ports. A study by Kavirathna et al. [27] on transhipment market shares looking at a variety of real-world scenarios reported that it is possible to determine the advantages that the port of Colombo would have over Singapore, Klang and Tanjung Pelepas as a network-reliant hub. Additionally, new carriers are needed to increase network connectivity with numerous foreign ports and their economic scale. Preventing too many carriers from shifting operations to other ports is now Singapore’s biggest issue [28]. According to Pasha et al. [29], one of the key determinants in the overall profit that a certain shipping line may be able to generate is the average freight rates for different liner shipping routes. The average freight rate was shown to often enhance average ship sailing speed, average ship carrying capacity and average port handling productivity. Port competitiveness in West Africa was measured by Van Dyck and Ismael [30] who explored LSCI with multiple shipping lines that operated in the area (port location) in an effort to take advantage of economies of scale. This study, however, did not measure the LSCI for port efficiency and productivity assessments. The quantity of throughput in twenty-foot-equivalent units (TEU) as an additional variable in the normalised comparisons was considered [31] since the volume handled by ports might affect LSCI and quality of the port infrastructure. This transition has increased freight transportation capacity while improving security and efficiency. China (127.8), Hong Kong (106.2) and Germany (88.9) had the highest levels of connectivity in 2007, according to the statistics [16]. With a score of 143.6 in 2010, China topped the list, followed by Hong Kong (113.6) and Singapore (103.8) [16]. Mohamad et al. [32] ranked each LSCI component’s influence on the shipping connectivity enhancement in the six Southeast Asian maritime nations of Indonesia, Malaysia, the Philippines, Singapore, Thailand and Vietnam from the greatest to the least ranks. This article discovers that the nation port’s capacity to take larger ship sizes has the greatest influence on improving the regional connection. These studies uncover a gap that needs to be filled by taking LSCI as the output variable in calculating the port efficiency.
Traditional factors such as GDP, the number of berths and the number of cranes per berth have been used to predict cargo throughput. The port container throughput was used as a dependent variable [33]. A study conducted in China by Deng et al. [34] revealed a significant connection between economic growth and real-world maritime transport. According to a study conducted on 10 west European countries by Bottasso et al. [35], port efficiency as measured by the port throughput increased job opportunities and local and international growth. Another study was performed to explore the influence of supply chain connectivity between port performance and the economic growth of the country. Regression analysis and other statistical tests are used to measure economic growth, and it has been demonstrated that GDP and LSCI have significant impacts on the development of supply chain connectivity and logistics. Ayesu et al. [36] examined panel data from 28 African nations with major transportation hubs between 2010 and 2018 to analyse the relationship between the seaport efficiency, the economic growth and the port throughput. The work reported that the shipping company was generally motivated by the economic factors that maximized the overall turnaround profit rather than the environmental aspects [29].
The literature reviews on LSCI and GDP show that there was no seaport network efficiency study conducted for LSCI and GDP as the output variables. Another gap that can be highlighted here is that there is no such study that considers 133 countries in the world. This loophole permits the present research to extend the DEA approach on the seaport network efficiency measurement by considering the addition of other aspects. In this work, we have extended the applications of both triangular and trapezoidal fuzzy number theories to construct the fuzzy sets with the DEA approach. Moreover, despite much interest in DEA and fuzzy DEA, none of the past works have explored PLRLS using fuzzy efficiency values obtained from LSCI and GDP that contribute towards the seaport network efficiency boundedness domain. In summary, our present contributions that can fill the existing literature gaps can be highlighted as follows:
  • Investigation on seaport network efficiency using LSCI as an output variable in the DEA and fuzzy DEA which was not attempted by other researchers before.
  • DEA and fuzzy DEA were performed based on the data of 133 global seaport countries, the highest number of countries considered in similar studies on seaport network efficiency.
  • Utilization of triangular and trapezoidal fuzzy number theories to create fuzzy datasets from DEAs towards fuzzy DEA applications.
  • The seaport network efficiency boundedness concept and the domain using fuzzy numbers through PLRLS were introduced for the first time in this study.
  • The significance and how the findings of the present work can be appreciated by the maritime stakeholders were also briefed in the conclusion.

3. Data Sources and Variables

This study employs a three-year dataset (2018, 2019 and 2020) that belongs to 133 countries or DMUs, while the remaining countries with incomplete data had to be removed. The list of DMUs is provided in Table 1. The analysis was initiated using real data of four independent variables, which are median time in port (TP), average age of vessels (AV), maximum size of vessels (SV) based on gross tonnage (GT) and maximum cargo carrying capacity (CCC) of vessels based on deadweight tonnage (DWT). Data for these variables are collected from the maritime transport report published by UNCTADstat [2]. These input variables are crisp data that are pre-fixed or can be controlled by each DMU.
The output variables are fuzzy numbers derived from Gross Domestic Product (GDP) and the Liner Shipping Connectivity Index (LSCI). The GDP at buyer’s cost is the amount of gross worth added by all citizen producers in the economy in addition to any assessment items and subtracting any subsidies excluded from the worth of the items. The data was collected from the World Development Indicator (WDI) resource, which is known as the World Bank national accounts data collection of development indicators, compiled from officially recognized international sources [37]. On the other hand, the LSCI catches how well countries are associated with global shipping networks. It is provided by UNCTADstat based on the five parts of maritime transportation components: number of ships, the vessel container-carrying capacity, maximum vessel size, number of services and number of companies that deploy container ships in a country’s ports. Table 2 shows the input and output variables that are used in this study for seaport network efficiency measurements.

4. Mathematical Modelling

This work utilizes the techniques of DEA, fuzzy DEA based on triangular fuzzy number (TrFN), trapezoidal fuzzy number (TpFN) theories as well as fuzzy linear regression to assess the collected data for seaport network efficiency measurements. This section elaborates on the mathematical modelling for the classical DEA and fuzzy DEA methods, as described in Equations (1)–(6) [38].
The objective function is denoted by the formula that indicates the objective function and the constraints are fuzzy for classical DEA with L (minimum), M (mean) and H (maximum). Equation (1) represents the ( F H ) maximum value, Equation (6) represents the ( F M ) mean value and Equation (10) represents the ( F L ) minimum value of the objective function to estimate the DMU’s efficiency, respectively. We assume v 1 , v 2 , v 3   and   v 4 to be the input variables, while u 1   and   u 2   are the output variables of D M U j , with j = 1 , , 133 .
We can write the objective function of the maximum value ( F H ) in Equations (1)–(5) to represent the constraints of maximum efficiency score shown in Case 1 (DEA). In classical DEA, the constraint in Equation (2) is always equal to unity. Equation (3) represents the summation difference between the output and input variables with zero as the upper limit, while the values of the input and output values must always be positive. The same constraints apply to the mean and minimum objective functions in Equations (5) and (9), respectively.
Case 1 (DEA):
m a x   F H b = 1 2 u b y b j
subject to
d = 1 4 v d H x d j = 1 ,
b = 1 2 u b H y b j d = 1 4 v d H x d j 0 ,
u b H ,   v d H 0 , b = 1 , 2 ,   d = 1 , , 4 .
The mean value objective function can be written as in Equation (5), while the constraints for the objective function ( F M ) can be represented by Equations (6)–(8), as shown in Case 2 (DEA).
Case 2 (DEA):
m a x   F M b = 1 2 u b y b j
subject to
d = 1 4 v d M x d j = 1 ,
b = 1 2 u b M y b j d = 1 4 v d M x d j 0 ,
u b M , v d M 0 , b = 1 , 2 , d = 1 , , 4 .
Equations (10)–(12) indicate the constraints for minimum efficiency score where Equation (1) can be written as the objective function of the minimum value of ( F L ) in Case 3 as Equation (9)
Case 3 (DEA):
m a x   F L b = 1 2 u b y b j
subject to
d = 1 4 v d L x d j = 1 ,
b = 1 2 u b L y b j d = 1 4 v d L x d j 0 ,
u b L ,   v d L 0 ,   b = 1 , 2 , d = 1 , , 4 .
The classical DEA model in Equations (1)–(12) can be modified to a fuzzy DEA model using triangular fuzzy numbers (L-minimum, M-mean, H-maximum), as shown in Equation (13) (Case A) [12]. The objective function for fuzzy DEA is taken by maximizing the division of the output variable fuzzy number and input variable fuzzy number. The constraints for the maximum objective function Equation (13) are given in Equation (14), which show that the ratio of the fuzzy output number summation to the fuzzy input number summation must not exceed zero. The constraints in Equation (15) represent that the input’s lowest value is zero, whereas the highest values are bigger than the mean values. The conditions are similar for the output variables.
Case A (FDEA):
m a x b = 1 2 ( u b L y b j L + u b M y b j M + u b H y b j H )   d = 1 4 ( v d L x d j L + v d M y d j M + v d H y d j H )  
subject to
b = 1 2 ( u b L y b j L + u b M y b j M + u b H y b j H )   d = 1 4 ( v d L x d j L + v d M y d j M + v d H y d j H )   0 ,
v d L 0 , v d M v d H ,   1 d 4 ,
u b L 0 , u b M u b H ,   1 b 2 .
The fuzzy DEA model can be reformulated by maximizing the output subject to the input, which is equal to 1, hence, the power index can be enhanced by removing some limitations in the model as written in Equation (17) as the objective function. We transformed it to a linear model, as provided in Equations (17) and (23), based on prior research because this non-linear model increases complexity and is difficult to be solved on extremely big data [39]. The constraint Equation (18) has been linearized by making the maximization equal to 1, as shown in Case B.
Case B (FDEA):
m a x b = 1 2 ( u b L y b j L + u b M y b j M + u b H y b j H )
subject to
d = 1 4 ( v d L x d j L + v d M y d j M + v d H y d j H ) = 1 ,
b = 1 2 ( u b L y b j L + u b M y b j M + u b H y b j H ) d = 1 4 ( v d L x d j L + v d M y d j M + v d H y d j H ) 0 ,
v d L v d M 0 ,   v d H v d M 0 ,   v d L v d M v d H 0   if   1 d 4 ,  
u b L u b M 0 , u b H u b M 0 , u b L u b M u b H 0   if   1 b 2 .
The difference between the summation of fuzzy output and input is less than zero. Next, Equations (20) and (21) are transformed to Case C by adding   ε to Equations (20) and (21).
Case C (FDEA):
m a x b = 1 2 ( u b L y b j L + u b M y b j M + u b H y b j H )
subject to
d = 1 4 ( v d L x d j L + v d M y d j M + v d H y d j H ) = 1 ,
b = 1 2 ( u b L y b j L + u b M y b j M + u b H y b j H ) d = 1 4 ( v d L x d j L + v d M y d j M + v d H y d j H ) 0 ,
v d L v d M ε , v d H v d M ε ,   v d L v d M v d H 0   if   1 d 4 ,
u b L u b M ε ,   u b H u b M ε ,   u b L u b M u b H 0   if   1 b 2 .
Finally, the constraint is modified with ε > 0 where ε is a small positive number that weights the midpoint to a larger value than the end point as in Equations (22) and (23) [40].
Note that Case 1, Case 2 and Case 3 in Equations (1)–(12) represent three different DEA models, whereas Case A, Case B and Case C are continuous transformations of a fuzzy DEA model based on TrFN theory. It is crucial to add data fuzzification to DEA in order to correctly reflect the real-world data scenario. TrFN is the most frequently used method [41] to construct fuzzy sets with DEA in various studies. Similar approaches can also be built with trapezoidal fuzzy numbers (TpFN) [42]. Using TrFN and TpFN, the seaport network efficiency scores can further be evaluated and compared in this study.

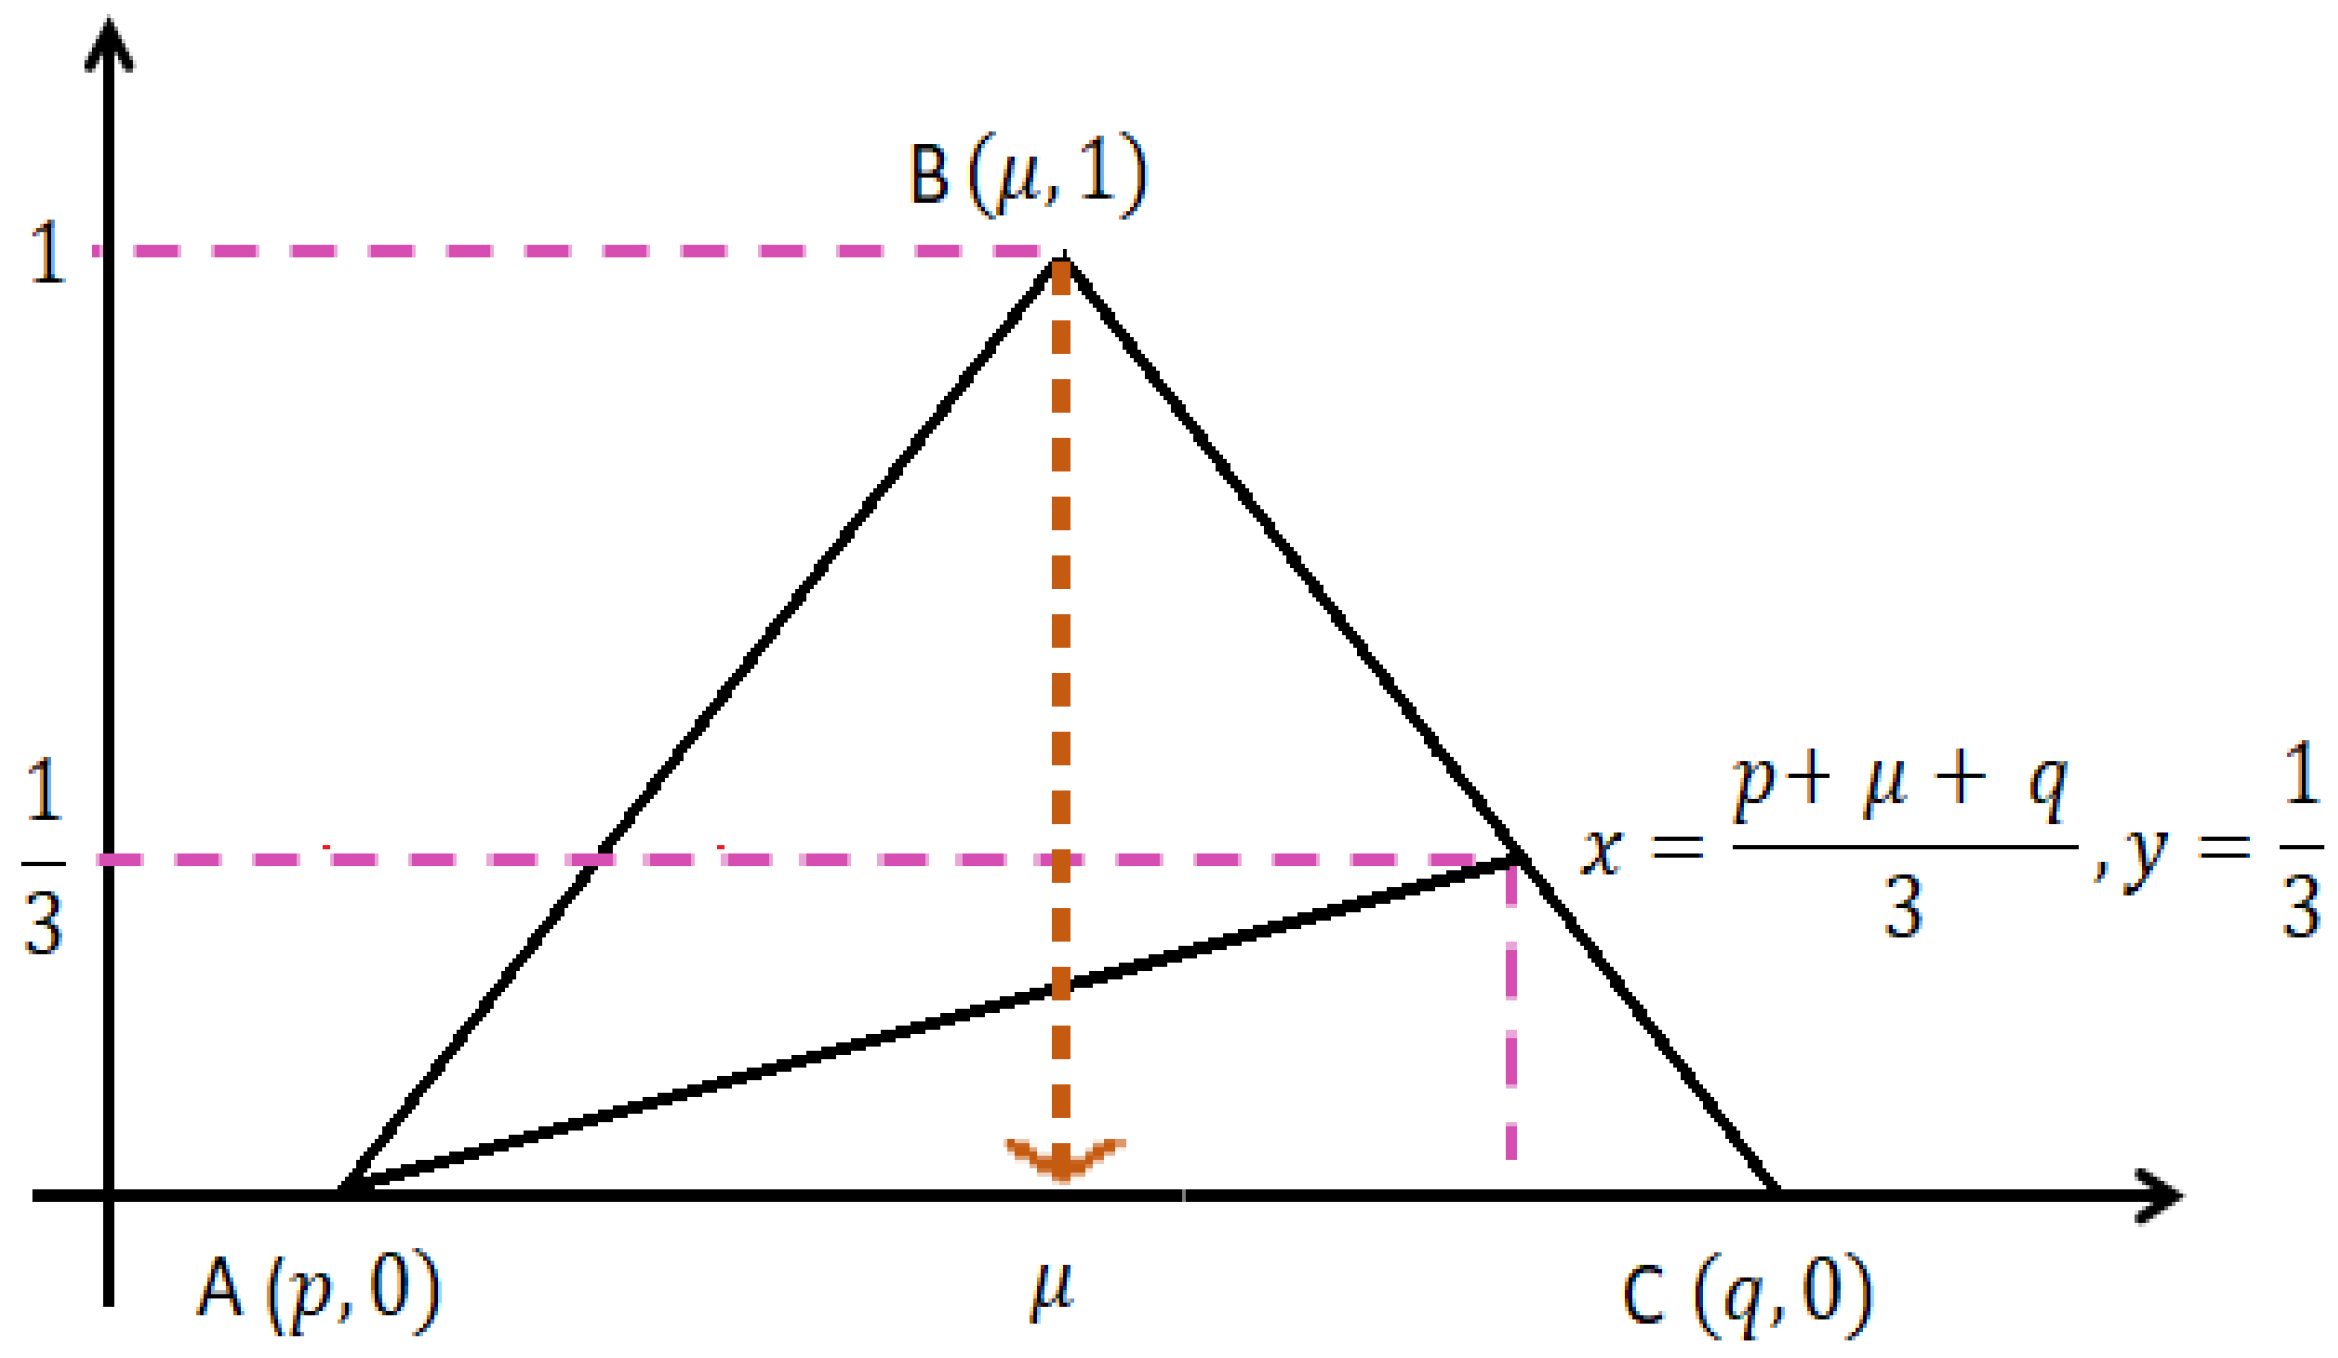
4.1. Triangular Fuzzy Number (TrFN)

Fuzzy numbers are created based on triangular fuzzy decision-theoretic rough sets to satisfy a fuzzy environment. The enrolment capacity of a fuzzy number needs to fulfil the states of convexity and normality that adhere to the basic terms of triangular fuzzy number and arithmetic operations [43]. A triangular fuzzy number sums up an idea of a real number, hence, it fits the membership function F N ( x ) defined in Equation (24) based on minimum ( p ), mean   ( μ ) and maximum ( q ) values e.g., p < μ < q :
F N ( x ) = ( m i n , m e a n , m a x ) = { x m i n m e a n m i n ,   m i n x m e a n ; m a x x m a x m e a n ,   m e a n x m a x ; 0   ,   o t h e r w i s e .
Consider GDP = ( p 1 , μ 1 , q 1 ) and LSCI = ( p 2 , μ 2 , q 2 ) as two TrFNs where p 1 is the minimum value for GDP, μ 1 is the mean value of GDP, q 1 is the maximum value of GDP, p 2   is the minimum value for LSCI, μ 2 is the mean value of LSCI and q 2 is the maximum value of LSCI. These triangular fuzzy numbers can operate on four basic arithmetic operations, as follows [44]:
Addition:
GDP + LSCI = ( p 1 + p 2 ,   μ 1 + μ 2 ,   q 1 + q 2 )
Subtraction:
GDP LSCI = ( p 1 p 2 ,   μ 1 μ 2 ,   q 1 q 2 )
Product:
GDP × LSCI = ( p 1 × p 2 ,   μ 1 × μ 2 ,   q 1 × q 2 )
Quotient:
GDP ÷ LSCI = ( p 1 ÷ p 2 ,   μ 1 ÷ μ 2 ,   q 1 ÷ q 2 )
Equation (25) represents the addition of minimum GDP and LSCI, similarly for mean and maximum values. Equation (26) is the subtraction, whereas Equations (27) and (28) are the product and quotient rules for the minimum, mean and maximum values, respectively.
Proposition 1.
The  α -cut,  F α  of a TrFN, given  F = ( p ,   μ ,   q )  and  α [ 0 ,   1 ] , is calculated by Equation (29):
F α = [   F p α , F q α ] = [ p + α ( μ p ) ,   q α ( q μ ) ] .
The  α -cut is used in TrFN to best describe the fuzzy number calculation [45]. The   α -cut point for the left and right bounds in Equation (29) are elaborated as  α = q x q μ  and  α = x p μ p , respectively.
Proposition 2.
The coordinates  ( x ,   y )  of a triangle  ( p ,   μ ,   q )  forming the graph of the TrFN are calculated by using the formula in Equation (30):
x = p + μ + q 3 ,   y = 1 3 .
The  x -coordinate in Equation (30) takes the average of minimum ( p ) , mean ( μ )  and maximum ( q )  values along the bottom side of the triangle, whereas the  y -coordinate is taken as the one third of the height of the triangle, as depicted in Figure 1. The graph of the TrFN,  ( p ,   μ ,   q )  is the triangle ABC with  A ( p ,   0 ) ,     B ( μ ,   1 )   and  C ( q ,   0 )  as the edge points. The intersection point of ABC is the median [45].

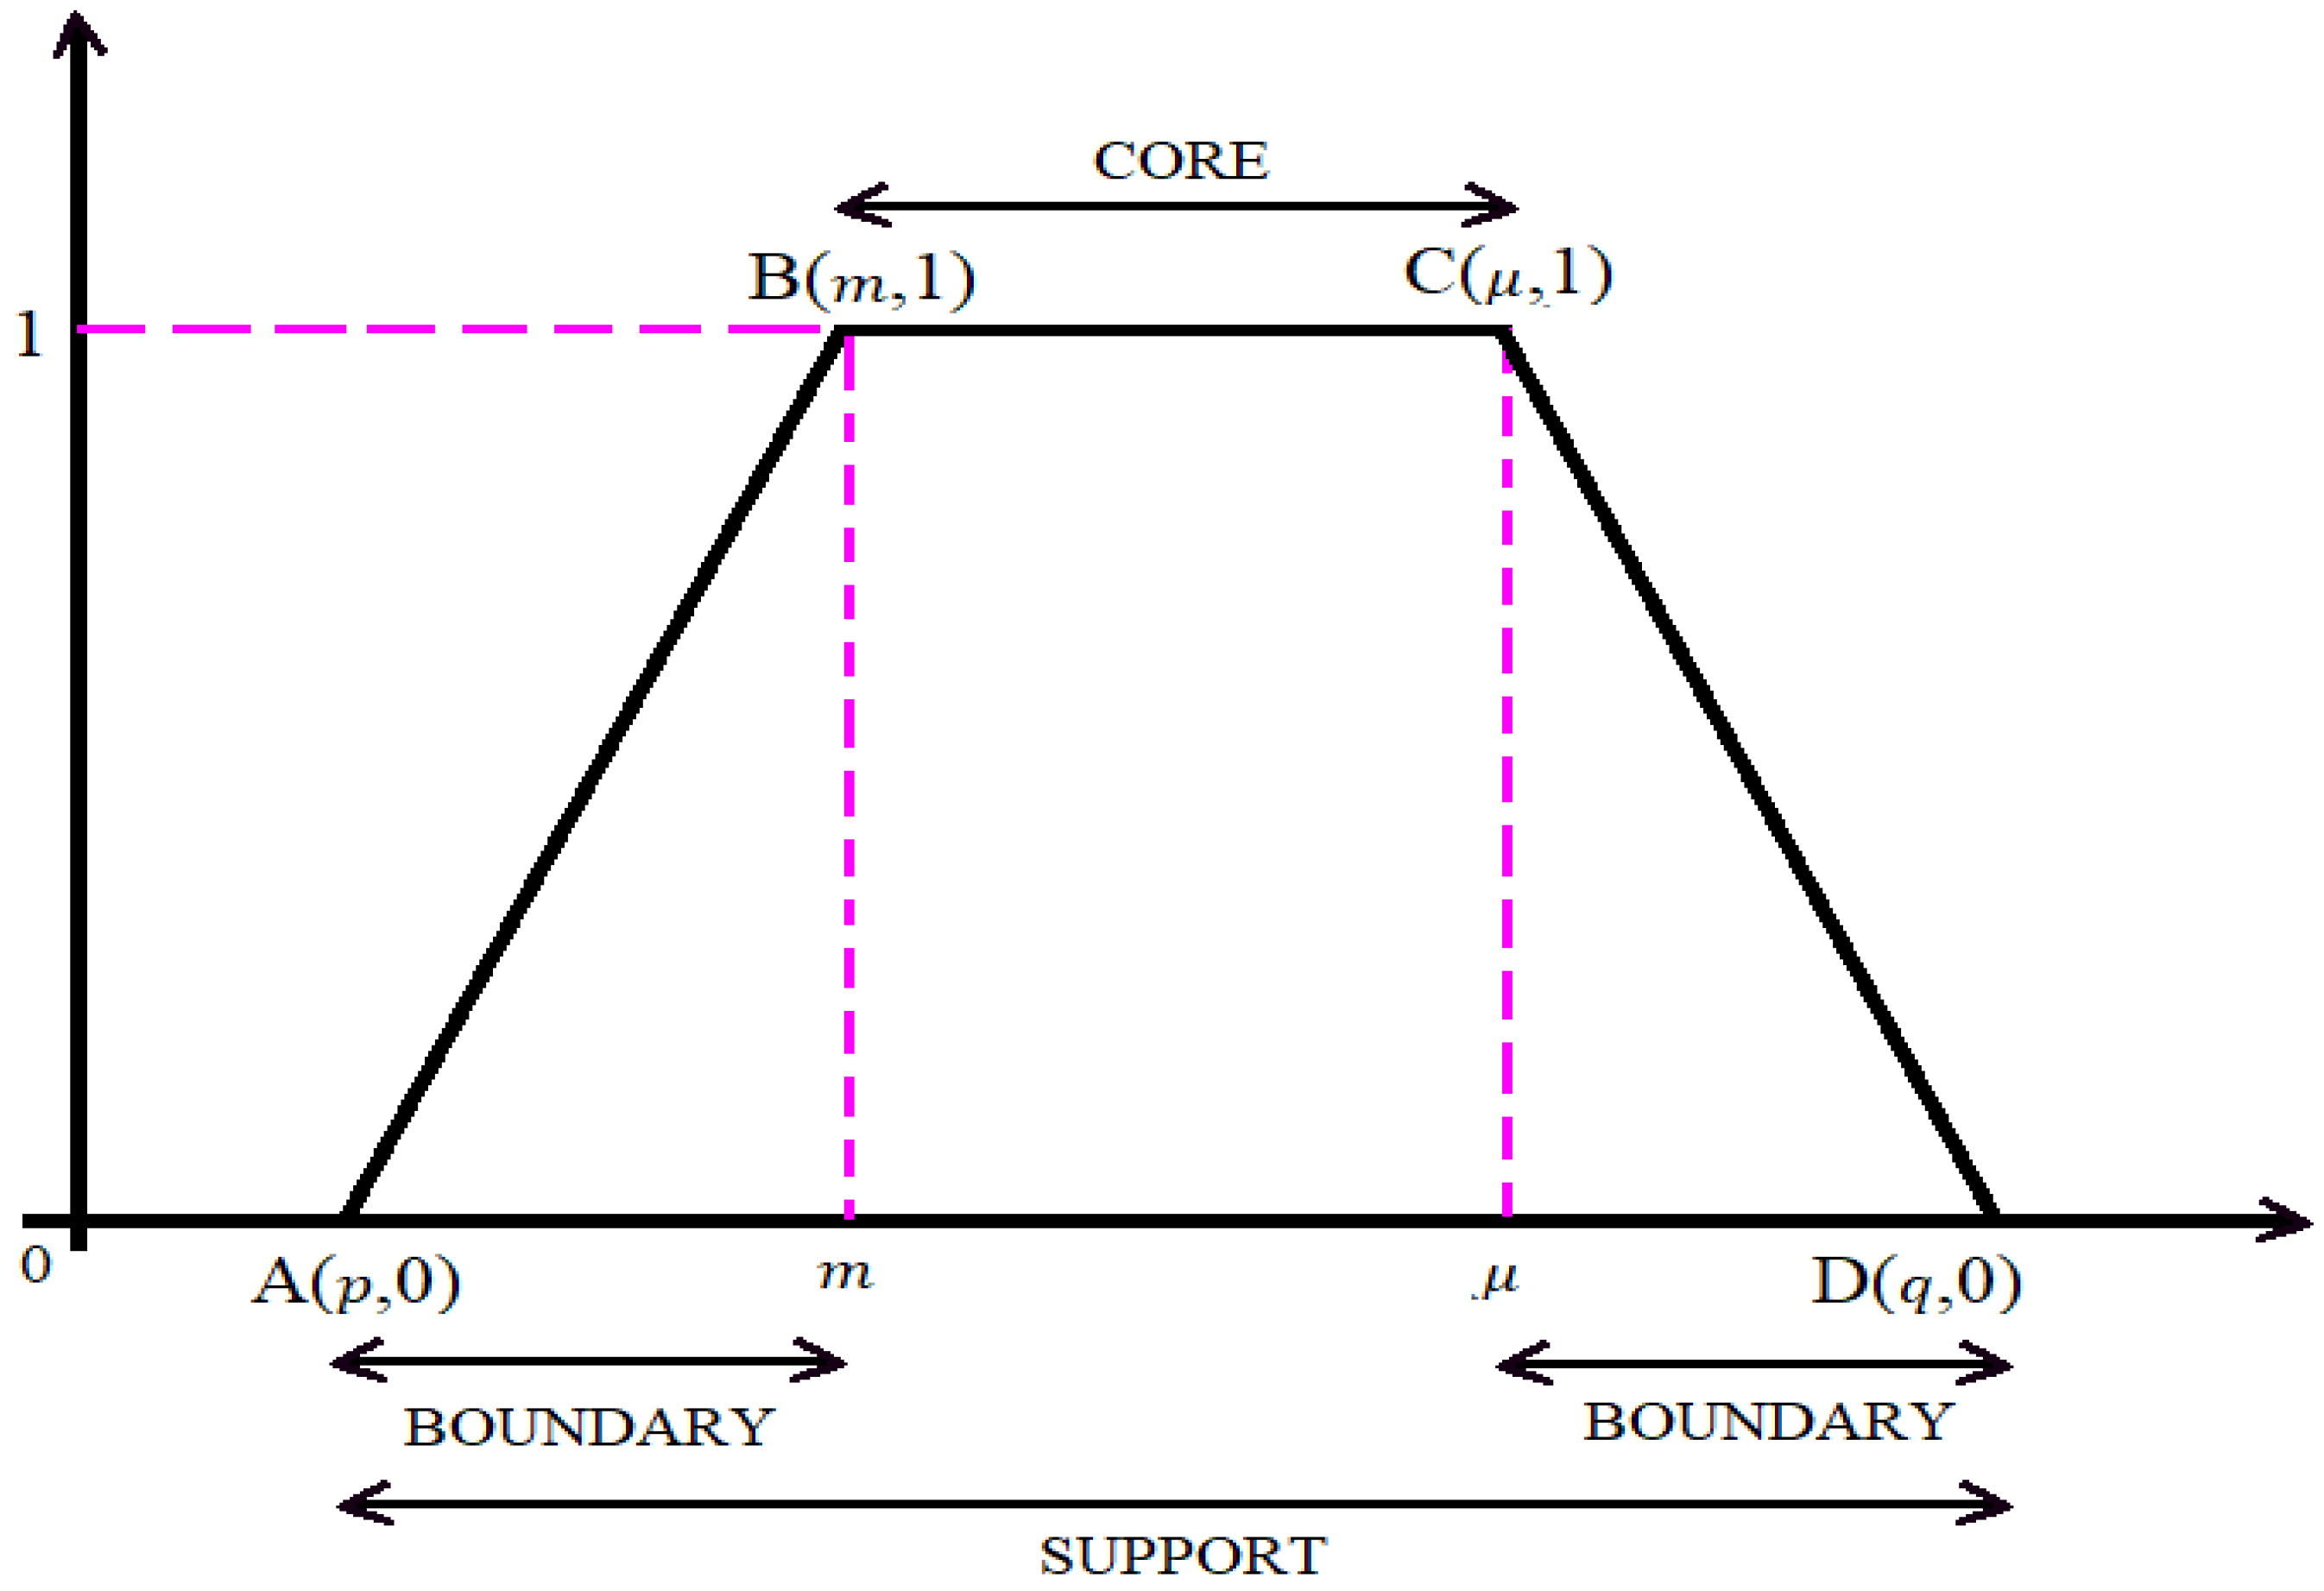
4.2. Trapezoidal Fuzzy Number (TpFN)
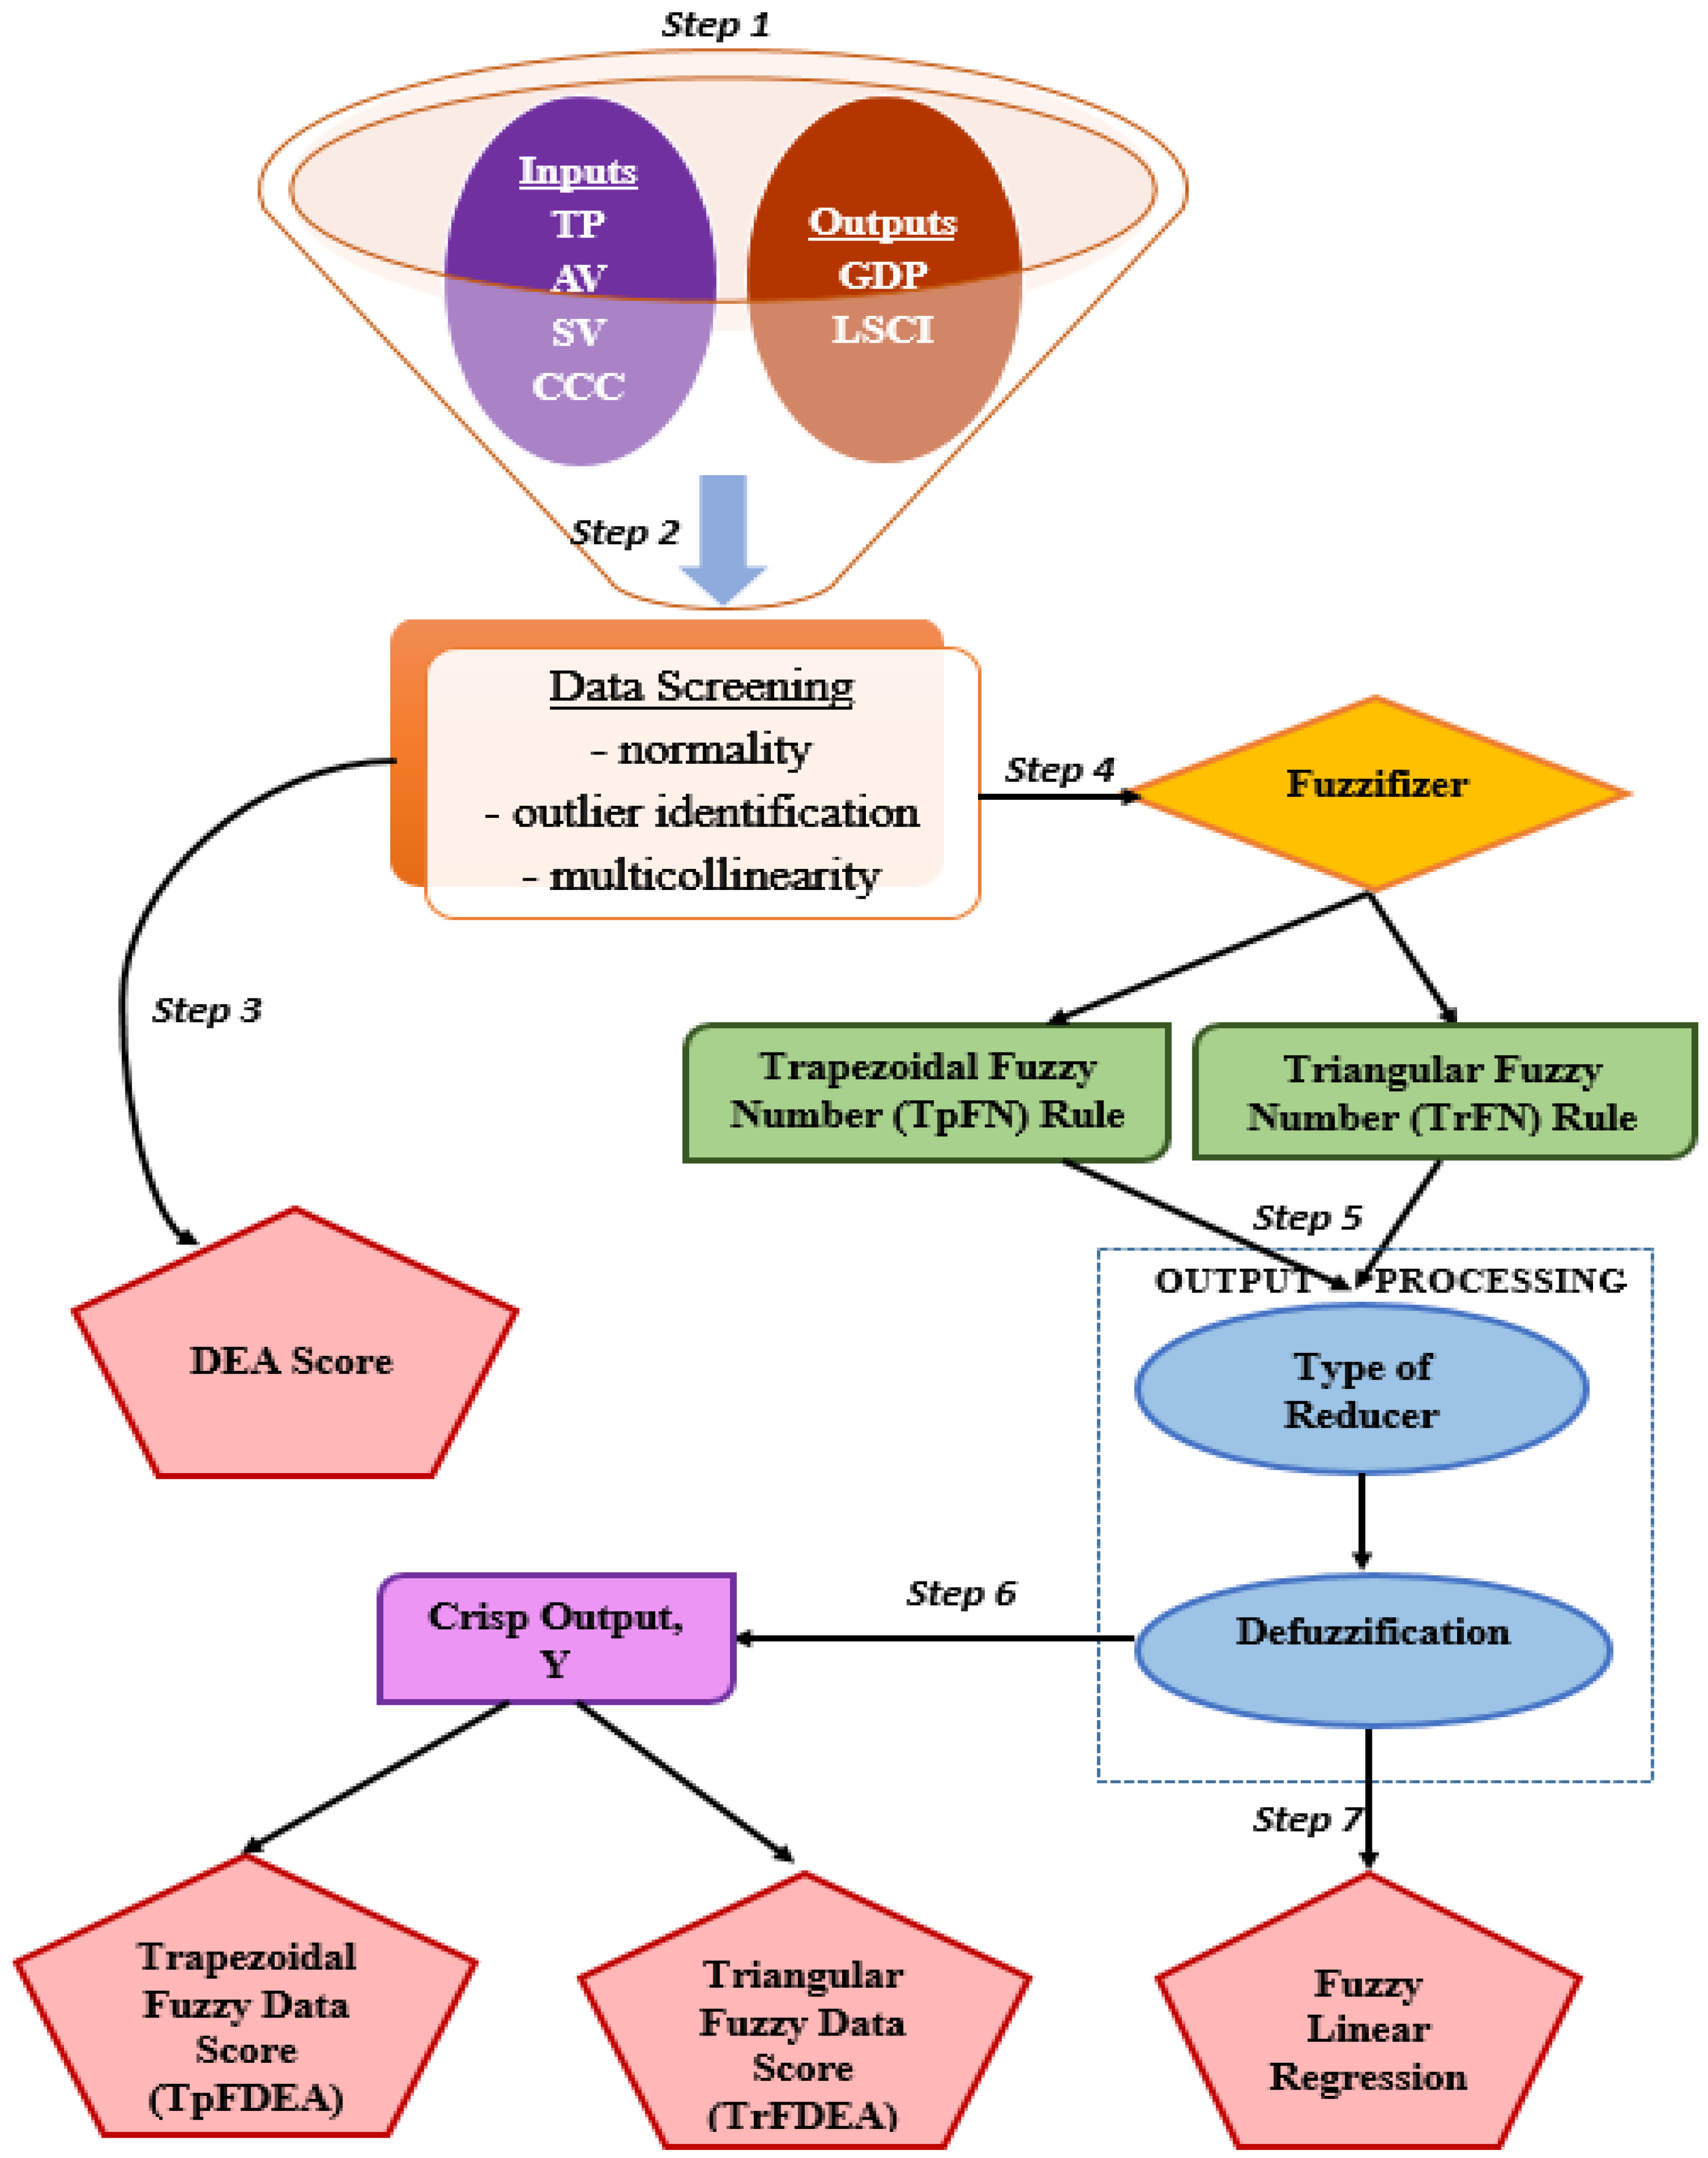
The fuzzy set A = (a, b, c, d) is known as a set of trapezoidal fuzzy numbers if its membership function F N T ( x ) is defined by the minimum ( p ), median ( m ) , mean   ( μ ) and maximum ( q ) values where p m     μ     q in Equation (31):
F N T ( x ) = ( m i n ,   m e d i a n ,   m e a n , m a x ) = {   0 ,   x < m i n ;   x m i n m e d i a n m i n ,   m i n x m e d i a n ;   1 ,   m e d i a n x m e a n ; m a x x m a x m e a n ,   m e a n x m a x ; 0 ,   o t h e r w i s e .  
In TpFN theory, it includes four values to acquire an accurate result [46]. Equation (31) shows a slight difference at the core that holds the value 1 for the range of x between the median and the mean values, in comparison to TrFN. The graph of the TpFN, ( p ,   m , μ ,   q ) is the trapezium ABCD with A ( p ,   0 ) ,     B ( m ,   1 ) ,     C ( μ ,   1 )   and D ( q ,   0 ) as the edge points in Figure 2.

4.3. Methodology

There are three main methodology outcomes from this research, which are divided into DEA, fuzzy DEA and fuzzy linear regression. The step-by-step procedures as supported by Figure 3 are listed as follows:
Step 1: Data collection of input and output variables was performed.
Step 2: Data screenings for normality, multicollinearity and outlier identifications were conducted.
Step 3: DEA scores were computed.
Step 4: The output data were fuzzified. TrFN rule was applied to produce minimum (p), mean ( μ ) and maximum (q) values of the output data. TpFN rule was applied to produce minimum (p), median (m), mean ( μ ) and maximum (q) values of the output data.
Step 5: Fuzzy DEA scores were computed using the TrFN and TpFN obtained in Step 4.
Step 6: Defuzzification was performed to obtain crisp output data for the TrFDEA scores and the TpFDEA scores.
Step 7: Using the data in Step 4, fuzzy linear regression was performed.

5. Results and Empirical Analysis
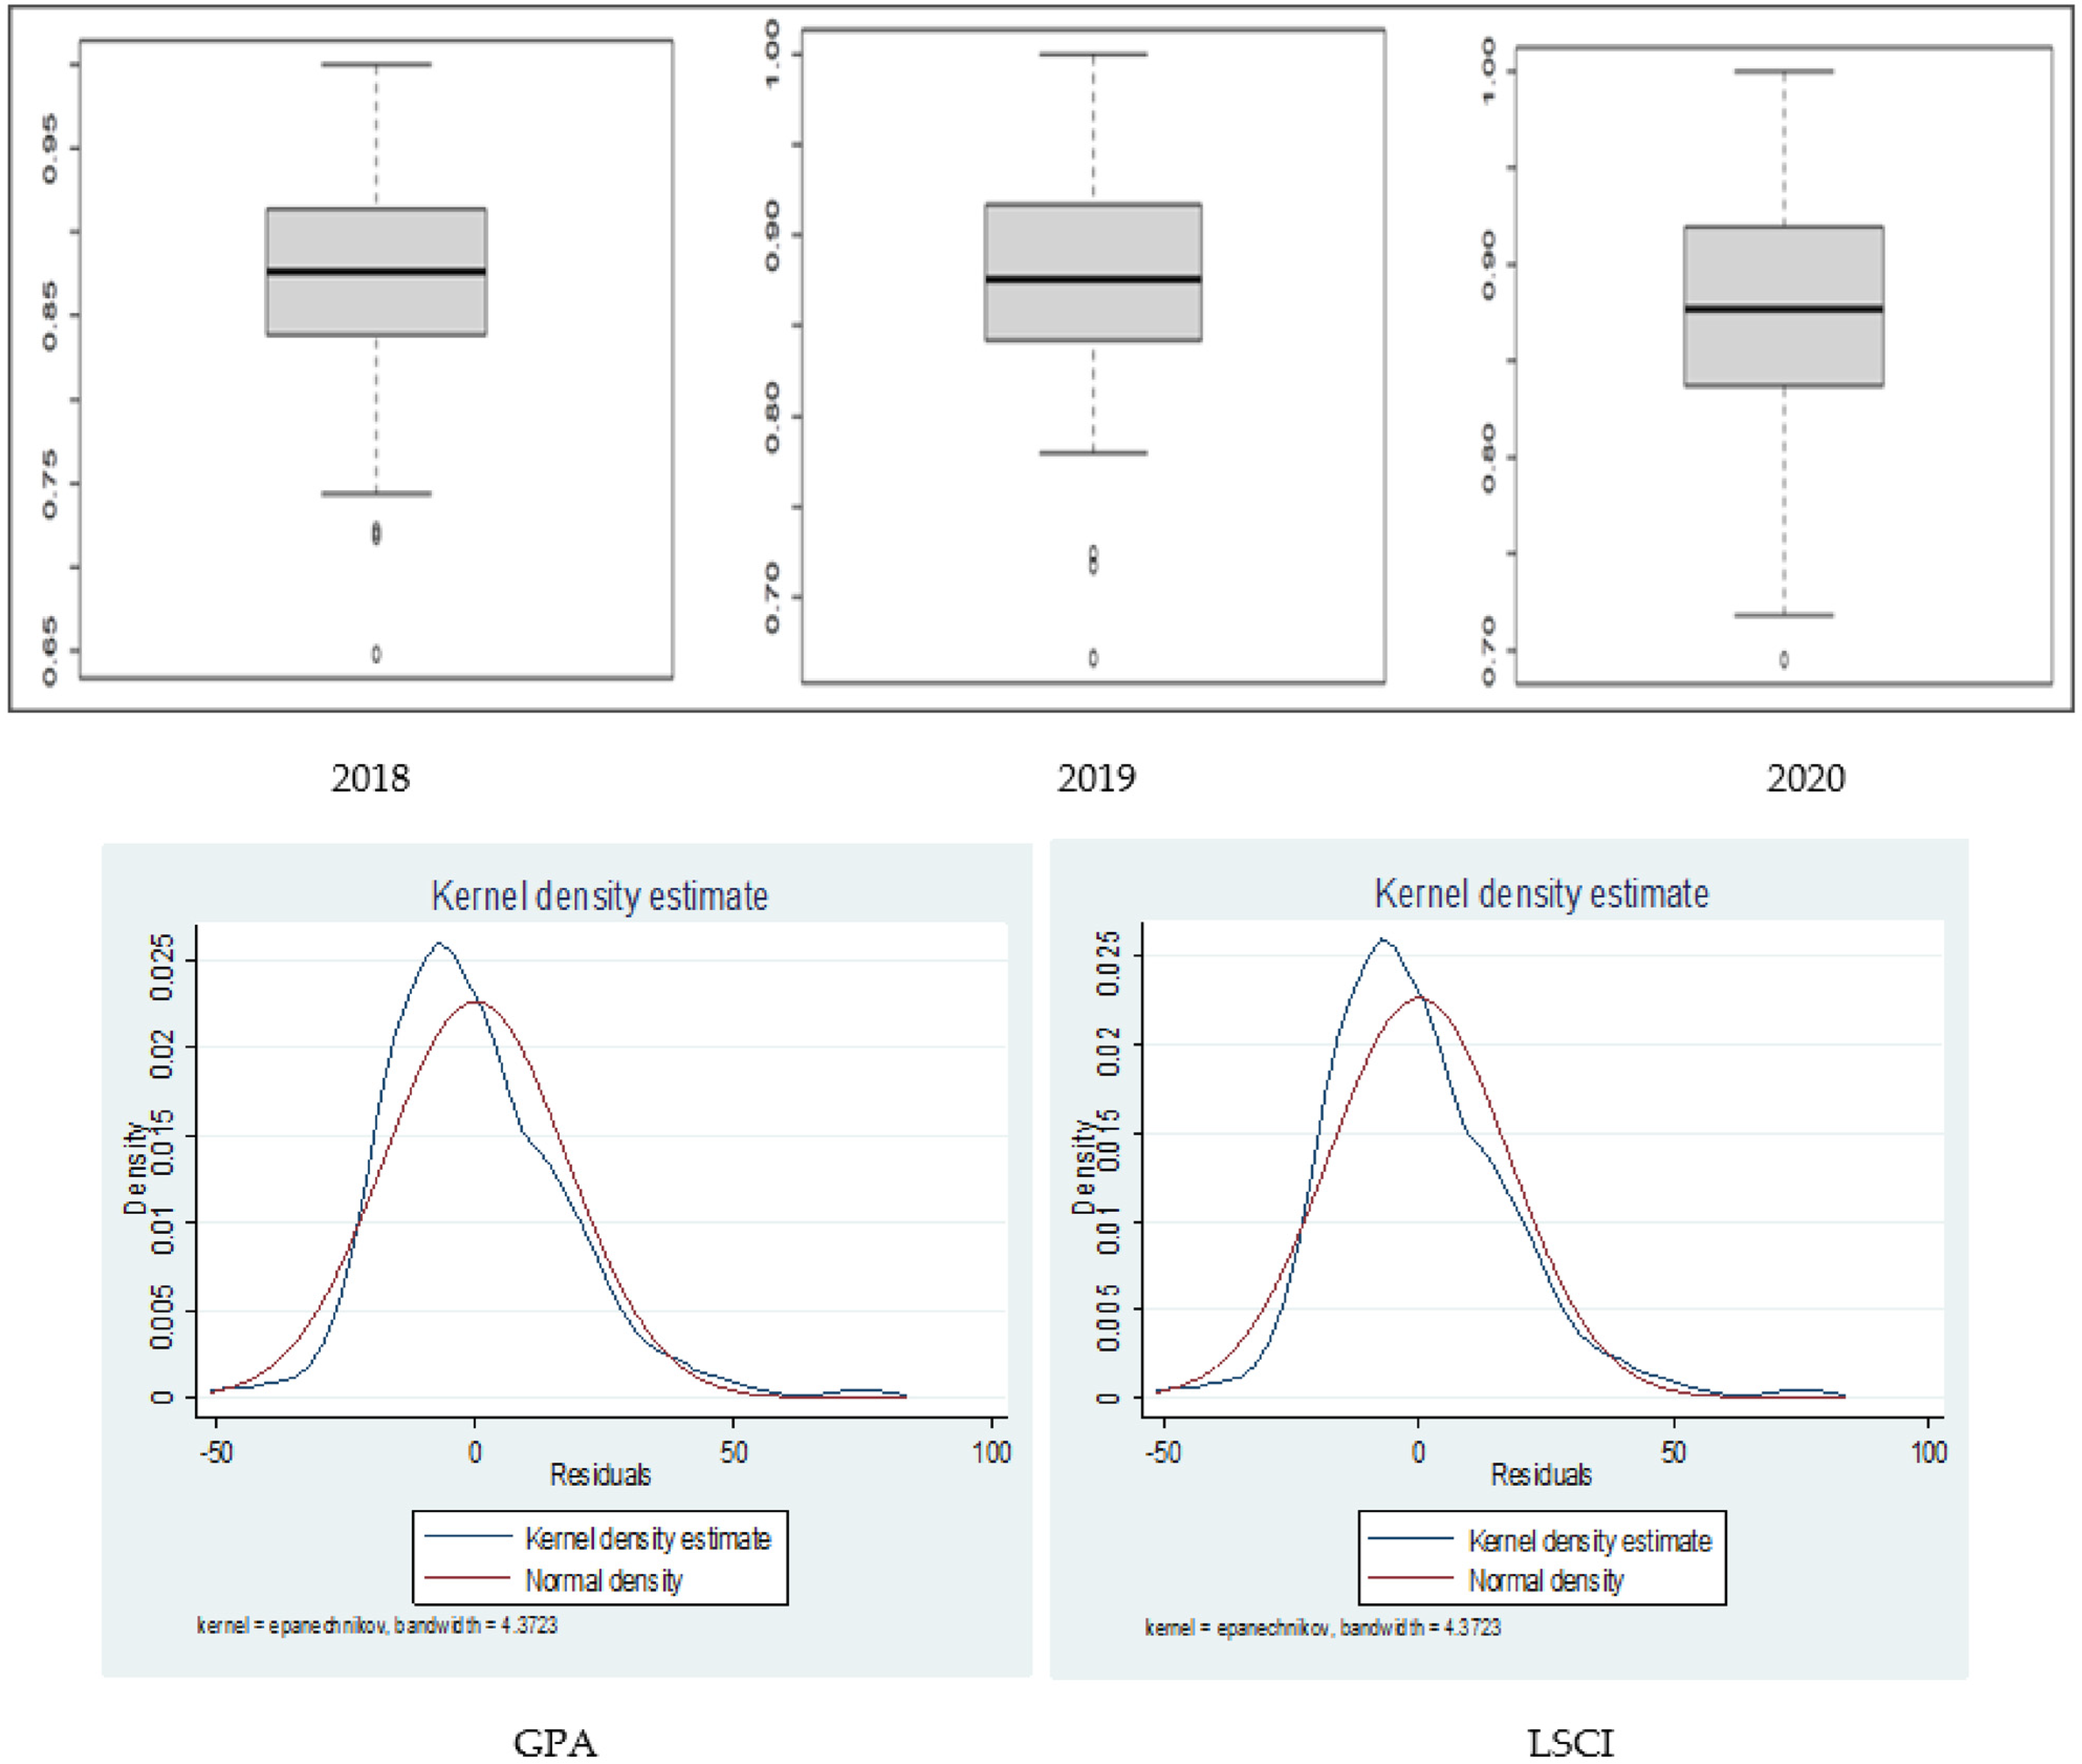
5.1. Data Screening

Data screening was performed to fit some statistical assumptions on data normality, outlier identification and multicollinearity, prior to deep analysis. Fuzzy regression follows basic regression assumptions, and the model must be measured with a normality that shows a bell shape distribution in normal kernel density [47]. Outlier identification was conducted to determine which outliers are typical of reliable data points (and should be maintained) and which outliers are probably errors and have to be eliminated from the data collection [48]. The effect of outliers is common and can have a huge impact on data distribution. An outlier test needs to be performed for the outlier removal before the clean data can be used. Figure 4 and Table 3 demonstrate all the three assumptions of multiple regression.
The data were normally distributed after two countries were removed from the dataset by using the STATA software. Box plot was performed to check the outlier, and it was identified that three countries (Cabo Verde, Slovenia and Curacao) had extreme values compared to other countries, as shown in Figure 4. The three countries were then removed from the study, making only 133 countries left for further analysis. The output from STATA showed that the data for LSCI and GDP were normally distributed. Kernel density estimation showed that the probability density function contributed towards the improvement of the distribution in comparison to the traditional histogram. Normal density in the study showed a symmetric, single-peaked bell-shaped density curve, therefore, the dependent variables were normally distributed.
In addition to normality and outlier identification, multicollinearity was another basic requirement in the study that needed to be treated before further analysis. Multicollinearity is a term that describes the correlation of numerous independent variables in a model. The analysis should be without multicollinearity to produce accurate models [49]. Hair et al. [50] recommended that variance inflation factor (VIF) values should not be more than 10 in order to clear the collinearity. They claimed that multicollinearity of all variables below 7 of the VIF is not a main problem. Yet, there was another study by Garson [51] who claimed that the VIF value must be less than 4 according to the rule of thumb to avoid the multicollinearity problem. Although there are other studies that claimed a VIF of less than 5 is acceptable, in this study a threshold value for VIF was taken as 4. Based on the Table 3, all the VIF values were less than 4 and it proved that the level of correlation between the variables was stable and multicollinearity does not exist in this study.

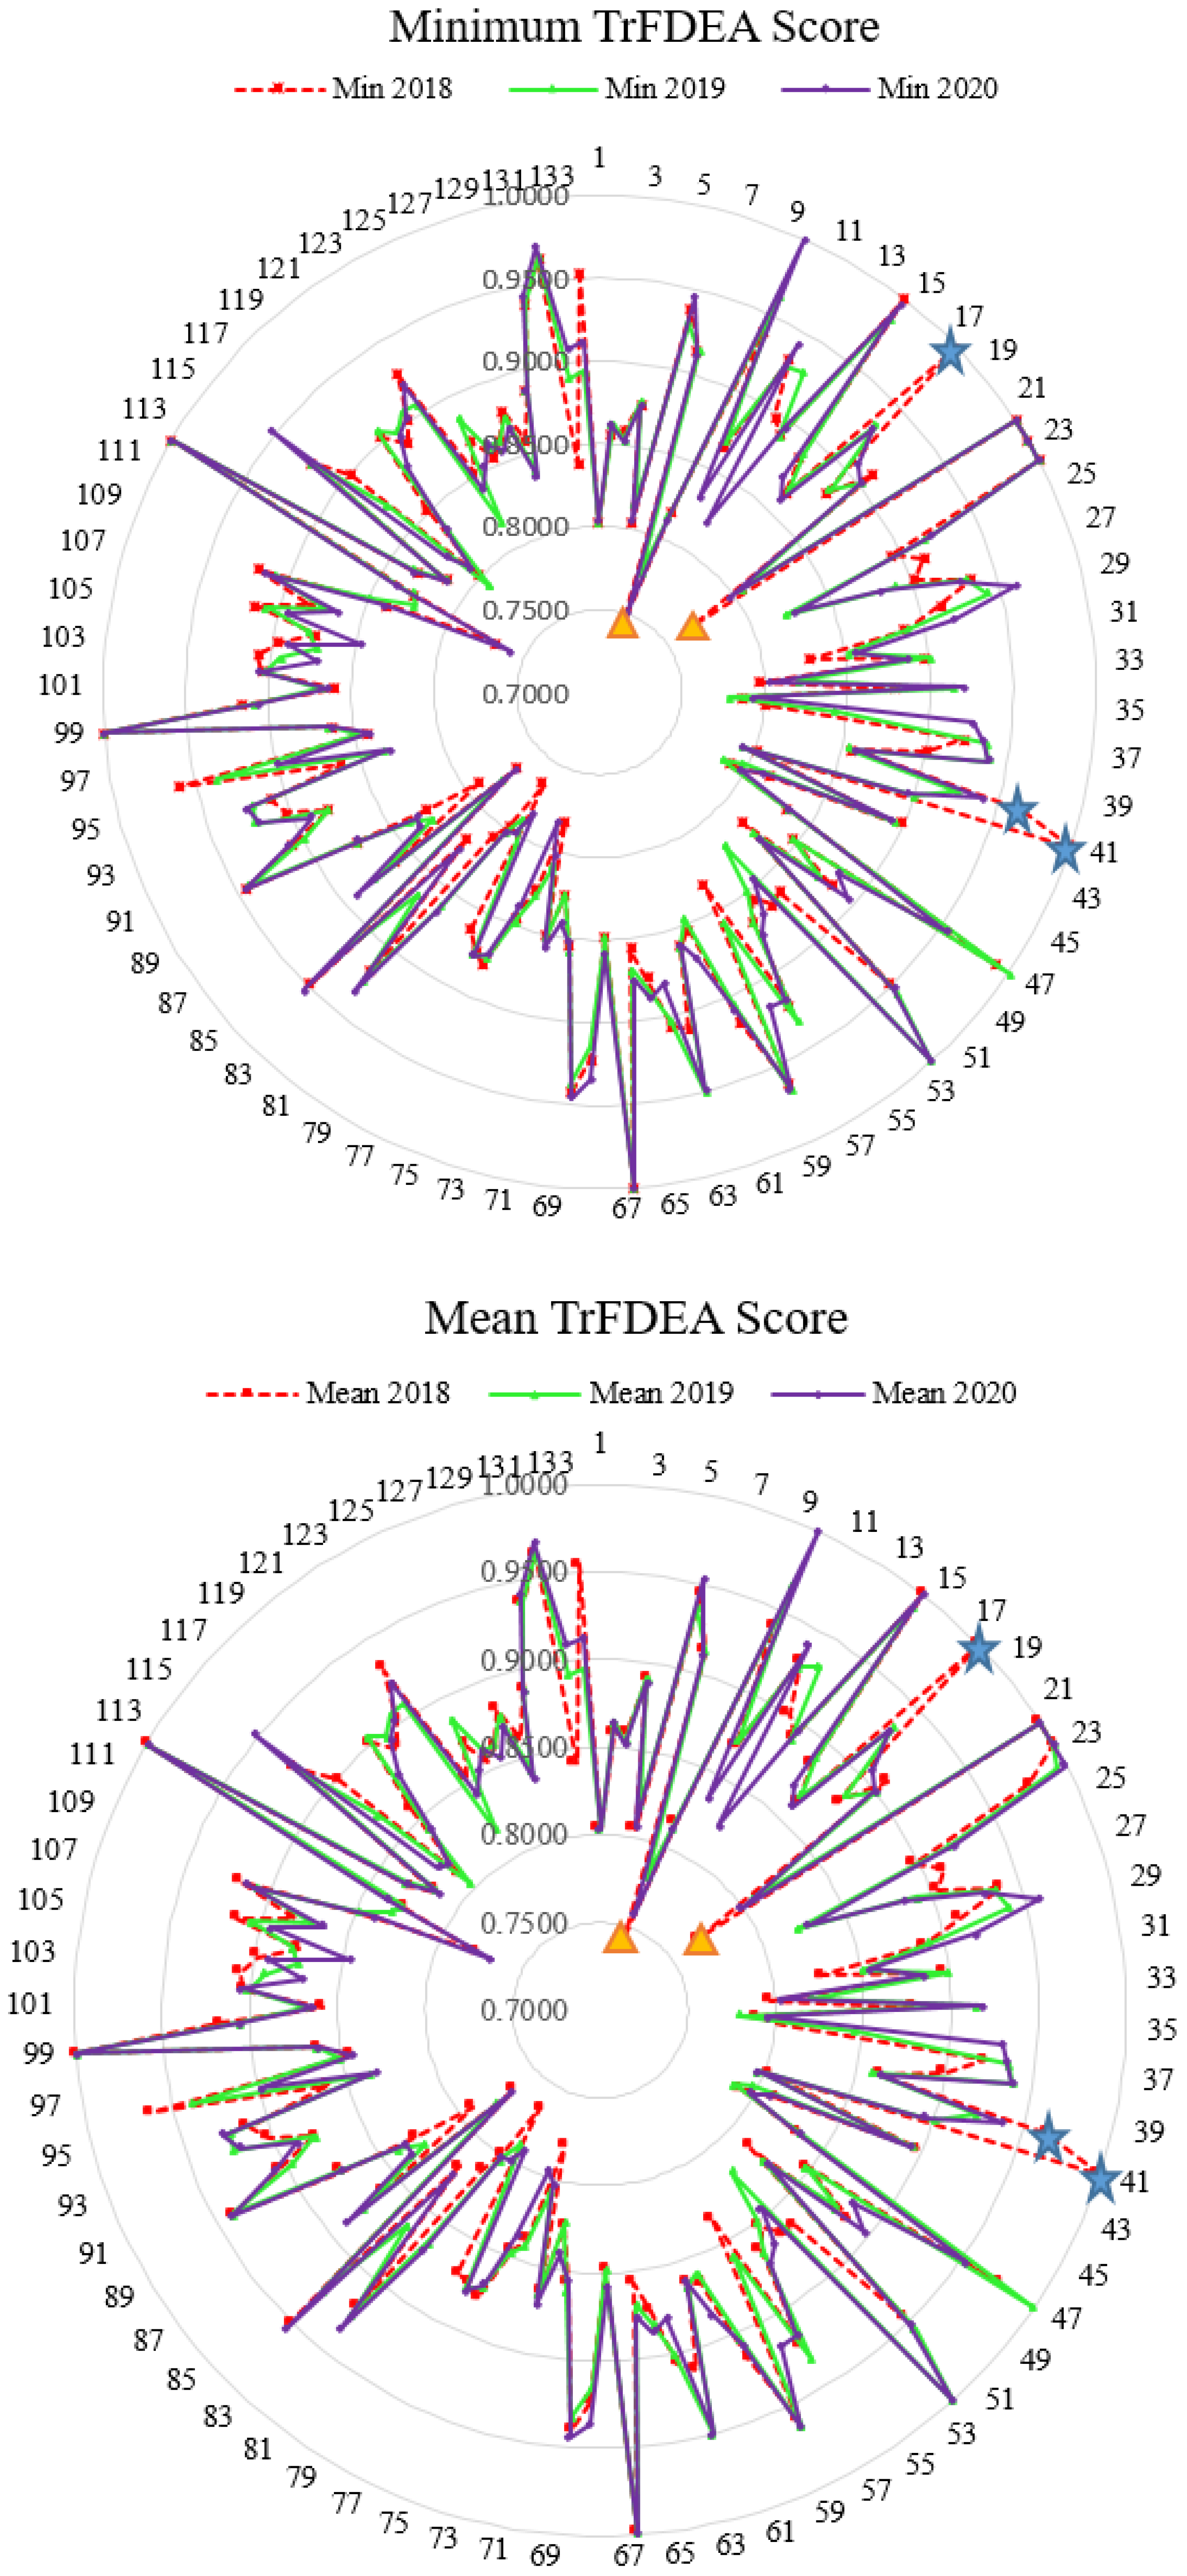
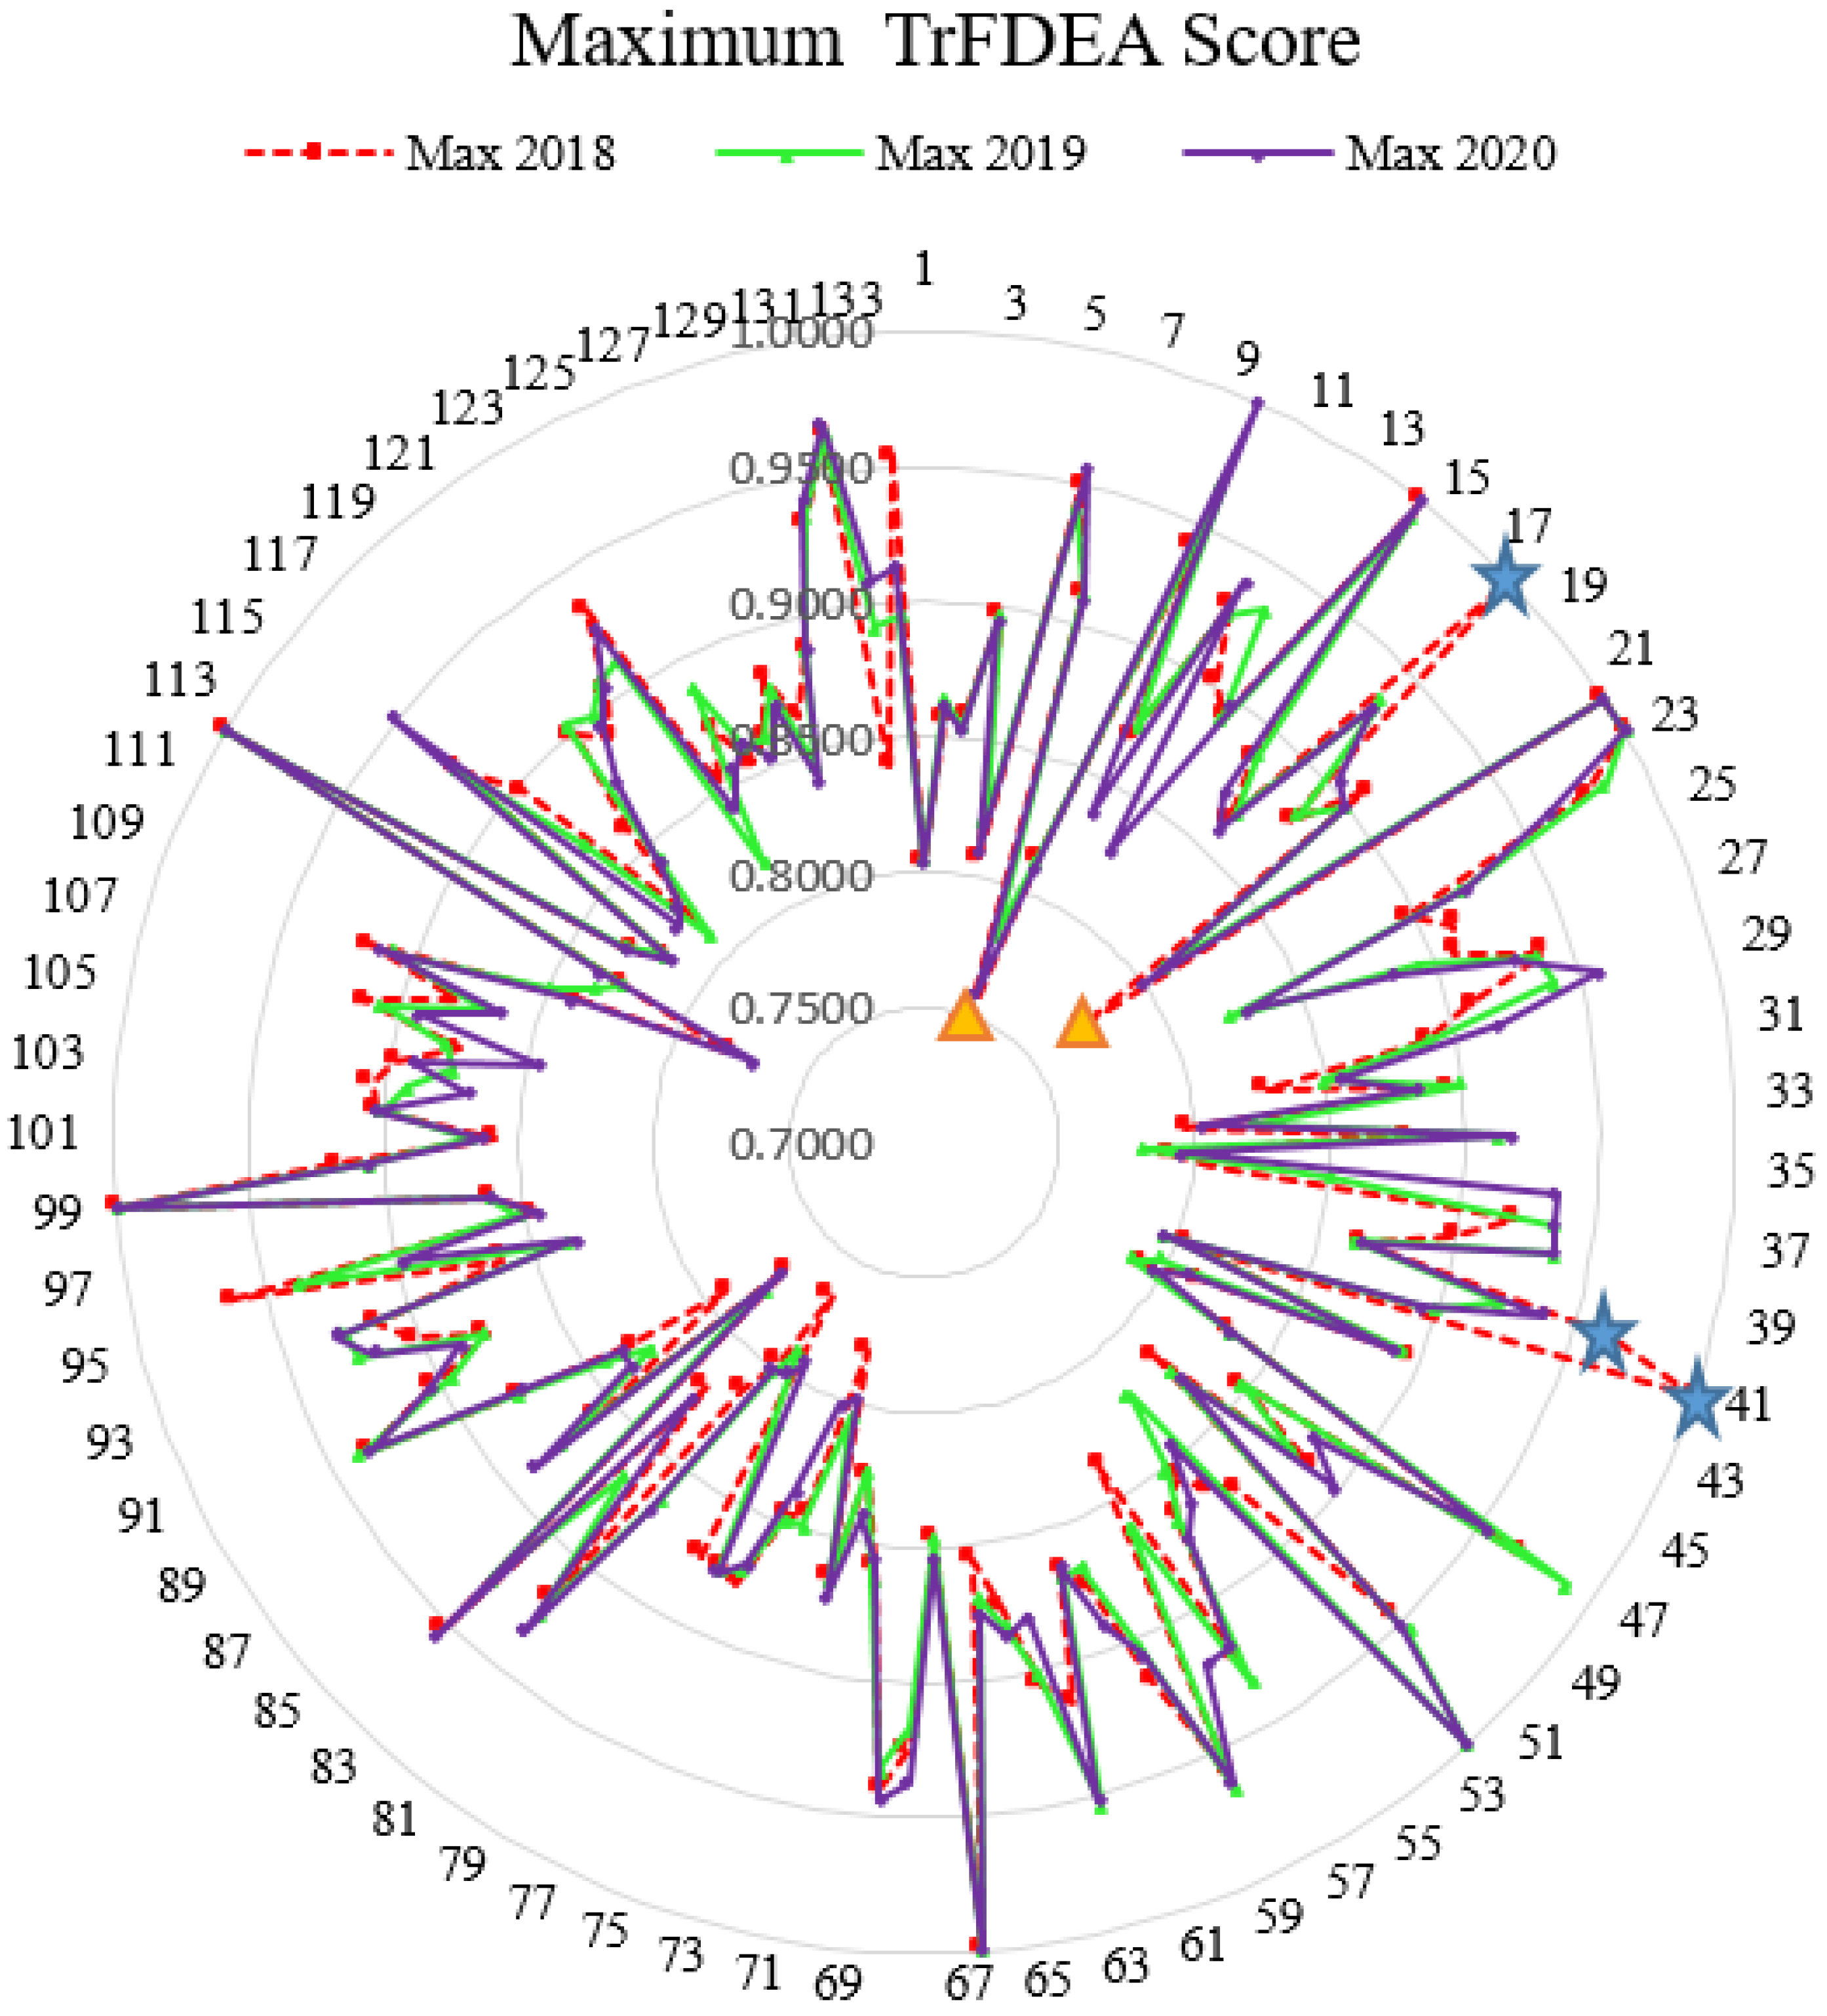
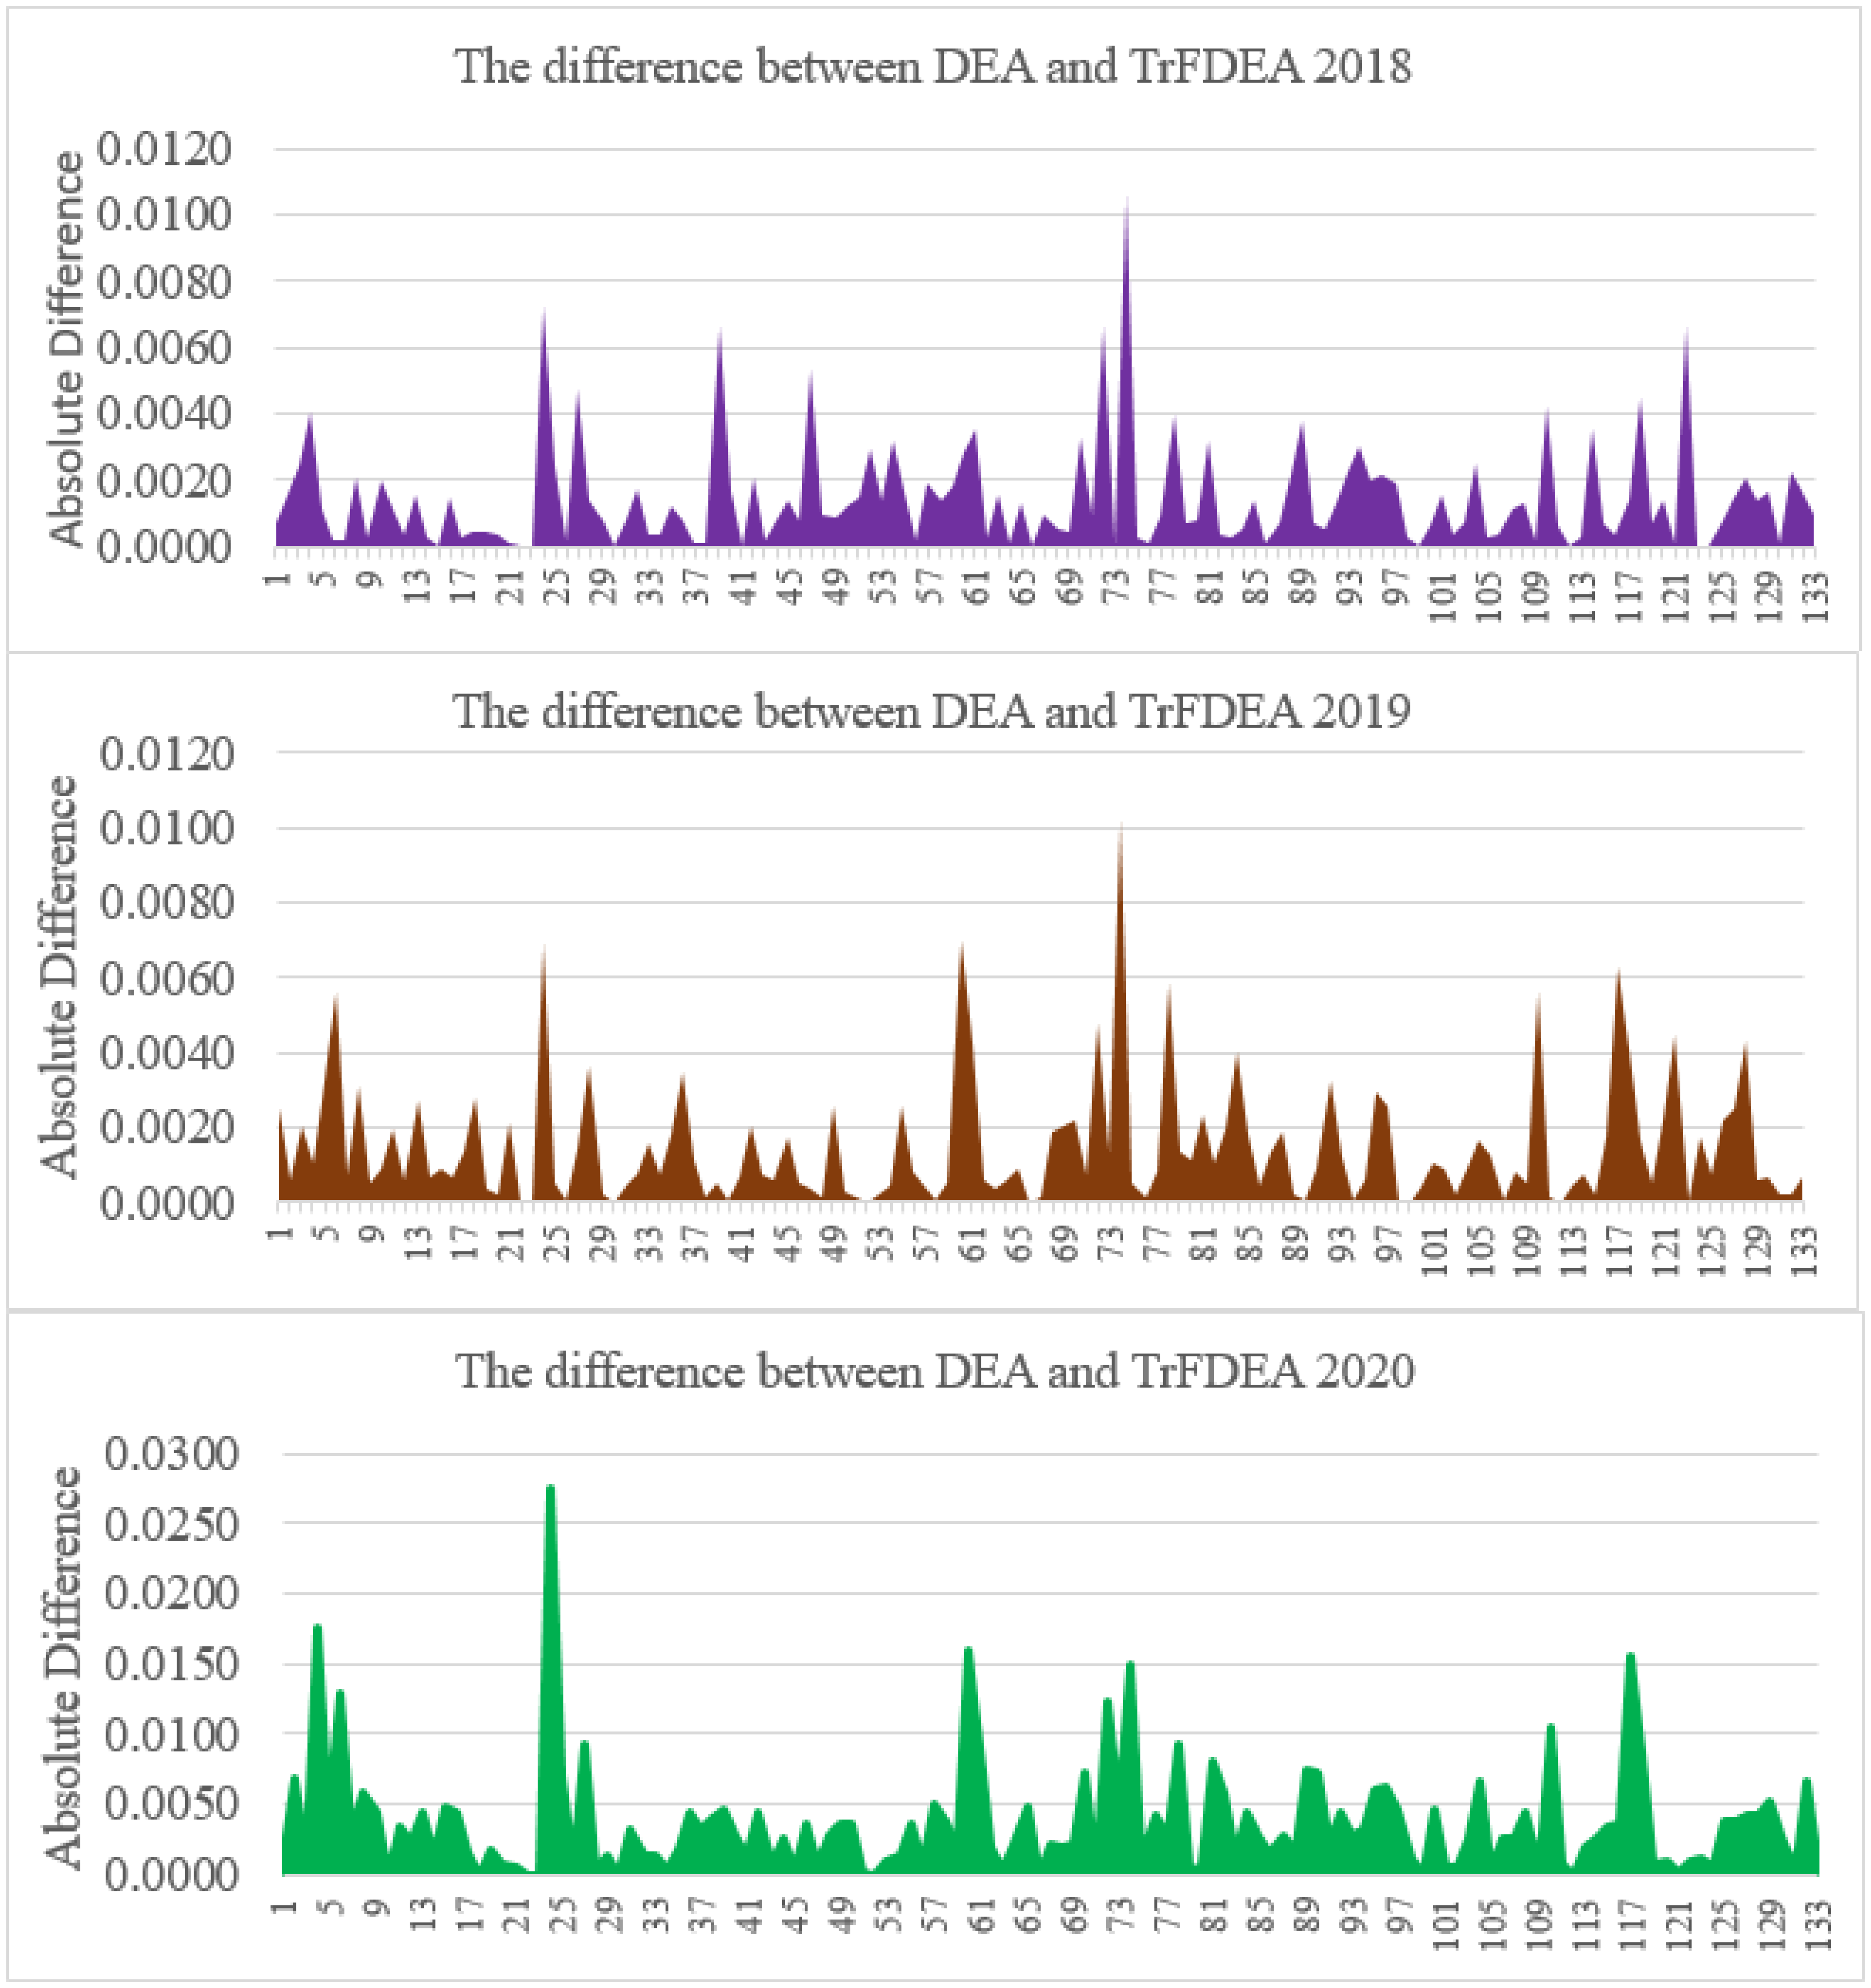
5.2. DEA and TrFDEA Results

Figure 5 shows the minimum, mean and maximum values of TrFN for 3 years. The radar charts depict that the efficiency scores were moving up and down with involvement of the fuzzy numbers in the variables. Some examples (denoted by star and triangle) clearly show the differences in the 3-year radar charts observed from the results of DMU 17, DMU 40 and DMU 41 where their fuzzy efficiency scores were very high in 2018 in comparison to 2019 and 2020. In addition, the fuzzy efficiency scores were very low for DMU 8 and DMU 21 in 2018, in comparison to 2019 and 2020, across the minimum, mean and maximum scores spread. The fuzzy triangular efficiency scores showed the average and standard deviation values for three years. The mean and the standard deviation for 2018 were 0.8808 and 0.057504, for 2019 were 0.8825 and 0.05385995 and for 2020 were 0.8823 and 0.05699, respectively.
Figure 6 shows the difference between DEA and TrFDEA approaches in determining the efficiency scores. The TrFDEA method gives better predictions for the seaport network efficiency as it introduces more measurable and specific terms through the utilization of TrFN. The TrFN theory reflects that efficiency scores in 2020 had the highest impact in comparison to the scores in 2018 and 2019. The TrFDEA and classical DEA give perfect efficiency scores of DMUs 22, 23, 66, 99 and 112 for all 3 years. There were new additions of perfect efficiency scores in 2018 (DMU 15 and DMU 41), 2019 (DMU 52) and 2020 (DMU 52 and DMU 10). The section’s major goal is to discuss the utilization of TrFNs as a substitute tool to improve the seaport network efficiency measurement between DEA and TrFDEA. The procedure used to achieve the aforementioned efficacy was pretty evident. Specifically, the mean value of the seaport network efficiency was equal to the average value of each TrFNs.
Comparison of DEA and triangular fuzzy DEA (TrFDEA) can be performed based on the perfect (100%) efficiency score. Initially, DEA is performed with the input and output variables to measure the seaport network efficiency. Then, the DEA scores are short-listed by taking only perfect efficiencies with a value of 1 where it reflects that the inputs and outputs contribute to 100% efficiency score. From 133 countries considered, only five countries in 2018 and seven countries in 2019 and 2020, respectively, have perfect seaport network efficiency scores. The seaport networks in China, Chile, Japan, Paraguay and Singapore have perfect efficiency throughout the three observed years by using both the DEA and TrFDEA approaches. Estonia, Brazil (2018), Guinea (2019 and 2020) and Bangladesh (2020) also show perfect scores in the individual years by using DEA and TrFDEA in their seaport network efficiency measurements.
The absolute differences in Figure 6 show that there is a huge impact on the efficiency where TrFDEA contributes towards higher efficiency scores in comparison to the standard DEA in the year 2020. Based on the results for 2018 and 2019, the changes are not much (up to ± 1.1%), however there are ± 3% differences in the efficiency scores in 2020. The 3% changes show that TrFDEA has a wider score range (−3% to 3%) than the standard DEA where triangular fuzzy numbers are used to determine the efficiency. Another factor that affects the results in 2020 might be the influence of the COVID-19 pandemic, which make maximum and minimum scores differ a lot in comparison to other years. Since TrFDEA is influenced by triangular fuzzy numbers (maximum, mean and minimum) in this study, the method is suitable to be employed during the economic crisis since it can conduct efficiency estimations based on three different levels with fluctuating characteristics, hence, TrFDEA can give more information on the efficiency results in comparison to DEA. This unique characteristics of TrFDEA obtained by computing the maximum and minimum efficiency values is promising as a credible relative efficiency tool for the D M U j .

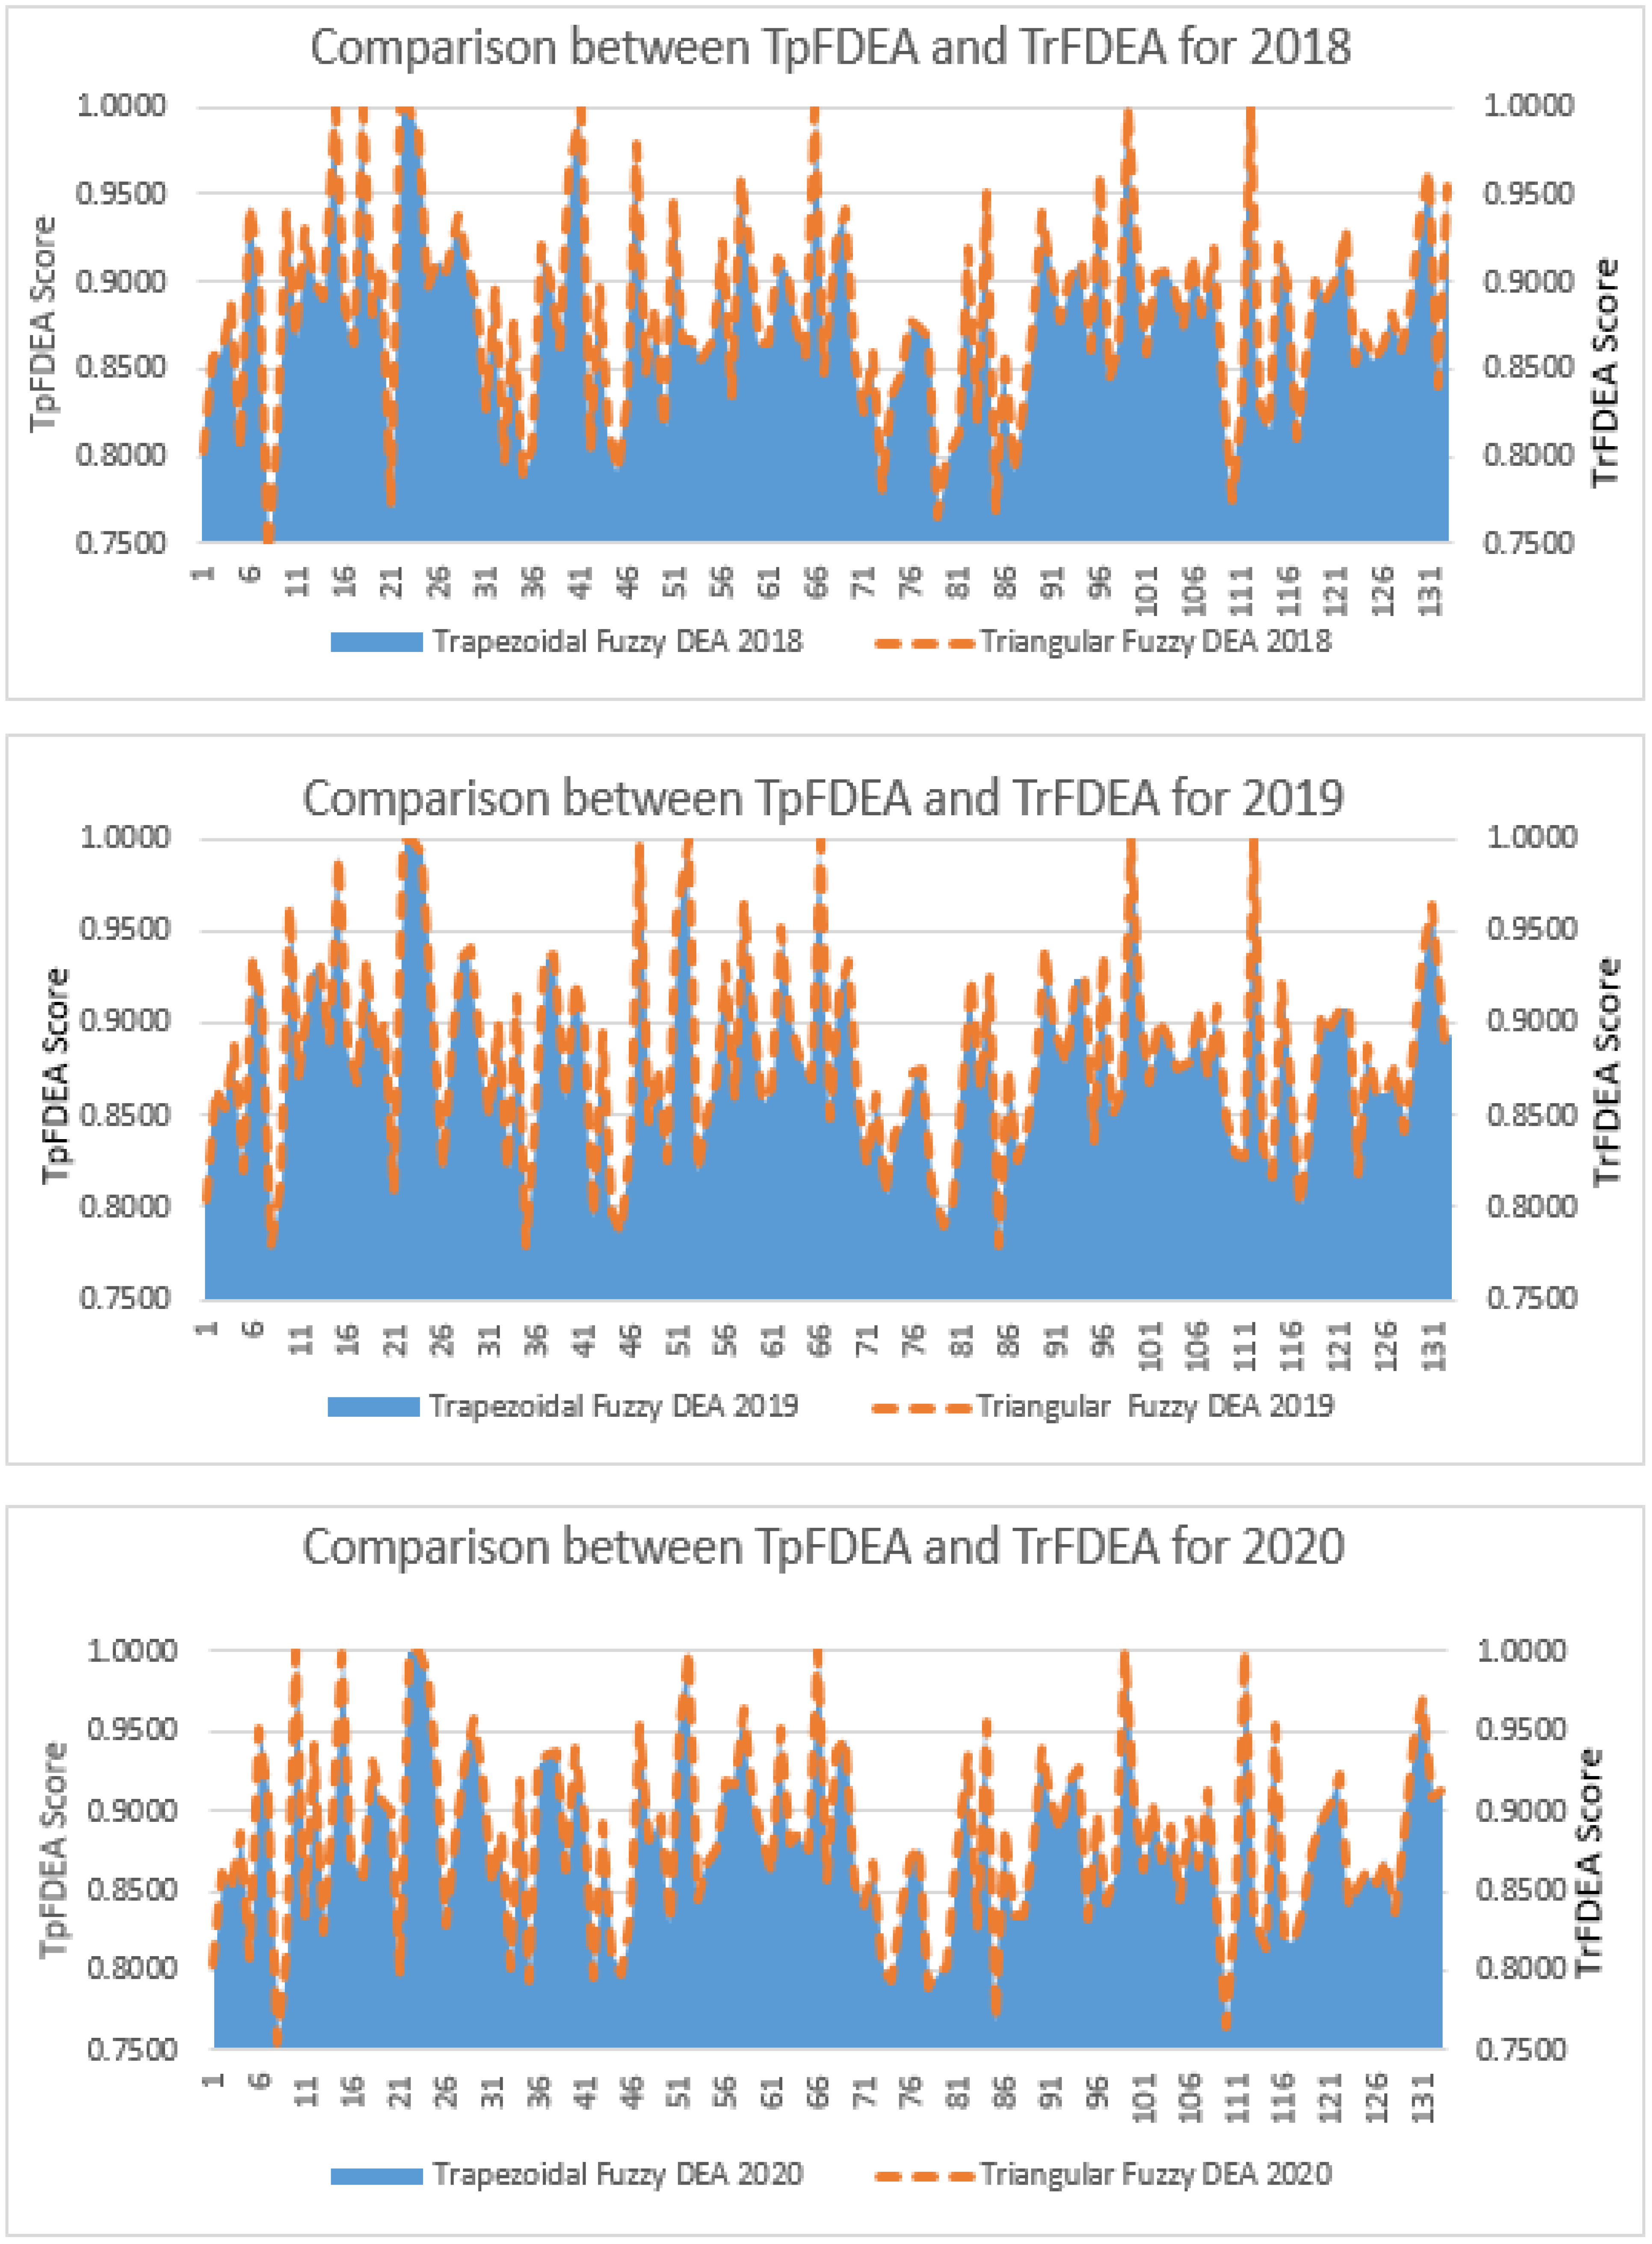
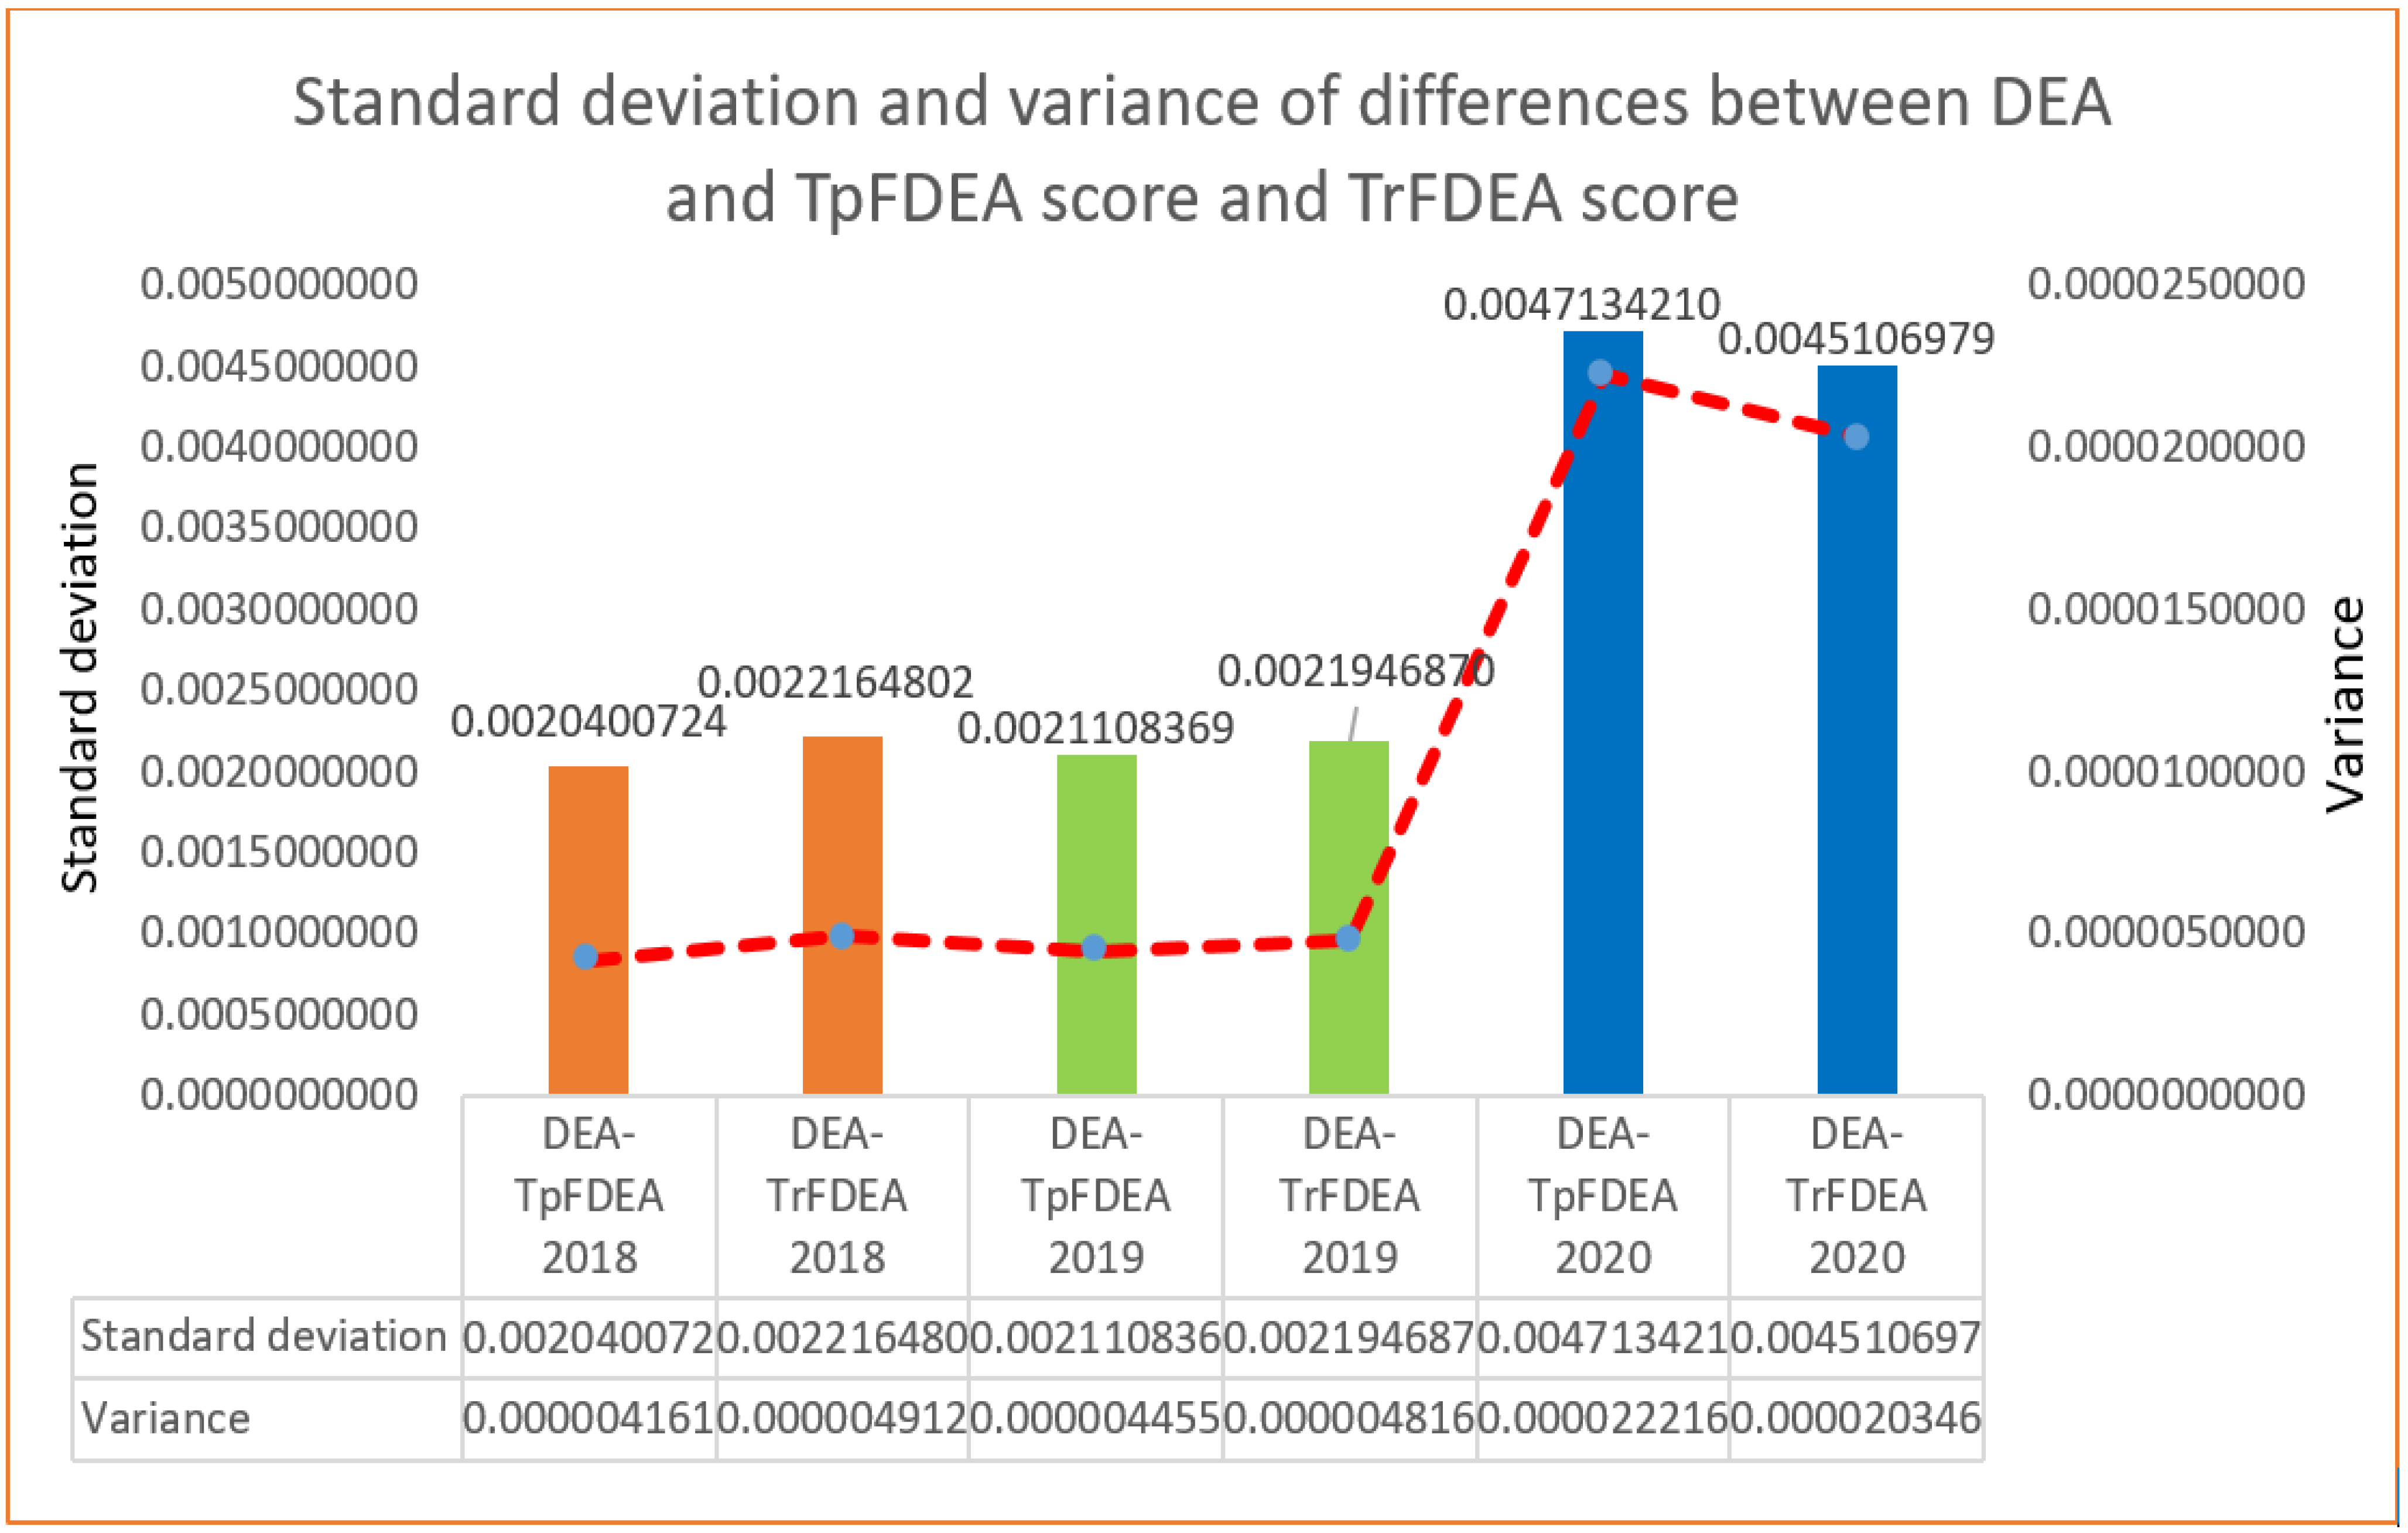
5.3. TrFDEA and TpFDEA Results

Trapezoidal fuzzy fixed points provide precise values, which may be utilized to determine how much each attribute is worth. The average weight of the stable vector acquired from the inference process is used to evaluate and rank the ideas depending on their degree of effect. The TrFN and TpFN are used in this study to investigate the effect of seaport network efficiency scores in the maritime transportation industry. The DEA results have been improved in both efficiency and sensitivity with the introduction of the TrFN and TpFN to express the uncertainty dataset. Fuzzy numbers have evolved through time to support increasingly complicated fuzzy values. Comparison between the TrFDEA and TpFDEA scores in Figure 7 shows that there is a small difference among them with   ± 0.0015 units. Only one efficiency score of DMU 24 has the value difference in the range of 0.0035   to   0.002 . The outcomes from the TrFDEA and TpFDEA have shown the efficiency estimations in different ways. Despite both the TrFDEA and TpFDEA seem to produce similar results for the perfect efficiency scores, there is a slight difference between the two methods where the outcomes of TrFDEA range between −0.0274 to 0.0105 while the TpFDEA’s outcomes range between −0.0307 to 0.0106. Figure 7 shows as if the efficiency scores are approximately the same. The differences between TrFDEA and TpFDEA could not be captured clearly from the graph. As the values are quite near, standard deviation and variance are calculated and presented in Figure 8 to clarify the definite differences between the TrFDEA and TpFDEA. These standard deviations and variances serve as statistical validation tools to conclude which approach is more superior than the other by using DEA results as the relative reference.
Based on Figure 8, the standard deviations of differences between the DEA and TrFDEA are approximately 0.002216 (2018), 0.002195 (2019) and 0.004511 (2020), respectively, while the standard deviations between the DEA and TpFDEA are 0.002040 (2018), 0.002111 (2019) and 0.004713 (2020), respectively. These findings demonstrate that the utilization of the TpFDEA results in reduced inaccuracy in the data since the standard deviation values for the TpFDEA are smaller than the TrFDEA in 2018 and 2019. However, during the pandemic year of 2020, Figure 8 shows the highest standard deviation and variance values between the differences of the DEA–TpFDEA and DEA–TrFDEA. From the smaller standard deviation and variance values, it can be concluded that the TpFDEA is a better fuzzy approach than the TrFDEA in the first two years, while the TrFDEA is a better fuzzy approach than the TpFDEA during the COVID-19 pandemic year of 2020.

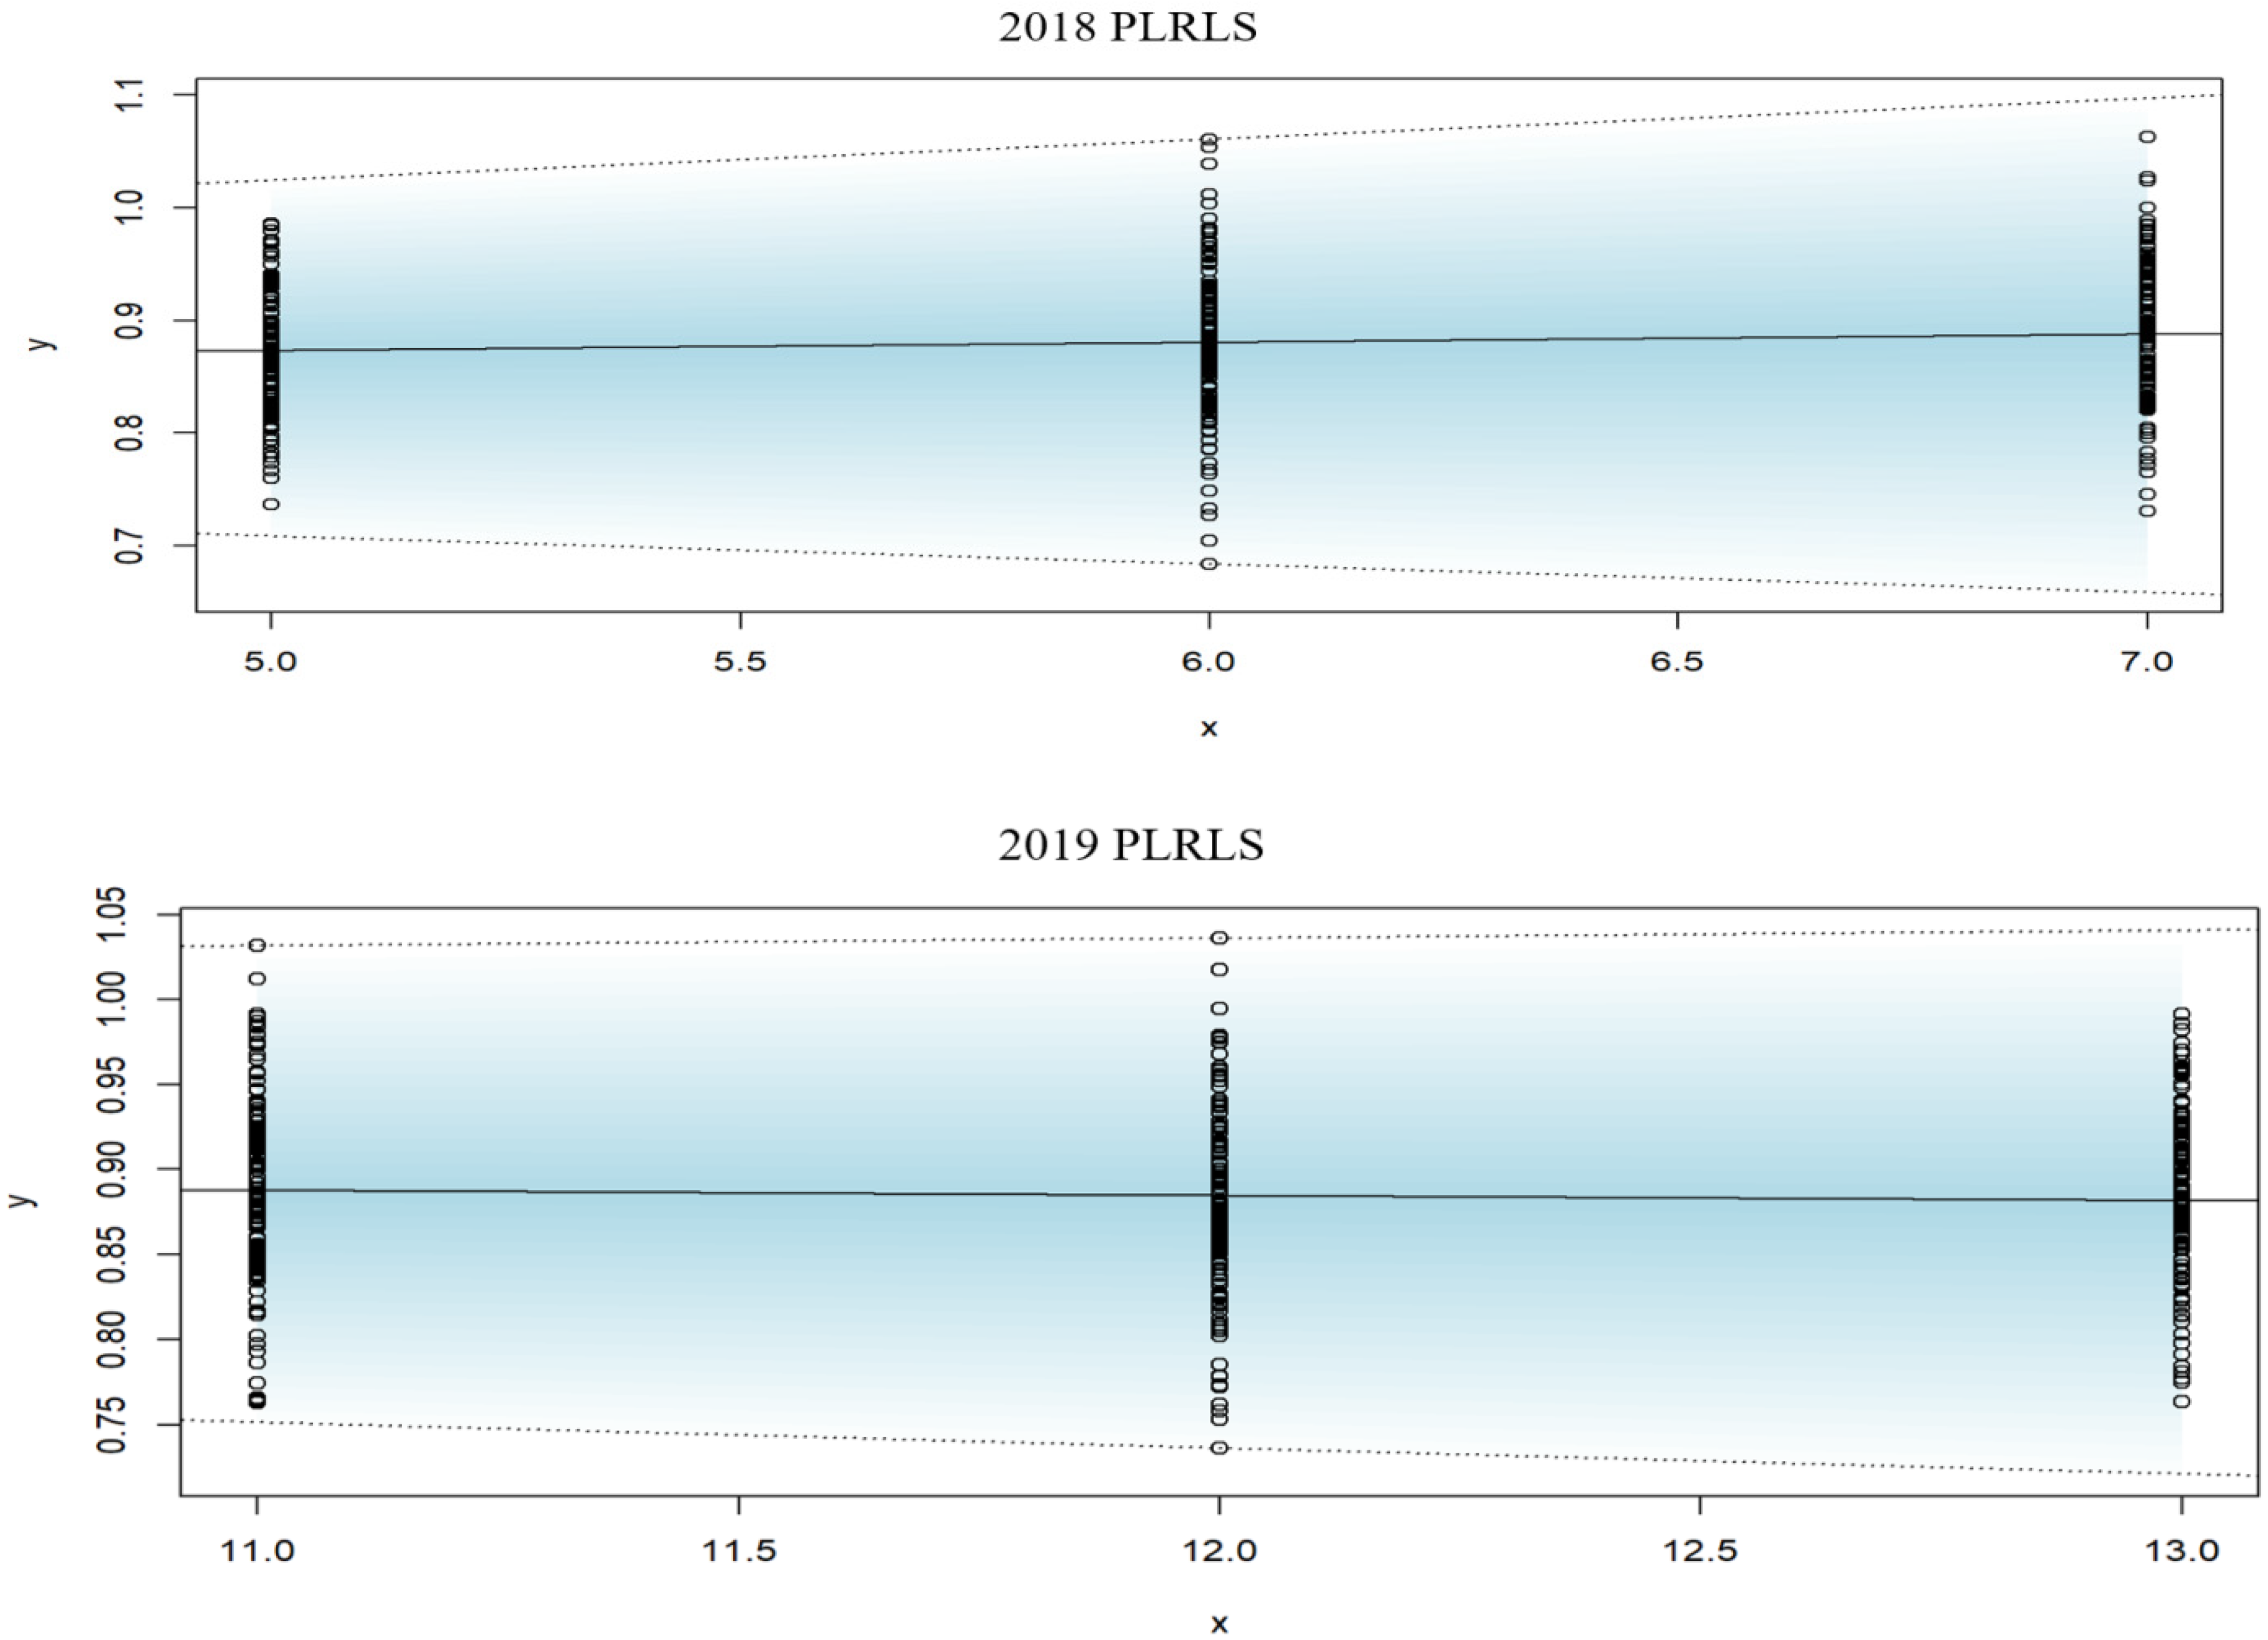
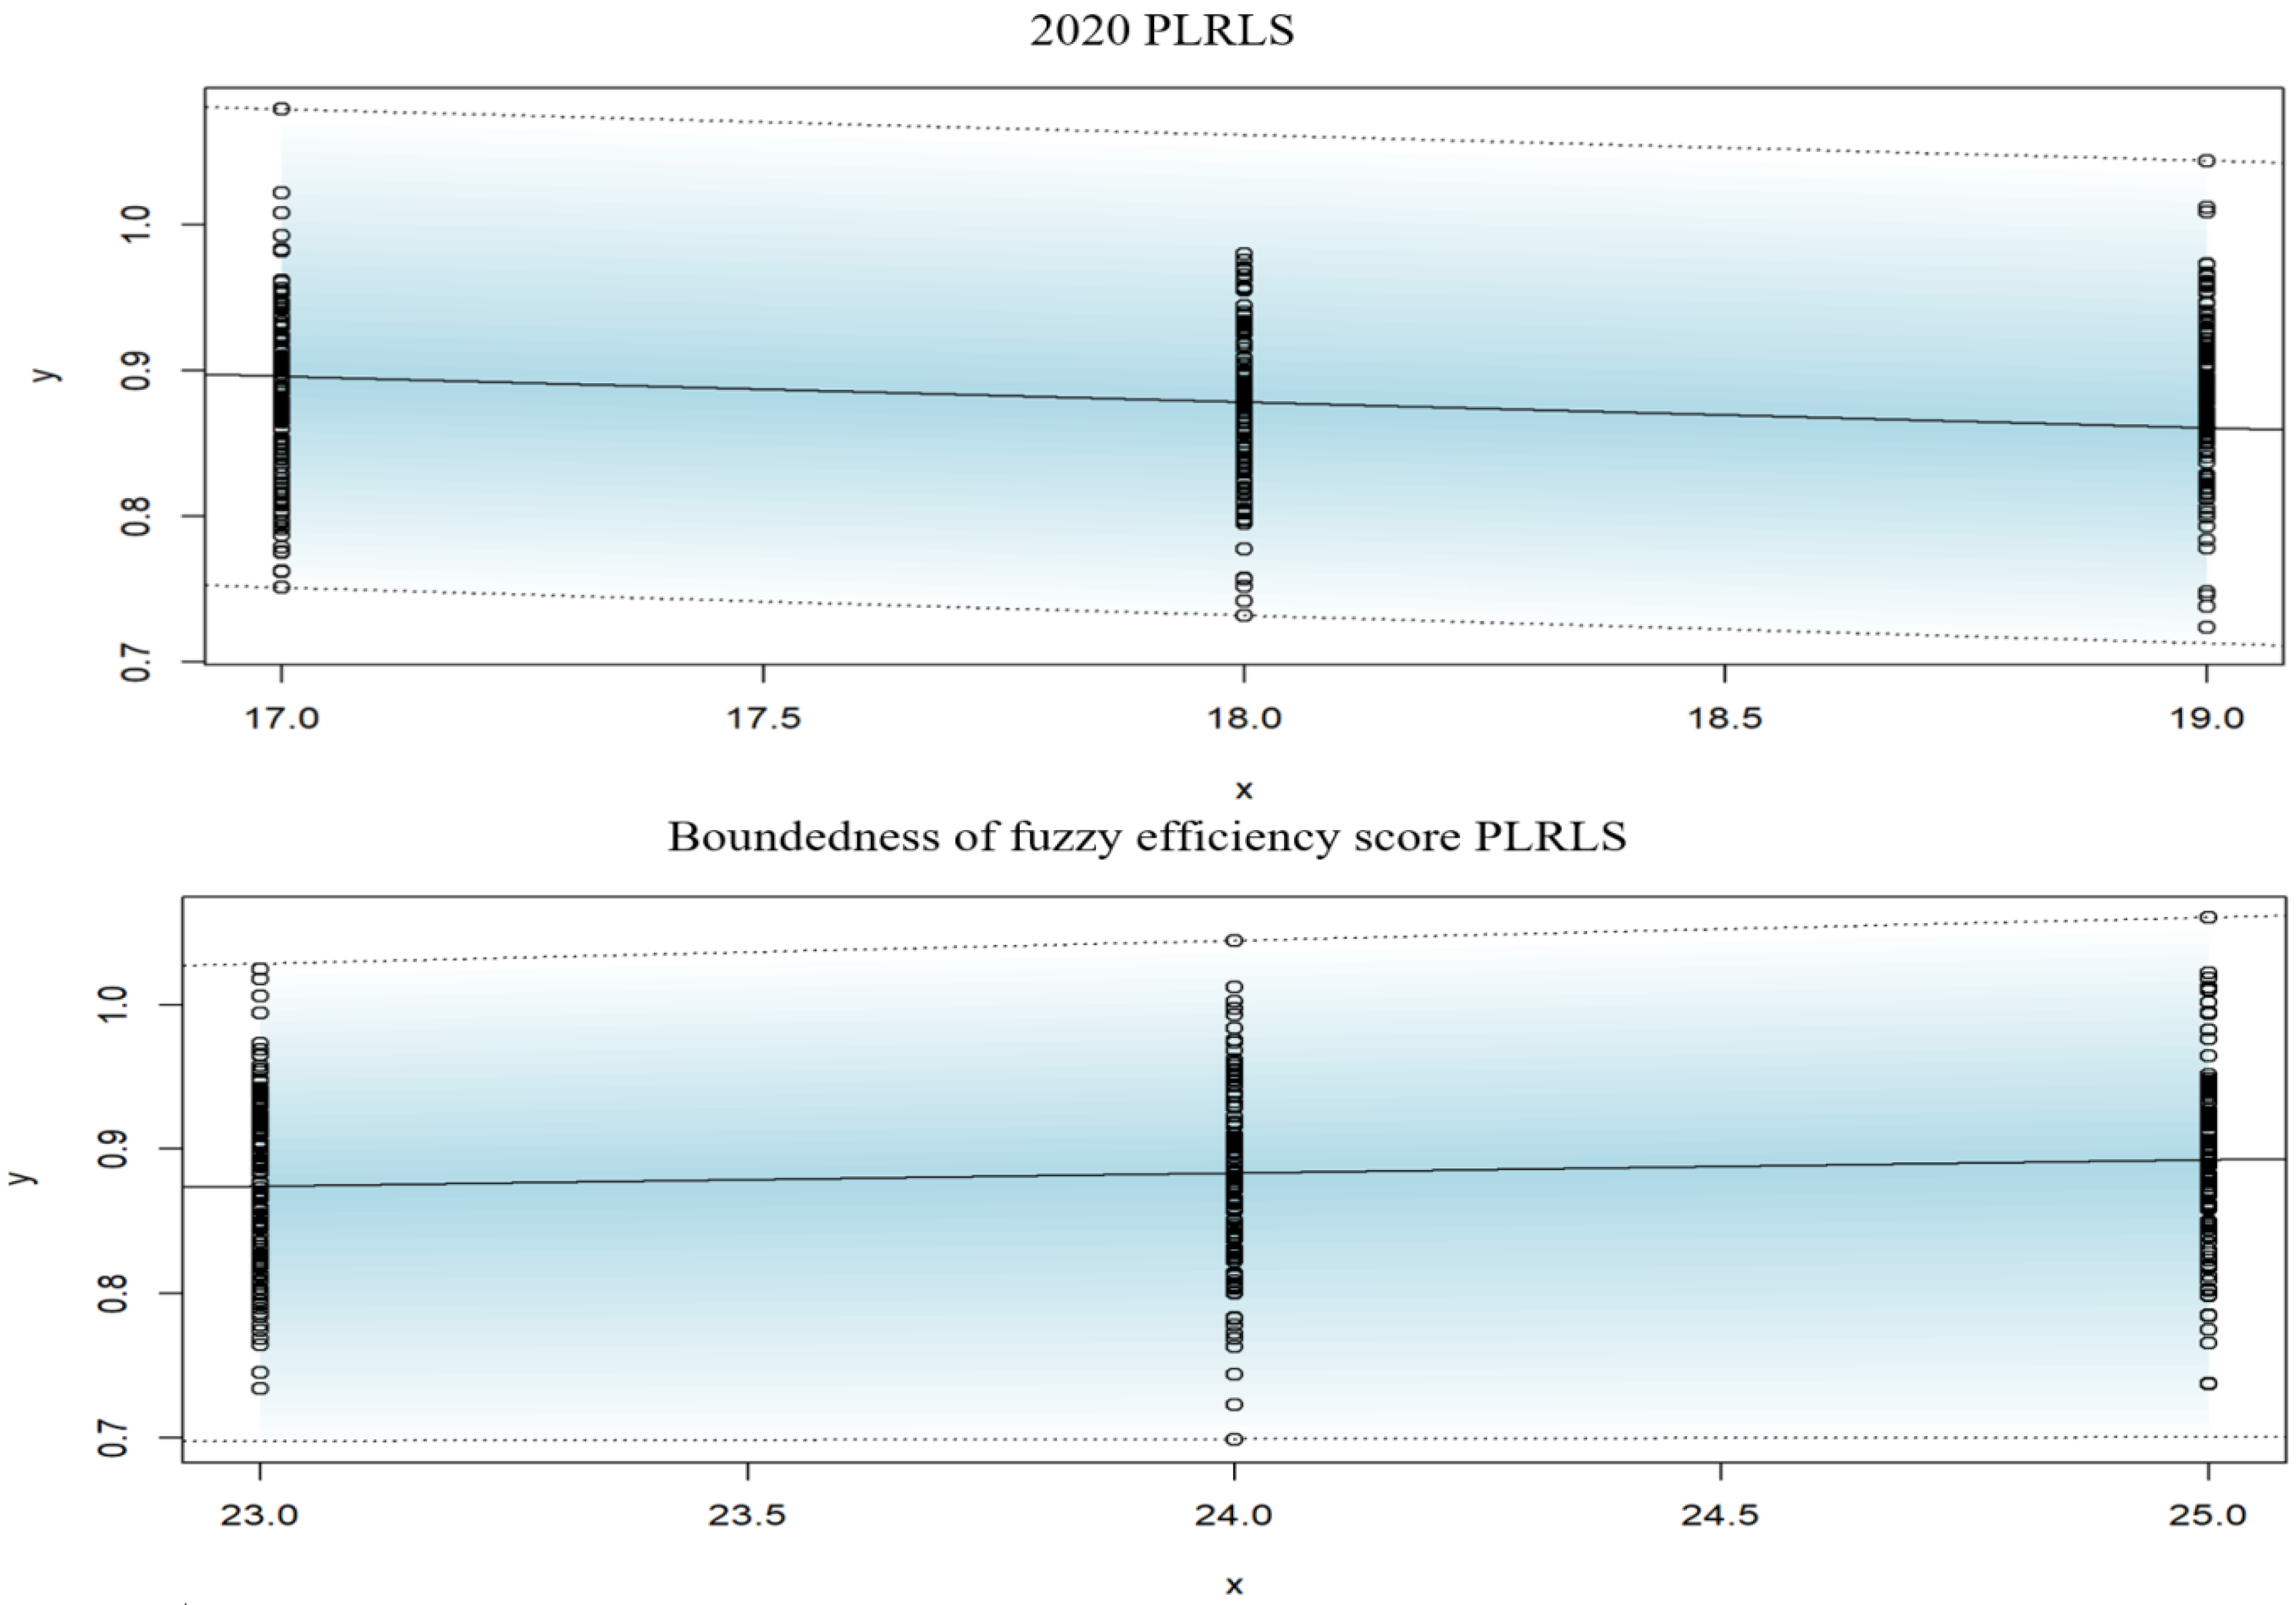
5.4. Fuzzy Linear Regression

Fuzzy linear models manage dubious and loose peculiarities to address better models in comparison to linear regression models. These sorts of models are particularly appropriate for modelling and measuring the seaport network efficiency. The purpose of this method is to explain the dependent variable u as an interval output y in terms of the variant of independent variables. Table 4 shows the approximated linear regression equations combined with the boundedness property of the PLRLS function with minimal MSE for all the years considered. The boundedness is shown in the fuzzy linear regression model since there are lower and upper boundaries of the model that support the interval and the central tendency of the fuzzy regression model. Based on the equations, they showed that the model boundary had an increasing trend in 2018 and 2019, but in 2020 the trend decreases because of the COVID-19 pandemic. Based on the function produced in Table 4, it shows that the central tendency is decreased by 0.0026 (2018), 0.003 (2019) and 0.0177 (2020), respectively. The lower boundary also shows the negative relationship for all three years as they decrease by 0.0304 (2018), 0.0153 (2019) and 0.0191 (2020). In addition, the upper boundary is quite special since, in 2018 and 2019, the function is increased by 0.00221 and 0.0046, respectively. Yet in 2020, the function is decreased by 0.0177 because of the pandemic. The mean squared error (MSE) shows that 2019’s efficiency score has the lowest error of 0.05 in comparison to 2018 (0.06) and 2020 (0.07). This describes that the function is fit to be used for further analysis.
A combination is made by taking the minimum of the minimum, the average of the medium and the maximum of the maximum efficiencies of all the 3-year fuzzy values to make the perfect boundedness model for future predictions. The model shows that the boundaries are increased by 0.0159 unit (upper boundary) and decreased by about 0.0015 unit in the lower boundary where the boundaries are in a concave pattern. The equations displayed in Table 4 illustrate that the central tendency and the lower limit are declining since the slope is negative for all the three years, while the upper bound increases in 2018 and 2019 but drops in 2020. The interval-based PLRLS fuzzy prediction method generates boundedness range by taking the minimum of the minimum values, the maximum of the maximum values, and the average of the mean values. The central tendency is increased by 0.0092 unit throughout the analysis with an MSE of 0.07. The results have proven that the seaport network efficiency scores have a wider range where the values are between 0.7435 to 1, and that the boundedness model seems to have a concave relationship. All the functions, including the boundedness function, are graphed in Figure 9.
The x-coordinates in Figure 9 show the lower boundary (left), the central tendency (mid) and the upper boundary whereas the y-coordinates represent the range of seaport network efficiency scores of 133 countries (denoted by circle markers) used to form the fuzzy linear regression functions listed in Table 4. This figure displays the negative prediction when the dotted line is going down, whereas the boundedness aspect gives the minimum range of the minimum value (lower boundary), the average range of the average value (central limit) and the maximum range of the maximum value (upper boundary).

6. Conclusions

The Liner Shipping Connectivity Index (LSCI) is one of the basic maritime indicators that explains how well the seaport network of a country is connected to other seaports on the globe. Unfortunately, similar to any other research involving real data, the present maritime study is limited and dependent on the availability of additional real data provided by UNCTADstat. The majority of countries’ LSCI and GDP statistics were not given before 2018 and after 2020. Moreover, it is worth mentioning that none of the existing studies have ever investigated LSCI as an output variable in maritime transportation research. The present work started with real public maritime data collection and data screening based on the principles of normality, zero multicollinearity and unwanted outliers. Initially, data envelopment analysis (DEA) was applied to measure seaport network efficiency throughout the three-year considered period (2018–2020). Next, the triangular and trapezoidal fuzzy numbers in the DEA approach (TrFDEA and TpFDEA) have been proposed as better alternative tools to improve perfect efficiency scores and to investigate uncertainty levels in the seaport network efficiency measurement, in comparison to the standard DEA. It was observed that the TrFDEA approach produced differences in the range between −0.0274 and 0.0105, whereas the TpFDEA approach yielded −0.0307 to 0.0046 differences in the efficiency score, in comparison to the DEA approach. Here, the smaller bounds of differences by the TrFDEA in comparison to the TpFDEA suggested that the TrFDEA offered the best outcome in the seaport network efficiency measurement. Moreover, the two fuzzy approaches are discussed and compared using their computed standard deviations and variances where the DEA results were fixed as their relative or control reference. It was found that the TpFDEA approach produced smaller standard deviations and variances of differences than the TrFDEA approach in the early two years before the COVID-19 pandemic. Despite the standard deviations and variances for both methods being the highest during the pandemic year of 2020, the TrFDEA approach produced smaller standard deviation and variance than the TpFDEA approach in that year alone.
As part of the present work’s other original contribution, Possibilistic Linear Regression Least Squares (PLRLS) has been proposed in the fuzzy regression modelling of the seaport network efficiency scores that gives more perspectives regarding the minimum and maximum efficiency bounds than the regular linear regression method. With the new fuzzy numbers utilization of TrFDEA, TpFDEA and fuzzy regression through this research, it provides new tools for researchers, practitioners and policy makers in the maritime industry to investigate and predict further uncertainties in the seaport network efficiency measurement, especially with the fuzzy value boundedness concept firstly introduced in this work and was never proposed before by other researchers worldwide. The findings from this work show that these fuzzy approaches are suitable for real world data, even for those with fluctuation surprises. This work fills the gaps in the studies of seaport network efficiency measurements as well as it motivates further efficiency improvements in port administration and handling, warehouse logistics and inventory planning, vessel cargo loading/unloading scheduling and better decision/policy making by maritime practitioners, navigators and managers.
Some future studies that can be undertaken from this present study include the implementation of machine learning algorithms for the seaport network efficiency classification and clustering. The adaptability of various fuzzy number schemes can also be explored to see how this can improve the performance metrics of the seaport network. With collaboration between the seaport administrators and government agencies, private data can also be exploited to be analysed so that more studies on maritime transportation can be extended. With respect to the local case of Malaysia, the Ministry of Higher Education, the Ministry of Transport and the Ministry of Foreign Affairs can team up for better governance, policy and economic strategies to upgrade the operations, facilities and services of Westport so that the biggest seaport in Malaysia can become more efficient and improve the country’s maritime economy and technology leading to enhancement of wealth and prosperity for the nation.

Author Contributions

Conceptualization, N.F.M.N.; Methodology, D.N.; Investigation, D.N. and N.F.M.N.; Data Collection, D.N.; Writing—Original Draft Preparation, D.N.; Writing—Review and Editing, N.F.M.N.; Visualization, D.N.; Supervision, N.F.M.N.; Project Administration, N.F.M.N.; Funding Acquisition, D.N.; Non-financial Resources, S.A.M.A. All authors have read and agreed to the published version of the manuscript.

Funding

This research was conducted under the project FRGS/1/2022/SS02/SEGI/03/1, funded by the Ministry of Higher Education, Malaysia, headed by D. Nadarajan, who works in SEGi University, and supervised by N.F.M. Noor from Universiti Malaya as one of the project members.

Data Availability Statement

Publicly available datasets were analysed in this study. These data can be found here: https://unctad.org/system/files/official-document/rmt2019_en.pdf (accessed on 23 March 2022), https://unctad.org/en/pages/newsdetails.aspx?OriginalVersionID=2392 (accessed on 19 April 2022), https://databank.worldbank.org/source/world-development-indicators (accessed on 12 November 2021), https://unctadstat.unctad.org/wds/TableViewer/tableView.aspx?ReportId=13321 (accessed on 26 November 2021).

Acknowledgments

We thank the respected anonymous reviewers who contributed towards the improvement of this paper.

Conflicts of Interest

The authors declare no conflict of interest.

Abbreviations

The following abbreviations are used in this manuscript:
AVAge of vessels
CCCCargo carrying capacity
DEAData Envelopment Analysis
DMUsDecision Making Units
DWTDeadweight tonnage
GDPGross Domestic Product
GTGross Tonnage
LSCILiner Shipping Connectivity Index
PLRLSPossibilistic Linear Regression Least Squares
SVSize (GT) of vessels
TEUTwenty-Foot Equivalent Unit
TrFNTriangular fuzzy number
TrFDEATriangular fuzzy Data Envelopment Analysis
TpFNTrapezoidal fuzzy number
TpFDEATrapezoidal fuzzy Data Envelopment Analysis
TPTime in port
UNCTADUnited Nations Conference on Trade and Development
UNCTADstatUnited Nations Conference on Trade and Development Statistics
VIFVariance inflation factor
WDIWorld Development Indicators

Nomenclature

F α α -cut of point for triangular fuzzy number
H Maximum
j Number of container ports in the system
LMinimum
MMean
p 1 The minimum value for GDP
p 2 The minimum value for LSCI
q 1 The maximum value of GDP
q 2 The maximum value of LSCI
u No. of output
u b The weight given to the   b t h   output
u b H The weight given to the   b t h   output for maximum value
u b M The weight given to the   b t h   output for mean value
u b L The weight given to the   b t h   output for minimum value
v No. of input
v d The weight given to the   d t h   input
v d H The weight given to the   d t h   input for maximum value
v d M The weight given to the   d t h   input for mean value
v d L The weight given to the   d t h   input for minimum value
x d j The amount of the d t h input used by the j t h port
y b j The amount of the b t h output used by the j t h port
μ 1 The mean value of GDP
μ 2 The mean value of LSCI

References

  1. Van Dijk, T.; Moonen, H.; van Doorser, H.; Negenborn, R.; van den Berg, R. Smart Ships and the Changing Maritime Ecosystem: Smart Port. 2018. Available online: https://smartport.nl/wp-content/uploads/2019/04/SmartPort-whitepaper-SmartShipping.pdf (accessed on 24 December 2022).
  2. UNCTAD. Review of Maritime Transportation 2018. Available online: https://unctad.org/system/files/official-document/rmt2018_en.pdf (accessed on 4 June 2022).
  3. Raji, B.A.; Solanke, M.O.; Saheed, L.F. Maritime Logistics and Gross Domestic Product: A Study of Nigeria Seaports. J. Acad. Res. Econ. 2021, 13, 392–408. [Google Scholar]
  4. Fugazza, M.; Hoffmann, J. Liner shipping connectivity as determinant of trade. J. Shipp. Trd. 2017, 2, 1–18. [Google Scholar] [CrossRef] [Green Version]
  5. Jouili, T.A. Determinants of liner shipping connectivity. Int. J. Adv. Appl. Sci. 2019, 6, 5–10. [Google Scholar] [CrossRef]
  6. Tovar, B.; Wall, A. The relationship between port-level maritime connectivity and efficiency. J. Transp. Geogr. 2022, 98, 103213. [Google Scholar] [CrossRef]
  7. Sleeper, D.M. Port significance: Contributions to competitiveness in Latin America and Asia. J. Glob. Bus. Community 2012, 3, 22–28. [Google Scholar]
  8. Tongzon, J. The impact of wharfage costs on Victoria’s export-oriented industries. Econ. Pap. 1989, 8, 58–64. [Google Scholar] [CrossRef]
  9. Chin, A.; Tongzon, J. Maintaining Singapore as a major shipping and air transport hub. In Competitiveness of the Singapore Economy; Singapore University Press: Singapore, 1998. [Google Scholar]
  10. Bray, S.; Caggiani, L.; Ottomanelli, M. Measuring transport systems efficiency under uncertainty by fuzzy sets theory based Data Envelopment Analysis: Theoretical and practical comparison with traditional DEA model. Transp. Res. Procedia 2015, 5, 186–200. [Google Scholar] [CrossRef] [Green Version]
  11. Charnes, A.; Cooper, W.W.; Rhodes, E. Measuring the efficiency of decision making units. Eur. J. Oper. Res. 1978, 2, 429–444. [Google Scholar] [CrossRef]
  12. Tsai, C.M.; Lee, H.S.; Gan, G.Y. A new fuzzy DEA model for solving the MCDM problems in supplier selection. J. Mar. Sci. Technol. 2021, 29, 89–95. [Google Scholar] [CrossRef]
  13. Krmac, E.; Mansouri Kaleibar, M. A comprehensive review of data envelopment analysis (DEA) methodology in port efficiency evaluation. Marit. Econ. Logist. 2022, 146, 1–65. [Google Scholar] [CrossRef]
  14. Sun, J.; Yuan, Y.; Yang, R.; Ji, X.; Wu, J. Performance evaluation of Chinese port enterprises under significant environmental concerns: An extended DEA-based analysis. Transp. Policy 2017, 60, 75–86. [Google Scholar] [CrossRef]
  15. Wang, L.; Zhou, Z.; Yang, Y.; Wu, J. Green efficiency evaluation and improvement of Chinese ports: A cross-efficiency model. Transp. Res. D Transp. Environ. 2020, 88, 102590. [Google Scholar] [CrossRef]
  16. De Oliveira, G.F.; Cariou, P. The impact of competition on container port (in) efficiency. Transp. Res. Part A Policy Pract. 2015, 78, 124–133. [Google Scholar] [CrossRef]
  17. Kong, Y.; Liu, J. Sustainable port cities with coupling coordination and environmental efficiency. Ocean Coast. Manag. 2021, 205, 105534. [Google Scholar] [CrossRef]
  18. Feng, Y.; Zhang, Z.; Tian, G.; Fathollahi-Fard, A.M.; Hao, N.; Li, Z.; Wang, W.; Tan, J. A novel hybrid fuzzy grey TOPSIS method: Supplier evaluation of a collaborative manufacturing enterprise. Appl. Sci. 2019, 9, 3770. [Google Scholar] [CrossRef] [Green Version]
  19. Wang, N.; Zhang, W.X.; Mei, C.L. Fuzzy nonparametric regression based on local linear smoothing technique. Inf. Sci. 2007, 177, 3882–3900. [Google Scholar] [CrossRef]
  20. Wanke, P.; Nwaogbe, O.R.; Chen, Z. Efficiency in Nigerian ports: Handling imprecise data with a two-stage fuzzy approach. Marit. Policy Manag. 2018, 45, 699–715. [Google Scholar] [CrossRef]
  21. Wang, Y.J.; Han, T.C. Efficiency measurement for international container ports of Taiwan and surrounding areas by fuzzy data envelopment analysis. J. Mar. Sci. Technol. 2018, 26, 185–193. [Google Scholar]
  22. Skrabanek, P.; Martinkova, N. Algorithm 1017: Fuzzyreg: An R package for fitting fuzzy regression models. ACM Trans. Math. Softw. 2021, 47, 1–18. [Google Scholar] [CrossRef]
  23. Lee, H.; Tanaka, H. Upper and lower approximation models in interval regression using regression quantile techniques. Eur. J. Oper. Res. 1999, 116, 653–666. [Google Scholar] [CrossRef]
  24. Hatami-Marbini, A.; Emrouznejad, A.; Tavana, M. A taxonomy and review of the fuzzy data envelopment analysis literature: Two decades in the making. Eur. J. Oper. Res. 2011, 214, 457–472. [Google Scholar] [CrossRef]
  25. Soleimani-Damaneh, M.; Jahanshahloo, G.R.; Abbasbandy, S. Computational and theoretical pitfalls in some current performance measurement techniques and a new approach. Appl. Math. Comput. 2006, 181, 1199–1207. [Google Scholar] [CrossRef]
  26. Wang, G.; Ahn, S.B. Evaluating the efficiency of Chinese ports from the perspective of Maritime Silk Road. J. Korea Port Econ. Assoc. 2021, 37, 19–30. [Google Scholar] [CrossRef]
  27. Kavirathna, C.A.; Kawasaki, T.; Hanaoka, S. Transshipment hub port competitiveness of the port of colombo against the major Southeast Asian hub ports. Asian J. Shipp. Logist. 2018, 34, 71–82. [Google Scholar] [CrossRef]
  28. Kleywegt, A.; Goh, M.L.; Wu, G.Y.; Zhang, H.W. Competition between the Ports of Singapore and Malaysia; The Logistics Institute–Asia Pacific, National University of Singapore: Singapore, 2002; Available online: https://www.researchgate.net/profile/Guangyan-Wu/publication/265114505_Competition_between_the_Ports_of_Singapore_and_Malaysia/links/547ea4f60cf2c1e3d2dc20f2/Competition-between-the-Ports-of-Singapore-and-Malaysia.pdf (accessed on 3 January 2023).
  29. Pasha, J.; Dulebenets, M.A.; Fathollahi-Fard, A.M.; Tian, G.; Lau, Y.Y.; Singh, P.; Liang, B. An integrated optimization method for tactical-level planning in liner shipping with heterogeneous ship fleet and environmental considerations. Adv. Eng. Inform. 2021, 48, 101299. [Google Scholar] [CrossRef]
  30. van Dyck, G.K.; Ismael, H.M. Multi-criteria evaluation of port competitiveness in West Africa using analytic hierarchy process (AHP). Am. J. Ind. Bus. 2015, 5, 432. [Google Scholar] [CrossRef] [Green Version]
  31. de Oliveira, H.C.; You, J.; Coelho, A.P. Governing coalitions and key performance indicators of port governance. MARTRA 2021, 2, 100023. [Google Scholar] [CrossRef]
  32. Mohamad, R.; Kamonchanok, S.; Pongsa, P. Liner shipping connectivity and international trade in maritime Southeast Asian countries. J. Int. Logist. Trade. 2015, 13, 43–74. [Google Scholar] [CrossRef]
  33. Kang, D.J.; Woo, S.H. Liner shipping networks, port characteristics and the impact on port performance. Marit. Econ. Logist. 2017, 19, 274–295. [Google Scholar] [CrossRef]
  34. Deng, P.; Lu, S.; Xiao, H. Evaluation of the relevance measure between ports and regional economy using structural equation modeling. Transp. Policy 2013, 27, 123–133. [Google Scholar] [CrossRef]
  35. Bottasso, A.; Conti, M.; Ferrari, C.; Merk, O.; Tei, A. The impact of port throughput on local employment: Evidence from a panel of European regions. Transp. Policy 2013, 27, 32–38. [Google Scholar] [CrossRef]
  36. Ayesu, E.K.; Sakyi, D.; Darku, A.B. Seaport efficiency, port throughput, and economic growth in Africa. Marit. Econ. Logist. 2022, 32, 1–20. [Google Scholar] [CrossRef]
  37. The World Bank. World Development Indicators. Available online: https://databank.worldbank.org/reports.aspx?source=world-development-indicators (accessed on 14 April 2022).
  38. Gholizadeh, H.; Fathollahi-Fard, A.M.; Fazlollahtabar, H.; Charles, V. Fuzzy data-driven scenario-based robust data envelopment analysis for prediction and optimisation of an electrical discharge machine’s parameters. Expert Syst. Appl. 2022, 193, 116419. [Google Scholar] [CrossRef]
  39. Khalili-Damghani, K.; Tavana, M. A new fuzzy network data envelopment analysis model for measuring the performance of agility in supply chains. Int. J. Adv. Manuf. Technol. 2013, 69, 291–318. [Google Scholar] [CrossRef]
  40. Yadava, S.N.; Bapatb, M.S. Approximation of multiplication of trapezoidal epsilon-delta fuzzy numbers. Adv. Fuzzy Math. 2017, 12, 715–735. [Google Scholar]
  41. Yang, Z.; Guo, S.; Tang, H.; Tan, T.; Du, B.; Huang, L. The fuzzy DEA-based manufacturing service efficiency evaluation and ranking approach for a parallel two-stage structure of a complex product system on the example of solid waste recycling. Process 2022, 10, 2322. [Google Scholar] [CrossRef]
  42. Ahmad, M.; Cheng, W. A novel approach of fuzzy control chart with fuzzy process capability indices using alpha cut triangular fuzzy number. Mathematics 2022, 10, 3572. [Google Scholar] [CrossRef]
  43. Faizi, S.; Sałabun, W.; Ullah, S.; Rashid, T.; Więckowski, J. A new method to support decision-making in an uncertain environment based on normalized interval-valued triangular fuzzy numbers and comet technique. Symmetry 2020, 12, 516. [Google Scholar] [CrossRef] [Green Version]
  44. Ghoushchi, S.J.; Osgooei, E.; Haseli, G.; Tomaskova, H. A novel approach to solve fully fuzzy linear programming problems with modified triangular fuzzy numbers. Mathematics 2021, 9, 2937. [Google Scholar] [CrossRef]
  45. Voskoglou, M.G. An application of triangular fuzzy numbers to learning assessment. J. Phys. Sci. 2015, 20, 63–79. [Google Scholar]
  46. Pribićević, I.; Doljanica, S.; Momčilović, O.; Das, D.K.; Pamučar, D.; Stević, Ž. Novel extension of DEMATEL method by trapezoidal fuzzy numbers and D numbers for management of decision-making processes. Mathematics 2020, 8, 812. [Google Scholar] [CrossRef]
  47. Newhart, K.B.; Holloway, R.W.; Hering, A.S.; Cath, T.Y. Data-driven performance analyses of wastewater treatment plants: A review. Water Res. 2019, 157, 498–513. [Google Scholar] [CrossRef] [PubMed]
  48. Djenouri, Y.; Belhadi, A.; Djenouri, D.; Srivastava, G.; Lin, J.C.W. Intelligent deep fusion network for anomaly identification in maritime transportation systems. IEEE Trans. Intell. Transp. Syst. 2022, 1, 1–8. [Google Scholar] [CrossRef]
  49. Wilmsmeier, G.; Hoffmann, J. Liner shipping connectivity and port infrastructure as determinants of freight rates in the Caribbean. Int. J. Marit. Econ. 2008, 10, 130–151. [Google Scholar]
  50. Hair, J.J.F.; Hult, G.T.M.; Ringle, C.; Sarstedt, M. A Primer on Partial Least Squares Structural Equation Modeling (PLS-SEM); Sage Publications: Schauzendeaux, CA, USA, 2017. [Google Scholar]
  51. Garson, G.D. Testing Statistical Assumptions; Statistical Associates Publishing: Asheboro, NC, USA, 2012. [Google Scholar]
Figure 1. A triangle with a centroid to represent TrFN.
Mathematics 11 01454 g001
Figure 2. A trapezium to represent TpFN [46].
Mathematics 11 01454 g002
Figure 3. Flow chart of the methodology.
Mathematics 11 01454 g003
Figure 4. Boxplot for outlier identification and normality for the output of raw data.
Mathematics 11 01454 g004
Figure 5. Radar charts of efficiency scores based on Triangular Fuzzy Numbers (TrFNs).
Mathematics 11 01454 g005aMathematics 11 01454 g005b
Figure 6. The absolute differences between DEA and triangular fuzzy DEA scores.
Mathematics 11 01454 g006
Figure 7. The differences between triangular fuzzy DEA and trapezoidal fuzzy DEA outcomes.
Mathematics 11 01454 g007
Figure 8. Comparison of standard deviations and variances between the TrFDEA and TpFDEA using the DEA as the relative reference.
Mathematics 11 01454 g008
Figure 9. Fuzzy Linear Regression Model.
Mathematics 11 01454 g009aMathematics 11 01454 g009b
Table 1. List of DMUs applied in DEA and fuzzy DEA (TrFDEA and TpFDEA).
DMUCountryDMUCountryDMUCountryDMUCountry
DMU 1AlbaniaDMU 37Dominican
Republic
DMU 73LiberiaDMU 109Senegal
DMU 2AlgeriaDMU 38EcuadorDMU 74LibyaDMU 110Seychelles
DMU 3American SamoaDMU 39EgyptDMU 75LithuaniaDMU 111Sierra Leone
DMU 4AngolaDMU 40El SalvadorDMU 76MadagascarDMU 112Singapore
DMU 5Antigua and BarbudaDMU 41EstoniaDMU 77MalaysiaDMU 113Solomon
Islands
DMU 6ArgentinaDMU 42FijiDMU 78MaldivesDMU 114Somalia
DMU 7AustraliaDMU 43FinlandDMU 79MaltaDMU 115Spain
DMU 8BahamasDMU 44GabonDMU 80MauritaniaDMU 116Sri Lanka
DMU 9BahrainDMU 45GambiaDMU 81MauritiusDMU 117Sudan
DMU 10BangladeshDMU 46GeorgiaDMU 82MexicoDMU 118Suriname
DMU 11BarbadosDMU 47GermanyDMU 83Micronesia (Federated States of)DMU 119Sweden
DMU 12BelgiumDMU 48GreeceDMU 84Moldova,
Republic of
DMU 120Tanzania
DMU 13BelizeDMU 49GrenadaDMU 85MontenegroDMU 121Thailand
DMU 14BeninDMU 50GuamDMU 86MoroccoDMU 122Timor-Leste
DMU 15BrazilDMU 51GuatemalaDMU 87MozambiqueDMU 123Togo
DMU 16Brunei DarussalamDMU 52GuineaDMU 88MyanmarDMU 124Tonga
DMU 17BulgariaDMU 53Guinea-BissauDMU 89NamibiaDMU 125Trinidad and Tobago
DMU 18CambodiaDMU 54GuyanaDMU 90NetherlandsDMU 126Tunisia
DMU 19CameroonDMU 55HaitiDMU 91New ZealandDMU 127Turkey
DMU 20CanadaDMU 56HondurasDMU 92NicaraguaDMU 128Ukraine
DMU 21Cayman IslandsDMU 57IcelandDMU 93NigeriaDMU 129United Arab Emirates
DMU 22ChileDMU 58IndiaDMU 94NorwayDMU 130United
Kingdom
DMU 23ChinaDMU 59IndonesiaDMU 95OmanDMU 131United States of America
DMU 24China,
Hong Kong SAR
DMU 60IranDMU 96PakistanDMU 132Uruguay
DMU 25ColombiaDMU 61IraqDMU 97PanamaDMU 133Viet Nam
DMU 26ComorosDMU 62IrelandDMU 98Papua New Guinea  
DMU 27CongoDMU 63IsraelDMU 99Paraguay  
DMU 28Congo, Dem. Rep. of theDMU 64ItalyDMU 100Peru  
DMU 29Costa RicaDMU 65JamaicaDMU 101Philippines  
DMU 30Côte d’IvoireDMU 66JapanDMU 102Poland  
DMU 31CroatiaDMU 67JordanDMU 103Portugal  
DMU 32CubaDMU 68KenyaDMU 104Qatar  
DMU 33CyprusDMU 69Republic of KoreaDMU 105Romania  
DMU 34DenmarkDMU 70KuwaitDMU 106Russian
Federation
  
DMU 35DjiboutiDMU 71LatviaDMU 107Samoa  
DMU 36DominicaDMU 72LebanonDMU 108Saudi Arabia  
Table 2. Input and output variables of the study.
Input VariablesOutput Variables
Median time in port (days), (TP)Growth Domestic Product (GDP in USD)
Average age of vessels, (AV)Liner Shipping Connectivity Index (LSCI)
Maximum size (GT) of vessels, (SV) 
Average cargo carrying capacity (dwt) per vessel, (CCC) 
Table 3. Multicollinearity.
VariableVIF1/VIF
SV2.810.356304
CCC2.570.388585
TP1.230.815793
AV1.030.969714
Mean VIF1.91 
Table 4. Fuzzy linear regression functions with boundedness.
 Central TendencyLower BoundaryUpper BoundaryMSE
2018 y = 0.8956 0.0026 x y = 0.8956 0.0304 x y = 0.8997 + 0.0221 x 0.06
2019 y = 0.9202 0.003 x y = 0.9192 0.0153 x y = 0.9809 + 0.0046 x 0.05
2020 y = 1.1968 0.0177 x y = 1.0751 0.0191 x y = 1.38 0.0177 x 0.07
Combination Boundedness y = 0.6633 + 0.0092 x y = 0.663 + 0.0015 x y = 0.6633 + 0.0159 x 0.07
Disclaimer/Publisher’s Note: The statements, opinions and data contained in all publications are solely those of the individual author(s) and contributor(s) and not of MDPI and/or the editor(s). MDPI and/or the editor(s) disclaim responsibility for any injury to people or property resulting from any ideas, methods, instructions or products referred to in the content.

