Abstract
Over the past century, there has been a dramatic increasing interest in the multi-criteria group decision-making (MCGDM) technique, with a considerable amount of studies published regarding it. One of the well-known approaches in the MCGDM paradigm is Technique for Order Preference by Similarity to Ideal Solution (TOPSIS). The integration of the TOPSIS method with fuzzy set theory has proven to be successful in various applications. Recently, a wide array of publications has proposed implementing a type-2 fuzzy set with TOPSIS. However, the additional degree of uncertainty represented by type 2 has largely been ignored, especially in a few specific mathematical operations in the model. We propose constructing interval type-2 fuzzy membership functions (IT2 MFs) using interval-based data gathered from a survey, where this is used to generate a new scale to represent ratings for each alternative. This procedure utilized all information gathered from decision makers. In addition, we present a complete algorithm for TOPSIS based on IT2 fuzzy sets (IT2 FSs) which preserve the interval-based form output. The output in the form of intervals offers decision makers (DMs) with more detailed information, enabling them to make more nuanced decisions. This can include cautious decisions when intervals are wider and overlapping. Although understanding the exact meaning of these intervals and their widths in a decision-making context is challenging, this paper introduces a systematic method for connecting input uncertainty to output uncertainty in the TOPSIS technique. This approach establishes a solid foundation for future research. Thus far, no other researchers have suggested a data-driven method that combines TOPSIS with fuzzification and provides intervals as the final output.
MSC:
90B50; 90C70; 90C29; 91B06
1. Introduction
Over the past century, there has been a dramatic increase in interest in multi-criteria group decision-making (MCGDM) techniques. MCGDM aims to provide an evaluation and selection which involves multiple alternatives and criteria. Commonly, these alternatives and criteria are in conflict with each other. The MCGDM problem can be viewed as a selection of the most desirable alternative(s) from a set of predetermined alternatives (e.g., ) with the consideration of a set of criteria (). The selection process involves an evaluation from a group of decision makers (DMs) (). In the conventional method, the evaluation or rating for each alternative with respect to each criterion is performed by using a crisp value. However, a major problem with human DMs is that it is difficult to approximate the precise numerical value in the evaluation process. Additionally, DMs commonly exhibit various uncertainties such as linguistic uncertainties, where different DMs have different interpretations for the same context of criteria. In [1], it was reported that variation among a group of DMs may occur, known as inter-expert variability, as well as variation in one DM over time, which is known as intra-expert variability.
A widely recognized method within the MCGDM framework is the TOPSIS method, which is used for ranking and selecting alternatives [2]. This approach operates on the principle that the ideal solution or the best alternative should be closest to the positive ideal solution (PIS) and farthest from the negative ideal solution (NIS). The PIS and NIS represent the collection of best and worst values of the alternatives, respectively. However, sometimes an evaluation or rating cannot be made precisely, as an imprecision may come from different sources such as unquantifiable, incomplete and non-obtainable information, as well as being inadequate for modeling real-life situations [3]. To address these challenges, fuzzy set theory (FST) is employed, which was introduced by Zadeh in 1965 [4]. This theory incorporates the notion of membership degrees, where the degree is expressed as a numerical value between 0 and 1, indicating the extent to which an element belongs to a specific set.
An initial extension of TOPSIS was introduced by Chen in 2000 [5,6], where the utilization of fuzzy numbers (FNs) was employed to represent the degree of linguistic values within fuzzy sets. These combinations have enhanced the classical TOPSIS method, making it more applicable and effective at addressing practical and theoretical issues. According to a survey conducted by Behzadian [7], fuzzy set theory appears to be the most widely used approach in TOPSIS. The survey revealed that over half of the TOPSIS studies incorporated linguistic variables and FNs to handle problems involving imprecise information. Hence, it is reasonable to suggest that fuzzy TOPSIS (FTOPSIS) is presently one of the most popular and successful methods, having demonstrated satisfactory performance in various application domains over the past 15 years (e.g., in [8,9,10,11,12,13,14]).
Even the capability of modeling uncertainty using a fuzzy set proved successful in various applications. Most recently, type-2 fuzzy sets (T2FS) [15] have been found to provide better models, especially when involving large amounts of uncertainty [16]. Unlike T1 FSs, T2 FSs have fuzzy membership functions in three dimensionals which include a footprint of uncertainty (FOU). These FOUs are formed from the union of the primary memberships. Additionally, in the FTOPSIS paradigm, considering the fact that in some cases, precisely determining the membership value between 0 and 1 in T1 FSs is difficult, the membership value can thus be expressed as an interval which consists of real numbers. Commonly, DMs feel more confident providing interval judgments instead of precise values of judgment due to the fact that there exists a fuzzy nature in the comparison process which makes DMs inexplicit about their preferences [17]. Up to now, a number of studies have reported that an extension of the MCDM method with T2FS produced more accurate and robust results [18].
An initial work which represented the TOPSIS method with interval-valued fuzzy sets (IVFSs) was made by Ashtiani [3]. This method modified the the classical FTOPSIS method introduced by Chen [5] by replacing the first and last elements in triangular FNs with interval values. Thus, the linguistic variable scales become interval-valued FNs. However, the calculation in the method is still based on crisp numbers instead of FNs. To address this issue, the concept of IT2 FSs was introduced by Mendel et al. [19] and has been applied in conjunction with the TOPSIS method. Significantly, a notable advancement was made in a method proposed by Chen and Lee [20], where IT2 FSs are employed as a set of ratings in TOPSIS. In this approach, the authors determined the ranking values by utilizing elements from both a fuzzy decision matrix and a crisp decision matrix. Subsequently, the output value (referred to as the closeness coefficient) is calculated using both FNs and crisp numbers, allowing for a comparison of the results. However, other researchers have directed their attention toward specific steps within the TOPSIS method. For instance, in a study by Nasab et al. [21], an IT2 FTOPSIS approach was introduced, focusing on the determination of a fuzzy positive ideal solution and fuzzy negative ideal solution through the utilization of IT2 FSs. In a similar vein, Dymova et al. [22] introduced an IT2 FTOPSIS approach utilizing alpha cuts, whereas Kilic and Kaya [23] suggested an IT2 FTOPSIS approach for evaluating investment projects and producing a conclusive ranking. Given the intricacies of real-world environments and the inherent uncertainty in decision-making problems, interval numbers are frequently employed to represent object evaluation information [24].
Evidently, in all of the studies examined in this review, the uncertainty starts from the initial steps of the processes which include the selection of a feasible group of decision makers, the reasonable alternatives and the criteria. However, here, we are more concerned about the the initial and last steps in the FTOPSIS model, where the former needs to involve humans, which tend to provide opinions or preferences which are imprecise, vague, uncertain and unpredictable, while the latter provide an interval output to be ranked.
The study conducted by Ozen and Garibaldi [25] revealed that there can be variations not only among DMs but also within the decisions made by an individual expert, even when dealing with the same inputs. This implies that the terms utilized in a decision-making model can have different interpretations for different decision makers, and consequently, these DMs may reach distinct conclusions based on their specific perspectives.
The contributions in this paper can be classified into two different stages: the preprocessing data stage, which we called data-driven T2 FTOPSIS, and the ranking stage. The former stage includes the preprocessing of data which were collected as interval values, and modeled into IT2 FSs to handle uncertainty. The latter stage is a new form of output (relative closeness coefficient) in TOPSIS where they remain in interval-valued form. We will discuss the details of both stages in Section 2 and Section 3, respectively.
IT2 FTOPSIS has been acknowledged as a valuable approach for addressing MCDM problems. However, the potential benefits of IT2 FSs, as demonstrated in the reviewed methods, are not fully utilized due to a significant loss of additional information. This is primarily because the final output, known as the closeness coefficient (CC), is still presented as a crisp value. As a result, DMs do not have access to the extra information that could be provided by these sets during the decision-making process. Therefore, it seems reasonable to develop a TOPSIS method that incorporates IT2 FSs and effectively utilizes the additional information they offer, resulting in the final output being an interval. Building upon this idea, our initial experiment, as documented in Madi et al. [26], revealed a relationship between the level of uncertainty (represented by the amount of blurring) and the TOPSIS result, specifically the CC interval. To better represent uncertainty in the FTOPSIS method, we propose gathering opinions from decision makers using a survey where the DM provides interval-based opinions for each term or word used in a rating scale based on different criteria. Then, from these interval-based opinions, we construct IT2 MFs to represent each label or term used in a rating scale. This means the fuzzification process in this model utilizes all information provided by the DMs, depending on the context itself. In addition, we present a complete algorithm for TOPSIS based on IT2 FSs, which preserve the interval-based form until the final output (i.e., the CC interval). Until now, no other scholars have put forward a data-oriented fuzzification TOPSIS technique that yields an interval as the ultimate result, thereby enabling a more comprehensive foundation for ranking within the FTOPSIS methodology.
2. Preliminaries
2.1. Fuzzy Set
Definition 1.
A fuzzy set A in X can be defined as follows:
Here, represents the membership function of A, indicating the degree of membership of x in A. If is equal to one, then it signifies that x completely belongs to the fuzzy set A. In contrast to classical set theory, where membership is binary (either zero or one), in fuzzy set theory can assume the values [0, 1], capturing the concept of partial membership of x in the fuzzy set A [4].
Definition 2.
A fuzzy number M can be defined as a convex normal fuzzy set on the real line R, satisfying the following properties: there exists a unique with (referred to as the mean value of M), and the membership function is piecewise continuous [27].
Fuzzy numbers come in various types that are selected based on specific applications or situations. Among them, the triangular fuzzy number (TFN) is extensively employed in decision making due to its intuitive membership functions and computational ease [28,29]. The definition of a TFN can be expressed as a triplet , where l represents the minimum value, m represents the peak value and u represents the maximum value of the membership function. In this particular study, TFNs are adopted for designing fuzzy membership functions.
Definition 3.
A type-2 fuzzy set (T2FS), represented by , is defined by a type-2 membership function , where x belongs to the set X and u belongs to the interval , as illustrated in Equation (2) [30]:
in which . can also be expressed as
The notation signifies the union over all permissible values of x and u. However, when dealing with discrete universes of discourse, the symbol ∫ is replaced by Σ.
Definition 4.
Definition 5.
The uncertainty associated with the primary memberships of an IT2 FS, denoted as , can be represented by a bounded region known as the FOU. The FOU is formed by the union of all primary memberships [19]. In other words, the FOU encapsulates the range of possible values for the primary memberships of :
As a result, the FOU for can be described by . The FOU is defined by both an upper membership function (UMF) and a lower membership function (LMF).
Definition 6.
A triangular interval type-2 fuzzy number refers to an IT2 FN in which both the UMF and LMF are TFNs. In other words, for a triangular IT2 FN A, it can be expressed as , , where and denote the membership values of the elements and , respectively.
Definition 7.
Consider two trapezoidal fuzzy numbers denoted as and . The Euclidean distance () between these two FNs is defined as shown in Equation (5):
2.2. The Fuzzy TOPSIS (FTOPSIS) Method
In FTOPSIS, a special type of fuzzy set, namely an FN (see Definition 2), is used to represent the human preferences. The series of steps in FTOPSIS is summarized as follows:
- In the given scenario, there are multiple possible alternatives, denoted by , from which DMs need to make a choice. Additionally, there are criteria or attributes, represented by , against which these alternatives will be evaluated. The rating of alternative in relation to criterion is denoted by , and the weight assigned to criterion is denoted by . The values of are given by , where l, m and u represent the elements of the FN as defined in Definition 2.
- Let us consider a decision group comprising k DMs. In such a scenario, the average weights assigned to the criteria and the ratings provided by the k DMs for the alternatives can be calculated as follows:Here, and represent the importance weights assigned by the kth decision maker to the criteria and the ratings given to the alternatives, respectively. The resulting values of and are organized in matrices and , respectively. Both the ratings and the weights are represented as TFNs, where denotes the rating for criterion j of alternative i and represents the importance weight for criterion j.
- Create the normalized fuzzy decision matrix, denoted by , using the formulations provided in Equations (10) and (11):where ifIn this normalization process, is determined to be the minimum value among all if j belongs to the set of criteria C. This step is crucial to ensure that the TFNs are scaled within the range of while preserving their units.
- Given that each criterion holds different levels of importance, the next step is to build the weighted normalized fuzzy decision matrix, denoted by , using the equation provided in Equation (12):where .
- Identify two artificial alternatives referred to as the fuzzy positive ideal solution (FPIS), denoted by , and the fuzzy negative ideal solution (FNIS), denoted by . These alternatives are specifically defined for the purpose of the analysis.
- Compute the distances, denoted by and , for each alternative from the FPIS and FNIS, respectively, using the formulas given in Equations (13) and (14):In the aforementioned equations, represents the distance between two fuzzy numbers using the vertex method. Suppose and are two TFNs. The calculation of the distance between these TFNs can be determined using Equation (15):
- Calculate the relative closeness or closeness coefficient, denoted by , by applying Equation (16):
- Establish the ranking order of the alternatives and choose the most favorable option from a predetermined set of alternatives.
2.3. Interval Approach (IA) and Enhanced Interval Approach (EIA) [31]
The IA, developed by Liu and Mendel [31], is a methodology specifically designed to convert interval descriptions into IT2 FSs that accurately depict those intervals or words. This approach forms an integral part of a recent research initiative in the computational words (CW) field, which focuses on utilizing fuzzy sets (FSs) to model words, particularly adjectives. This enables the words to be effectively employed in computational tasks and approximate reasoning [32,33,34].
The IA method comprises two primary components: (1) the data part and (2) the fuzzy set part. In the data part, the intervals undergo preprocessing to remove outliers, nonsensical data, intervals outside a specified tolerance threshold and intervals that do not overlap with others. The remaining intervals are then assigned probability distributions, generating statistical measures like the mean and standard deviation. The fuzzy set part of the IA method involves nine steps [31]:
- Select a type-1 fuzzy set (T1 FS) model, choosing from options like left shoulder, symmetrical triangle or right shoulder T1 membership functions.
- Define the uncertainty measures for the fuzzy sets, utilizing the mean and standard deviation.
- Calculate the uncertainty measures for the T1 FS models by determining the mean and standard deviation for each T1 FS.
- Derive general formulas for the parameters of the T1 FS models by equating the mean and standard deviation of a T1 FS to its corresponding data interval.
- Determine the nature of the FOU by classifying the set of data intervals as interior, left shoulder or right shoulder FOUs based on the mean values of their left and right endpoints.
- Calculate the embedded T1 FSs by associating the remaining data intervals with their respective T1 FSs.
- Eliminate the inadmissible T1 FSs by removing the embedded T1 FSs whose support falls outside the desired range.
- Generate an IT2 FS by combining the T1 FSs through implementing the ‘union’ operation.
- Approximate the UMFs and LMFs of the FOUs to calculate a mathematical model for the FOUs.
In [31], the IA method was illustrated using survey data that captured people’s opinions on the interpretation of linguistic terms such as ‘very little’ and ‘a lot’. An enhanced version of the IA method, known as the EIA, was subsequently introduced in Coupland’s study [35]. In the EIA method, modifications were made to the preprocessing stage to generate a narrower FOU, and adjustments were implemented in the calculation of the interior LMF. These alterations were motivated by the authors’ observation that the IT2 FSs generated using the standard IA method produced wider intervals compared with the original observations [36]. The EIA method aimed to develop IT2 sets that effectively captured the uncertainty of linguistic terms while preserving the essential shape of trapezoidal or shoulder FOUs. In this paper, we focus on the IA and EIA approaches as reference points for comparison, given that both the IA and EIA share a similar objective of translating interval-based data into fuzzy sets, similar to the proposed IAA approach.
3. Method Formulation
In this section, our objective is to demonstrate the development of a data-driven framework for T2 FTOPSIS. This section begins with an introduction (Section 3.1) that provides an overview of the methodology. It is followed by a comprehensive description of our proposed method (Section 3.2). Subsequently, we delve into a discussion (Section 3.3) highlighting the similarities and distinctions between our proposed method and an existing IT2 FTOPSIS model introduced by Chen et al. [35].
3.1. Introduction
The objective of the proposed method is to establish a precise depiction of interval data through the utilization of fuzzy sets. This approach acknowledges the presence of linguistic uncertainty, considering that individuals may have varying interpretations of a word. The goal is to capture and retain all the information inherent in the original data intervals. More specifically, our aim is to model the uncertainty that arises among decision makers by aggregating all the intervals collected through surveys. Subsequently, we introduce some modifications to the existing FTOPSIS method. We will explain the details in the next section.
3.2. Method
In this section, we propose a modification of the existing FTOPSIS method which enables modeling uncertainties based on context, utilizes interval-based data and directly models the uncertainty from the collected intervals. Based on the standard FTOPSIS technique (Section 2.2), each decision maker needs to give preferences for each alternative with respect to each criterion. Commonly, DMs use linguistic labels (e.g., very good, good or bad) to describe their assessments. The linguistic label usually is constructed based on a real number scale, such as in the Likert scale, and then extended to FNs, where the approximate values lie within the number. In our method, we will construct IT2 FSs directly from the intervals collected during a survey using the interval approach technique (Section 2.3) [31]. This technique aims to use intervals describing words and construct IT2 FSs that represent those intervals or words.
Based on the FTOPSIS paradigm, each decision maker provides an interval associated with a word (i.e., a linguistic label) which relates to specific context on a predetermined scale. For example, a DM is asked the following question: Based on the criterion ‘taste of food’, what is the appropriate interval, on a 0–10 scale, that you associate with the words ‘very tasty’? This procedure is important since the DM’s opinion is solely based on the appropriate linguistic label being chosen. Additionally, this procedure has straightforward mapping from data to an FOU. The generated IT2 MFs can now be used as a rating scale to evaluate each alternative with respect to each criterion. Next, the DMs will provide ratings that can be used in the FTOPSIS procedure to make selections or evaluations.
Since the construction of IT2 MFs is now based on each criterion, there will be different scales for different criteria. These scales represent real interval-based data gathered from a survey. Then, to construct IT2 MFs and, at the same time, model the words used in the linguistic label scale, we employ the interval approach described in Section 2.3.
Assume that there are i DMs, denoted by , and m alternatives to be chosen, denoted by . To make a selection, each DM needs to evaluate each alternative based on n predetermined criteria, denoted by .
3.2.1. Step 1: Constructing Fuzzy Membership Functions
Each DM is asked to give an opinion on what interval number is suitable to represent each linguistic label or appropriate term that will be used in the rating process. It is worth noting that each criterion will have different interpretations, as different criteria will have different meanings and characteristics. Some criteria are classified as benefit criteria, (The larger the rating, the greater the preference.) while the others may classified as cost criteria. (The smaller the rating, the greater the preference.) Assume that there are j intervals given by a group of DMs as follows: . By employing the IA technique, we model each term (i.e., linguistic label) into IT2 FSs.
3.2.2. Step 2: The Rating Process
In this step, all DMs provide ratings for each alternative based on each criterion using the rating scale in Step 1. There are m scales, since there are m criteria. Instead of using one general scale, our proposed method generates different scales for different criteria to represent an exact meaning of an opinion gathered from a DM. This procedure is different than the existing FTOPSIS method, which only uses a general scale which presents synthetic numerical values for each criterion. In other words, the parameters of the scales are not related at all to the exact data gathered from decision makers.
3.2.3. Step 3: Aggregate the Ratings from All DMs
In this step, we aggregate all ratings provided by m decision makers by computing their average. Let us assume that there are two IT2 FNs: , where . In order to combine and aggregate these two FNs, we employ the standard operation in an IT2 FN as in Equation (18):
3.2.4. Step 4: The Normalization Process
Since the criteria involved in most decision problems are different, it is thus essential to perform a normalization process in order to standardize all the data or information within the range of [0, 1]. We employ the normalization technique shown in Equation (18). A decision matrix resulting from the previous step is normalized to , where
3.2.5. Step 5: The Weighting Process
In this step, the DMs specify the importance weight of the criteria and multiply them by each value in a decision matrix to find the weighted normalized decision matrix .:
3.2.6. Step 6: Determine the PIS and NIS
In this step, we need to determine two subjective alternatives based on Equation (20):
3.2.7. Step 7: Find the Distance of Each Alternative to the PIS and NIS
Here, we calculate the distance of each alternative from the PIS and NIS as in Equation (21):
3.2.8. Step 8: Calculate the Relative Closeness Coefficient for Each Alternative
The value remains in interval form. The interval-based CC may provide essential information for a specific context and environment. Thus, we believed that by preserving this interval-based form from the beginning until the end, it would provide significant effects and possibly provide flexibility for making any selection.
3.3. Numerical Analysis
In this section, we use a simple numerical example in order to demonstrate our proposed method. Assume that we conduct a survey about the selection of food outlets by a group of university students. There are five participants which act as DMs, denoted by . There are three alternatives food outlets to be chosen during lunchtime, namely Cafe Terrazo (A1), Cafe Aspire (A2) and SPAR Shop (AC). To make a selection, each participant needs to evaluate each alternative based on three predetermined criteria: average price of food (C1), speed of service (C2) and taste of food (C3). To construct an effective fuzzy rating scale, specifically an IT2 fuzzy scale, we implement the interval approach introduced in [31] to model each word in the label. This procedure starts with gathering a series of opinions from each DM on what is the suitable range value for each linguistic label represented for each criterion. For criterion 1 (average price of food), there are five linguistic labels used to rate the alternatives, namely ‘very low’, ‘low’, ‘medium’, ‘high’ and ‘very high’. An example of a question is as follows: “For each label, please provide your opinion on what is the appropriate range (interval) value of the word ‘very low’ within the ‘price’ variable”.
Assume that five DMs give their interval-based assessments about the appropriate range of values for each linguistic label. For simplicity, we only present five intervals in Table 1.

Table 1.
Interval-based assessment value for each linguistic label with respect to each criterion.
3.3.1. Step 1: The Construction of Fuzzy Sets
We construct the fuzzy sets from these interval-based assessments into MFs. To model uncertainty into IT2 FSs which exist among the decision makers, we employ IA. Basically, this technique aims to model uncertainty regarding the meanings of words used in linguistic labels. For example, we used five respondents to construct the IT2 MFs shown in Figure 1.
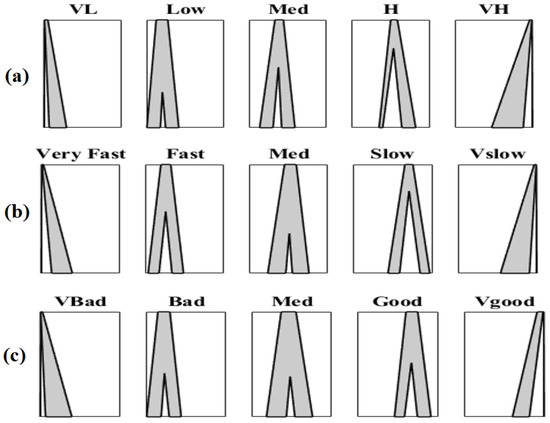
Figure 1.
IT2 MFs for each criterion. (a) Criterion 1: average price of food. (b) Criterion 2: speed of service. (c) Criterion 3: taste of food.
3.3.2. Step 2: The Average Ratings from the Decision Makers
The new rating scales expressed as membership function parameters are now generated based on the results from the previous step. Based on Figure 1, the generated IT2 MFs will provide new scales for each criterion. Examples of the scales and parameters of criterion 1 (price of food), criterion 2 (speed of service) and criterion 3 (taste of food) are presented in Table 2, Table 3 and Table 4.
Table 2.
IT2 fuzzy MF scale for criterion 1 (price of food).
Table 3.
IT2 MF scale for criterion 2 (speed of service).
Table 4.
IT2 MFs scale for criterion 3 (taste of food).
As we mentioned in Step 2 in Section 3.2, there will be m rating scales according to m criteria. After collecting all opinions from the DMs, then the average ratings among the five DMs are calculated as in this example. We assume that the average rating among the five DMs for alternative A1 is summarized in decision matrix :
where
Then, according to Equation (18), we calculate the normalized values, which can be represented in decision matrix as shown in Equation (24):
where
Next, we determine the weighted normalized decision matrix as in Equation (19). In this numerical example, we assume that each criterion has the same weight of importance. Thus, we present as shown in Equation (25):
where
Based on , we determine the fuzzy PIS and fuzzy NIS using Equation (20):
Based on the PIS and NIS values gathered from decision matrix , it can be seen clearly that our method generated these values according to each criterion. There were three PIS and three NIS values, respectively.
Next, we calculate the distance between each alternative with the PIS and NIS using Equation (21). Then, we calculate the total distance of all criteria as shown in Table 5 using Equation (21). Finally, the relative closeness coefficient is calculated using Equation (22). The results are as follows: , and . The ranking alternative in this example was if based on the midpoint ranking. However, since these are interval-based CC values, in certain conditions, it is difficult to determine the ranking. The results can be seen in Figure 2.
Table 5.
Distance from PIS and NIS to each criterion.
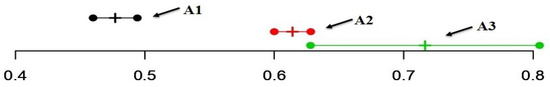
Figure 2.
A3 exhibits a broader interval in comparison with A1 and A2.
Referring to Figure 2, it is evident that A3 exhibited a broader interval in comparison with A1 and A2. Within the context of decision making, this interval-based output offered the DMs a greater wealth of information. Consequently, the DMs could make more nuanced and potentially more cautious decisions, particularly when the intervals were wider and overlapped with each other.
4. Comparing the TOPSIS Results with the Agreement Level Measured with the IAA Approach
In this section, we utilize the IAA technique [37] to compare the agreement level among the decision makers with the results of our proposed IT2 FTOPSIS method. In the same survey, we asked all DMs to what extent they agreed with each provided statement about each alternative on a numerical scale where 0 was associated with ‘strongly disagree’ and 10 meant ‘strongly agree’. In this survey, we provided statements for each DM with respect to each alternative (i.e., Cafe Terrazo (A1), Cafe Aspire (A2) and SPAR Shop (A3)). An example of the statements used in this paper can be seen in Table 6.
Table 6.
Agreement level with the statements given for each alternative (Cafe Terrazo (A1), Cafe Aspire (A2) and SPAR Shop (A3)).
The centroid of a type-2 fuzzy set is computed by finding the centroid of the footprint of uncertainty (FOU). The FOU represents the entire region of possible values for which the membership degree of the type-2 fuzzy set is greater than zero. To calculate the centroid of the FOU, we need to perform the following steps:
- For each possible value in the universe of discourse, calculate the membership degree of the primary membership function and the secondary membership function.
- Multiply each membership degree by the corresponding value in the universe of discourse.
- Compute the weighted average of the resulting values for both the primary and secondary membership functions to find the centroid of the FOU.
Each DM provided an agreement level in elliptical form, where they could use intervals to show their agreement. The collection of agreement levels on which the interval was based was converted to a type-1 FS using the IAA technique. This technique basically models two types of uncertainty based on interval data gathered from a survey, which are inter-expert uncertainty (uncertainty among the individual opinions of a group of participants) and intra-expert uncertainty (uncertainty in the opinions of a particular participant). However, in this numerical example, we only captured the inter-expert uncertainty, which was associated with uncertainty in giving responses or opinions among the DMs in this survey-based method. Since there were five DMs involved in this numerical example, all individual opinions based on intervals could be aggregated into T1 FSs which provided an overall model of inter-expert uncertainty across the surveyed sources. An example of the aggregated T1 FS models among the five DMs can be seen in Figure 3, Figure 4 and Figure 5, where alternative 1 is associated with Cafe Terrazo, alternative 2 is associated with Cafe Aspire and alternative 3 is associated with SPAR Shop. In the figures, the green vertical line is associated with the centroid values which presented the agreement level among all DMs regarding the specific conditions given in this numerical example.
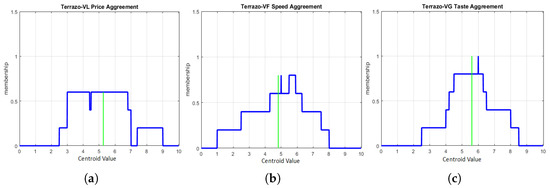
Figure 3.
Type-1 fuzzy set and agreement level (centroid value) for alternative 1 using MATLAB R2018a software and Cafe Terrazo with green color is deffuzification (centroid) and blue color is fuzzy set: (a) Terrazo with very low price, (b) Terrazo with very fast service and (c) Terrazo with very good taste.
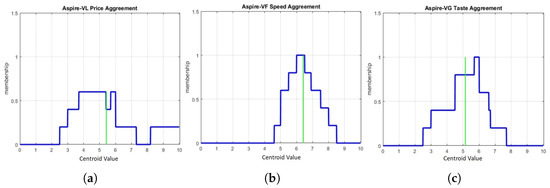
Figure 4.
Type-1 fuzzy set and agreement level (centroid value) for alternative 2 using MATLAB R2018a software for Cafe Aspire with with green color is deffuzification (centroid) and blue color is fuzzy set: (a) Aspire with very low price, (b) Aspire with very fast service and (c) Aspire with very good taste.
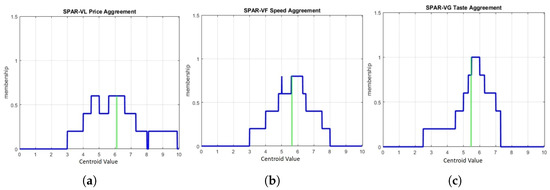
Figure 5.
Type-1 fuzzy set and agreement level (centroid value) for alternative 3 using MATLAB R2018a software for Cafe Aspire with with green color is deffuzification (centroid) and blue color is fuzzy set: (a) Aspire with very low price, (b) Aspire with very fast service and (c) Aspire with very good taste.
We summarized the centroid values associated with each linguistic label in Table 7. This centroid value indicates to what extent all the DMs agreed with the given assessment for each alternative with respect to each criterion. Based on the given table, the ranking order of the alternatives was the same as that for the IT2 FTOPSIS method in Section 5. Thus, we can see that the direct fuzzification technique constructed using interval-based data from surveyed sources used in IT2 FTOPSIS that it was aligned with the total agreement gathered from the DMs when supplied the same ratings as those in the IT2 FTOPSIS method.
Table 7.
Centroids of Type-1 fuzzy sets produced with the IAA approach for all alternatives (A1, A2 and A3).
The centroid values give insight into the extent to which the participants agreed with the opinions among the decision makers.
5. Conclusions
In this paper, a new framework (IT2 TOPSIS) was proposed. A detailed explanation of each step was given, where the focus of this paper was the fuzzification process and the final output of the proposed method [37,38,39]. In addition, we provided a comparison of our new framework and the well-established IAA technique to see the overall agreement among DMs. The results of our new IT2 FTOPSIS method were aligned with the total agreeement among the same number of decision makers. The new framework begins with the construction of IT2 MFs using interval-based data gathered from the survey where this is used to generate a new scale to represent the ratings for each alternative. This procedure utilizes all information gathered from the decision makers. In addition, we presented a complete algorithm for TOPSIS based on IT2 FSs, which preserved the interval-based form output. Until now, no other researchers have put forward a data-driven technique that incorporates fuzzification and provides intervals as the final output, specifically in the form of CC values. The proposed method retains the CC values as interval-valued entities, ensuring minimal loss of information and leveraging the potential benefits of using IT2 FSs. Within a decision-making framework, this interval-based output provides DMs with comprehensive information, enabling them to make more precise and potentially cautious decisions, particularly when the intervals are wider and overlap. However, it is important to note that interpreting the resulting intervals and their widths within a decision-making context can be challenging. Nevertheless, this paper establishes a systematic approach to connecting input uncertainty with output uncertainty in the TOPSIS method, laying a robust foundation for future research endeavors. The proposed type-2 fuzzy TOPSIS method may be applicable only to certain types of decision-making problems, and its effectiveness may vary depending on the characteristics of the data and the specific application domain. In addition, for future work, we will compare type-2 fuzzy TOPSIS and type-2 fuzzy AROMAN for decision-making models.
Author Contributions
Conceptualization, E.N.M. and Z.A.Z.; methodology, E.N.M.; software, Z.A.Z.; formal analysis, S. and A.S.; investigation, A.S. and S.; writing—original draft preparation, E.N.M. and A.S.; writing—review and editing, Z.A.Z. and S.; funding acquisition, E.N.M. All authors have read and agreed to the published version of the manuscript.
Funding
This research was funded by Universiti Sultan Zainal Abidin (UniSZA) under project number UniSZA/2022/DPU1.0/10.
Institutional Review Board Statement
Not applicable.
Informed Consent Statement
Not applicable.
Data Availability Statement
Not applicable.
Acknowledgments
Elissa Nadia Madi acknowledges Universiti Sultan Zainal Abidin (UniSZA) for their support and financial project.
Conflicts of Interest
The authors declare no conflict of interest.
Abbreviations
The following abbreviations are used in this manuscript:
| MCDGM | Multi-criteria group decision making |
| MCDM | Multi-criteria decision making |
| TOPSIS | Technique for Order Preference by Similarity to Ideal Solution |
| IT2 MFs | Interval type-2 fuzzy membership functions |
| IT2 FSs | Interval type-2 fuzzy sets |
| IT2 FN | Interval type-2 fuzzy number |
| IT2 FTOPSIS | Interval type-2 fuzzy technique for Order Preference by Similarity to Ideal Solution |
| DMs | Decision makers |
| PIS | Positive ideal solution |
| NIS | Negative ideal solution |
| FST | Fuzzy set theory |
| FN | Fuzzy number |
| FTOPSIS | Fuzzy TOPSIS |
| T2Fs | Type-2 fuzzy sets |
| FOU | Footprint of uncertainty |
| IVFS | Interval-valued duzzy set |
| CC | Closeness coefficient |
| UMF | Upper membership function |
| LMF | Lower membership function |
| FPIS | Fuzzy positive ideal solution |
| FNIS | Fuzzy negative ideal solution |
| IA | Interval approach |
| EIA | Enhanced interval approach |
| CW | Computational words |
References
- Garibaldi, J.M.; Ozen, T. Uncertain fuzzy reasoning: A case study in modelling expert decision making. IEEE Trans. Fuzzy Syst. 2007, 15, 16–30. [Google Scholar] [CrossRef]
- Chen, S.J.; Hwang, C.L.; Chen, S.J.; Hwang, C.L. Fuzzy Multiple Attribute Decision Making Methods; Springer: Berlin/Heidelberg, Germany, 1992; pp. 289–486. [Google Scholar]
- Ashtiani, B.; Haghighirad, F.; Makui, A.; ali Montazer, G. Extension of fuzzy TOPSIS method based on interval-valued fuzzy sets. Appl. Soft Comput. 2009, 9, 457–461. [Google Scholar] [CrossRef]
- Zadeh, L.A. Fuzzy Sets. Inf. Control 1965, 8, 338–353. [Google Scholar] [CrossRef]
- Chen, C.T. Extensions of the TOPSIS for group decision-making under fuzzy environment. Fuzzy Sets Syst. 2000, 114, 1–9. [Google Scholar] [CrossRef]
- Jahanshahloo, G.R.; Lotfi, F.H.; Izadikhah, M. Extension of the TOPSIS method for decision-making problems with fuzzy data. Appl. Math. Comput. 2006, 181, 1544–1551. [Google Scholar] [CrossRef]
- Behzadian, M.; Otaghsara, S.K.; Yazdani, M.; Ignatius, J. A state-of the-art survey of TOPSIS applications. Expert Syst. Appl. 2012, 39, 13051–13069. [Google Scholar] [CrossRef]
- Chen, C.T.; Lin, C.T.; Huang, S.F. A fuzzy approach for supplier evaluation and selection in supply chain management. Int. J. Prod. Econ. 2006, 102, 289–301. [Google Scholar] [CrossRef]
- Benitez, J.M.; Martín, J.C.; Román, C. Using fuzzy number for measuring quality of service in the hotel industry. Tour. Manag. 2007, 28, 544–555. [Google Scholar] [CrossRef]
- Chu, T.C. Selecting plant location via a fuzzy TOPSIS approach. Int. J. Adv. Manuf. Technol. 2002, 20, 859–864. [Google Scholar] [CrossRef]
- Collan, M.; Luukka, P. Evaluating R and D projects as investments by using an overall ranking from four new fuzzy similarity measure-based TOPSIS variants. IEEE Trans. Fuzzy Syst. 2013, 22, 505–515. [Google Scholar] [CrossRef]
- Lo, C.C.; Chen, D.Y.; Tsai, C.F.; Chao, K.M. Service selection based on fuzzy TOPSIS method. In Proceedings of the 2010 IEEE 24th International Conference on Advanced Information Networking and Applications Workshops, Perth, Australia, 20–23 April 2010; pp. 367–372. [Google Scholar]
- Ziemba, P.; Szaja, M. Fuzzy Decision-Making Model for Solar Photovoltaic Panel Evaluation. Energies 2023, 16, 5161. [Google Scholar] [CrossRef]
- Marín, D.G.; Luiz, J. Group Decision-Making Model Based on 2-Tuple Fuzzy Linguistic Model and AHP Applied to Measuring Digital Maturity Level of Organizations. Systems 2023, 11, 341. [Google Scholar] [CrossRef]
- Zadeh, L.A. The concept of a Linguistic Variable and Its Application to Approximate Reasoning—Part II. Inf. Sci. 1975, 8, 301–357. [Google Scholar] [CrossRef]
- Hagras, C.W.H. Novel methods for the design of general type-2 fuzzy sets based on device characteristics and linguistic labels surveys. Proc. Int. Fuzzy Syst. Assoc. World Congr. 2009, 537–543. [Google Scholar]
- Kahraman, C. Fuzzy Multi-Criteria Decision Making; Springer Science+Business Media, LLC: Berlin/Heidelberg, Germany, 2008; Volume 16. [Google Scholar]
- Celik, E.; Gul, M.; Aydin, N.; Gumus, A.T.; Guneri, A.F. A comprehensive review of multi criteria decision making approaches based on interval type-2 fuzzy sets. Knowl.-Based Syst. 2015, 85, 329–341. [Google Scholar] [CrossRef]
- Mendel, J.M.; John, R.I.; Liu, F. Interval type-2 fuzzy logic systems made simple. IEEE Trans. Fuzzy Syst. 2006, 14, 808–821. [Google Scholar] [CrossRef]
- Chen, S.M.; Lee, L.W. Fuzzy multiple attributes group decision-making based on the interval type-2 TOPSIS method. Expert Syst. Appl. 2010, 37, 2790–2798. [Google Scholar] [CrossRef]
- Ghaemi, N.F.; Rostamy, M.M. Extension of TOPSIS for group decision-making based on the type-2 fuzzy positive and negative ideal solutions. Int. J. Ind. Math. 2010, 2, 199–213. [Google Scholar]
- Dymova, L.; Sevastjanov, P.; Tikhonenko, A. An interval type-2 fuzzy extension of the TOPSIS method using alpha cuts. Knowl.-Based Syst. 2015, 83, 116–127. [Google Scholar] [CrossRef]
- Kilic, M.; Kaya, İ. Investment project evaluation by a decision making methodology based on type-2 fuzzy sets. Appl. Soft Comput. 2015, 27, 399–410. [Google Scholar] [CrossRef]
- Liu, Y.; Xiao, Y.; Li, T.; Jia, Y. A Three-Way Acceleration Approach for Interval-Valued Multi-Attribute Decision-Making Problems. Appl. Sci. 2023, 13, 7879. [Google Scholar] [CrossRef]
- Ozen, T.; Garibaldi, J.M. Investigating adaptation in type-2 fuzzy logic systems applied to umbilical acid-base assessment. In Proceedings of the European Symposium on Intelligent Technologies, Hybrid Systems and Their Implementation on Smart Adaptive Systems, Oulu, Finland, 10–12 July 2003; pp. 289–294. [Google Scholar]
- Madi, E.N.; Garibaldi, J.M.; Wagner, C. Exploring the use of type-2 fuzzy sets in multi-criteria decision making based on TOPSIS. In Proceedings of the 2017 IEEE International Conference on Fuzzy Systems (FUZZ-IEEE), Naples, Italy, 9–12 July 2017; pp. 1–6. [Google Scholar]
- Zimmermann, H.J. Fuzzy Set Theory—And Its Applications; Kluwer Academic Publishers: Boston, MA, USA; Dordrecht, The Netherlands; London, UK, 1991; p. 399. [Google Scholar]
- Ertuğrul, İ.; Karakaşoğlu, N. Comparison of fuzzy AHP and fuzzy TOPSIS methods for facility location selection. Int. J. Adv. Manuf. Technol. 2008, 39, 783–795. [Google Scholar] [CrossRef]
- Junior, F.R.L.; Osiro, L.; Carpinetti, L.C.R. A comparison between Fuzzy AHP and Fuzzy TOPSIS methods to supplier selection. Appl. Soft Comput. 2014, 21, 194–209. [Google Scholar] [CrossRef]
- Mendel, J.M.; John, R.B. Type-2 fuzzy sets made simple. IEEE Trans. Fuzzy Syst. 2002, 10, 117–127. [Google Scholar] [CrossRef]
- Liu, F.; Mendel, J.M. Encoding words into interval type-2 fuzzy sets using an interval approach. IEEE Trans. Fuzzy Syst. 2008, 16, 1503–1521. [Google Scholar] [CrossRef]
- Herrera, F.; Alonso, S.; Chiclana, F.; Herrera-Viedma, E. Computing with words in decision making: Foundations, trends and prospects. Fuzzy Optim. Decis. Mak. 2009, 8, 337–364. [Google Scholar] [CrossRef]
- Zadeh, L.A. Fuzzy Logic = Computing with Words. IEEE Trans. Fuzzy Syst. 1996, 4, 103–111. [Google Scholar]
- Mendel, J.M.; Wu, H. Type-2 fuzzistics for symmetric interval type-2 fuzzy sets: Part 2, inverse problems. IEEE Trans. Fuzzy Syst. 2007, 15, 301–308. [Google Scholar]
- Chen, S.M.; Hong, J.A. Fuzzy multiple attributes group decision-making based on ranking interval type-2 fuzzy sets and the TOPSIS method. IEEE Trans. Syst. Man Cybern. Syst. 2014, 44, 1665–1673. [Google Scholar]
- Coupl, S.; Mendel, J.M.; Wu, D. Enhanced interval approach for encoding words into interval type-2 fuzzy sets and convergence of the word fous. In Proceedings of the International Conference on Fuzzy Systems, Barcelona, Spain, 18–23 July 2010; pp. 1–8. [Google Scholar]
- Wagner, C.; Miller, S.; Garibaldi, J.M.; Anderson, D.T.; Havens, T.C. From interval-valued data to general type-2 fuzzy sets. IEEE Trans. Fuzzy Syst. 2014, 23, 248–269. [Google Scholar] [CrossRef]
- Awang, Z.; Afthanorhan, A.; Mohamad, M.; Asri, M.A.M. An evaluation of measurement model for medical tourism research: The confirmatory factor analysis approach. Int. J. Tour. Policy 2015, 6, 29–45. [Google Scholar] [CrossRef]
- Madi, E.N.; Naim, S.; Yaafar, A.; Yaakob, A.M.; Yusoff, B. Agreement matrix based on fuzzy decision-making to rank ship Berthing criteria. Int. J. Eng. Trends Technol. 2010, 68, 31–36. [Google Scholar] [CrossRef]
Disclaimer/Publisher’s Note: The statements, opinions and data contained in all publications are solely those of the individual author(s) and contributor(s) and not of MDPI and/or the editor(s). MDPI and/or the editor(s) disclaim responsibility for any injury to people or property resulting from any ideas, methods, instructions or products referred to in the content. |
© 2023 by the authors. Licensee MDPI, Basel, Switzerland. This article is an open access article distributed under the terms and conditions of the Creative Commons Attribution (CC BY) license (https://creativecommons.org/licenses/by/4.0/).