Article

Analysis and Optimal Control of the Tungro Virus Disease Spread Model in Rice Plants by Considering the Characteristics of the Virus, Roguing, and Pesticides

1
Doctoral Program of Mathematics, Faculty of Mathematics and Natural Sciences, Universitas Padjadjaran, Sumedang 45363, Indonesia
2
Department of Mathematics, Faculty of Mathematics and Natural Sciences, Universitas Padjadjaran, Sumedang 45363, Indonesia
3
Department of Plant Pathology, Faculty of Agriculture, Universitas Padjadjaran, Sumedang 45363, Indonesia
*
Author to whom correspondence should be addressed.
Mathematics 2023, 11(5), 1151; https://doi.org/10.3390/math11051151
Submission received: 31 January 2023 / Revised: 16 February 2023 / Accepted: 22 February 2023 / Published: 25 February 2023
(This article belongs to the Special Issue Mathematical Population Dynamics and Epidemiology)

Abstract

:
Farmers have an essential role in maintaining food security. One of the food crops that occupies a high position in Indonesia is rice. However, farmers often experience problems when cultivating rice plants, one of which is affected by the tungro virus disease in rice plants. The spread of the disease can be controlled by the roguing process and applying pesticides. In this study, an analysis of the model of the spread of tungro virus disease in rice plants took into account the characteristics of the rice tungro spherical virus (RTSV) and rice tungro bacilliform virus (RTBV), as well as control in the form of roguing processes and application of pesticides. The analysis carried out was in the form of dynamic analysis, sensitivity analysis, and optimal control. In addition, numerical simulations were also carried out to describe the results of the analysis. The results showed that the roguing process and the application of pesticides could control the spread of the tungro virus disease. The application is sufficient, at as much as 75%.

1. Introduction

The Sustainable Development Goals (SDGs) are plans for a better world, and the effects can be felt by humans and the Earth. The second goal of the SDGs is to end hunger, achieve food security, improve nutrition, and promote sustainable agriculture [1,2]. Farmers play an essential role in this achievement, and they are often called food fighters [3]. This is because agriculture is the sector with the highest income and is the basis of the livelihoods of Indonesian people in rural areas [4]. Additionally, agriculture supports the development of other sectors and improves people’s welfare by creating jobs and increasing purchasing power [5,6].
Rice (Oryza sativa L.) is a food crop commodity that plays an essential role in Indonesia’s economic life. However, the challenges experienced by the agricultural sector in rice cultivation are very complex, including fluctuating production with very low productivity [7,8,9,10].
The low productivity of rice cultivation is caused by various factors, such as exposure to pests and plant diseases [11,12]. These problems have various causes, including tungro virus disease, which is spread by the green leafhopper vector [13]. The disease is also caused by different viruses, namely rice tungro spherical virus (RTSV) and rice tungro bacilliform virus (RTBV), which are spread by the green leafhopper vector (Nephotettix virescens) after sucking infected plants [14,15,16,17,18,19]. Symptoms include changes in leaf color, specifically on young orange-yellow leaves starting from the tip, and then the young leaves are slightly curled, the number of tillers is reduced, and growth is stunted. These symptoms usually appear 6–15 days after infection [20]. These problems can be controlled in various ways, including roguing and applying pesticides. However, to see the effectiveness of roguing and pesticide application, a more detailed analysis is needed, such as by using a mathematical model [21].
Many researchers have studied tungro virus disease in rice plants, as seen from the results of literature searches from 2014 to 2023 that discuss tungro disease in rice plants; 129 papers were recorded in the Dimensions database, 5000 papers in the Google Scholar database, and 374 in the Scopus database. Among these, seven discuss the mathematical model of the spread of tungro disease. Among the seven papers, Blas [22] discusses a mathematical model for the spread of tungro disease by taking into account the characteristics of the two viruses it spreads [22], and then the model is redeveloped by adding roguing factors and simulating it [23], while Anggriani [24] made a mathematical model by considering the use of insecticides to control the spread of tungro disease in rice plants that were then analyzed dynamically. In contrast to Anggriani, Suryaningrat [25] considered biological agents and analyzed them dynamically, looking for optimal control. Then the model was reworked to become spatiotemporal [26]. Unlike previous researchers, Maryati [27] developed a mathematical model by dividing the rice plant compartment into two phases: vegetative and generative. The interrelationships of the seven papers can be seen in Figure 1.
The parameter values used in mathematical models are generally based only on assumptions. This is because of the unavailability of data or data that are incomplete. Therefore, conducting a sensitivity analysis is very important to identify the parameters that are very influential in the model that has been developed. This study follows research conducted by Bokil et al. [28], who performed a numerical sensitivity analysis to describe healthy and infected populations with varying parameter values, such as what percentage of pesticides are used in comparison to the recommended dose if control is also carried out in the form of roguing to control the spread of tungro virus disease in rice plants and minimize expenses, namely by determining the optimal dynamic model for controlling tungro virus disease in rice plants involving the application of pesticides. This follows the research conducted by several researchers who have studied optimal control of disease spread [28,29,30,31,32,33,34,35,36] using the Maximum Pontryagin principle but not in the case of spreading tungro virus disease in rice plants [28,33,34,35,36].
From Figure 1, it can be seen that there is no relationship between the tungro disease spread model that considers the virus’s characteristics, control in the form of the roguing process, and application of pesticides, with dynamic analysis, sensitivity analysis, and optimal control. This is following the results of research conducted by Amelia [37]. Therefore, in this paper, dynamic analysis, sensitivity analysis, and optimal control of the tungro virus disease spread model developed by Blas [23] were carried out using the Maximum Pontryagin principle. This discussion is considered very important for understanding the dynamic behavior of the model, the effect of one of the parameters if it changes, and the optimal control to see the effectiveness of roguing and pesticide application. Meanwhile, the numerical simulation provides an overview and confirms the analysis results.

2. Mathematical Models

The mathematical model analyzed in this study is the Blas model [23] as in the Equations (1)–(8), with parameter and variable descriptions as shown in Table 1.
d P 0 d t = r K N P α P 0 V 3 N P γ P 0 V 3 N P τ P 0 V 3 N P β P 0 V 1 N P σ P 0 V 2 N P q 0 P 0
d P 1 d t = β 1 ρ P 0 V 1 N P + γ 1 ρ P 0 V 3 N P λ 1 ρ P 1 V 3 N P q 1 1 ρ P 1 ρ P 1
d P 2 d t = τ 1 ρ P 0 V 3 N P + σ 1 ρ P 0 V 2 N P δ 1 ρ P 2 V 3 N P q 2 1 ρ P 2 ρ P 2
d P 3 d t = α 1 ρ P 0 V 3 N P + λ 1 ρ P 1 V 3 N P + δ 1 ρ P 2 V 3 N P q 3 1 ρ P 3 ρ P 3
d V 0 d t = B N V 1 N V V α P 3 V 0 N P b P 1 V 0 N P + f V 2 μ V 0
d V 1 d t = b P 1 V 0 N P g P 2 V 1 N P μ V 1
d V 2 d t = c V 3 f V 2 μ V 2
d V 3 d t = α P 3 V 0 N P + g P 2 V 1 N P c V 3 μ V 3

3. Dynamic Analysis

3.1. Positivity

Theorem 1. 
The region Z given by Z = P 0 t , P 1 t , P 2 t , P 3 t , V 0 t , V 1 t , V 2 t , V 3 t R + 8 is positively invariant and attracting to the model system (1)–(8).
Proof of Theorem 1. 
Assume that N P is constant, suppose { P 0 t , P 1 t , P 2 t , P 3 t , V 0 t , V 1 t , V 2 t , V 3 t
} is any solution of the system with initial conditions not negative P 0 t 0 , P 1 t 0 , P 2 t 0 , P 3 t 0 , V 0 t 0 , V 1 t 0 , V 2 t 0 , V 3 t 0 .
d P 0 d t = r K N P α P 0 V 3 N P γ P 0 V 3 N P τ P 0 V 3 N P β P 0 V 1 N P σ P 0 V 2 N P q 0 P 0 d P 0 d t = α V 3 N P γ V 3 N P τ V 3 N P β V 1 N P σ V 2 N P q 0 P 0 d P 0 P 0 = α V 3 N P γ V 3 N P τ V 3 N P β V 1 N P σ V 2 N P q 0 d t d P 0 P 0 = α V 3 N P γ V 3 N P τ V 3 N P β V 1 N P σ V 2 N P q 0 d t d P 0 P 0 = α V 3 N P γ V 3 N P τ V 3 N P β V 1 N P σ V 2 N P q 0 d t ln P 0 = α V 3 N P γ V 3 N P τ V 3 N P β V 1 N P σ V 2 N P q 0 d t P 0 = exp α V 3 N P γ V 3 N P τ V 3 N P β V 1 N P σ V 2 N P q 0 d t P 0 = exp α V 3 N P γ V 3 N P τ V 3 N P β V 1 N P σ V 2 N P q 0 d t 0
In the same way obtained P 1 , P 2 , P 3 , V 0 , V 1 , V 2 , V 3 0 .

3.2. Non-Endemic Equilibrium Point

By setting d P 1 d t = d P 2 d t = d P 3 d t = d V 1 d t = d V 2 d t = d V 3 d t = 0 , a non-endemic equilibrium point is obtained as in the Equation (9).
E 0 = P 0 , P 1 . P 2 . P 3 , V 0 , V 1 , V 2 , V 3 = r K N P q 0 ,   0 ,   0 ,   0 , B N V 1 N V V μ ,   0 ,   0 ,   0

3.3. Basic Reproduction Numbers

The basic reproduction number R 0 estimates the ability of new infections to spread. In determining R 0 , we used the next-generation matrix method [38]. Because in the model of the spread of tungro virus disease in rice plants by considering the characteristics of the virus and carrying out control by roguing (Equations (1)–(8)) there are no latent compartments, the calculation can be performed by using only the infected compartments.
f = β P 0 1 ρ V 1 N P + γ 1 ρ P 0 V 3 N P τ 1 ρ P 0 V 3 N P + σ 1 ρ P 0 V 2 N P α 1 ρ P 0 V 3 N P + λ 1 ρ P 1 V 3 N P + δ 1 ρ P 2 V 3 N P b V 0 P 1 N P c V 3 a V 0 P 3 N P + g V 1 P 2 N P   and   v = λ P 1 V 3 N P + q 1 1 ρ P 1 + ρ P 1 δ P 2 V 3 N P + q 2 1 ρ P 2 q 3 1 ρ P 3 ρ P 3 g V 1 P 2 N p + μ V 1 f V 2 + μ V 2 c V 3 + μ V 3
So, obtained
R 01 = ζ F V 1 = a B N V α r K N P V N V 1 ρ V μ q 0 c q 3 + μ q 3 1 ρ + c + μ ρ N P 2 , R 02 = ζ F V 1 = b B N V β r K N P V N V 1 ρ V q 0 q 1 1 ρ ρ μ 2 N P 2 , and   R 0 = max R 01 , R 02
f and v are the newly infected matrices and exit matrices, respectively. Moreover, F and V are the Jacobian matrices of f and v calculated at non-endemic equilibrium points.

3.4. Stability Analysis

Theorem 2. 
Model of the spread of tungro disease in the system of Equations (1)–(8) is locally asymptotically stable when R 0 < 1 .
Proof of Theorem 2. 
To prove the local stability of the system of Equations (1)–(8), an evaluation of the Jacobian matrix of the tungro disease distribution model was carried out in the system of Equations (1)–(8) at the non-endemic equilibrium point, which was then determined based on the signs of the eigenvalues of the resulting characteristic equation. The characteristic equation resulting from this model was as in Equation (10).
1 V 2 μ 2 N P 4 q 0 2 λ + q 2 + q 2 1 ρ λ + q 0 λ + μ f + λ + μ p λ = 0
with p λ = a 0 λ 4 + a 1 λ 3 + a 2 λ 2 + a 3 λ + a 4 , when a i > 0 ; i = 0 , , 4 (for each coefficient see Appendix A).
From Equation (10), it can be seen that λ i < 0 ;   i = 1 , , 8   i f   R 0 < 1 . So, it can be concluded that the model of the spread of tungro virus disease in rice plants will be stable if R 0 < 1 .

3.5. Numerical Simulation

To illustrate the population dynamics of the spread of tungro virus disease in rice plants, taking into account the characteristics of the virus and the roguing treatment, we used the parameter and initial values as in Table 2.
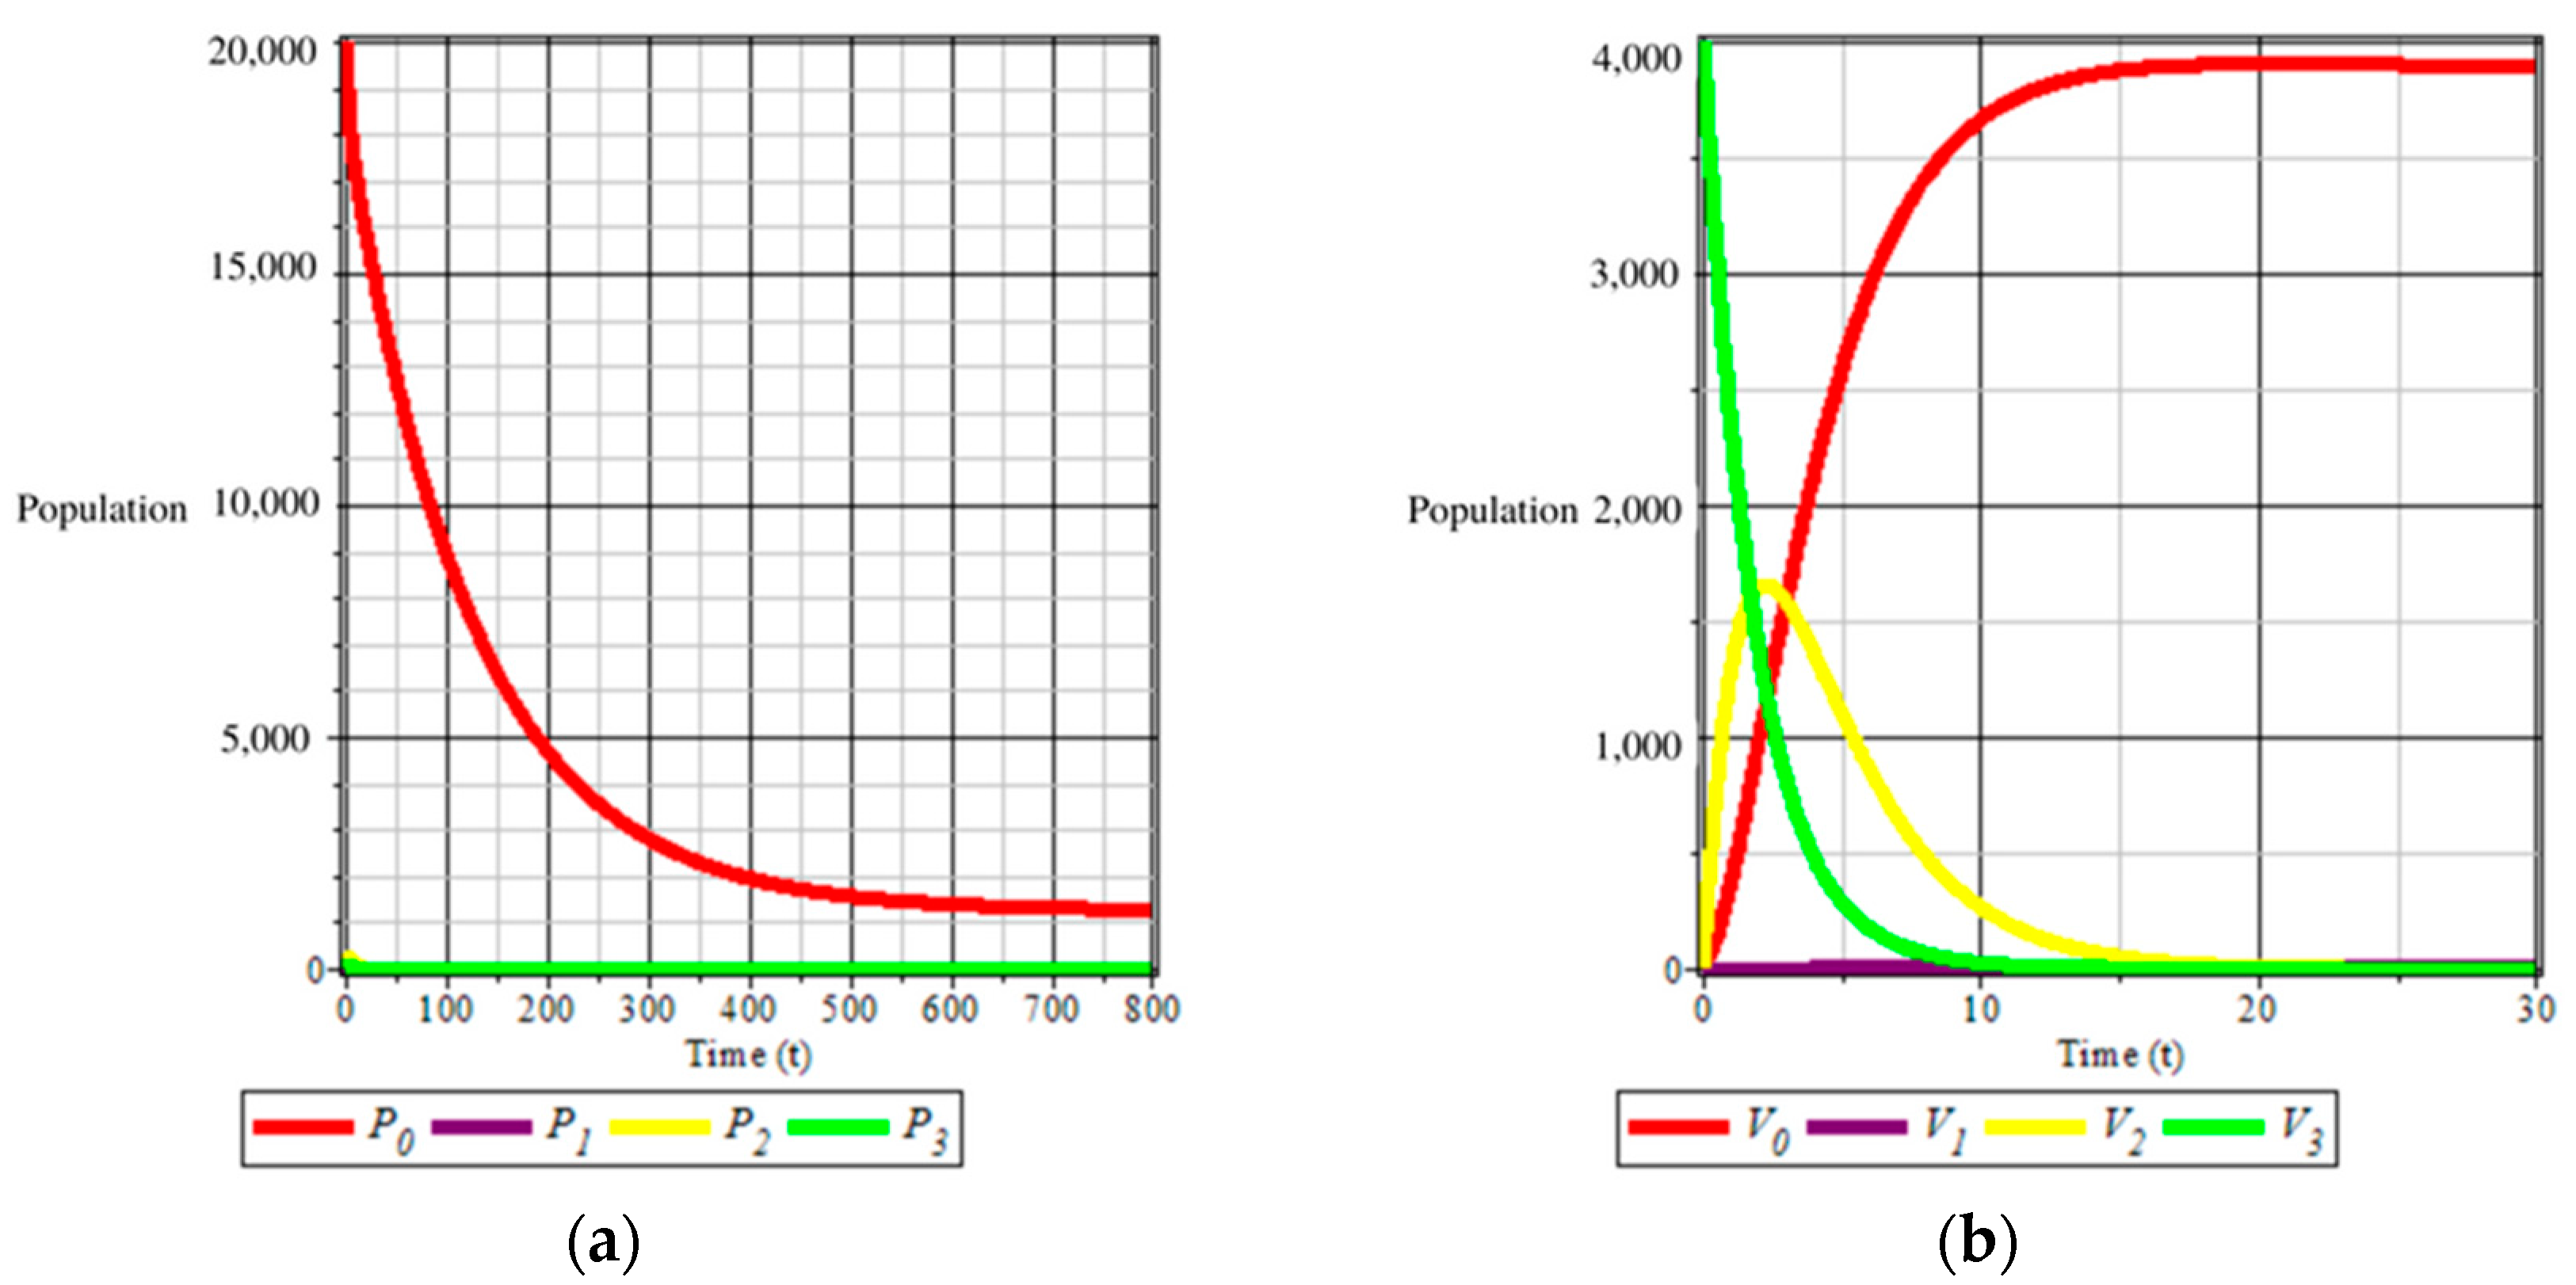
By using the parameter and initial values as shown in Table 2, Figure 2 and Figure 3 were obtained for the dynamics of the rice plant and the green leafhopper vector when R 0 < 1 , respectively. Figure 4 and Figure 5 illustrate the dynamics of rice plant populations and the green leafhopper vector when R 0 > 1 .
From Figure 2a, it can be seen that there is no infected rice plant population (infected with only RTSV, only RTBV, or both). This means that R 0 < 1 there is no endemic. Figure 2b shows that the green leafhopper population infected by RTSV + RTBV will continue to decrease until it is destroyed, and the only green leafhoppers that are left are susceptible. This susceptible green leafhopper vector will always exist but will not cause infection because neither the green leafhopper nor the infected plants are there, so no virus can be spread (endemic does not occur).
Unlike the previous figure, Figure 3a,b shows the occurrence of endemic when R 0 > 1 . This can be seen in Figure 3a, which shows an increase in the number of plant populations affected by RTBV and RTSV + RTBV. Both of these plant populations can become a source of the spread of tungro virus disease in rice plants. Likewise, Figure 3b shows that the infected green leafhopper population will always occur. This causes a significant potential for endemic occurrence because the green leafhopper population can spread the virus, both RTSV, RTBV, and RTSV + RTBV.

4. Sensitivity Analysis

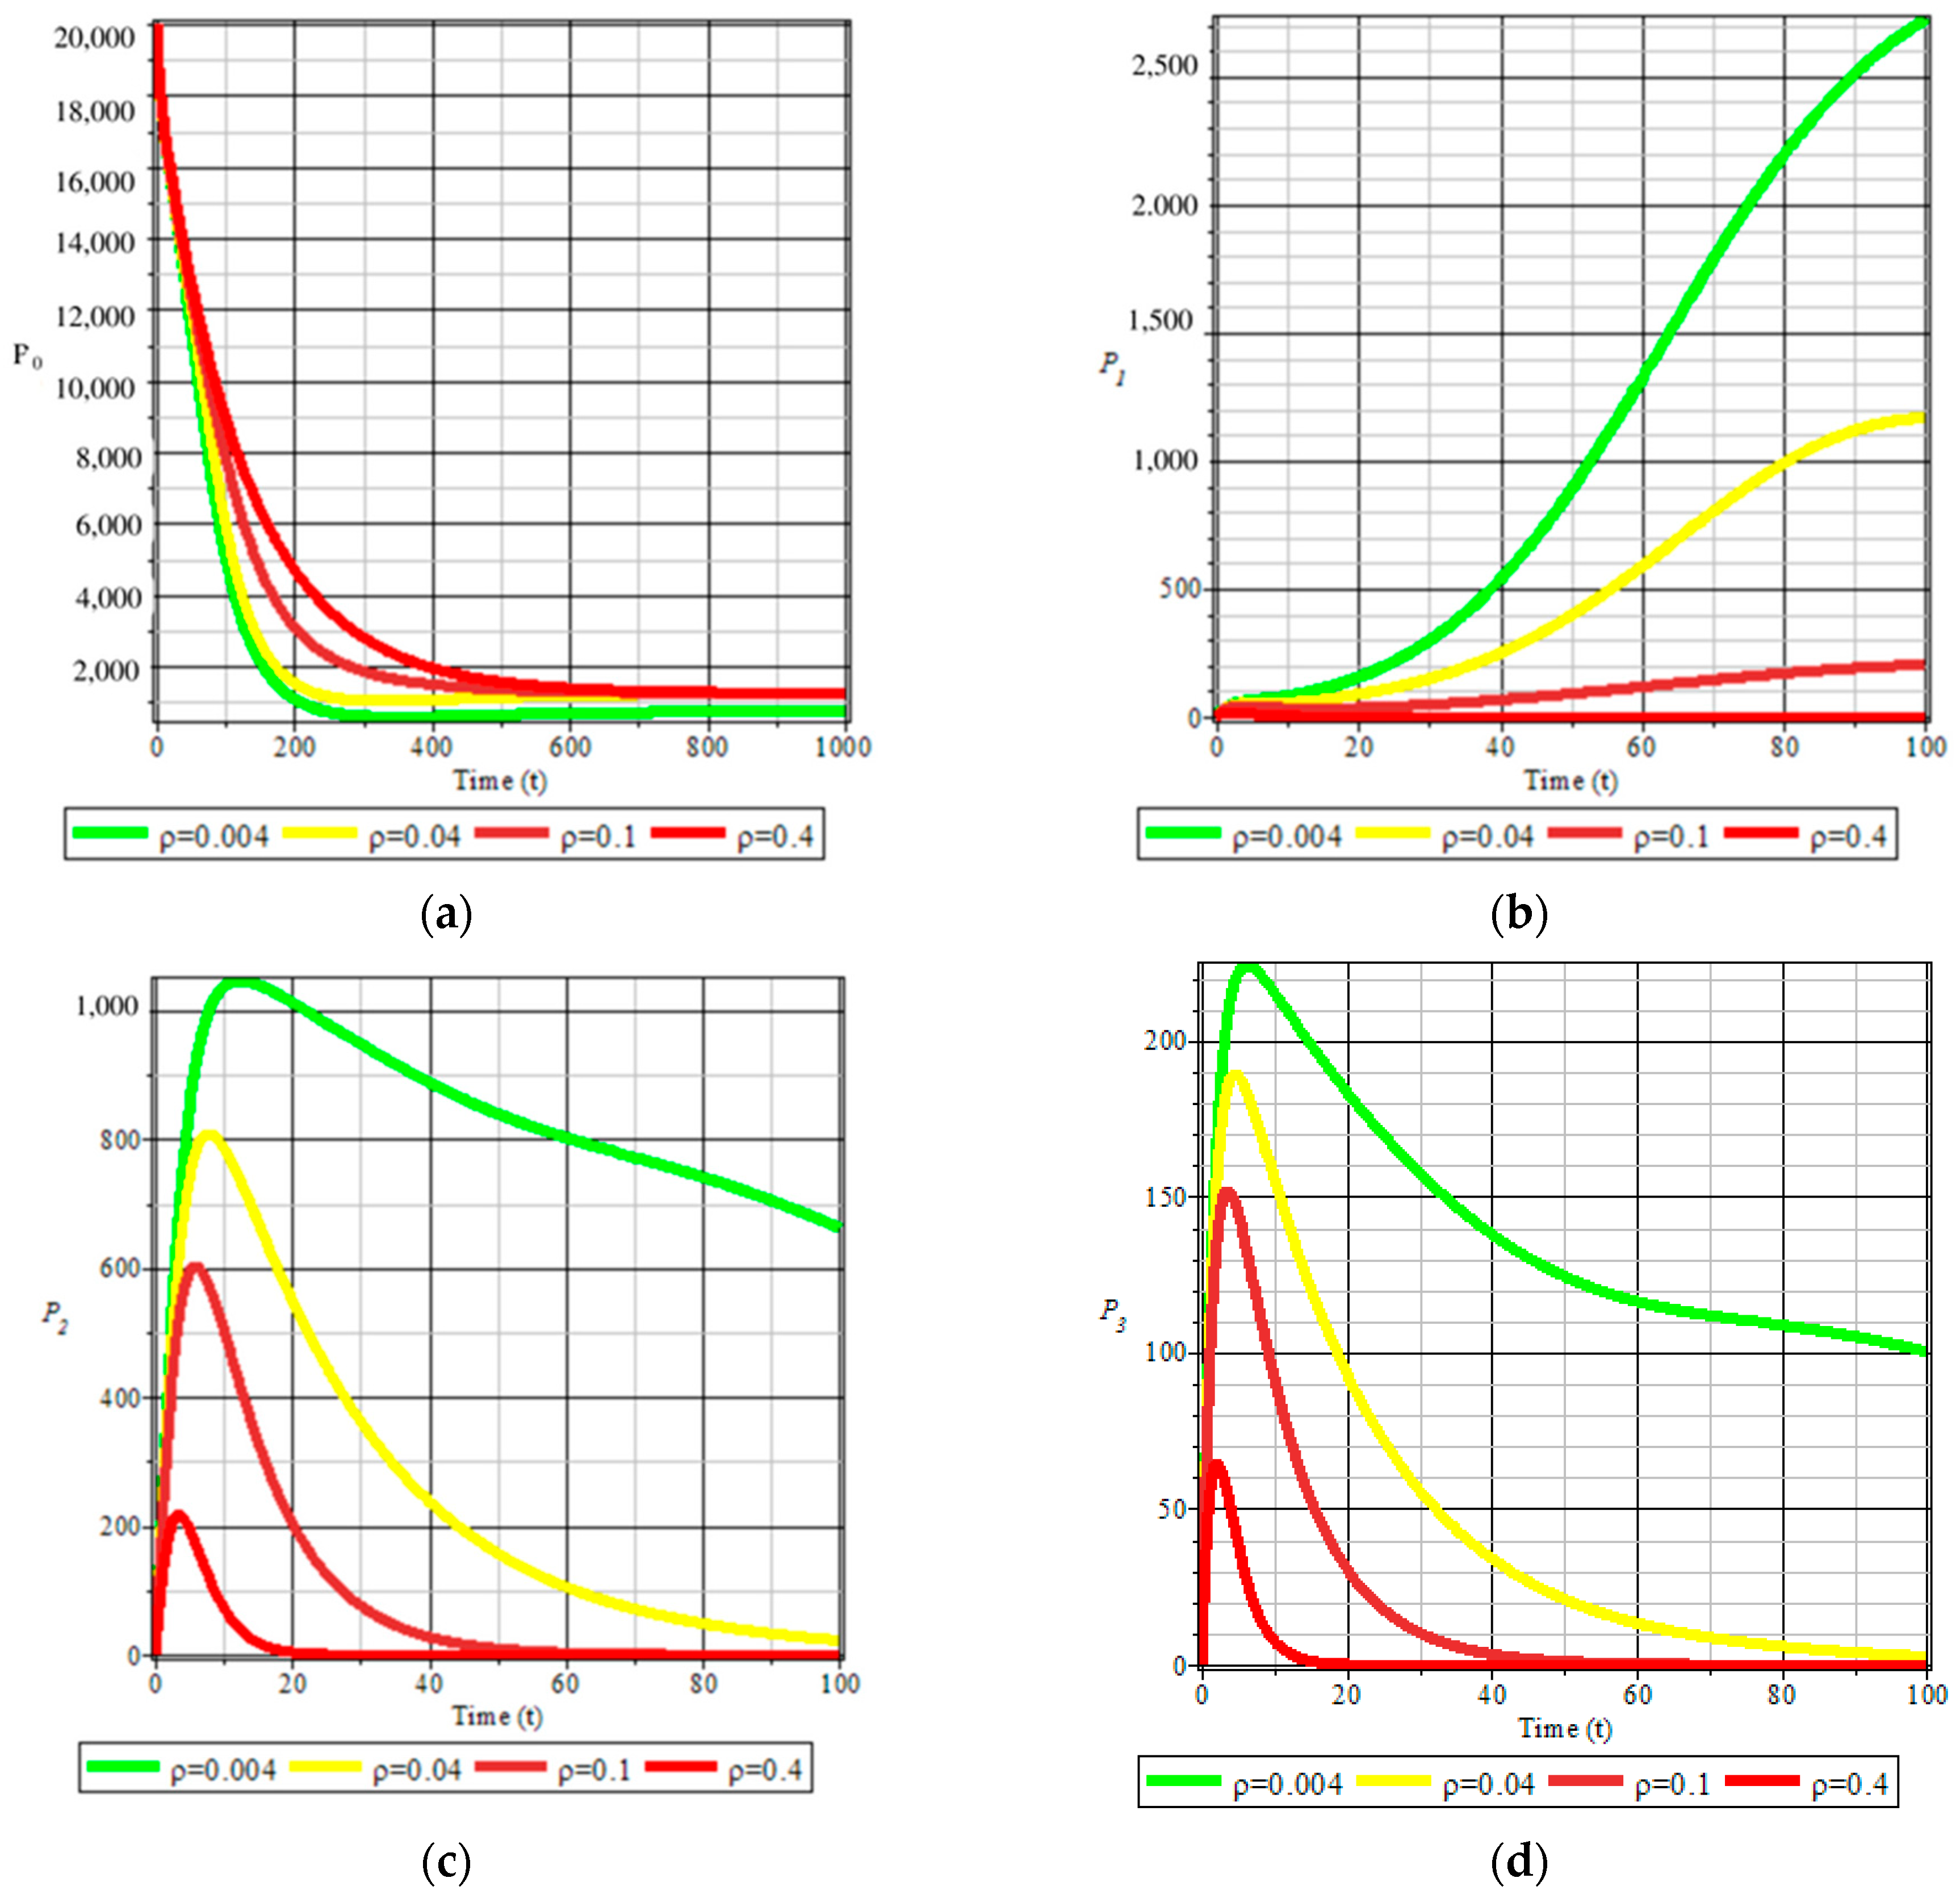
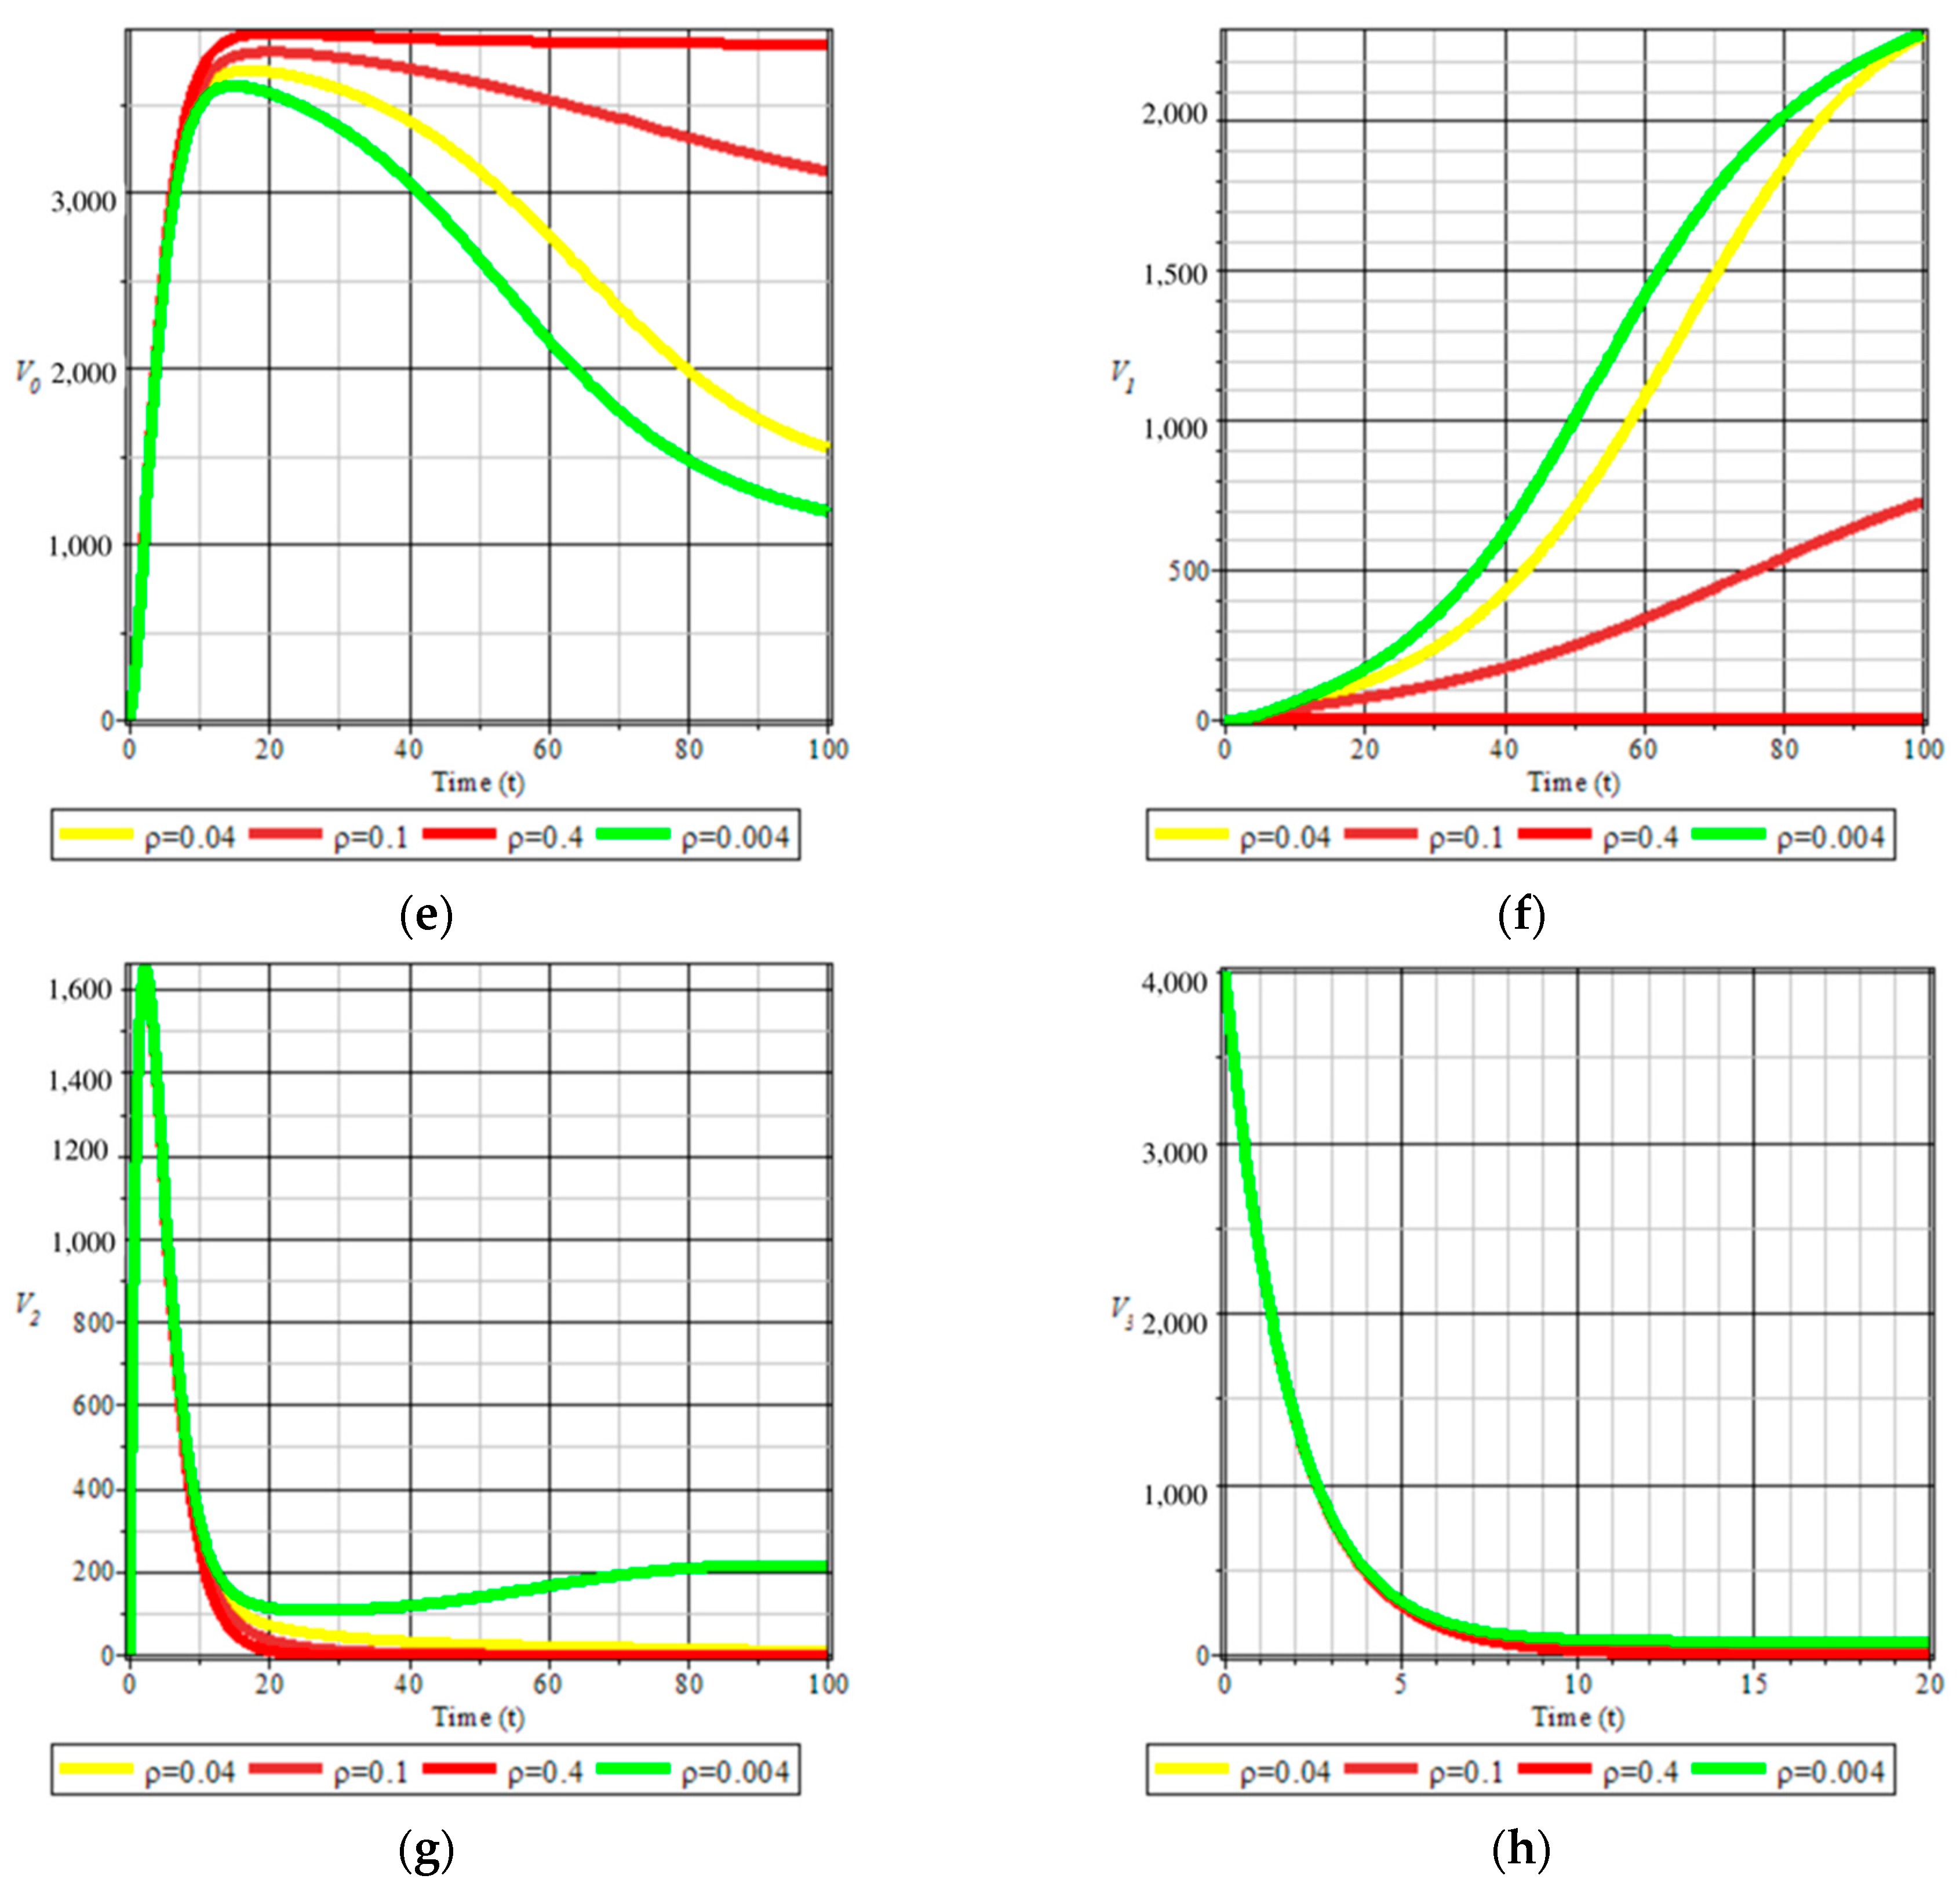
A numerical sensitivity analysis was conducted by presenting a graph where one of the parameters was changed. In this case, the value of the parameter ρ is changing, as seen in Figure 4a through 4h, while the values of the parameters and other variables are taken from Table 2.
Figure 4a,b show that the more roguing we do, the faster the spread of tungro virus disease in rice plants can be controlled. This can be seen from the populations of infected plants and green leafhoppers (both affected by RTSV, RTBV, and RTSV + RTBV), which have decreased rapidly and led to disease extinction.

5. Optimal Control

5.1. Optimal Control Model

The aim of developing an optimal control model in this study was to minimize the population of rice plants affected by RTSV, RTBV, and RTSV + RTBV. Roguing is performed to minimize the potential for the spread of tungro disease. The objective function used is as in Equation (11).
J u = min t 0 t 1 A 1 P 1 t + A 2 P 2 t + A 3 P 3 t + C u 2 t d t
With the constraint function as in Equations (12)–(19).
d P 0 d t = r K N P α P 0 V 3 N P γ P 0 V 3 N P τ P 0 V 3 N P β P 0 V 1 N P σ P 0 V 2 N P q 0 P 0
d P 1 d t = β 1 ρ P 0 V 1 N P + γ 1 ρ P 0 V 3 N P λ 1 u 1 ρ P 1 V 3 N P q 1 1 ρ P 1 ρ P 1
d P 2 d t = τ 1 ρ P 0 V 3 N P + σ 1 ρ P 0 V 2 N P δ 1 ρ P 2 V 3 N P q 2 1 ρ P 2 ρ P 2
d P 3 d t = α 1 ρ P 0 V 3 N P + λ 1 u 1 ρ P 1 V 3 N P + δ 1 ρ P 2 V 3 N P q 3 1 ρ P 3 ρ P 3
d V 0 d t = B N V 1 N V V u a P 3 V 0 N P b P 1 V 0 N P + f V 2 μ V 0
d V 1 d t = b P 1 V 0 N P g P 2 V 1 N P μ V 1
d V 2 d t = c V 3 f V 2 μ V 2
d V 3 d t = u a P 3 V 0 N P + g P 2 V 1 N P c V 3 μ V 3
With boundary conditions:
t 0 < t < t 1 , 0 u t 1 , P 0 0 0 , P 1 0 0 , P 2 0 0 , P 3 0 0 , V 0 0 0 , V 1 0 0 , V 2 0 0 , V 3 0 0 .
The optimal control theory method was used to solve the optimal control model with the principle used, namely the Pontryagin minimum principle, where u is the level of roguing. The quadratic objective function was used to measure control costs, which assume that, in reality, there is no linear relationship between the impact of the intervention and the intervention costs of the infected population (the inversion forms a non-linear function) [39].
From the objective function and constraints in Equations (11)–(19), the Hamiltonian function was obtained as in Equation (20) [40].
H = A 1 P 1 + A 2 P 3 + A 3 P 3 +   C u 2 + λ 1 d P 0 d t + λ 2 d P 1 d t + λ 3 d P 2 d t +   λ 4 d P 3 d t + λ 5 d V 0 d t + λ 6 d V 1 d t + λ 7 d V 2 d t + λ 8 d V 3 d t
with λ i where i = 1 , ,   8 , are co-state variables, then the Hamiltonian function must fulfill:
x ^ t = P 0 ˙ P 1 ˙ P 2 ˙ P 3 ˙ V 0 ˙ V 1 ˙ V 2 ˙ V 3 ˙ , λ ^ t = λ 1 ˙ λ 2 ˙ λ 3 ˙ λ 4 ˙ λ 5 ˙ λ 6 ˙ λ 7 ˙ λ 8 ˙ ,   and   stationary   conditions .
Necessary conditions:
P 0 t t = H λ 1 = r K N P α P 0 V 3 N P γ P 0 V 3 N P τ P 0 V 3 N P β P 0 V 1 N P σ P 0 V 2 N P q 0 P 0 P 1 t t = H λ 2 = β 1 ρ P 0 V 1 N P + γ 1 ρ P 0 V 3 N P λ 1 u 1 ρ P 1 V 3 N P q 1 1 ρ P 1 ρ P 1 P 2 t t = H λ 3 = τ 1 ρ P 0 V 3 N P + σ 1 ρ P 0 V 2 N P δ 1 ρ P 2 V 3 N P q 2 1 ρ P 2 ρ P 2 P 3 t t = H λ 4 = α 1 ρ P 0 V 3 N P + λ 1 u 1 ρ P 1 V 3 N P + δ 1 ρ P 2 V 3 N P q 3 1 ρ P 3 ρ P 3 V 0 t t = H λ 5 = B N V 1 N V V ρ a P 3 V 0 N P b P 1 V 0 N P + f V 2 μ V 0 V 1 t t = H λ 6 = b P 1 V 0 N P g P 2 V 1 N P μ V 1 V 2 t t = H λ 7 = c V 3 f V 2 μ V 2 V 3 t t = H λ 8 = u a P 3 V 0 N P + g P 2 V 1 N P c V 3 μ V 3
Co-state
λ 1 ˙ = H P 0 = λ 1 α V 3 N P γ V 3 N P τ V 3 N P β V 1 N P σ V 2 N P q 0 λ 2 ( β 1 ρ V 1 N P + γ 1 ρ V 3 N P ) λ 3 τ 1 ρ V 3 N P + σ 1 ρ V 2 N P λ 4 α 1 ρ V 3 N P
λ 2 ˙ = H P 1 = A 1 λ 2 ( 1 u λ 1 ρ V 3 N P q 1 1 ρ ρ ) λ 4 1 u λ 1 ρ V 3 N P + λ 5 b V 0 N P λ 6 b V 0 N P
λ 3 ˙ = H P 2 = λ 3 ( δ 1 ρ V 3 N P q 2 1 ρ ρ ) λ 4 δ 1 ρ V 3 / N P + λ 6 g V 1 / N P λ 8 g V 1 N P
λ 4 ˙ = H P 3 = A 2 λ 4 q 3 1 ρ ρ + λ 5 u a V 0 N P λ 8 u a V 0 N P
λ 5 ˙ = H V 0 = λ 5 u a P 3 N P b P 1 N P μ λ 6 b P 1 N P λ 8 u a P 3 N P
λ 6 ˙ = H V 1 = λ 1 β P 0 N P λ 2 β 1 ρ P 0 N P λ 6 g P 2 N P μ λ 8 g P 2 N P
λ 7 ˙ = H V 2 = A 3 + λ 1 σ P 0 N P λ 3 σ 1 ρ P 0 N P λ 5 f λ 7 f μ
λ 8 ˙ = H V 3 = A 4 λ 1 α P 0 N P γ P 0 N P τ P 0 N P λ 2 γ 1 ρ P 0 N P 1 u λ 1 ρ P 1 N P λ 3 τ 1 ρ P 0 N P δ 1 ρ P 2 N P λ 4 ( α 1 ρ P 0 N P + 1 u λ 1 ρ P 1 N P + δ 1 ρ P 2 N P ) λ 7 c λ 8 c μ
Stationary condition
u * = V 3 P 1 1 + ρ λ 2 λ 4 λ + P 3 V 0 a λ 5 λ 8 2 N P C
since 0 u 1 , so:
u 1 * = max m i n V 3 P 1 1 + ρ λ 2 λ 4 λ + P 3 V 0 a λ 5 λ 8 2 N P C   , 1 , 0

5.2. Numerical Simulation

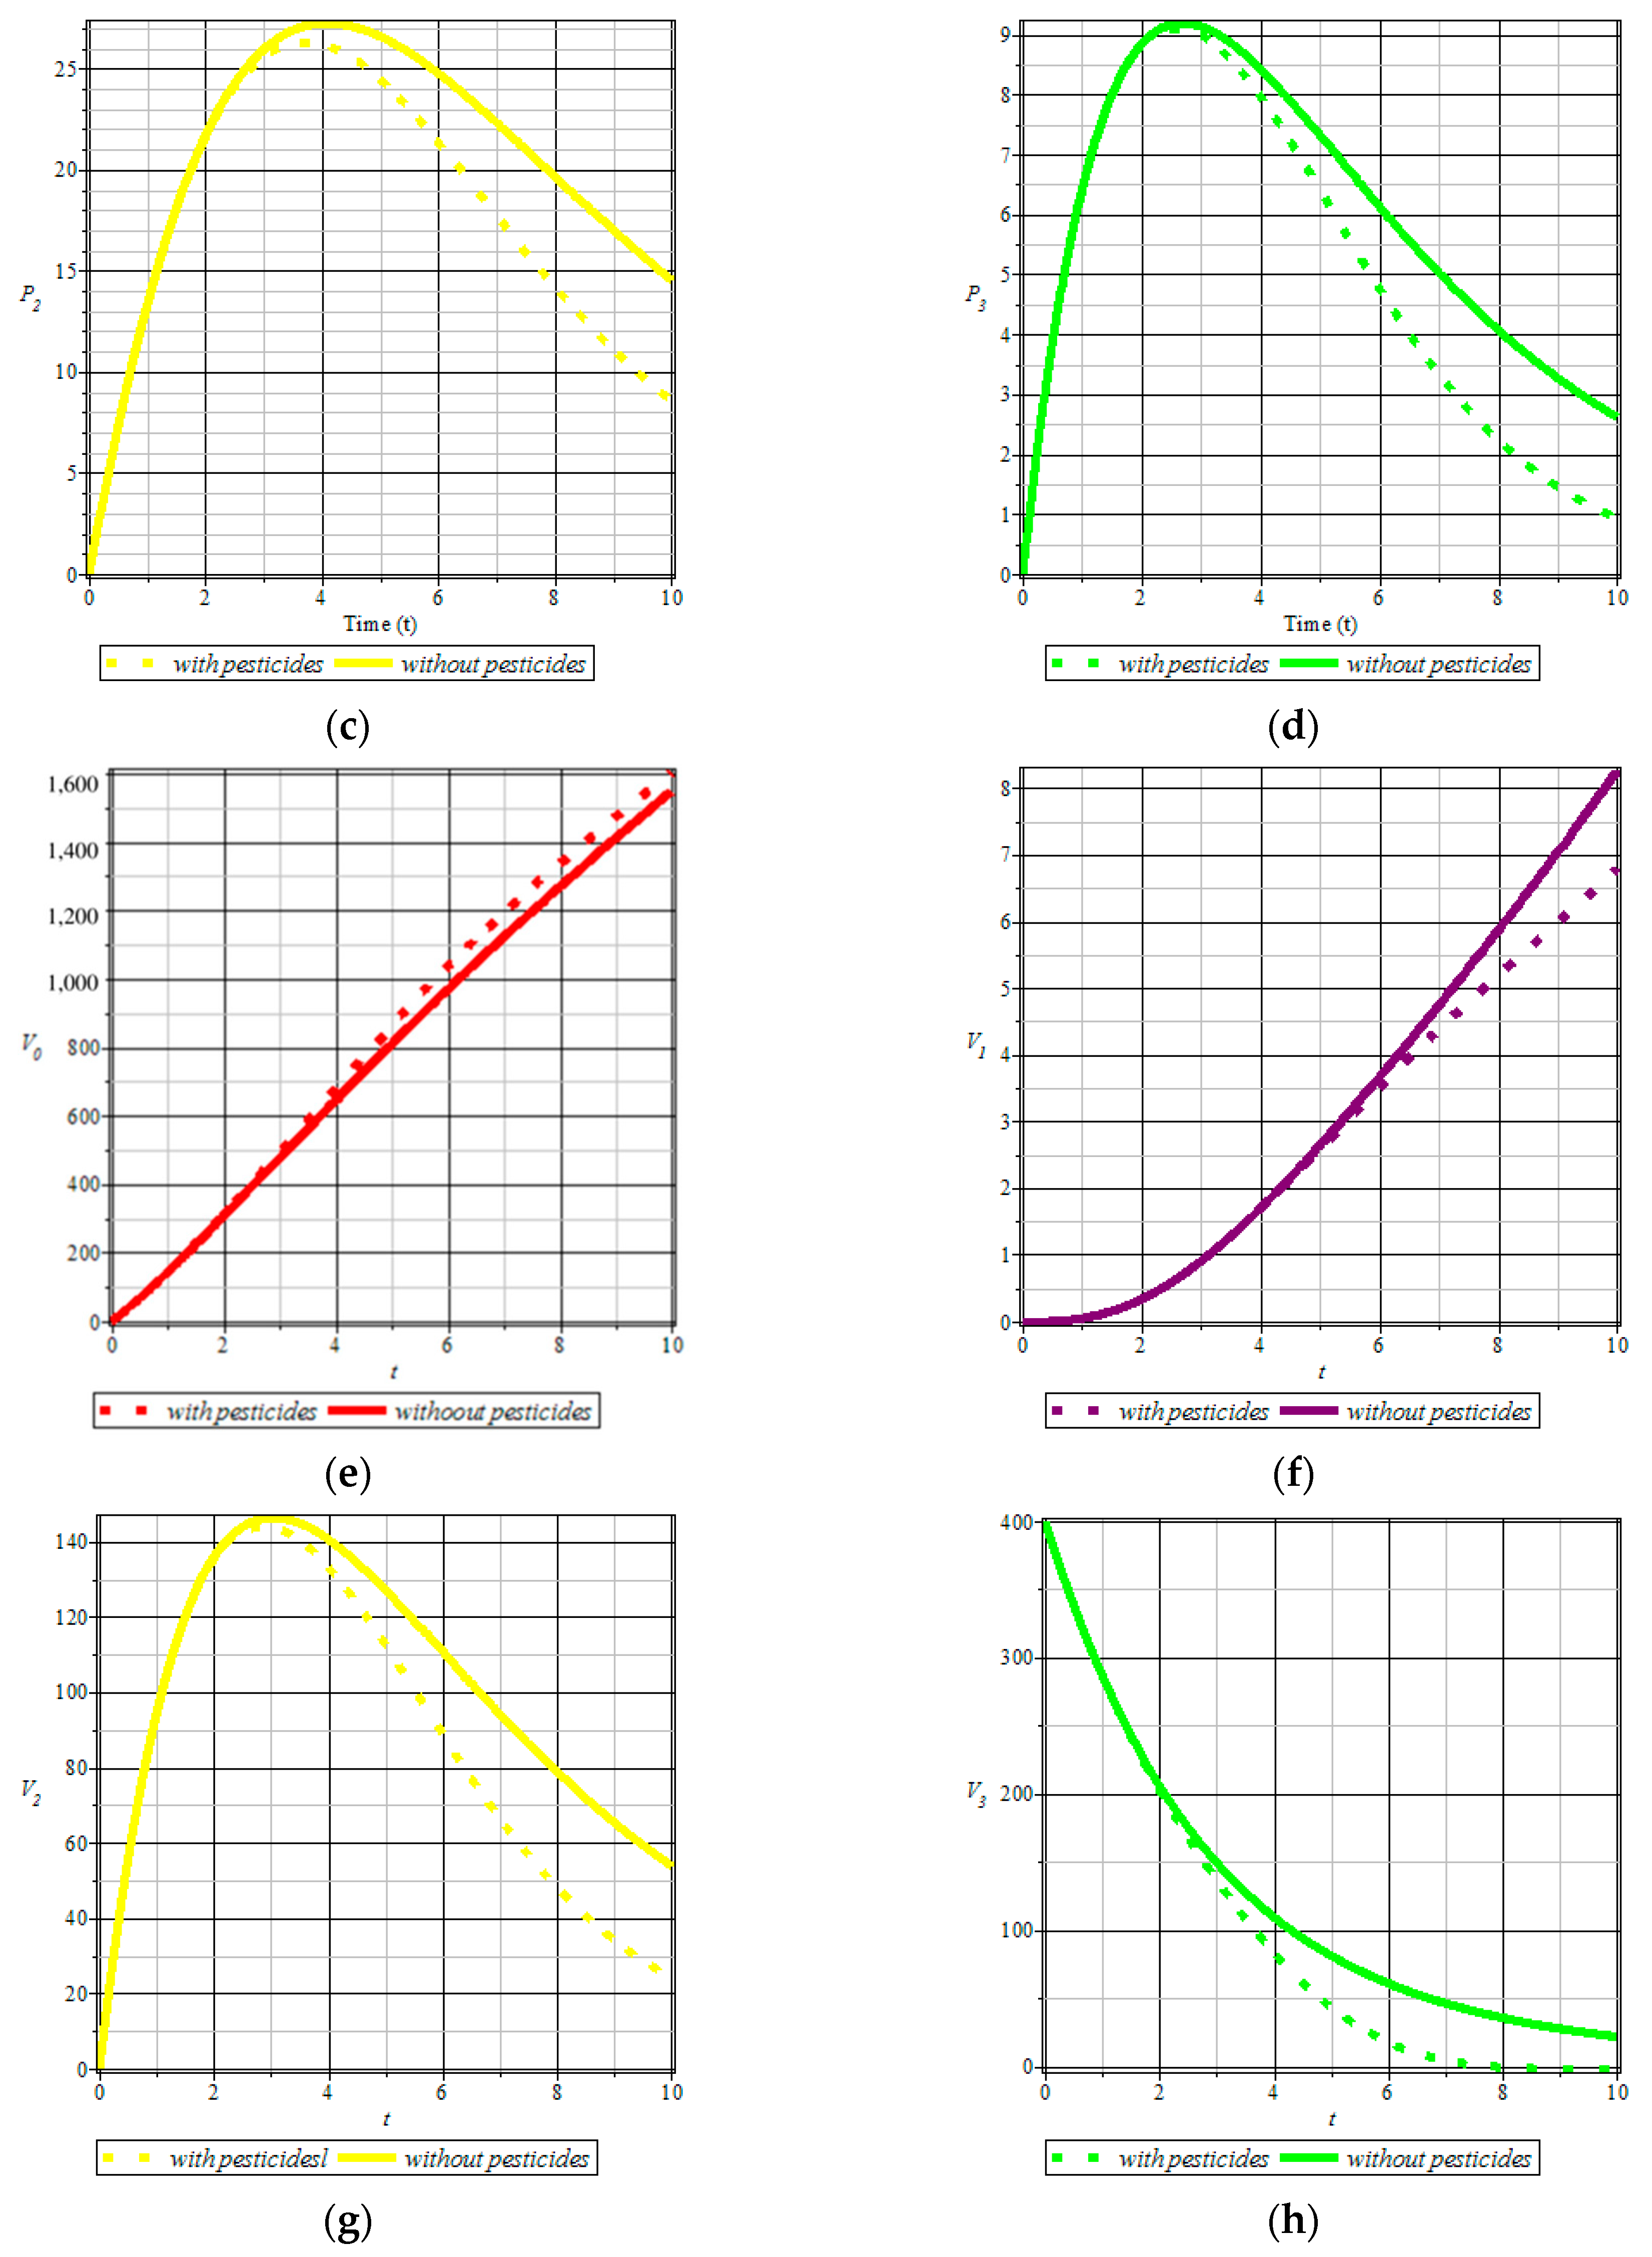
From Figure 5a–h, it can be seen that roguing and the use of pesticides can reduce the rate of spread of the tungro virus in rice plants. This can be seen from the graphs for each population of rice plants and green leafhoppers infected with RTSV, RTBV, and RTSV + RTBV, which are controlled using roguing and are consistently below the graph without using pesticide control. All infected populations of both rice plants and green leafhoppers have decreased. This indicates that the spread of tungro virus disease in rice plants can be controlled using pesticides and roguing. Control using pesticides and roguing is faster than roguing alone. While the population of green leafhoppers infected with RTSV is still increasing, this is not a problem because green leafhoppers cannot spread the RTSV virus without RTBV (see Figure 5f).
In contrast to the infected population, the susceptible population of rice plants and green leafhoppers increased. This happened because the spread was controlled (see Figure 5a,e.
Then from Figure 6, it can be seen that the use of pesticides was sufficient until the tenth day when the highest dose was 75% of the usual dose, because control is not only assisted by pesticide treatment but also assisted by roguing to minimize the use of pesticides and reduce costs that farmers incur.

6. Conclusions

The spread of tungro virus disease in rice plants by taking into account the differences in the transmitted virus’s characteristics can be divided into eight compartments, namely four compartments of rice plants and four compartments of green leafhoppers, which are denoted by P i and V i , respectively. Index i = 0 , . . , 3 , respectively, indicates a population susceptible to infection with RTSV, RTBV, and RTSV + RTBV. The numerical analysis and simulation results show that the nonendemic equilibrium point will be stable if R 0 < 1 , while the endemic equilibrium point will be stable if R 0 > 1 . This can be seen from the population dynamics graph when R 0 < 1 , the infected plant population does not exist, and the infected green leafhopper population continues to decline until it finally becomes extinct. This shows that there is no endemic infection when R 0 < 1 . Whereas when R 0 > 1 , there are still infections with RTSV + RTBV in both the rice plant population and the green leafhopper population, indicating an endemic presence. In addition, sensitivity analysis and optimal control results show that pesticides and roguing treatments can control the spread of tungro virus disease in rice plants more quickly, with the application of 75% pesticides than usual to reduce farmers' costs.

Author Contributions

Conceptualization, R.A. and N.I.; methodology, R.A.; software, R.A.; validation, N.A. and A.K.S. formal analysis, R.A.; investigation, N.I.; data curation, N.I.; writing—original draft preparation, R.A.; writing—review and editing, N.A.; visualization, A.K.S.; supervision, A.K.S.; project administration, N.A.; funding acquisition, N.A. All authors have read and agreed to the published version of the manuscript.

Funding

This research is funded by Universitas Padjadjaran.

Institutional Review Board Statement

Not applicable.

Informed Consent Statement

Not applicable.

Data Availability Statement

Not applicable.

Acknowledgments

The authors would like to thank the Ministry of Education, Culture, Research, and Technology through the PDUPT 2022 with contract number 2064/UN6.3.1/PT.00/2022.

Conflicts of Interest

The authors declare no conflict of interest.

Appendix A

p λ = a 0 λ 4 + a 1 λ 3 + a 2 λ 2 + a 3 λ + a 4
With:
a 0 = N P 4 V 2 μ 2 q 0 2 > 0
a 1 = μ 2 q 0 2 N P 4 q 1 + q 3 1 ρ + 2 μ + ρ + c V 2 > 0 ; 0 ρ 1
a 2 = V μ q 0 N P 2 ( V μ q 0 N P 2 c q 3 + μ q 3 1 ρ + c + μ ρ q 0 q 1 1 ρ ρ + 1 + B N V r K N P 1 ρ a α + b β N V V ) > 0
a 3 = ( V N P 2 μ q 0 B N V r N V V 1 ρ ( K N P ) ( ( b β q 3 ρ 1 μ + ρ + c ) +   a α q 1 ( ρ 1 ρ + μ   ) ) +   N P 2 μ q 0 V ( c + 2 μ q 3 1 q 1 1 ρ 2 +   ( q 1 q 3 + 2 μ 2 + ( 4 q 3 c + 2 q 1 + c + 2 q 3 + 2 c ) μ c 2 q 3 1 q 1 q 3 ) ρ + q 1 + q 3 μ 2 + 2 q 3 + c q 1 + q 3 c μ + q 1 q 3 c ) ) > 0
a 4 = ( V μ q 0 ( ( c q 3 +   μ q 3 ) 1 ρ + c + μ ρ ) N P 2 ) V q 0 q 1 1 ρ ρ μ 2 N P 2 ( 1   R 01 2 ) 1 R 02 2 > 0  

References

  1. Bárcena, A.; Cimoli, M.; García-Buchaca, R.; Yáñez, L.F. The 2030 Agenda and the Sustainable Development Goals an Opportunity for Latin America and the Caribbean; United Nations Publication: Santiago, CA, USA, 2018. [Google Scholar]
  2. Jones, P.; Wynn, M.; Hillier, D.; Comfort, D. The Sustainable Development Goals and Information and Communication Technologies. Indones. J. Sustain. Account. Manag. 2017, 1, 1–15. [Google Scholar] [CrossRef]
  3. BBPOPT. Prakiraan Serangan OPT Padi Jagung Kedelai MT; Direktorat Jendral Tanaman Pangan: Jatisari, Indonesia, 2020. [Google Scholar]
  4. Umagapi, J.L. Identifying Factors to Solve Hunger: Reflecting on the Experience in Indonesia. J. Agric. Sci. Food Res. 2018, 9, 1–4. [Google Scholar]
  5. Suryadi, R.; Anindita, B.; Setiawan, S. Impact of The Rising Rice Prices on Indonesian Economy. J. Econ. Sustain. Dev. 2014, 5, 71–79. [Google Scholar]
  6. Rahmadanih, S.; Bulkis, M.; Arsyad, A.; Amrullah; Viantika, N.M. Role of farmer group institutions in increasing farm production and household food security. IOP Conf. Ser. Earth Environ. Sci. 2018, 157, 012062. [Google Scholar] [CrossRef]
  7. Merang, O.P.; Lahjie, A.M.; Yusuf, S.; Ruslim, Y. Productivity of three varieties of local upland rice on swidden agriculture field in Setulang village, North Kalimantan, Indonesia. Biodiversitas 2020, 1, 49–56. [Google Scholar]
  8. Sutardi. The Transformation of Rice Crop Technology in Indonesia: Innovation and Sustainable Food Security. Agronomy 2023, 13, 1. [Google Scholar] [CrossRef]
  9. Andika, Y.A. Determinants of Production of Agricultural Commodities of Food Crops in Bojonegoro Regency (Case Study of Farmers Accessing Tani Card and Non-Accessing Tani Card). East Java Econ. J. 2021, 5, 58–74. [Google Scholar] [CrossRef]
  10. Aqiel, M.; Maimun; Aman, F.; Ardy, S. Growth, Yield and Analysis of Rice (Oryza Sativa) Farming Due to the Application of PT.PIM Commercial Fertilizer. In Proceedings of the 2nd International Conference on Social Science, Political Science, and Humanities (ICoSPOLHUM 2021), Lhokseumawe, Indonesia, 26–27 November 2021. [Google Scholar]
  11. Soelaiman, V.; Ernawati, A. Pertumbuhan dan Perkembangan Cabai Keriting (Capsicum annuum L.) secara In Vitro pada beberapa Konsentrasi BAP dan IAA. Bul. Agrohorti 2013, 1, 62–66. [Google Scholar] [CrossRef] [Green Version]
  12. Sebayang, L. Teknik Pengendalian Penyakit Kuning pada Tanaman Cabai; BPTP: Sumatra Utara, Indonesia, 2013. [Google Scholar]
  13. Agrios, G.N. Plant Pathology, 5th ed.; Elsivier Academic Press: Gainesville, FL, USA, 2004. [Google Scholar]
  14. Kannan, M.; Saad, M.M.; Talip, N.; Baharum, S.N.; Bunawan, H. Complete Genome Sequence of Rice Tungro Bacilliform Virus Infecting Asian Rice (Oryza sativa) in Malaysia. Am. Soc. Microbiol. 2019, 8, 1–3. [Google Scholar] [CrossRef] [PubMed] [Green Version]
  15. Budot, B.O. Suppression of cell wall-related genes associated with stunting of Oryza glaberrima infected with Rice tungro spherical virus. Front. Microbiol. 2014, 5, 1–9. [Google Scholar] [CrossRef]
  16. Bunawan, H.; Dusik, L.; Bunawan, S.N.; Amin, N.M. Rice Tungro Disease: From Identification to Disease Control. World Appl. Sci. J. 2014, 31, 1221–1226. [Google Scholar]
  17. Azzam, O.; Chancellor, T.C.B. The Biology, Epidemiology, and Management of Rice Tungro Disease in Asia. Plant Dis. 2002, 86, 88–100. [Google Scholar] [CrossRef] [PubMed] [Green Version]
  18. Azzam, O.; Cabunagan, R.C.; Chancellor, T. Methods for Evaluating Resistance to Rice Tungro Disease; International Rice Research Institute (IRRI): Manila, Philippines, 2000. [Google Scholar]
  19. Shim, J.; Torollo, G.; Angeles-Shim, R.B.; Cabunagan, R.C.; Choi, I.-R.; Yeo, U.-S.; Ha, W.-G. Rice tungro spherical virus resistance into photoperiod-insensitive japonica rice by marker-assisted selection. Breed. Sci. 2015, 65, 345–351. [Google Scholar] [CrossRef] [PubMed] [Green Version]
  20. Bigirimana, V.d.P.; Hua, G.K.H.; Nyamangyoku, O.I.; Höfte, M. Rice Sheath Rot: An Emerging Ubiquitous Destructive Disease Complex. Front. Plant Sci. 2015, 6, 1–16. [Google Scholar] [CrossRef] [PubMed] [Green Version]
  21. Meilin, A. Hama dan Penyakit Pada Tanaman Cabai Serta Pengendaliannya; Balai Pengkajian Teknologi Pertanian: Jambi, Indonesia, 2014. [Google Scholar]
  22. Blas, N.T.; Addawe, J.M.; David, G. A Mathematical Model of Transmission of Rice Tungro Disease by Nephotettix Virescens. Am. Inst. Phys. 2016, 1787, 080015. [Google Scholar]
  23. Blas, N.; David, G. Dynamical roguing model for controlling the spread of tungro virus via Nephotettix Virescens in a rice field. J. Phys. Conf. Ser. 2017, 893, 1–5. [Google Scholar] [CrossRef]
  24. Anggriani, N.; Yusuf, M.; Supriatna, A.K. The Effect of Insecticide on the Vector of Rice Tungro Disease: Insight from a Mathematical Model. Int. Interdiscip. J. 2017, 20, 6197–6206. [Google Scholar]
  25. Suryaningrat, W.; Anggriani, N.; Supriatna, A.K.; Istifadah, N. The Optimal Control of Rice Tungro Disease with Insecticide and Biological Agent. AIP Conf. Proc. 2020, 2264, 040002. [Google Scholar]
  26. Suryaningrat, W.; Anggriani, N.; Supriatna, A.K. Mathematical analysis and numerical simulation of spatial-temporal model for rice tungro disease spread. Commun. Math. Biol. Neurosci. 2022, 2022, 44. [Google Scholar]
  27. Maryati, A.; Anggriani, N.; Carnia, E. Stability Analysis of Tungro Disease Spread Model in Rice Plant Using Matrix Metho. Barekeng 2022, 16, 217–228. [Google Scholar] [CrossRef]
  28. Bokil, V.A.; Allen, L.J.S.; Jeger, M.J.; Lenhart, S. Optimal control of a vectored plant disease model for a crop with continuous replanting. J. Biol. Dyn. 2019, 13, 325–353. [Google Scholar] [CrossRef]
  29. Bi, K.; Chen, Y.; Wu, C.; Ben-Arieh, D. A memetic algorithm for solving optimal control problems of Zika virus epidemic with equilibriums and backward bifurcation analysis. Commun. Nonlinear Sci. Numer. Simul. 2020, 84, 105176. [Google Scholar] [CrossRef]
  30. Bi, K.; Chen, Y.; Zhao, S.; Ben-Arieh, D.; Wu, C. A new zoonotic visceral leishmaniasis dynamic transmission model with age-structure. Chaos Solitons Fractals 2020, 133, 109622. [Google Scholar] [CrossRef]
  31. Bi, K.; Chen, Y.; Wu, C.; Ben-Arieh, D. Learning-based impulse control with event-triggered conditions for an epidemic dynamic system. Commun. Nonlinear Sci. Numer. Simul. 2021, 108, 106204. [Google Scholar] [CrossRef]
  32. Zhao, S.; Kuang, Y.; Wu, C.; Ben-Arieh, D.; Ramalho-Ortigao, M.; Bi, K. Zoonotic visceral leishmaniasis transmission: Modeling, backward bifurcation, and optimal control. J. Math. Biol. 2016, 73, 1525–1560. [Google Scholar] [CrossRef] [PubMed]
  33. Onah, I.S.; Aniaku, S.E.; Ezugorie, O.M. Analysis and optimal control measures of diseases in cassava population. Optim. Control Appl. Meth. 2022, 43, 1450–1478. [Google Scholar] [CrossRef]
  34. Hugo, A.; Lusekelo, E.M.; Kitengeso, R. Optimal Control and Cost Effectiveness Analysis of Tomato Yellow Leaf Curl Virus Disease Epidemic Model. Appl. Math. 2019, 9, 82–88. [Google Scholar]
  35. Matofali, A.X. Modelling and Optimal Control of Insect Transmitted Plant Disease. J. Math. Appl. 2020, 8, 1. [Google Scholar]
  36. Liao, Z.; Gao, S.; Yan, S.; Zhou, G. Transmission dynamics and optimal control of a Huanglongbing model with time delay. Math. Biosci. Eng. 2021, 18, 4162–4192. [Google Scholar] [CrossRef]
  37. Amelia, R.; Anggriani, N.; Supriatna, A.K.; Istifadah, N. Mathematical Model for Analyzing the Dynamics of Tungro Virus Disease in Rice: A Systematic Literature Review. Mathematics 2022, 10, 2944. [Google Scholar] [CrossRef]
  38. van den Driessche, P.; Watmough, J. Reproduction numbers and sub-threshold endemic equilibria for compartmental models of disease transmission. Math. Biosci. 2002, 180, 29–48. [Google Scholar] [CrossRef] [PubMed]
  39. Agusto, F.; Khan, M. Optimal Control Strategies for Dengue Transmission in Pakistan. Math. Biosci. 2018, 305, 102–121. [Google Scholar] [CrossRef] [PubMed]
  40. Lenhart, S.; Workman, J.T. Optimal Control Applied to Biological Models; CRC Press: Boca Raton, FL, USA, 2007. [Google Scholar]
Figure 1. The relationship between the seven reference papers.
Mathematics 11 01151 g001
Figure 2. Population dynamics when . R 0 < 1 : (a) rice plant; (b) green leafhopper.
Mathematics 11 01151 g002
Figure 3. Population dynamics when R 0 > 1 : (a) rice plant; (b) green leafhopper.
Mathematics 11 01151 g003
Figure 4. The population when roguing parameters varied (different ρ ): (a) susceptible rice plants; (b) RTSV-infected rice plants; (c) RTBV-infected rice plants; (d) RTSV + RTBV-infected rice plants; (e) susceptible green leafhopper; (f) RTSV-infected green leafhopper; (g) RTBV-infected green leafhopper; (h) RTSV + RTBV-infected green leafhopper.
Mathematics 11 01151 g004aMathematics 11 01151 g004b
Figure 5. The population with and without pesticides: (a) susceptible rice plant; (b) RTSV-infected rice plants; (c) RTBV-infected rice plants; (d) RTSV + RTBV-infected rice plants; (e) susceptible green leafhopper; (f) RTSV-infected green leafhopper; (g) RTBV-infected green leafhopper; (h) RTSV + RTBV-infected green leafhopper.
Mathematics 11 01151 g005aMathematics 11 01151 g005b
Figure 6. Pesticides.
Mathematics 11 01151 g006
Table 1. Description of parameters and variables.
Variable/
Parameter
Description
V 0 Susceptible green leafhoppers
V 1 Green leafhopper infected with RTSV
V 2 Green leafhopper infected with RTBV
V 3 Green leafhopper infected with RTSV + RTBV
P 0 Susceptible rice plants
P 1 RTSV-Infected Rice Plants
P 2 RTBV-Infected Rice Plants
P 3 RTSV + RTBV-Infected Rice Plants
α Transmission rate of RTSV + RTBV by green leafhoppers infected with RTSV + RTBV in susceptible rice plants
β RTSV transmission rate by green leafhoppers infected with RTSV in susceptible rice plants
γ Transmission rate of RTSV by green leafhoppers infected with RTSV + RTBV in susceptible rice plants
σ Transmission rate of RTBV by green leafhoppers infected with RTBV in susceptible rice plants
τ Transmission rate of RTBV by green leafhoppers infected with RTSV + RTBV in susceptible rice plants
λ Transmission rate of RTSV + RTBV by green leafhoppers infected with RTSV + RTBV on rice plants infected with RTSV + RTBV
δ Transmission rate of RTSV + RTBV by green leafhoppers infected with RTSV + RTBV on RTBV-infected rice plants
a The acquisition rate of RTSV + RTBV-infected rice plants by susceptible vectors to RTSV + RTBV-infected green leafhoppers.
b The acquisition rate of RTSV-infected rice plants by susceptible vectors to RTSV-infected green leafhoppers.
g The rate of acquisition of RTBV-infected rice plants by RTSV-infected green leafhoppers to RTSV + RTBV-infected green leafhoppers
ρ Roguing effectiveness rate
Table 2. Parameter and initial values.
Initial Value/
Parameter
ValueUnitCitationInitial Value/
Parameter
ValueUnitCitation
V 0 0Vector[23] a 0.996 P l a n t V e c t o r   ×   d a y [22]
V 1 0Vector[23] b 0.996 P l a n t V e c t o r   ×   d a y [22]
V 2 0Vector[23] c 0.5 P l a n t V e c t o r   ×   d a y [22]
V 3 4,000Vector[23] f 0.33 P l a n t V e c t o r   ×   d a y [22]
P 0 20,000Plant[23] g 0.996 P l a n t V e c t o r   ×   d a y [22]
P 1 0Plant[23] q 0 0.008 1 d a y [22]
P 2 0Plant[23] q 1 0.009 1 d a y [22]
P 3 0Plant[23] q 2 0.0125 1 d a y [22]
α 0.035 P l a n t V e c t o r   ×   d a y [22] q 3 0.0125 1 d a y [22]
β 0.09 P l a n t V e c t o r   ×   d a y [22] r 0.001 1 d a y [22]
γ 0.01 P l a n t V e c t o r   ×   d a y [22] B 0.033 1 d a y [22]
σ 0.08 P l a n t V e c t o r   ×   d a y [22] V 100,000Vector[22]
τ 0.06 P l a n t V e c t o r   ×   d a y [22] K 30,000PlantAssumption
δ 0.07 P l a n t V e c t o r   ×   d a y [22] λ 0.03 P l a n t V e c t o r   ×   d a y [22]
ρ 0.40 [22] μ 0.033 P l a n t V e c t o r   ×   d a y [22]
Disclaimer/Publisher’s Note: The statements, opinions and data contained in all publications are solely those of the individual author(s) and contributor(s) and not of MDPI and/or the editor(s). MDPI and/or the editor(s) disclaim responsibility for any injury to people or property resulting from any ideas, methods, instructions or products referred to in the content.