Abstract
The mutual influence between information and infectious diseases during the spreading process is becoming increasingly prominent. To elucidate the impact of factors such as higher-order interactions, interpersonal distances, and asymptomatic carriers on the coupled propagation of information and infectious diseases, a novel coupled spreading model is constructed based on a two-layer complex network, where one layer is a higher-order network and another layer is a weighted network. The higher-order interactions in information propagation are characterized using a 2-simplex, and a sUARU (simplicial unaware-aware-removed-unaware) model is employed to articulate information propagation. The inter-individual social distances in disease propagation are represented by the weights of a weighted network, and an SEIS (susceptible-exposed-infected-susceptible) model is utilized to describe disease propagation. The dynamic equations of coupled spreading are formulated utilizing the microscopic Markov chain approach. An analytical expression for the epidemic threshold is obtained by deriving it from the steady-state form of the dynamic equations. Comprehensive simulations are conducted to scrutinize the dynamic characteristics of the coupled spreading model. The findings indicate that enhancing the effects of higher-order interactions in information propagation and increasing inter-individual social distances both lead to higher outbreak thresholds and greater spreading of diseases. Additionally, a stronger infectivity among asymptomatic carriers and an extended incubation period are favorable for the outbreak and spread of an epidemic. These findings can provide meaningful guidance for the prevention and control of real-world epidemics.
MSC:
91D30
1. Introduction
Infectious diseases have profound repercussions on human society. The outbreak of epidemics not only directly jeopardizes human health and lives, but also leads to societal and economic instability [1,2]. For example, the COVID-19 pandemic, leading to infections numbering in the hundreds of millions, has inflicted substantial damage on both human health and the global economy [3,4,5]. Addressing an epidemic requires collective efforts from government agencies, healthcare institutions, research organizations, and the general public. Effective epidemic prevention and medical assistance strategies are essential tools for mitigating the widespread transmission of epidemics. However, the development of these effective measures requires a comprehensive understanding of the epidemiological dynamics of the disease. Therefore, the propagation dynamics of infectious diseases has garnered widespread attention among researchers. Many researchers have generated a wealth of valuable research findings through the use of mathematical models and computer simulations [6,7,8,9].
The emergence of complex networks has provided methodological support for the structured representation of group interactions based on contact relationships, offering a new perspective for the study of epidemiological dynamics. The integration of complex network theory with traditional infectious disease models has propelled further advancements in the study of propagation dynamics of infectious diseases [10]. A representative research study yielded results distinct from the previous research, indicating the absence of an outbreak threshold in propagation models based on scale-free networks when the network size approaches infinity [11]. This astonishing research finding has spurred numerous researchers to further investigate the dynamics of propagation based on complex networks. As research advances, many social factors have been taken into account in network propagation models. For instance, there has been significant research into how social elements like information dissemination, vaccination behavior, and resource allocation influence the patterns of infectious disease spread in recent years. Taking into consideration that there may be variations in the transmission pathways between social and biological transmission, researchers have gone on to construct multi-layered complex network models to explore the coupled dynamics of social and biological transmission [12,13,14,15,16,17,18]. For example, Granell et al. [19] were pioneers in coupling unaware-aware-unaware (UAU) information dissemination with susceptible-infected-susceptible (SIS) epidemic spread within a two-layer complex network. Mathematical analysis of their work revealed that the propagation of awareness could indeed inhibit outbreak occurrences. Li et al. [20] studied the phenomenon of epidemic thresholds in a time-varying multiplex network with individual layer preferences. They indicated that as the effective information dissemination rate increases and hierarchical preferences decrease, it helps to increase the epidemic threshold. Wang et al. [21] studied the impact of competitive dissemination of positive and negative information on the epidemic threshold, and pointed out that positive information is beneficial for suppressing disease outbreaks. Gao et al. [22] conducted in-depth research on the interplay between population flow patterns across subpopulations and the dissemination of individual awareness. Their findings show that densely populated public places are more likely to cause large-scale outbreaks of infectious diseases. Chen et al. [23] considered the influence of inter-layer mutual confirmation mechanism when studying the coupled transmission of information and infectious diseases. Their research shows that actively disclosing one’s infection and state of consciousness to those around them can effectively suppress the spread of the epidemic.
Most of the prior research in coupled spreading dynamics on complex networks has conventionally operated under the assumption that information or diseases can exclusively disseminate through direct contact relationships between two individuals [24,25,26,27,28,29]. However, beyond these individual direct contact relationships, the high-order interactions collectively generated by multiple individuals also exert a noteworthy influence on the transmission patterns and rates of information or infectious diseases. For example, the collective influence generated by multiple rumor spreaders can lead individuals to believe in the rumor. As a consequence, researchers have initiated investigations into the utilization of high-order structures within complex networks, such as simplicial complexes, to delineate high-order interactions in propagation models. Iacopini et al. [30] constructed a stochastic simplicial-shaped complex network to model epidemic spreading and employed a mean-field approach to determine the network’s outbreak threshold. Their findings suggested that the simplicial structure induces discontinuous phase transitions, allowing both endemic and healthy states to coexist. Nie et al. [31] used a microscopic Markov Chain approach (MMCA) to analyze the higher-order interactions of competitive transmission between diseases, and pointed out that individuals with higher degree values are more capable of spreading diseases. Xue et al. [32] conducted research on the cooperative spread of two diseases within higher-order network structures, and analyzed the stability of the fixed points using the MMCA and mean-field methods. Moreover, recent research on the coupled dynamics of information and infectious diseases within multilayer complex networks has incorporated high-order interactions into consideration. Fan et al. [33] leveraged simplicial complexes to establish a UAU-SIS model, characterizing the coupled dynamics of epidemic spread and awareness propagation. Chang et al. [34] integrated heterogeneous mean-field theory with effective degree theory to investigate the threshold characteristics of higher-order multilayer networks. Their work emphasized the profound influence of self-awareness on bistable occurrences. Li et al. [35] applied the MMCA and mean-field method to analyze higher-order co-evolutionary networks of information diseases on both synthetic and real networks. These studies have deepened our understanding of real-world transmission phenomena.
The research on coupled dynamics of information and infectious diseases, while considering high-order interactions, is still in its early stages, providing substantial opportunities for further exploration and investigation. In existing coupled spreading models that incorporate high-order interactions, many crucial factors have not received thorough consideration, such as the latency of infections and the interpersonal social distance. Therefore, building upon existing research, we have devised a novel coupled spreading model for information and infectious diseases, incorporating high-order interactions. The coupled spreading model is developed within a multilayer complex networks framework. The upper layer embodies a high-order complex network utilizing simplicial complexes, while the lower layer consists of a weighted complex network. Information and infectious diseases spread within the upper and lower layers, respectively. The coupled propagation model we proposed has two main features that are not present in existing research works [19,33]. Firstly, in information spreading that considers high-order interactions, we include individuals who possess information but do not transmit it. Secondly, in the context of disease propagation, we consider the impact of both asymptomatic carriers and the interpersonal social distance. These two features enable our proposed model to not only provide a more accurate characterization of the information dissemination process but also to analyze additional factors influencing the spread of infectious diseases. Furthermore, the model we constructed is more versatile, as setting some parameters to specific values allows it to be simplified into the models presented in references [19,33]. Considering the coupled dynamics of information and infectious disease dissemination, along with the structural features of the two-layer network, we have defined the transition probabilities between states in the proposed model. In particular, we have presented a mathematical description of high-order interactions using simplicial complexes in the context of information spread. Through further derivations of the coupled spreading dynamic equations constructed using the MMCA, we obtain the expression for the outbreak threshold of infectious diseases influenced by information spread. This threshold equation highlights that the state of information propagation in the upper layer plays a pivotal role in determining the occurrence of an infectious disease outbreak. High-order interactions alter the outbreak threshold of the epidemics by influencing the propagation state of information. This study also carried out comprehensive simulation experiments to further investigate the propagation dynamics of the proposed model. The simulation results suggest that high-order interactions in information spreading, as well as the interpersonal social distance between individuals, both exert a certain level of influence on outbreak of disease and scale of epidemics with latent periods.
The structure of this paper is arranged as follows. Section 2 offers a comprehensive introduction to the constructed-coupled disseminating model. In Section 3, the model is formally presented in mathematical terms with accompanying theoretical derivations. Section 4 conducts an in-depth analysis and discussion of the obtained simulation results. Finally, Section 5 presents a comprehensive summary of the research findings.
2. Model Description
Building upon prior research, we have devised a coupled propagation model that incorporates high-order interactions within a two-layer complex network, illustrated in Figure 1.
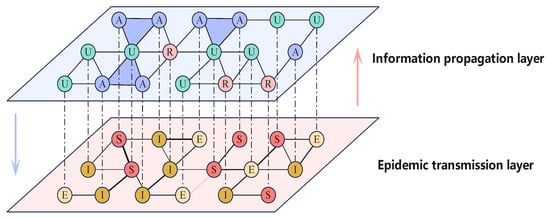
Figure 1.
(Color online) Outline of the two-layer complex networks utilized in the proposed model, including the information propagation layer (upper layer) and the epidemic transmission layer (lower layer). The blue triangles in the upper layer represent 2-simplex constructed from three nodes. The varying thickness of the edges in the lower layer network indicates different edge weights.
In the upper layer, we incorporate 2-simplices into traditional unweighted and undirected complex networks to represent high-order interactions in information diffusion. We employ the simplicial unaware-aware-removed-unaware (sUARU) model to elucidate the process of information dissemination. The upper layer comprises three states: U signifies individuals who are unaware of the information, A denotes those who are aware and actively spread it, and R represents individuals who are aware but choose not to spread it. Individuals in the U state can receive information from their A state neighbors. In addition to edge-based pairwise interactions, high-order interactions facilitated by 2-simplices can further enhance information diffusion, as demonstrated in panel (a) of Figure 2.
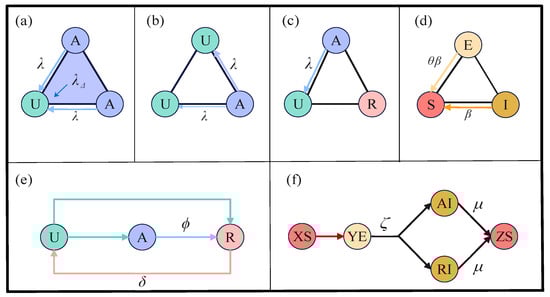
Figure 2.
(Color online) Propagation modes and state transition relationships within the coupled spreading model. Panels (a–c) illustrate the propagation of information using two different methods. Panel (d) demonstrates that infectious diseases spread exclusively through individual-to-individual edge interactions. Panel (e) represents the possible state transitions that individuals may undergo during information propagation, while panel (f) illustrates the potential state transitions individuals may experience in the coupled spreading process, where XS and ZS ∈ {US, AS, RS}, and YE ∈ {UE, AE, RE}.
In a 2-simplex with three nodes, when two of them are in state A, information is not only transmitted via edges with probability but also generates an additional information transmission rate due to high-order interactions. It is worth noting that the information transmission rate only occurs when two nodes within a 2-simplex are both in state A simultaneously. In panels (b,c) of Figure 2, information can only be transmitted through edges with a probability of under the conditions mentioned above. Panel (d) in Figure 2 illustrates potential state transitions that individuals may undergo during the information propagation process. In contrast to the UAU information propagation model [36], individuals in the U state exhibit two possible state transitions upon receiving information, while individuals propagating information enter the R state before ultimately forgetting the information. The developed sUARU model provides a more accurate depiction of real-world information propagation mechanisms. Further explanations of the parameters involved in information propagation can be found in Table 1.

Table 1.
Symbols and their explanations.
In the lower layer, we employ the susceptible-exposed-infected-susceptible (SEIS) model to illustrate the dynamics of disease transmission. In this layer, individuals exist in one of three states: S, E, or I. State S represents individuals who are vulnerable to the infection but currently uninfected, while state E signifies individuals who have been exposed to the infection and are presently in the incubation period. Importantly, even though individuals in the state E do not display symptoms, they have the capacity to transmit the disease. As shown in Figure 2d, individuals in both the states E and I can transmit the disease to individuals in the state S, but the transmission probabilities vary slightly. Drawing from real-world transmission scenarios, we assume that individuals in the state E have a lower transmission capability compared to those in the state I, denoted as ∈ (0, 1). In Figure 2, panel (f) illustrates the potential state transition mechanisms that individuals may undergo during the spread of infectious diseases. Unlike the SIS model [37,38,39,40], individuals, after becoming infected, first enter an asymptomatic latent period (i.e., the state E), and then progress to a symptomatic phase (i.e., the state I). All infected individuals only recover after entering the state I. We utilize a weighted network in the lower layer to model the physical contact relationships among individuals, with weight values ranging from 0 to 1. These weights in the lower layer network signify the level of interpersonal social distance between individuals, where larger values indicate closer relationships. The probability of infectious disease transmission is influenced by the degree of interpersonal closeness, with higher weight values being more conducive to disease transmission.
The dashed lines linking the upper and lower network depict the coupled relationship between information and infectious diseases. Information primarily exerts a suppressive effect on disease transmission, while infectious diseases mainly facilitate information propagation. Specifically, on the one hand, individuals with prior knowledge of the disease take preventive measures to reduce susceptibility. This means that the infection probability of individuals in states A or R is lower than that of individuals in state U. On the other hand, individuals unaware of disease information immediately become aware of disease transmission upon developing symptoms. This means that individuals in state U transition to states A or R as soon as they become symptomatic infected individuals. The proposed model includes a total of 8 states, namely US (unaware-susceptible), UE (unaware-exposed), AS (aware-susceptible), AE (aware-exposed), AI (aware-infected), RS (removed-susceptible), RE (removed-exposed), and RI (removed-infected). The UI state is not included in this coupled spreading model because symptomatic individual is already conscious of the presence of the disease.
3. Theoretical Analysis
To gain deeper insights into the dynamic properties of the proposed coupled spreading model, we employ the MMCA [41,42,43] to formulate the dynamic propagation equations. To delineate the configuration of the upper and lower layers, we utilized adjacency matrices and . Matrix stores the structural information of the upper layer, where each element can take on either a value of 1 or 0. A value of 1 indicates the existence of a connection between vertices i and j, while a value of 0 signifies the absence of an edge between the two nodes. In contrast, matrix represents the lower layer, where denotes no edge between nodes, and signifies the presence of an edge with a weight of . Additionally, we introduced a three-dimensional matrix to store the 2-simplices in the upper-layer network. The elements of this matrix, denoted as , take on a value of 1 when vertices l, i, and j are all interconnected and form a 2-simplex, while indicates that nodes l, i, and j do not constitute a 2-simplex.
The probabilities of an arbitrary individual i in the proposed coupled spreading model being in any of eight states at any time step t are represented as , , , , , , and , respectively. Individuals in states US and UE who have not acquired information through their neighbors at time step t are defined as . Since information can spread through two different methods, can be further expressed as , where and represent the probabilities that individuals have not acquired information through direct interactions and high-order interactions, respectively. The specific expressions for and are as follows,
where , . Similarly, the probabilities that individuals in the US, AS, and RS states have not been infected by their neighbors at step t are represented as , , and , respectively. We assume that individuals in the AS and RS states adopt the same effective preventive measures, so we have = . Based on the earlier definitions, these three probabilities are explicitly formulated as follows,
where and = . Additionally, and represent the probabilities of infected individuals transmitting the infection to individuals who have not acquired and have acquired information, respectively, and it holds that .
Based on the previously described mechanisms of state transitions and the definitions of corresponding parameters, we have constructed eight state transition probability trees to visually depict all possible state transition relationships and their respective probabilities within the system, as illustrated in Figure 3. More specifically, in each probability transition tree within Figure 3, the leaf nodes representing states signify all the states to which the state represented in the root node might transition in the subsequent step. We further mathematically describe these eight state transition probability trees using MMCA to derive the dynamic equations for the coupled spreading, as presented below.
where t denotes the time step. Equation (3) primarily calculates the probability of an individual i being in each state in the next time step based on their probabilities of being in each state at step t.
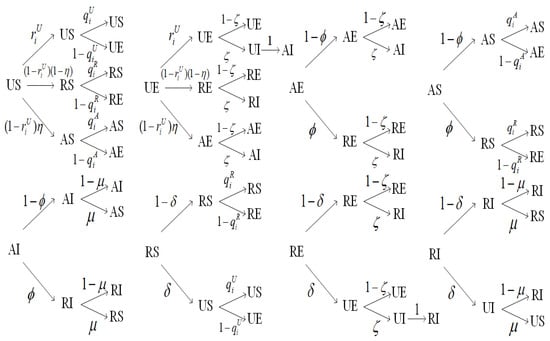
Figure 3.
The state transition probability trees describing the state transition relationships and probabilities in the coupled spreading model.
When step t is sufficiently large, all the equations in Equation (3) can reach an equilibrium state. In other words, the values of all the variables in Equation (3) no longer change dynamically with time. Therefore, after Equation (3) reaches an equilibrium state, we have , where represents the stable value of that variable that no longer varies with time. The same notation applies to other variables with time-dependent parameters, and they can be denoted as , , , , , , , , , and at equilibrium. According to Equation (3), we can derive the following equation.
The epidemic threshold is a critical metric for assessing the ease or difficulty of an epidemic outbreak. When the infection rate is infinitely close to the epidemic threshold , the infectious disease is in a state just before the outbreak. At this point, it can be assumed that and , where both and are infinitesimal quantities. Therefore, based on Equation (2), we can approximate and as
When approaches infinitely and the system reaches an equilibrium state, the summation of the two equations in Equation (4) can be expressed as
Reforming Equation (9) once more yields Equation (10) as follows,
where represents the elements of an identity matrix. With matrix as the foundation, we can further construct an matrix with elements and denote its maximum eigenvalue as . Consequently, the epidemic threshold in the proposed coupled spreading model can be expressed as
From Equation (11), it is evident that the epidemic threshold in this model is influenced not only by information propagation but also by factors such as the latent period of the infectious disease and the interpersonal social distance. Additionally, setting , , , and in Equation (11) simplifies it into a form similar to that in references [19,33]. This is primarily because, when and , the disease transmission in the lower layer simplifies to an SIS model.
4. Numerical Simulation
To further validate the theoretical findings and analyze the dynamic properties of coupled spreading, we conduct extensive computer simulations utilizing MMCA iterations and Monte Carlo (MC) simulations. In all simulation experiments, the upper-layer network is generated using the method described in reference [30], which is based on the ER model and incorporates 2-simplices in a random network. This network consists of 2000 nodes with an average degree of 6. Additionally, on average, each node in the network is associated with 1.2 2-simplices. The lower-layer networks, denote as ER-weighted network and BA-weighted network, are created based on the ER and BA models. The specific generation process involves first generating an ER or BA network with an average degree of 6. Subsequently, random numbers in the range of are generated for each edge as their respective edge weights, where . The number of vertices in each network layer is 2000. Furthermore, we define , , , and as the densities of nodes in the coupled spreading model with states A, R, E, and I, respectively, when the system reaches an equilibrium state. For the initial time step of all simulation experiments, the proportion of individuals in the UE and AI states is set to 2%, the proportion of individuals in the AE, RS, RE, and RI states is set to 1%, and the proportions of individuals in the US and AS states are set to 92% and 0%, respectively.
To assess the accuracy of the propagation dynamics equations constructed using MMCA, we compared the experimental results obtained through MMCA iterations and MC simulations, as illustrated in Figure 4. Visually, all eight sets of comparisons in Figure 4 exhibit relatively strong consistency. This suggests that the results obtained from both methods are in good agreement. To further elucidate the level of concordance between these two sets of experimental results, we computed the average relative errors for each comparison. Moving from Figure 4a–d, the average relative errors for comparisons are 0.99%, 0.63%, 4.52%, and 7.55%, while for comparisons, the average relative errors are 1.02%, 0.77%, 4.56%, and 7.54%, respectively. These relatively low average relative error values once again confirm the favorable alignment of results obtained from both methods. Consequently, the constructed propagation dynamics equations exhibit a high degree of precision. The subsequent analysis of coupled spreading dynamics properties will only present results obtained through MMCA iterations. Beyond assessing the accuracy of the propagation dynamics equations constructed using MMCA, we can also extract some dynamic properties of coupled spreading from the results shown in Figure 4. In each panel of Figure 4, the values of are consistently greater than those of under the same conditions. This indicates that asymptomatic infected individuals outnumber symptomatic ones when the system reaches an equilibrium state. Moreover, a comparison between panels (a,c) reveals that even after considering information and social distancing, infectious diseases spread more readily in populations with scale-free contact structures. The differences between panels (c,d) suggest that individuals implementing effective protective measures after becoming aware of the disease can simultaneously reduce the densities of both types of infections.
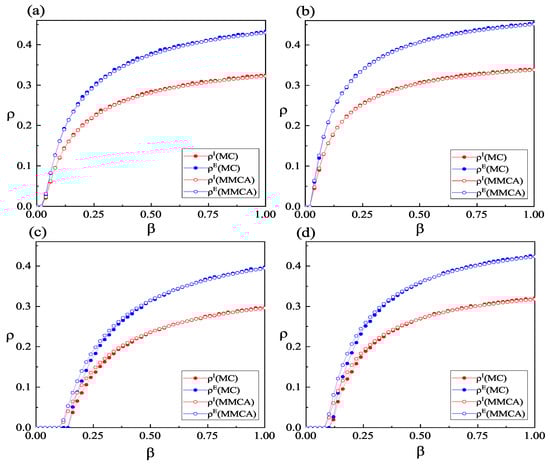
Figure 4.
(Color online) Variations in and with respect to the infection probability . Simulation results obtained through MMCA iterations and MC simulations. is set to 0.5 in panels (a,c) and 1 in panels (b,d). In the lower layer, panels (a,b) adopt BA-weighted networks, while panels (c,d) adopt ER-weighted networks. The values of the other parameters are defined as: , , , , , , , , and . Results obtained from MC simulations represent the average of 10 independent runs.
Figure 5 presents the variations in infection density at the equilibrium state of the system under different high-order interaction effects in information propagation. It is worth noting that when , it signifies the absence of high-order interactions in the information propagation process. Overall, the results depicted in Figure 5 indicate that a higher additional information transmission rate resulting from high-order interactions leads to a more pronounced suppression of the outbreak of infectious diseases. This is primarily attributed to the larger additional transmission rate, which facilitates the propagation of information, and individuals who acquire this information can reduce the overall infection density by taking certain protective measures. Comparing panel (a) with panel (b) and panel (c) with panel (d) in Figure 5 reveals that the influence of high-order interactions in information propagation becomes more pronounced when the information forgetting rate is higher. The primary reason for this difference is that at lower information forgetting rates, the edge-based transmission mechanism can already facilitate information spreading to a sufficiently large scale, and the probability of the three nodes within the 2-simplex being in state A or R is already quite high. Thus, the additional information transmission rate generated by high-order interactions does not contribute significantly to information propagation. However, at higher information forgetting rates, the probability of nodes within the 2-simplex being in state U is somewhat higher, making them more susceptible to the influence of high-order interactions. Furthermore, Figure 6 demonstrates the impact of different interpersonal social distances on the density of infected individuals. In Figure 6, smaller values of and indicate larger social distances between individuals. When both and are equal to 1, it represents the normal social distance without protective measures among individuals. From Figure 6, it can be observed that when the social distance between individuals is generally larger, the outbreak threshold for the disease is the highest, and the number of infected individuals in a system at equilibrium is the lowest. Therefore, increasing interpersonal social distance is not only a crucial measure to prevent an epidemic outbreak but also a significant strategy to reduce the scale of an outbreak once it occurs. Furthermore, the black lines in panels (a,b) of Figure 6 represent the results obtained by simplifying the proposed model to the model presented in reference [33]. By comparing the black line with the purple line in Figure 6, it is evident that under the same conditions, the density of infected individuals in our proposed model is higher. This is attributed, on the one hand, to individuals in state R impeding the spread of information in the model, and, on the other hand, to individuals in state E being unable to self-perceive the existence of the disease.
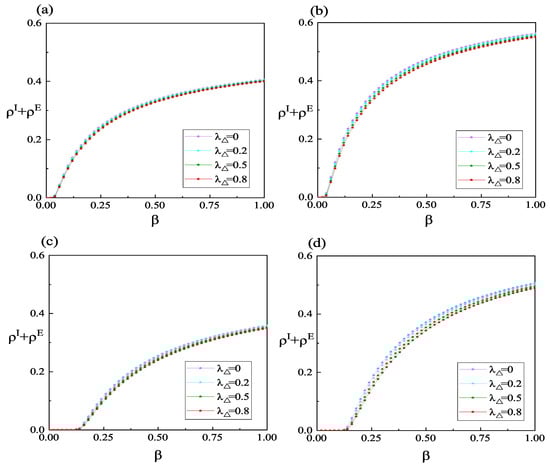
Figure 5.
(Color online) Variation in the sum of and concerning the infection rate under various high-order interaction effects. is set to 0.2 in panels (a,c) and 0.6 in panels (b,d). In the lower layer, panels (a,b) adopt BA-weighted networks, while panels (c,d) adopt ER-weighted networks. The values of the other parameters are defined as: , , , , , , , and .
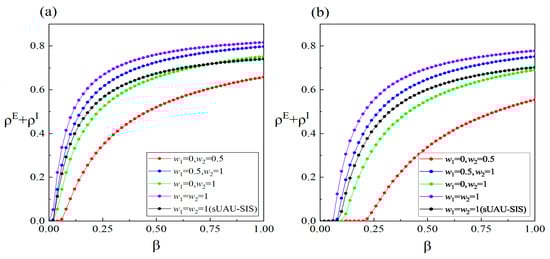
Figure 6.
(Color online) The impact of diverse weight distributions in the lower-layer network on the density of scale of infection () with changes in the infection rate . The values of the other parameters (except the black line) are defined as , , , , , , , and . The parameters for the black line are defined as , , , , , , , and . In the lower layer, panel (a) adopts a BA-weighted network, while panel (b) adopts an ER-weighted network.
To offer a more thorough examination of the phase transition characteristics of the coupled spreading model, we illustrate the variations in , , , and with respect to and in Figure 7 and Figure 8. From the lower left regions of Figure 7a,b, it can be observed that information propagation leads to outbreaks not only due to an increase in the information transmission rate but also because of the facilitation of disease transmission.
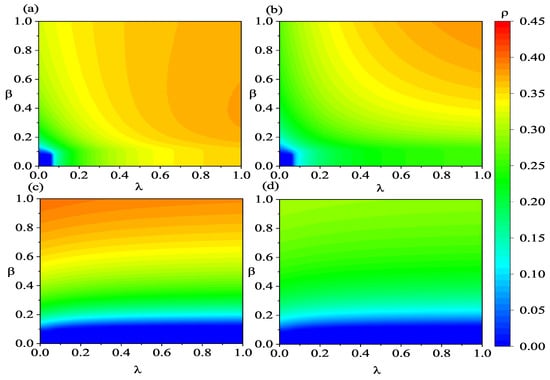
Figure 7.
(Color online) Heatmaps illustrating the variations in , , , and with respect to and . Panels (a–d) represent , , , and , respectively. The lower-layer network employs an ER-weighted network. The values of the other parameters are defined as: , , , , , , , , , and .
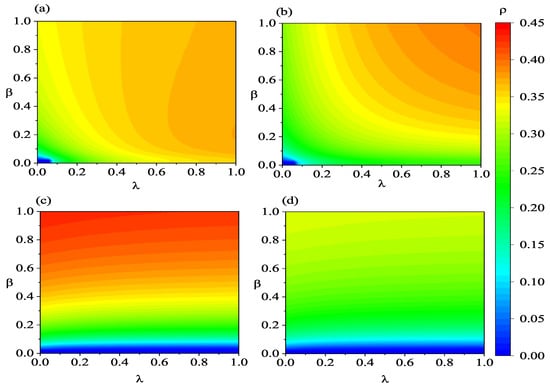
Figure 8.
(Color online) Heatmaps illustrating the variations in , , , and with respect to and . Panels (a–d) represent , , , and , respectively. The lower-layer network employs an ER-weighted network. The associated parameters are defined as: , , , , , , , , and .
In Figure 7a, at high information transmission rates, for example, , initially increases subsequently declines with the elevation of the infection rate . The initial increase in can be attributed to the increase in infection density and the higher information transmission rate, which promotes information propagation, leading to a substantial increase in individuals in states A and R in the system. However, when there are too many individuals in the state R, it hinders the transmission of information to individuals in the state A. Therefore, primarily a result of a further increase in the density of individuals in the state R, driven by the increased number of infected individuals. Nevertheless, the overall count of individuals who acquire the information increases with the increasing infection rate . This indicates that a larger outbreak of the infectious disease has a stronger promoting effect on information transmission. From Figure 7c,d, it is evident that an increase in the information transmission rate not only raises the threshold but also reduces the scale of both asymptomatic and symptomatic infected individuals. When comparing panels (c,d) of Figure 7, it can be noticed that changes in the information transmission rate have a more pronounced effect on the density of asymptomatic infected individuals. This is primarily because susceptible individuals tend to become asymptomatic infected individuals first after being infected. Overall, promoting information transmission is beneficial for diminishing the scale of infection. Furthermore, the dynamic characteristics of coupled spreading shown in Figure 8 are similar to those in Figure 7. However, the outbreak of infectious disease and information is more likely to occur and on a larger scale when the low layer is BA-weighted network in Figure 8.
To further analyze the impact of factors like higher-order interactions, asymptomatic infections, and individual social distances on the outbreak threshold of infectious diseases, we present in Figure 9 the variations in the outbreak threshold with respect to several different parameters. The panel (a) of Figure 9 illustrates the variation in the outbreak threshold with respect to the decay coefficient under different levels of individual willingness for information propagation. The outbreak threshold exhibits a decreasing trend with the increase in , indicating that the enhanced infectiousness of asymptomatic carriers is more favorable for disease outbreak. Furthermore, an increased willingness of individuals to actively propagate information after being informed can act as a deterrent to the epidemic outbreak. Panel (b) of Figure 9 presents the variation in the outbreak threshold, under different recovery rates concerning the probability of infected individuals exhibiting symptoms. The increased probability of asymptomatic individuals developing symptoms reduces the likelihood of epidemic outbreaks, mainly because a portion of individuals becomes information spreaders after showing symptoms. Similarly, an elevation in the recovery rate can raise the outbreak threshold of the infectious disease. It is worth mentioning that when , it indicates that individuals in the lower layer do not recover after infection and remain in the state E indefinitely, resulting in an outbreak threshold of 0 at . Furthermore, from both panels (a,b) of Figure 9, it is evident that the outbreak threshold for infectious diseases is higher when the lower layer is an ER-weighted network. Therefore, making appropriate adjustments to the structural characteristics of the population’s contact network when an infectious disease emerges is an essential measure for preventing disease outbreak.
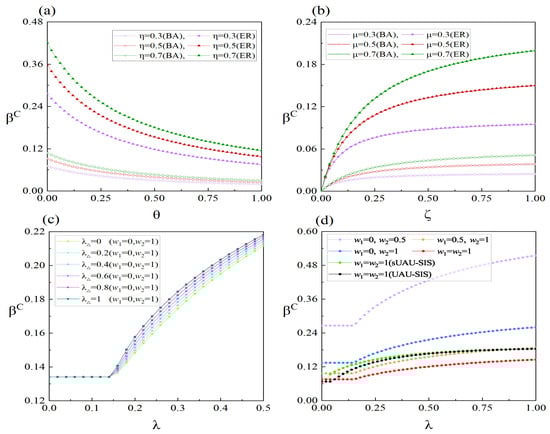
Figure 9.
(Color online) Variations in the epidemic threshold () under different conditions. Panel (a,b) show the effect of parameters , , , and on the outbreak threshold when , , , , , and . The values of are set to 0.8 in panels (a–c), and to 0.4 in panel (d). Panels (c,d) show the impact of information propagation rate and the propagation rate of 2-simplex, along with different weighting methods, on the outbreak threshold when both lower layers are ER-weighted networks and the parameters (excluding the black and green lines in panel (d)) are defined as and . In panel (d), for all lines except the black one is set to 0.6, while for the black line is set to 0. The other parameters for the black and green lines in panel (d) are defined as , , , , , and .
The panel (c) of Figure 9 illustrates the variation in the outbreak threshold of infectious diseases with variations in the information disseminating rate under different high-order interaction effects in the process of information dissemination. When is less than or equal to 0.14, the threshold of infectious diseases is not influenced by the information disseminating rate since the information in the upper layer has not erupted. When is greater than 0.14, an outbreak of information occurs in the upper layer, and with an increase in , the number of individuals with acquired information increases. Consequently, the outbreak threshold increases with an increase in . The variation in has no effect on threshold when information has not erupted. However, after the information eruption, an increase in can raise the threshold. The panel (d) of Figure 9 displays the impact of different individual social distances on the variation in with . Similar to panel (c), only affects the outbreak threshold after the information outbreak. However, changes in individual social distances have an impact both before and after the information outbreak, with a greater impact after the outbreak. From panel (d), it can be observed that the outbreak threshold is the smallest when individuals maintain normal social distances (), and it is the largest when larger social distances are generally maintained (). These results indicate that it is essential to appropriately increase individual social distances in the prevention and control of epidemics. Additionally, the black and green lines in panel (d) represent the results obtained by simplifying the proposed model to the models presented in references [19,33], respectively. By comparing the red, black, and green lines, it is observed that under equivalent conditions, the outbreak threshold of our proposed model before the information outbreak is relatively large. This is mainly due to the lower infectiousness of individuals in state E compared to those in state I. However, after the information outbreak, under the same conditions, the outbreak threshold of our proposed model becomes relatively small. This is mainly due to the fact that individuals in state R, being unfavorable for information spread, result in fewer individuals with known information.
5. Conclusions
We construct a new multilayer complex network utilizing a higher-order network containing 2-simplices and a weighted complex network. Based on this multilayer complex network, we develop a novel coupled spreading model for information and infectious diseases. The model incorporates higher-order interactions in information spreading and considers the asymptomatic individuals and interpersonal social distances in disease spreading. Information spreading is characterized using an sUARU model, with 2-simplices representing higher-order interactions. Disease spreading is represented using an SEIS model, and a weighted network is employed to capture interpersonal social distances. Utilizing state transition probability trees, we describe the transition relationships between different states in the coupled spreading model. Subsequently, based on these probability trees, we apply MMCA to further establish the dynamic equations of the coupled spreading model. Further approximate derivations of the steady-state form of the epidemic dynamics equation led to an analytical expression for the epidemic threshold. The parameters in the analytical expression indicate that information spreading, disease latent period, and individual social distance can directly influence the epidemic threshold. Furthermore, we utilize two methods, MMCA iteration and MC simulation, to conduct computer simulations for analyzing the spreading dynamics of the proposed model. The impacts of higher-order interactions, social distance, and asymptomatic individuals on the scale of disease spread and outbreak thresholds are emphasized. The findings indicate that increasing the strength of high-order interactions in information spreading and enlarging the social distance between individuals are advantageous for reducing the scale of infectious disease outbreaks and increasing the epidemic threshold. This impact is more pronounced when the lower layer is an ER-weighted network. Furthermore, a stronger transmission capability of asymptomatic individuals is more likely to lead to an epidemic outbreak, and a longer duration of individuals being asymptomatic also decreases the epidemic threshold. The results of this study can enhance our comprehension of the impact of high-order interactions in information and social distance between individuals on the spreading dynamics characteristics of infectious diseases with latent periods.
Author Contributions
Conceptualization, Z.H. and H.Z.; methodology, H.Z.; software, Z.W.; validation, Q.Y., Z.W. and J.L.; formal analysis, H.Z.; writing—original draft preparation, Z.H.; writing—review and editing, H.Z.; project administration, Z.W. All authors have read and agreed to the published version of the manuscript.
Funding
This research was funded by the Guangdong Provincial Department of Education Youth Innovative Talents Project (Grant No. 2023KQNCX087), Guangzhou basic and applied basic research project (Grant No. 202201011213) and Joint Research and Development Fund of Wuyi University and Hong Kong and Macau (2019WGALH21).
Data Availability Statement
All data that support the findings of this study are included within the article.
Conflicts of Interest
The authors declare no conflict of interest.
References
- Huang, C.; Wang, Y.; Li, X.; Ren, L.; Zhao, J.; Hu, Y.; Zhang, L.; Fan, G.; Xu, J.; Gu, X.; et al. Clinical features of patients infected with 2019 novel coronavirus in Wuhan, China. Lancet 2020, 395, 497–506. [Google Scholar] [CrossRef] [PubMed]
- World Health Organization. COVID-19 Dashboard. 2023. Available online: https://www.who.int/data (accessed on 1 November 2023).
- Zhang, Y.; Luo, M.; Wu, Q.; Wang, Y.X.; Ma, X.; Yan, G.; Zhang, S.H.; Chen, Y.; Wan, N.; Zhang, L.; et al. Long-term and effective neutralization against omicron sublineages elicited by four platform COVID-19 vaccines as a booster dose. Cell Discov. 2023, 9, 9–17. [Google Scholar] [CrossRef] [PubMed]
- Mäkelä, A.; Uğurlu, H.; Hannula, L.; Kant, R.; Salminen, P.; Fagerlund, R.; Mäki, S.; Haveri, A.; Strandin, T.; Kareinen, L.; et al. Intranasal trimeric sherpabody inhibits SARS-CoV-2 including recent immunoevasive Omicron subvariants. Nat. Commun. 2023, 14, 14–1637. [Google Scholar] [CrossRef] [PubMed]
- Keeton, R.; Tincho, M.B.; Ngomti, A.; Baguma, R.; Benede, N.; Suzuki, A.; Khan, K.; Cele, S.; Bernstein, M.; Karim, F.; et al. T cell responses to SARS-CoV-2 spike cross-recognize Omicron. Nature 2022, 603, 488–492. [Google Scholar] [CrossRef] [PubMed]
- Viana, J.; Mutevedzi, T.; Moyo-Gwete, T.; Tegally, H.; Scheepers, C.; Althaus, C.L.; Anyaneji, U.J.; Bester, P.A.; Boni, M.F.; Chand, M.; et al. Rapid epidemic expansion of the SARS-CoV-2 Omicron variant in southern Africa. Nature 2022, 603, 679–686. [Google Scholar] [CrossRef] [PubMed]
- Barateau, V.; Lefebvre, N.; Goffic, R.; Pozzetto, B.; Brengel-Pesce, K.; Elsensohn, M.H.; Allatif, O.; Guibert, N.; Compagnon, C.; Mariano, N.; et al. Prior SARS-CoV-2 infection enhances and reshapes spike protein–specific memory induced by vaccination. Sci. Transl. Med. 2023, 15, 15–687. [Google Scholar] [CrossRef] [PubMed]
- Cao, Y.; Yisimayi, A.; Jian, F.; Song, W.; Xiao, T.; Wang, L.; Du, S.; Wang, J.; Li, Q.; Chen, X.; et al. BA. 2.12. 1, BA. 4 and BA. 5 escape antibodies elicited by Omicron infection. Nature 2022, 608, 593–602. [Google Scholar] [CrossRef]
- Ai, J.; Wang, X.; He, X.; Zhao, X.; Zhang, Y.; Jiang, Y.; Li, M.; Cui, Y.; Chen, Y.; Qiao, R.; et al. Antibody evasion of SARS-CoV-2 Omicron BA. 1, BA. 1.1, BA. 2, and BA. 3 sub-lineages. Cell Host Microbe 2022, 30, 1077–1083. [Google Scholar] [CrossRef]
- Vespignani, A. Complex networks: The fragility of interdependency. Nature 2010, 464, 984–985. [Google Scholar] [CrossRef]
- Pastor-Satorras, R.; Vespignani, A. Epidemic spreading in scale-free networks. Phys. Rev. Lett. 2001, 86, 3200. [Google Scholar] [CrossRef]
- Bauch, C.T.; Galvani, A.P. Social Factors in Epidemiology. Science 2013, 342, 47–49. [Google Scholar] [CrossRef] [PubMed]
- Paré, P.; Janson, A.; Gracy, S.; Liu, J.; Sandberg, H.; Johansson, K.H. Multilayer SIS model with an infrastructure network. IEEE Trans. Control Netw. Syst. 2023, 10, 295–307. [Google Scholar] [CrossRef]
- Newman, M. Spread of epidemic disease on networks. Phys. Rev. E 2002, 66, 016128. [Google Scholar] [CrossRef] [PubMed]
- Zhang, X.; Ruan, Z.; Zheng, M.; Zhou, J.; Boccaletti, S.; Barzel, B. Epidemic spreading under mutually independent intra- and inter-host pathogen evolution. Nat. Commun. 2022, 13, 6218. [Google Scholar] [CrossRef] [PubMed]
- Wang, X.; Min, G.; Hao, F.; Chen, C. An efficient feedback control mechanism for positive/negative information spread in online social networks. IEEE Trans. Cybern. 2022, 52, 87–100. [Google Scholar] [CrossRef] [PubMed]
- Khorev, V.; Kazantsev, V.; Hramov, A. Effect of infection hubs in district-based network epidemic spread model. Appl. Sci. 2023, 13, 13–1194. [Google Scholar] [CrossRef]
- McMahon, T.; Havlin, S.; Gallos, L.K. Effect of cities and distance on COVID-19 spreading in the United States. Phys. Rev. E 2023, 107, 034302. [Google Scholar] [CrossRef]
- Granell, C.; Gómez, S.; Arenas, A. Dynamical interplay between awareness and epidemic spreading in multiplex networks. Phys. Rev. Lett. 2013, 111, 128701. [Google Scholar] [CrossRef]
- Li, C.; Zhang, Y.; Li, X. Epidemic threshold in temporal multiplex networks with individual layer preference. IEEE Trans. Netw. Sci. Eng. 2021, 8, 814–824. [Google Scholar] [CrossRef]
- Wang, Z.; Xia, C.; Chen, Z.; Chen, G. Epidemic propagation with positive and negative preventive information in multiplex networks. IEEE Trans. Cybern. 2021, 51, 1454–1462. [Google Scholar] [CrossRef]
- Gao, S.; Dai, X.; Wang, L.; Perra, N.; Wang, Z. Epidemic spreading in metapopulation networks coupled with awareness propagation. IEEE Trans. Cybern. 2022, 53, 7686–7698. [Google Scholar] [CrossRef] [PubMed]
- Chen, J.; Liu, Y.; Tang, M.; Yue, J. Asymmetrically interacting dynamics with mutual confirmation from multi-source on multiplex networks. Inf. Sci. 2023, 619, 478–490. [Google Scholar] [CrossRef]
- Wu, J.; Zuo, R.; He, C.; Xiong, H.; Zhao, K.; Hu, Z. The effect of information literacy heterogeneity on epidemic spreading in information and epidemic coupled multiplex networks. Phys. A Stat. Mech. Its Appl. 2022, 596, 119–127. [Google Scholar] [CrossRef] [PubMed]
- Guo, Y. Transmission dynamics of disease spreading in multilayer networks with mass media. Phys. Rev. E 2022, 106, 034307. [Google Scholar] [CrossRef] [PubMed]
- Bhowmick, S.; Panjam, S. Analysis of epidemic spreading with opinion evolution in multiplex network. IEEE Trans. Circuits Syst. II Express Briefs 2023, 70, 695–699. [Google Scholar] [CrossRef]
- Li, C.; Cheng, C.; Li, C. Global dynamics of two-strain epidemic model with single-strain vaccination in complex networks. Nonlinear Anal. Real World Appl. 2023, 69, 103738. [Google Scholar] [CrossRef]
- Fang, F.; Ma, J.; Li, Y. The coevolution of the spread of a disease and competing opinions in multiplex networks. Chaos Solitons Fractals 2023, 170, 113376. [Google Scholar] [CrossRef]
- Huo, L.; Gu, J. The influence of individual emotions on the coupled model of unconfirmed information propagation and epidemic spreading in multilayer networks. Phys. A Stat. Mech. Its Appl. 2023, 609, 125964. [Google Scholar] [CrossRef]
- Iacopini, I.; Petri, G.; Barrat, A.; Latora, V. Simplicial models of social contagion. Nat. Commun. 2019, 10, 2485. [Google Scholar] [CrossRef]
- Nie, Y.; Li, W.; Pan, L.; Lin, T.; Wang, W. Markovian approach to tackle competing pathogens in simplicial complex. Appl. Math. Comput. 2021, 417, 126773. [Google Scholar] [CrossRef]
- Xue, X.; Li, W.; Nie, Y.; Lei, X.; Lin, T.; Wang, W. Cooperative epidemic spreading in simplicial complex. Commun. Nonlinear Sci. 2022, 114, 106671. [Google Scholar] [CrossRef]
- Fan, J.; Yin, Q.; Xia, C.; Perc, M. Epidemics on multilayer simplicial complexes. Proc. R. Soc. A 2022, 478, 20220059. [Google Scholar] [CrossRef]
- Chang, X.; Cai, C.-R.; Wang, C.-Y.; Liu, X.-S.; Zhang, J.-Q.; Jin, K.; Yang, W.-L. Combined effect of simplicial complexes and interlayer interaction: An example of information-epidemic dynamics on multiplex networks. Phys. Rev. Res. 2023, 5, 013196. [Google Scholar] [CrossRef]
- Li, W.; Cai, M.; Zhong, X.; Liu, Y.; Lin, T.; Wang, W. Coevolution of epidemic and infodemic on higher-order networks. Chaos Solitons Fractals 2023, 168, 113102. [Google Scholar] [CrossRef]
- Wang, X.; Zhu, X.; Tao, X.; Xiao, J.; Wang, W.; Lai, Y.-C. Anomalous role of information diffusion in epidemic spreading. Phys. Rev. Res. 2021, 14, 013157. [Google Scholar] [CrossRef]
- Xu, H.; Zhao, Y.; Han, D. The impact of the global and local awareness diffusion on epidemic transmission considering the heterogeneity of individual influences. Nonlinear Dyn. 2022, 110, 901–914. [Google Scholar] [CrossRef] [PubMed]
- Chen, P.; Guo, X.; Jiao, Z.; Liang, S.; Li, L.; Yan, J.; Huang, Y.; Liu, Y.; Fan, W. Effects of individual heterogeneity and multi-type information on the coupled awareness-epidemic dynamics in multiplex networks. Front. Phys. 2022, 10, 964883. [Google Scholar] [CrossRef]
- Wu, Z.; Cai, Y.; Wang, Z.; Wang, W. Global stability of a fractional order SIS epidemic model. J. Differ. Equ. 2023, 352, 221–248. [Google Scholar] [CrossRef]
- Angel, T.; Daniel, H.; Juan, H.; Javier, V. A stochastic simplicial SIS model for complex networks. Commun. Nonlinear Sci. 2023, 120, 107161. [Google Scholar]
- Gómez, S.; Arenas, A.; Javier, B.; Sandro, M.; Yamir, M. Discrete-time markov chain approach to contact-based disease spreading in complex networks. Eur. Lett. 2010, 89, 38009. [Google Scholar] [CrossRef]
- Arenas, A.; Garijo, A.; Gómez, S.; Villadelprat, J. Bifurcation analysis of the Microscopic Markov Chain Approach to contact-based epidemic spreading in networks. Chaos Solitons Fractals 2023, 166, 112921. [Google Scholar] [CrossRef]
- Hou, Y.; Lu, Y.; Dong, Y.; Jin, L.; Shi, L. Impact of different social attitudes on epidemic spreading in activity-driven networks. Appl. Math. Comput. 2023, 446, 127850. [Google Scholar] [CrossRef]
Disclaimer/Publisher’s Note: The statements, opinions and data contained in all publications are solely those of the individual author(s) and contributor(s) and not of MDPI and/or the editor(s). MDPI and/or the editor(s) disclaim responsibility for any injury to people or property resulting from any ideas, methods, instructions or products referred to in the content. |
© 2023 by the authors. Licensee MDPI, Basel, Switzerland. This article is an open access article distributed under the terms and conditions of the Creative Commons Attribution (CC BY) license (https://creativecommons.org/licenses/by/4.0/).