Article

Stochastic Models and Processing Probabilistic Data for Solving the Problem of Improving the Electric Freight Transport Reliability

1
Department of Advanced Technologies, Tomsk Polytechnic University, 634050 Tomsk, Russia
2
Department of Electrotechnical Complexes, Novosibirsk State Technical University, 630073 Novosibirsk, Russia
3
Department of Electrotechnical Complexes and Systems, Kazan State Energy University, 634050 Kazan, Russia
4
Department of Mechanical Engineering, Tomsk Polytechnic University, 634050 Tomsk, Russia
5
Yurga Technological Institute (Branch), Tomsk Polytechnic University, 652055 Yurga, Russia
*
Author to whom correspondence should be addressed.
Mathematics 2023, 11(23), 4836; https://doi.org/10.3390/math11234836
Submission received: 25 October 2023 / Revised: 24 November 2023 / Accepted: 28 November 2023 / Published: 30 November 2023
(This article belongs to the Special Issue Statistical Methods for Reliability and Survival Analysis)

Abstract

:
Improving the productivity and reliability of mining infrastructure is an important task contributing to the mining performance enhancement of any enterprise. Open-pit dump trucks that move rock masses from the mining site to unloading points are an important part of the infrastructure of coal mines, and they are the main transport unit used in the technological cycle during open-pit mining. The failure of any of the mining truck systems causes unscheduled downtime and leads to significant economic losses, which are associated with the need to immediately restore the working state and lost profits due to decreased site productivity and a disruption of the production cycle. Therefore, minimizing the number and duration of unscheduled repairs is a necessity. The most time-consuming operations are the replacement of the diesel engine, traction generator, and traction motors, which requires additional disassembly of the dump truck equipment; therefore, special reliability requirements are imposed on these units. In this article, a mathematical model intended for processing the statistical data was developed to determine the reliability indicators of the brush collector assembly and the residual life of brushes of electric motors, which, unlike existing models, allow the determination of the refined life of the brushes based on the limiting height of their wear. A method to predict the residual life of an electric brush of a DC electric motor is presented, containing a list of controlled reliability indicators that are part of the mathematical model. Using the proposed mathematical model, the reliability of the brush-collector assembly, the minimum height of the brush during operation, and the average rate of its wear were studied and calculated.

1. Introduction

The coal industry, which has significantly explored and projected coal reserves, requires improvement to achieve efficient mining and utilization in order to satisfy stable energy needs in coal products and export development [1,2,3].
An important part of the infrastructure of coal mines is the transportation of coal by open-pit dump trucks, which move rock masses from mining sites to unloading sites. They are the main transport units in the technological cycle of open-pit mining [4,5,6]. The failure of any of the dump truck systems causes unscheduled downtime and leads to significant economic losses, which are associated with the need to immediately restore working condition and lost profits due to the site productivity loss and the violation of the mining technological cycle [7,8,9]. Therefore, it is important to minimize the number of unscheduled repairs and the time needed for them. The most labor-intensive operations are the replacement of the diesel–electric generator, traction generator, and traction motors, which requires additional disassembly of the dump truck equipment. Therefore, special reliability requirements are imposed on these units [10].
This article synthesized a mathematical model intended for determining the reliability indicators of the brush collector unit and the remaining life of the brushes of electric motors. In addition, the work developed a mathematical model for processing statistical data, which allows the classification of types of failures and, unlike the existing models, the determination of the specified resource brushes based on limiting parameters [11,12].
BELAZ quarry dump trucks with traction electric direct current motors (TEMs) serve as transport in the working area of the quarry and are mostly exposed to the pressure forces influencing the electric motors and electrical equipment. These forces become more complicated depending on the depth of mining conditions [13,14].
At present, a significant number of DC traction motors are in operation around the world, which are designed for a certain purpose [15,16]. After exhaustion, the reliability of DC motors decreases. It is economically expedient to prolong the residual life of DC electric motors by means of improving their design and forecasting their technical conditions on the basis of diagnostics results. Due to the lack of reliable methods to control the technical condition of brush collector assembly (BCA) and the timely measures taken to restore performance, about 50–60% of TEM becomes unusable due to brush failures that do not operate properly until reaching the routine period of their replacement.
One of the methods to increase BCA reliability is the introduction of modern, high-precision, objective methods of technical condition control and diagnostics, which allows the determination of incipient defects in proper time, the prediction of changes occurring in the technical condition, and the implementation of measures to prevent failures [17,18].
Proper BCA operation requires assessing the possibility of providing the assigned resources and service life through the correct acquisition of brushes, spare parts, and tools [19].
The necessity to increase the reliability and residual life of the brush collector units of DC electric motors arises due to constantly increasing requirements for design improvement and the growth of speeds, loads, and technical and economic efficiency.
The main factors affecting the design reliability of the electric motor are the choice of the scheme and design solution of TEMs, the installation of its constituent units, the selection of materials, and the assignment of normal operating modes. They also include arranging maintenance and repair, selecting the modes of running-in and the testing of electric motors, and justifying and developing the technological processes of manufacturing or repairing the parts and assemblies.
The operation reliability of various units is quantitatively estimated by setting the reliability level according to the data of corresponding tests or the operation of dump truck TEMs [20].
During long-term BCA operation, brush damage or malfunctions of its elements inevitably occur, even in the absence of manufacturing defects and with ultimate compliance with the operation rules. The developing microdefects can be detected on the brush surface, as it experiences constant pressure because it is a loaded element. The deposits settling on the collector plates hinder the technical process of energy transfer [21].
The maximum brush life before the brush reaches its limit state is its failure. BCA failures can be divided into three types: mechanical, technological, and operational. The proportion of failures of the third type is determined mainly by the maintenance level at a particular plant, specifying the volume of sampling data on the brush state during testing [22,23].
Currently, there are methods used for predicting the reliability indicators of the traction motors (TEMs) of self-propelled BELAZ mining trucks, which differ in the set of tasks to be solved and the features of the mathematical apparatus used. Therefore, we can conclude that the production and long-term, trouble-free operation of electrical machines largely depend on the quality of assembly units and parts used in TEMs and their operation reliability [24].
Constantly maintaining the vehicle’s technical readiness and preventing intensive wear of parts during operation require the performance of timely periodic maintenance of assemblies (truck maintenance TM-1, truck maintenance TM-2, and truck maintenance TM-3) and systems. Table 1 presents the types and frequency of such maintenance (https://mazsz.ru/samosvaly/vidy-i-periodichnost/, accessed on 25 June 2023).
Predicting the residual life (wear) of the brushes necessitates determining the wear rate and, on the basis of this, proposing the brush height (life), which is fully exhausted before reaching the time of technical repair (TR) or maintenance. This procedure allows the replacement of the worn brushes with new ones (Table 1). Seasonal maintenance is combined with regular maintenance and is performed during the latter. Car maintenance and repair costs account for 35–38% of the transportation cost [25].
The statistical data show that up to 18% of the unscheduled repairs of BELAZ dump trucks (Figure 1) are associated with the failure of electromechanical transmission units; among them, up to 34% fall to the share of traction electric motors (TEMs). The greatest number of failures occurs in the engines, units, and assemblies of the hydromechanical transmission and the hydraulic system. In addition, BELAZ dump trucks have sudden failures, 20% of which are caused by a combination of unfavorable factors [26,27,28,29].
Parameters and indicators of the new traction electrical equipment are provided in Table 2 (https://sib-energomash.ru/product/kteo-b-240/, accessed on 25 June 2023).
Proceeding from the fact that the TEM is an expensive unit and that its failure leads to long downtimes, the issue of checking its reliability is very relevant.
According to the available data collected at various coal mines, traction electric drive failure accounts for up to 18% of all failures (Figure 2), of which 34% fall to TEMs.
The main reasons for DC motor failure in dump trucks are circular fire occurrences, working surface violations of the collector, and increased wear of brushes. These failures account for up to 72% of unscheduled repairs of DC motors (Figure 3). During the long-term operation of dump trucks, the following typical failures can occur in the electrical equipment: the destruction of the insulation of electrical wires, brush abrasions of electric machines, the oxidation of terminals and contacts, and adjustment violations of electrical apparatuses.
Noises, vibrations, and temperature increases appear in defective or excessively worn TEM assemblies, which allow conclusions about the defect’s presence [30,31,32].
The novelty of this work lies in its development of a mathematical model intended for the determination and prediction of the reliability of the brush collector unit and bearings of the DC traction motor. The model allows the estimation of such parameters as the time of wear and failure-free operation of the brushes, the optimal mileage determination of the dump truck by the amount of brush wear, the failure-free operation probability of the brushes, the residual life of the brushes before reaching the permissible wear limit, and the wear rate of the brushes depending on the operation time. The results of such modeling allow conclusions about brush serviceability according to its actual technical condition.
The analysis of the operation data of the traction engines of BELAZ dump trucks allowed the conclusion that implementing this model requires the determination of the percentage of failures associated with brush wear.
This aim necessitates the creation of an effective and convenient method to diagnose and forecast the life of the brush collector units of DC traction motors. At the same time, it is possible to increase the accuracy of forecasting the technical life of the BCA with the help of remote diagnostics, which simplifies the diagnostics procedure (by not requiring the disconnection of the electric motor).

2. Materials and Methods

The current work on the creation and introduction of new electric traction drive systems used in BELAZ (Minsk, Belarus) dump trucks into production and operation was carried out in several directions. To date, dump trucks equipped with the DC traction drive have been in steady demand among end-users.
The BELAZ KT30 B-240 (Minsk, Belarus) electric actuator contains the following main components (Figure 4):
  • A traction synchronous alternator driven by an engine. The traction generator stator winding consists of two electrically unconnected three-phase windings, each connected in a star. There is also a single-phase auxiliary self-excitation winding on the traction generator stator connected through an external regulator and contact rings to the excitation winding located on its rotor.
  • Two DC traction electric motor wheel motors with series excitation, forced blower ventilation, and built-in speed and thermal monitoring sensors.
  • Two power three-phase bridge uncontrolled rectifiers the input terminals of which are connected to the traction generator stator three-phase windings.
  • A module of ventilated braking resistors with individual braking resistors for each traction motor and a common motor fan.
  • The excitation current regulator of the traction generator, whose power part is a semi-controlled single-phase bridge rectifier, which is connected to the input terminals of the traction generator’s self-excitation winding. Its excitation winding is connected to the output terminals.
  • A common regulator of excitation current of traction motors (a smooth field-weakening regulator of electric motors). The power part of the regulator is a controlled three-phase zero-phase rectifier connected in parallel with the circuit containing an anode group of one of the power rectifiers and two series-connected excitation windings of traction motors.
  • Power switching equipment consisting of contactors that switch the power circuits and excitation circuits and reverse the traction motors.
Exceeding the dump truck’s allowable load (Figure 5), which leads to increased inrush currents and power circuit currents in traction mode, requires applying more intensive braking on descents. The large inrush current flowing through the stationary collector can cause the blistering of the lamellas. This allows the control room to operate without sparking and leads to the accelerated wear of the brushes and the collector and, as a result, the premature dismantling of the TEM for collector flushing.
BELAZ mining dump trucks with a payload capacity of 180 t and 280 t are equipped with two electric traction motors, ED-132 and EDP-800, made by LLC Sibelectroprivod (Novosibirsk, Russia) or DK-724, made by CJSC PTFK ZTEO (Naberezhnye Chelny, Russia). DK-724 motors were used and installed in the crankcases of the unified drive axles of the dump trucks according to the design scheme that is traditional for serial domestic dump trucks. They transfer the onboard reducer in the hub of the motor wheel from the side opposite the TEM collector. In this case, the servicing of the TEM brush collector unit was limited by the dimensions of the driving axle, and TEM dismantling was impossible without the complete disassembly of the motor wheel. The rated speed was 910 rpm.
One of the main advantages of DC traction motors is their ability to generate a traction drive mechanical characteristic that is ideal for traction purposes.
DC electric motors are characterized by two factors that determine their operational reliability: commutation and thermal operation. However, DC electric machines have a brush collector assembly, which requires systematic maintenance accompanied by a periodic replacement of the brushes and the collector maintenance. Carrying out these operations requires a certain amount of time and money. Monitoring the condition of the collector and brushes during operation necessitates satisfactory access to the collector, which must be ensured by the electric motor wheel layout.
The collection and analysis of the operational data are required to create mathematical models that take into account defect occurrence. In this work, the authors propose an algorithm for determining the technical condition of a brush, owing to which the wear and height of the brush are monitored (Figure 6). The algorithm clearly shows the working cycle of brush use, including the moments of diagnostics, checking for wear, and issuing a decision for its replacement or continued operation depending on its current technical condition.
Therefore, the purpose of the technological measures performed according to the algorithm is mainly to provide the best indicators of brush wear properties. The possibility of predicting the BCA residual life by the extrapolation method is provided in the presence of the following conditions:
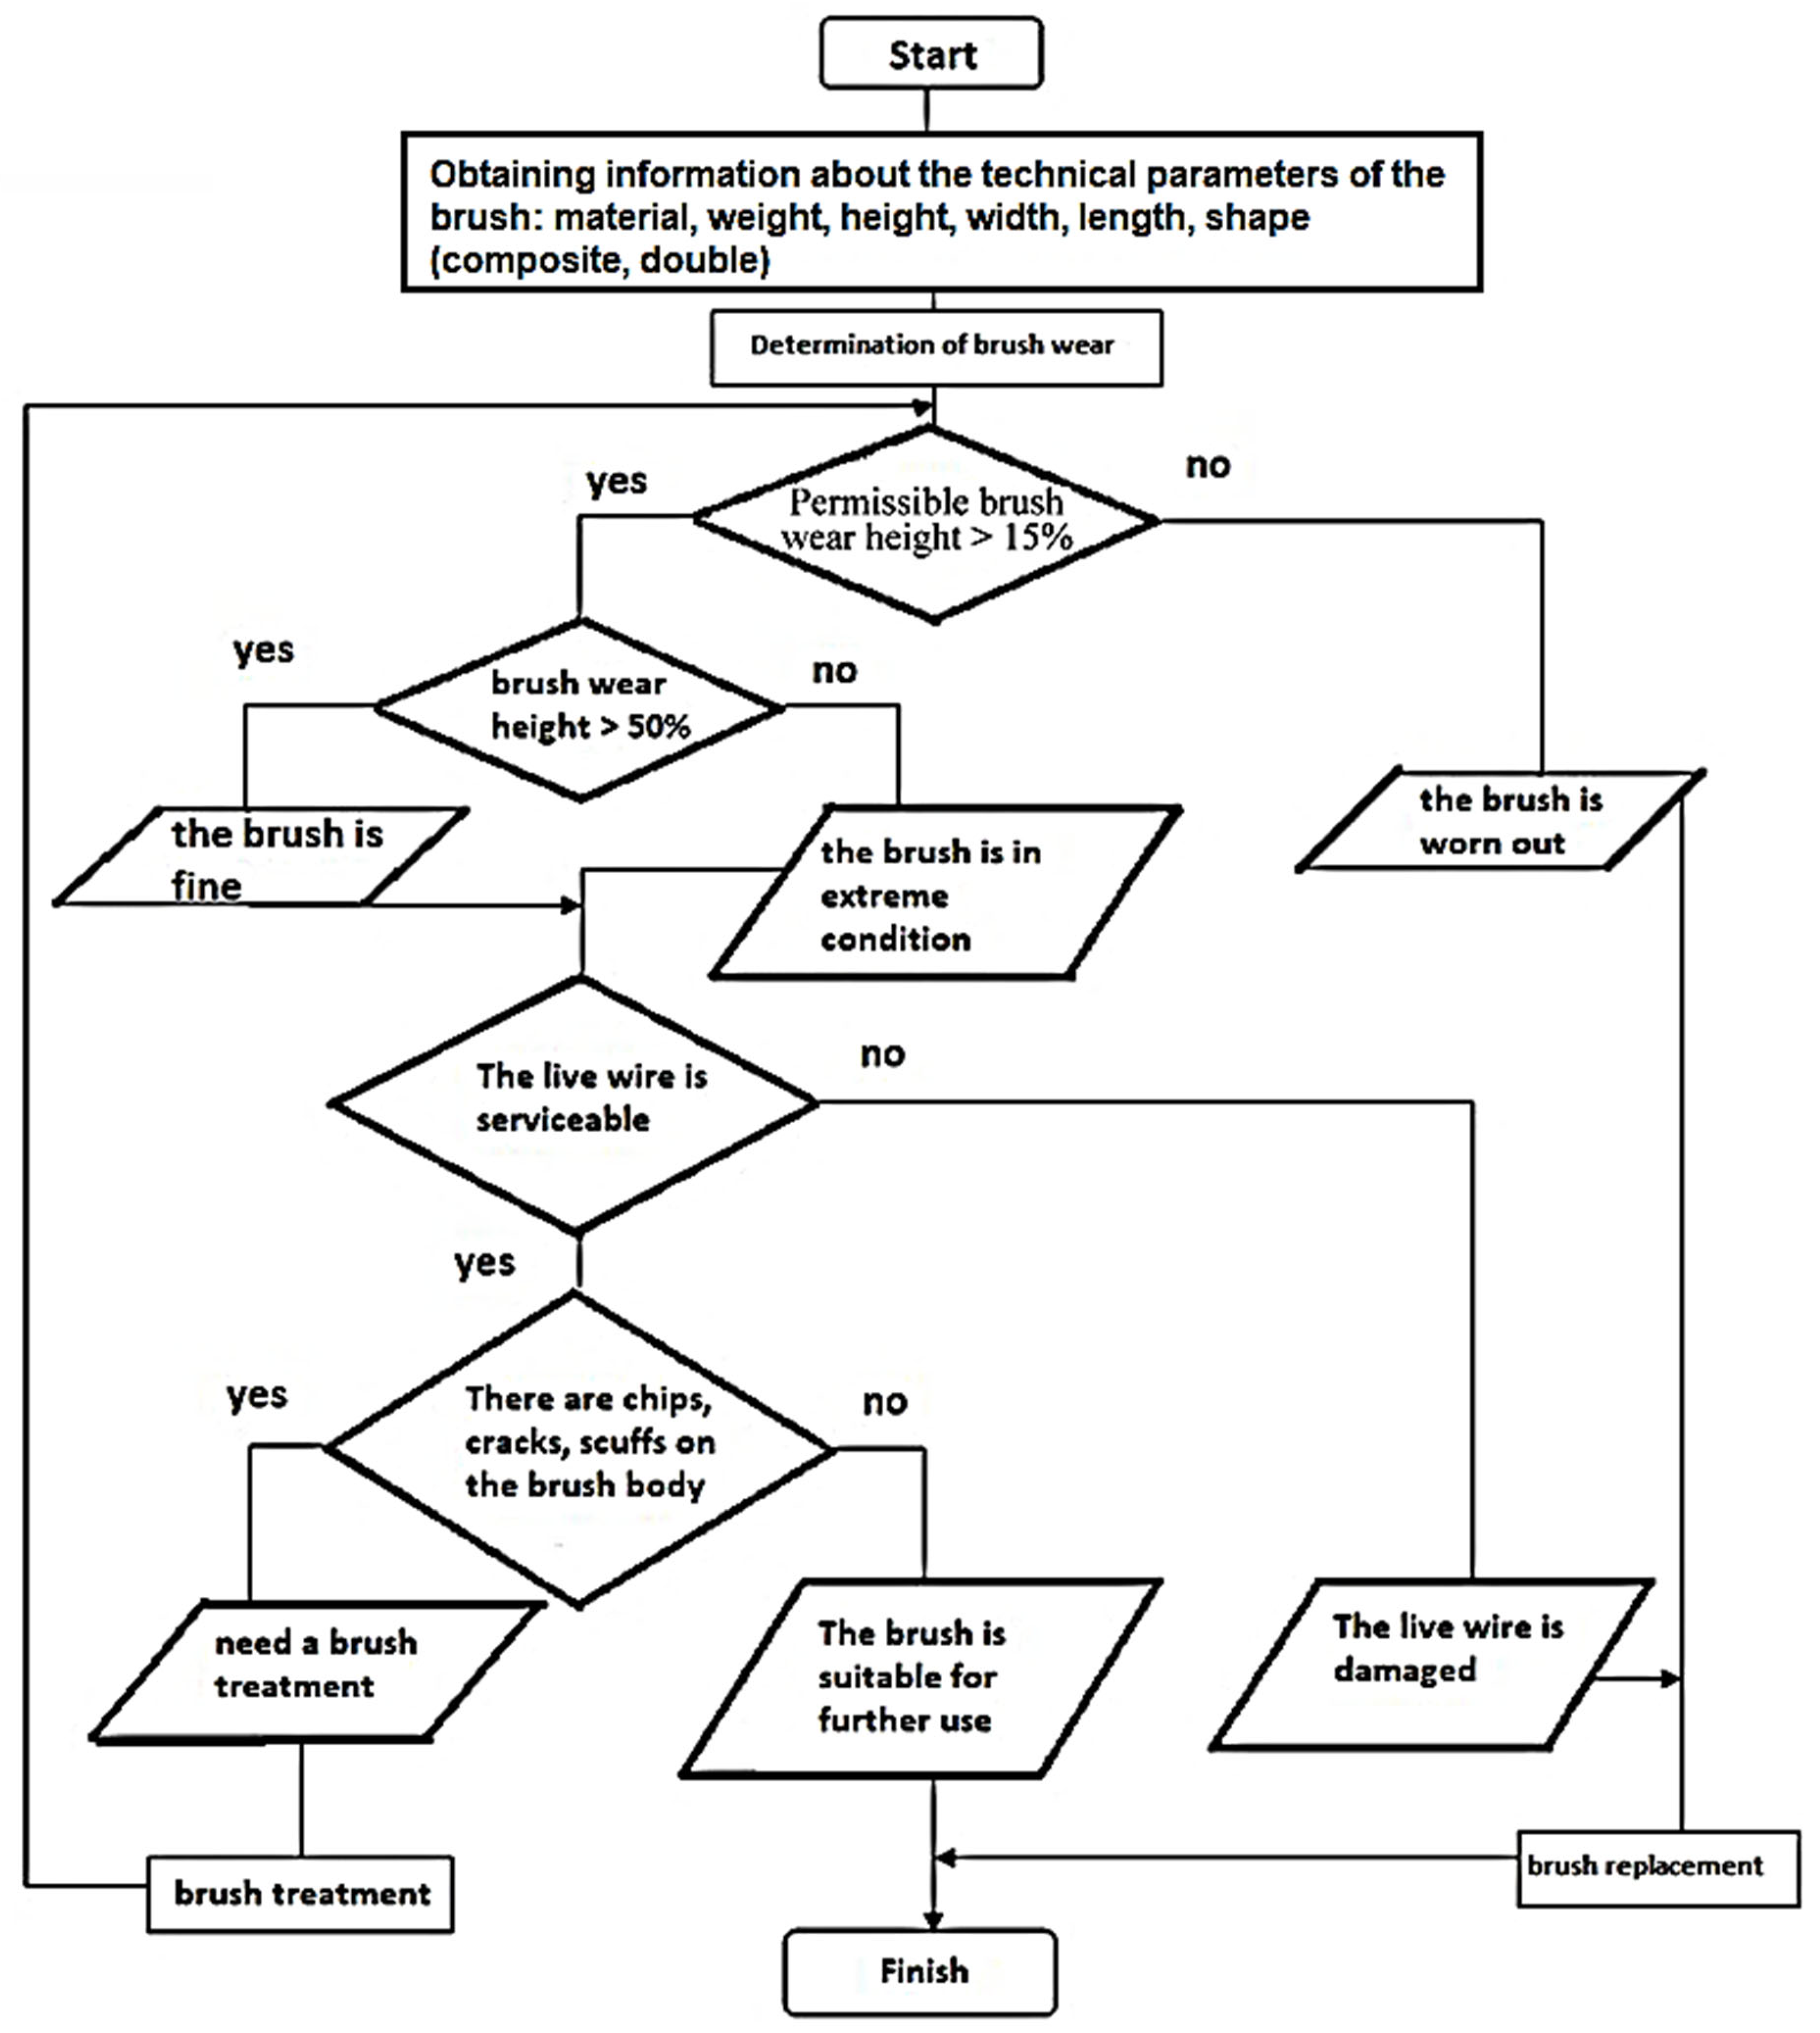
The BCA technical condition parameters are known on the basis of the survey;
The defining parameters of the technical condition, changing according to the revealed brush wear rate, are known;
The criteria of the brush limiting state are known, reaching the limiting values of which is possible when the revealed defects develop.
After performing the algorithm to determine the technical condition of the brushes, the decision on the need to replace the brushes is made, and the final decision on the amount of the required repair is made.
The maximum operating time of a brush before it reaches its limit state is time to failure. Brush failures can be divided into three types: mechanical, technological, and operational. The percentage of failures of the third type depends on the external factors at a particular plant, determining the brush condition during operation.
The probability that the BCA will work without fail after operating time t is equal to:
P t = 1 n t N ,   when   n t N ,
  • where P(t) is the reliability function during time t;
  • n(t) is the permissible number of brush failures that does not lead to the motor stopping (determined by tests) during time t;
  • N is the number of tests conducted on the electric motor brushes.
Using the experimental data and according to (1), a brush wear intensity curve is plotted (Figure 7).
The TEM reliability indicator of the dump truck is improved through the time indicator of reliability (durability), i.e., the residual resource of brushes located in the collector-and-brush assembly unit. In this case, the residual life of the brushes should be determined when reaching the limit (minimum) value (height) hlimithi implies the real, found as a result of operation, value of brush wear [33].
The risks of failing to supply the electric motors from the factory and the manufacturer are regulated by a number of failures of no more than 5% (cases of factory defects). The risks of failures of electric motors during operation attributable to the electric motor units are presented in Figure 2 and Figure 3.
If the allowable number of failures of the brushes in a set is n, then the probability of encountering no more than n failures during N tests is based on the sequential likelihood ratio criterion (probability ratio) [34]:
γ = P T β P T α ,
where P T β and P T α are the average probabilities of the failure-free operation of engines corresponding to the risks of the consumer T β (probability of the failure-free operation during operation) and the manufacturer T α (probability of the failure-free operation of the engine manufacturer), respectively.
The probability of the failure-free operation during time t means the probability of the event {τ > t}, which consists of the fact that in the case of time t, the ACS does not fail, i.e., it is symbolically written as follows:
P t = P { τ > t } ,
  • where t is the operating time of the brush;
  • τ is the operating time of the brush before failure (random value).
Since the brush collector assembly in question may be in the operable or the inoperable state, the following identity holds for any time t:
P t + F t = 1 ,
where F(t) = P{τt} is the distribution function of the operating time τ to failure (the probability that the BCA will fail in time t).
The average MTBF or mathematical expectation of the failure-free operation of the BCA is:
T 0 = 0 t f t d t = 0 P t d t .
Another numerical characteristic of reliability is the service life dispersion to failure:
D = 0 t T 0 2 f t d t .
The operation principle of the complex mathematical model proposed by the authors can be demonstrated by means of the algorithm shown in Figure 5. Below is a description of the work of the algorithm used for the analysis of the experiments to identify defects in the brush collector assembly, which works in the following sequence [35]. The brush collector assembly is characterized by parametric failures and has a continuous input–output algorithm characteristic (Figure 8). Brush parameters are the mass tbrush, height hbrush, and width bbrush. During TEM operation, the brush wear occurs, and thus its radial size and mass, as well as its force acting on the working surface of the collector, change [36].
Failure and recovery are two opposite random events. In practice, during operation and testing, these events are recorded over time. The time intervals between these events are random variables that also characterize the failure probability. The recovery function is numerically equal to the mathematical expectation of the number of recoveries made over the time interval [0, t].
As an example, let us present the dependence of the output parameter as a function of time:
y = y 0 + a 0 t α ,
where a0 is the initial value of the recovery function.
Then, the allowable variation of the parameter Δ = y y 0 = δ is set, by which the average time tf of the brush failure, required to achieve the deviation δ , can be determined. It is denoted by δ/a0 = V. On the basis of (6), we obtain:
t f = δ α 0 1 / α ,
  • where tf is the average time of the brush failure;
  • V is the wear rate of the brush.
The main information required for diagnosing TEMs came from tests and experiments [37,38], during which the failures and defects in BCAs were recorded.

3. Results

In the reliability theory, the normal distribution is used, for example, to describe patterns of failures caused by wear and aging, when failure as a random event is determined by a large number of independent influences. It can be used to describe changes occurring in the system elements that do not have a reserve during operation [36] since brushes used in electric motors are not reserved. The model based on this distribution covers both stages of operation. These are the run-in and normal operation phases.
The probability of the failure-free operation of the control panel can be determined by the probability of control panel failure. The random variable ν(t), i.e., the probability of failures of the control panel during time t, when n failures will occur, can be represented as the ratio of the probability derivative of the failure-free operation to the probability of the failure-free operation. The probability derivative of the failure-free operation in the case of the time t, in turn, is defined as the difference between the probabilities of the failure-free operation in the case of the increment of time d t divided by d t . At the same d n time, it determines the number of failures occurring during time d t . Hence, the probability of BCA failures during time t is determined by the formula:
v t = P t P t P t P t + d t d t P t n t n t + d t N d t n t N = d n d t n t = n t n t ,
P t 1 t n i = 1 n λ i t n ! ,
  • where P(t) is the uptime probability function;
  • ν(t) is the failure rate of the entire brush-collector assembly (brushes, collector, brush holder, pressure plate, and cockerels) in the case of time t;
  • t is the time when n failures will occur;
  • n is the number of brush failures;
  • λi (t) is the failure rate of the i-brush on only one brush holder;
  • N is the number of brushes involved in the experiment.
Failure rates of the brushes in the BCA during application λapp and storage λst are calculated according to the formulas:
λ a p p = λ b × K a s × K a c c × K m o d e ,
λ s t = λ b f × K a c c ,
  • where λb is the basic failure rate of the brush when tested under nominal electrical load and normal temperature conditions;
  • λbf is a brush failure rate according to the results of the persistence tests conducted on the packages of the manufacturing plants;
  • Kas is a coefficient of actual stiffness, taking into account the stiffness degree of the brush application conditions;
  • Kacc is an acceptance coefficient, reflecting the quality level of brush manufacture;
  • Kmode is a mode coefficient, which takes into account the change in the basic failure rate depending on the electrical load and ambient temperature.
This completes the algorithm used for analyzing the experiments on identifying brush defects according to Figure 9.
In the mathematical model proposed by the authors, apart from the distribution function of the total operating time before failure occurrence, an important characteristic of determining the electric brush reliability is the intensity of its failures. The failure rate λ(t) is the conditional probability density of the event consisting of the fact that the brush, which worked without failure up to time t, will fail in the time interval of [t, t + ∆t], which is assumed to be small [39]. Hence, we can see that the probability of the faultless operation of a brush in the interval of [t, t + ∆t] is defined only through λ(t) [13,14].
This algorithm was used to investigate the brush for a certain time interval of [t, t + ∆t], and the reliability calculation was performed according to the obtained data [40]. Then, the brush failure rate λ(t) was considered for the specified time interval of [t, t + ∆t], provided that it did not fail before t. Consequently, the failure rate λ(t) is an interval characteristic of reliability depending on the mileage of the dumper l interval change of the brush failure rate (Figure 9).
The changes in the intensity of the BCA failures are as follows. I is a period of brush lapping; II implies that the operation is divided into two stages (brush wear is less than 50%) (brush wear reaches more than 50% of the height); III is emergency brush wear. The intensity of failures determines the preventive maintenance frequency of the brush. This dependence serves as a criterion used for determining the maintenance frequency, which is set on the basis of technical, economic, and other conditions [41,42].
The approximated results of the failure studies based on calculations using the proposed mathematical model in the case of 202 engines involved in the experiment over a 4-year period in 2019–2022 are presented in Table 3.
The mathematical model was simulated on the basis of the experimental data collected in Kemerovo. The simulation results are presented in the form of a time nomogram of the failure-free operation of the TEM switchgear depending on the brush height during operation [43,44].
Since as a result of the conducted experiments, it was proven that brushes wear out uniformly, the law of normal distribution of a random variable with mathematical expectation t and dispersion σ2(t) of the term T of failure onset was accepted as an approximate law of distribution of the terms of failure t.
On the basis of the statistical data analysis, a polygon of empirical relative frequencies (Figure 10a, curve 1) and theoretical frequencies (Figure 10a, curve 2) and a plot of the calculated normal law distribution function of BCA failures (Figure 10b) were plotted against the collected BCA failure statistics for 2020–2022.
By controlling the parameters of the electric brush operating time t and the brush failure rate λ(t), the recovery function a t allows the prediction of the moment of the BCA failures and the determination of the TEM technical state [45]. The failure flow parameter is a derivative of the restoration function a t :
a t = 1 σ 2 π e t T 2 2 σ 2 ,
  • where a t is the BCA recovery function;
  • t is the time interval before the occurrence of failures in the control panel;
  • T is the time between failures;
  • σ is the standard deviation.
After data processing, when the uniform brush wear was obtained, the normal distribution law in the case of the failure time t was adopted as an approximate distribution law in the case of the failure time (Figure 11).
As an example, let us present the results of the experimental studies (Figure 12) obtained by the authors from 85 units of dump trucks.
The proposed mathematical model uses the calculation–experimental method based on the calculation of reliability, failure, and damage indices according to the experimentally obtained initial data of the TEM [46]. The probability of the failure-free operation during the system operating time t1 ÷ t2, where t1 < t2, provided that it is operable by the interval beginning, is determined by the formula:
P t 1 , t 2 = exp 0 t 2 λ t d t exp 0 t 1 λ t d t .
The failure-free operation probability decreases when the operating time increases:
Q ( t ) = 1 P t = F t = a t
where F(t) is the integral function of the operation time to failure.
Figure 13 shows the probability curves of the failure-free operation P(t) of the EG61AK brushes that are calculated on the basis of the data on brush operation.
The probability of the failure-free operation as a function of time is obtained by a successive multiplication of P Δ τ l values for each time interval Δτi:
P P R ( τ ) = l 1 n P Δ τ l ν l .
After operating for a random time τ1, the ACS fails and is replaced with a new one, which, after operating for a time τ2, fails and is replaced with a new one again, and so on. It follows that τi (I = 1, 2, …) are independent and equally distributed random variables with the distribution function F(t) [47].
Let us determine the brush wear rate for each time interval Δτi taking into account the number of motor starts during this interval:
ν l = f Δ τ l .
Hence, after determining the brush wear rate, let us find the probability of the failure-free operation of the brush collector assembly sequentially for each time interval per one turn-on [8]:
P Δ τ l = 1 Q Δ τ l ν l ,
where Q Δ τ l is the failure probability; ν l is the wear rate.
Figure 9, Figure 10, Figure 11, Figure 12 and Figure 13 present the mathematical model of data processing to estimate such parameters as the wear time (t), failure-free brush operation (T), the determination of the truck mileage (l), and the brush wear amount (∆h). There is also the probability of the failure-free brush operation (P(t)), the failure rate λ(t), and the remaining brush life until its complete wear. The brush wear rate serves as a function of the operating time (v(t)), the number of engine starts allows conclusions about the brush’s suitability for operation based on its actual technical condition [48]. This significantly reduces time consumption and helps the maintenance personnel find the failure place [48].

4. Discussion

Analyzing the obtained mathematical model using the algorithm for analyzing the experiments conducted to detect defects (Figure 8) when determining and predicting the reliability of the brush collector unit and bearings of the DC traction motor allows the estimation of specific parameters. These are the time of wear and the failure-free operation of the brush, the optimal mileage determination of the dump truck by the brush wear value, and the probability of the failure-free operation of the brushes. The parameters also include the residual life of the brushes up to the permissible wear limit, the wear rate of the brushes depending on the wear and tear of the brushes. According to the results of the modeling and the algorithm used for determining the technical condition of the brushes (Figure 6), one can make conclusions about the serviceability of the brush according to its actual technical condition.
To implement this model, as a result of analyzing the data on the operation of the traction motors of BELAZ dump trucks, the percentage of failures associated with brush wear was determined. To verify the accuracy and reliability of the predictions of the mathematical model, we performed validation on real scenarios. For this purpose, we used the method of split data sets, in which part of the data was used for forecasting and the rest of the data were used for validation.
On the basis of the model and conducted experiments, the nomogram presented in Figure 12 was obtained, which demonstrates that the average operation time of the brushes before failures T increased, the intensity of failures λ ( t ) decreased, and the probability of brush failures Q ( t ) decreased. Knowing the brush wear (Figure 9) allows one to correct and optimally choose the mileage of the dump truck before maintenance, thus providing recommendations obtained from the planned preventive repair system for the system of repairs according to the actual condition (Table 1).
Knowing the wear height of the brushes under real operating modes and during the constant monitoring of diagnostic parameters allows the monitoring of the BCA condition, determining the presence of harmful operational factors: vibration of the whole assembly, collector runout, and brush pressure force. These parameters can be included in the target function characterizing the process of the technical state degradation of BCA and the whole TEM.
Therefore, an effective and convenient method intended for diagnosing and predicting the reliability of brush collector assemblies of DC traction motors was created. The proposed mathematical model increases the accuracy of determining the technical resource forecast, providing the possibility of remote diagnostics. At the same time, the procedure of diagnostics is simplified (not requiring the dismantling of the electric motor).
As a possibility of continuous control over the parameters of vibration and wear of the brushes during operation (Figure 8 and Figure 11), the BCA technical condition using the complex contributes to using the method when the brush life can be forecasted on the basis of one chosen parameter of the technical condition: the brush wear height. This allows the achievement of the obtained results of determining the actual technical condition of the brush, BCA, and TEM, which were not previously obtained using existing methods.
In the course of the experimental studies aimed at revealing the methods of increasing the technical BCA life, the authors made important design changes. These are the use of brush holders equipped with a coil spring and discharge plate, new brushes with increased wear resistance, switching ability, a rotary brush holder crosshead, collectors containing bimetallic collector plates [8], and bearings covered with a hard antifriction coating [10]. The use of artificial intelligence and machine learning models will be the future continuation of this research work. Sophisticated nonlinear machine learning methods, such as support vector regression, “random regression forests”, will be used, which will provide a better prediction of the reliability of the brush collector assembly of dump trucks. The application of the brush holders equipped with the coiled spring and discharge plate allowed constant pressure to be exerted on the brush, improving the switching of the devices and increasing the service life of the brushes. The main limitation of the model is that it is statistical, i.e., it is based on probability theory and mathematical statistics. Therefore, we can use it to estimate the average brush resource. In addition to the diagnostic methods used for determining the brush life, we can make a prediction for each particular node.
Transforming the obtained research results into potential economic benefits allows us to conclude that, during a more accurate utilization of the electric motor brush life, a company operating 150 heavy-duty coal dump trucks can save about USD 170,000 per year by predicting and preventing unscheduled downtime using this model. Such quantitative figures may be of interest to industry participants.

5. Conclusions

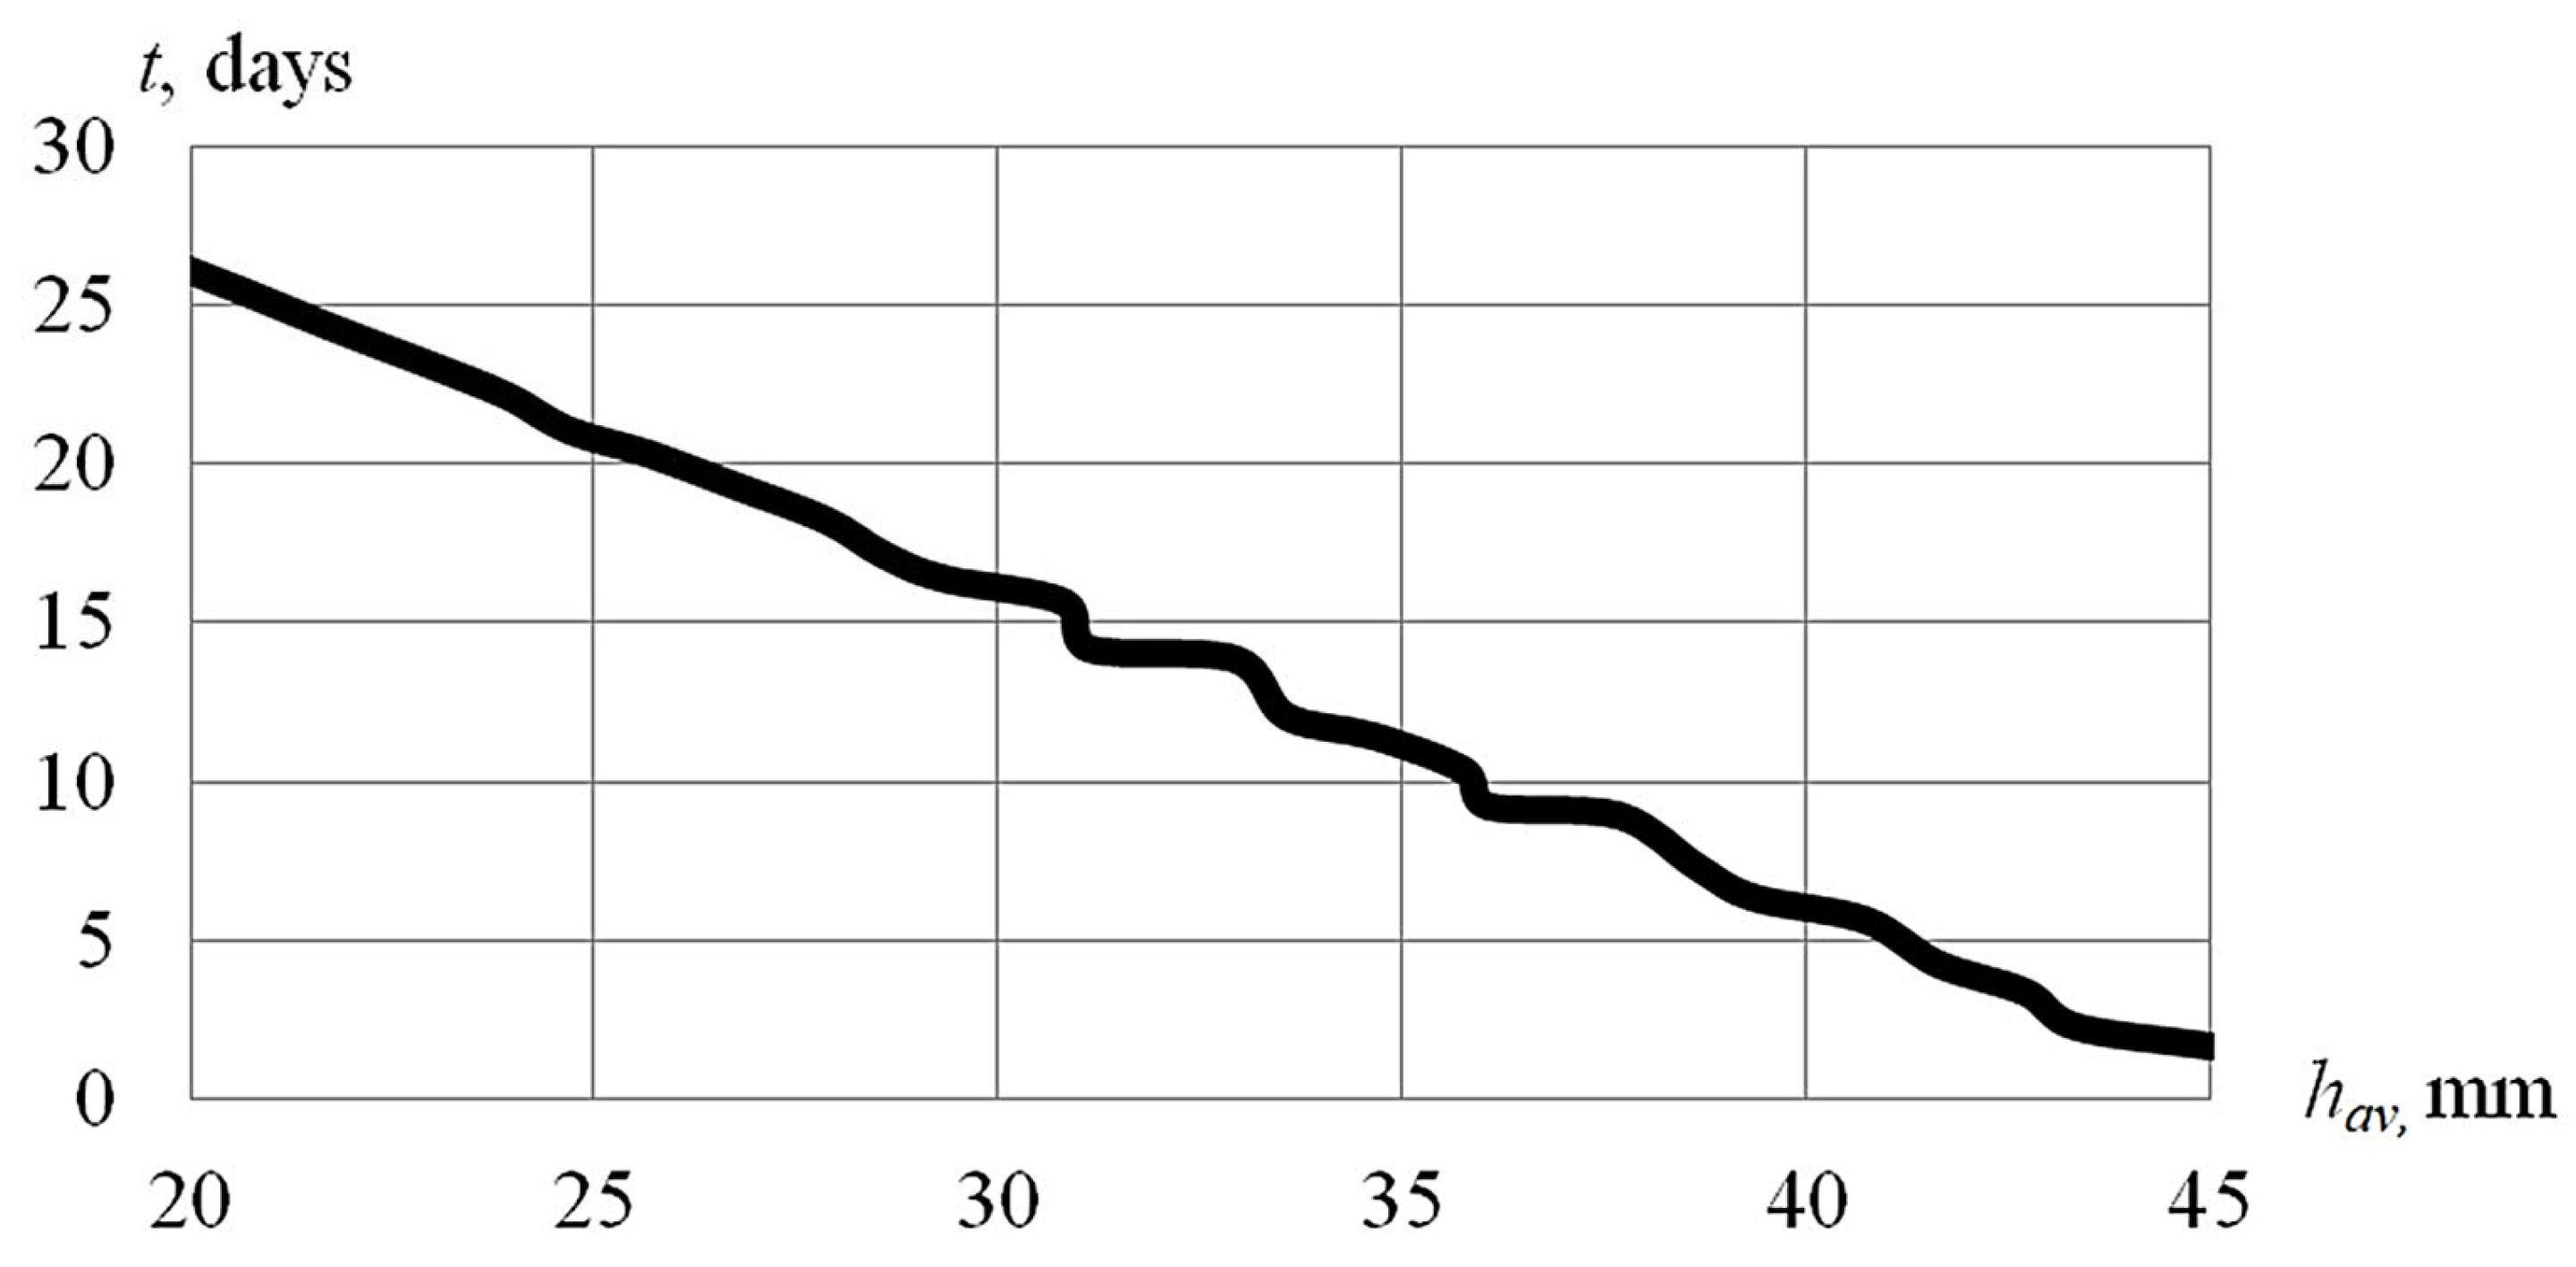
  • Using the proposed mathematical model, the brush operation reliability was investigated and calculated; the minimum brush height required for the operation, the average wear rate, the mean square deviation, and the mathematical expectation of brush wear were determined. A nomogram of the brush collector assembly uptime as a function of the brush height required for the operation was modeled.
  • The results of calculating and forecasting the residual life of the electric motor brushes are suggested to be implemented not only in the design of new dump trucks produced by JSC “BELAZ” but also directly by the operating enterprises performing maintenance and modernization of their fleet of dump trucks, whose electric drive, for some reason, has failed or does not meet the technical characteristics.
  • The choice of the residual life prediction method was established to be justified by the accuracy and reliability of the data obtained during the experiments and operation, as well as by the requirements for the accuracy and reliability of the predicted service life of the BCA when it is further exploited. In this case, it is necessary to have a system for monitoring its technical condition.
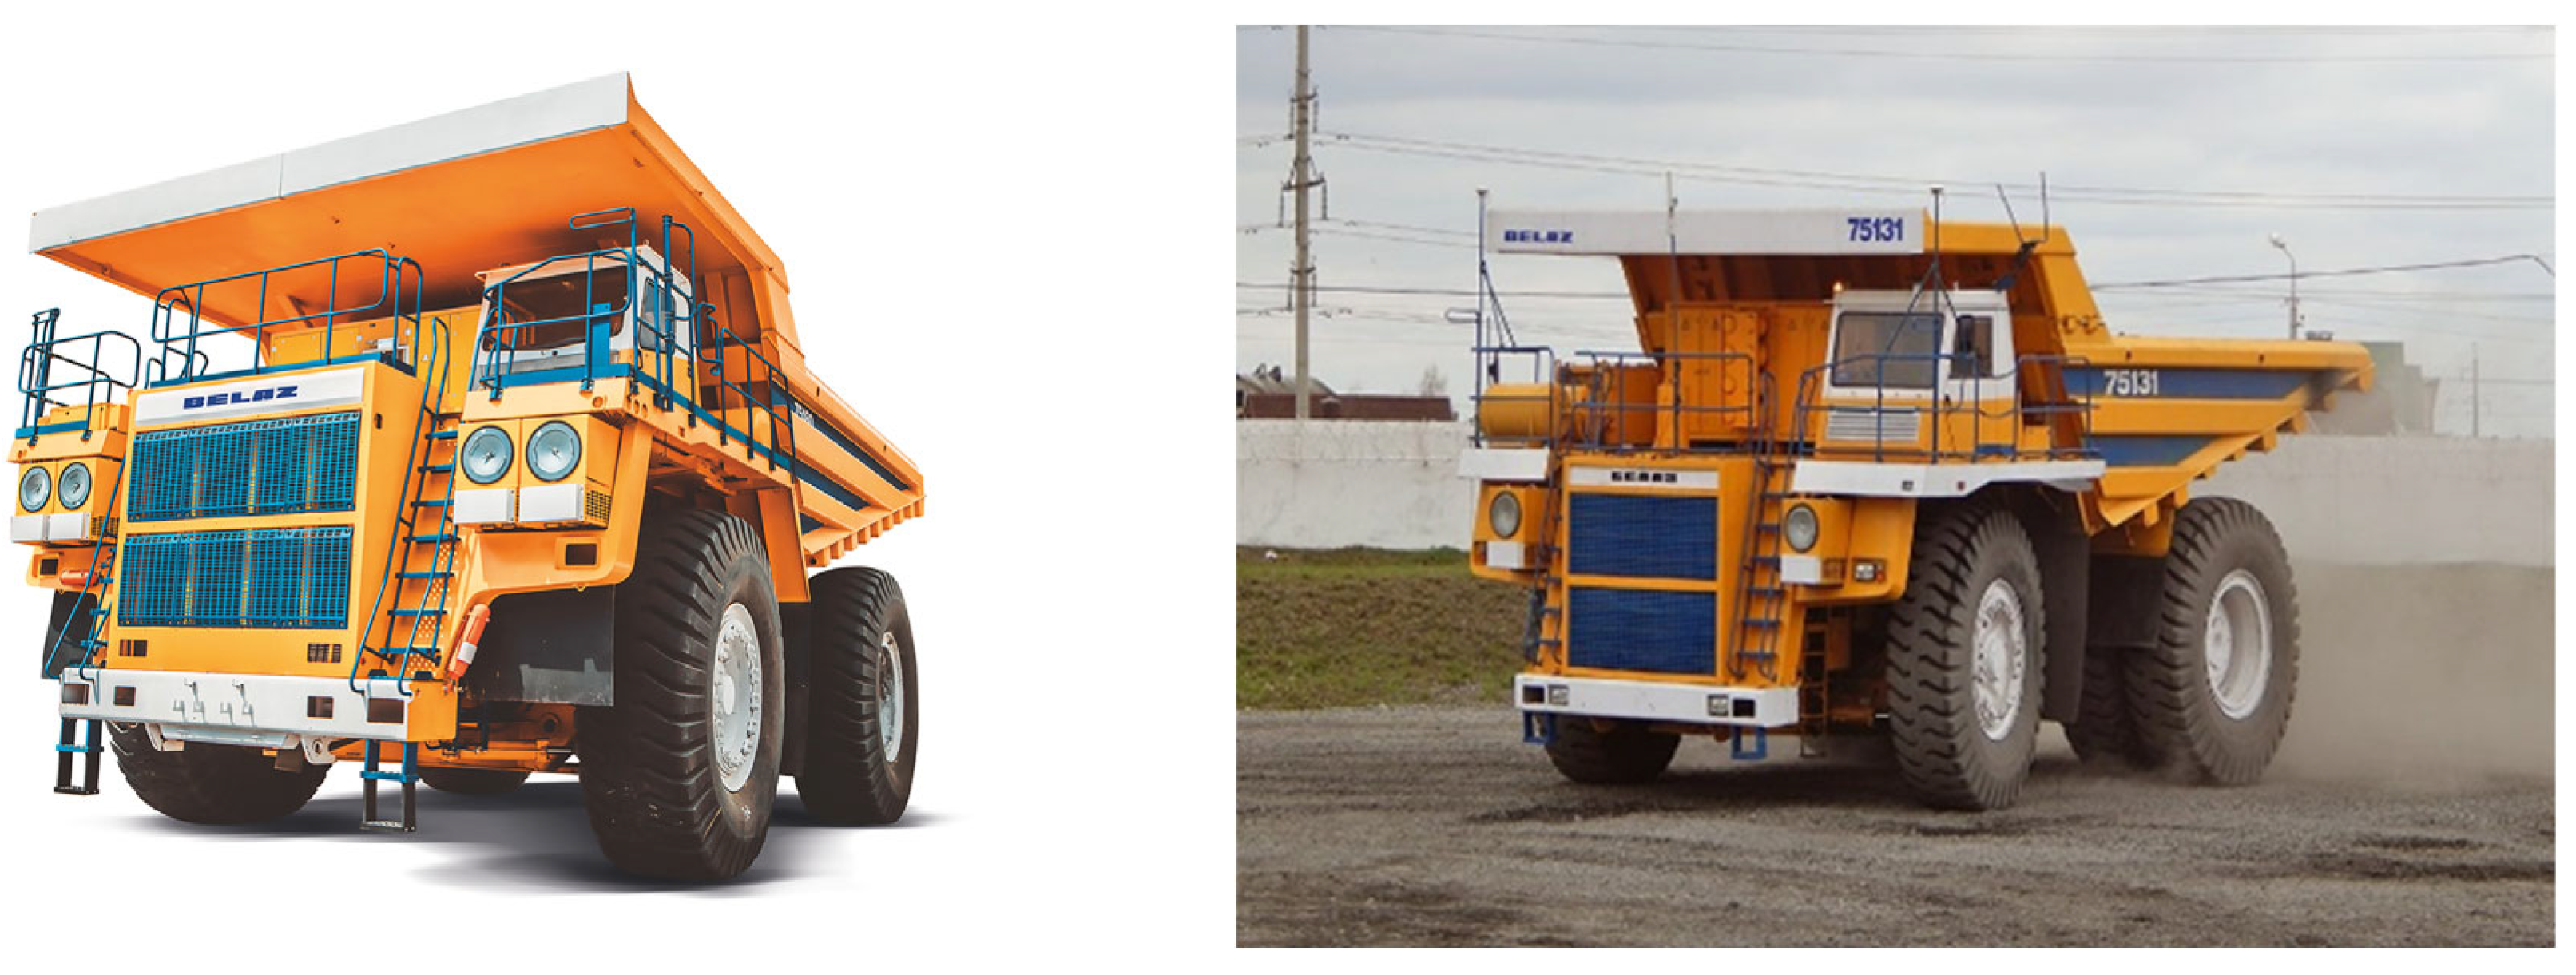
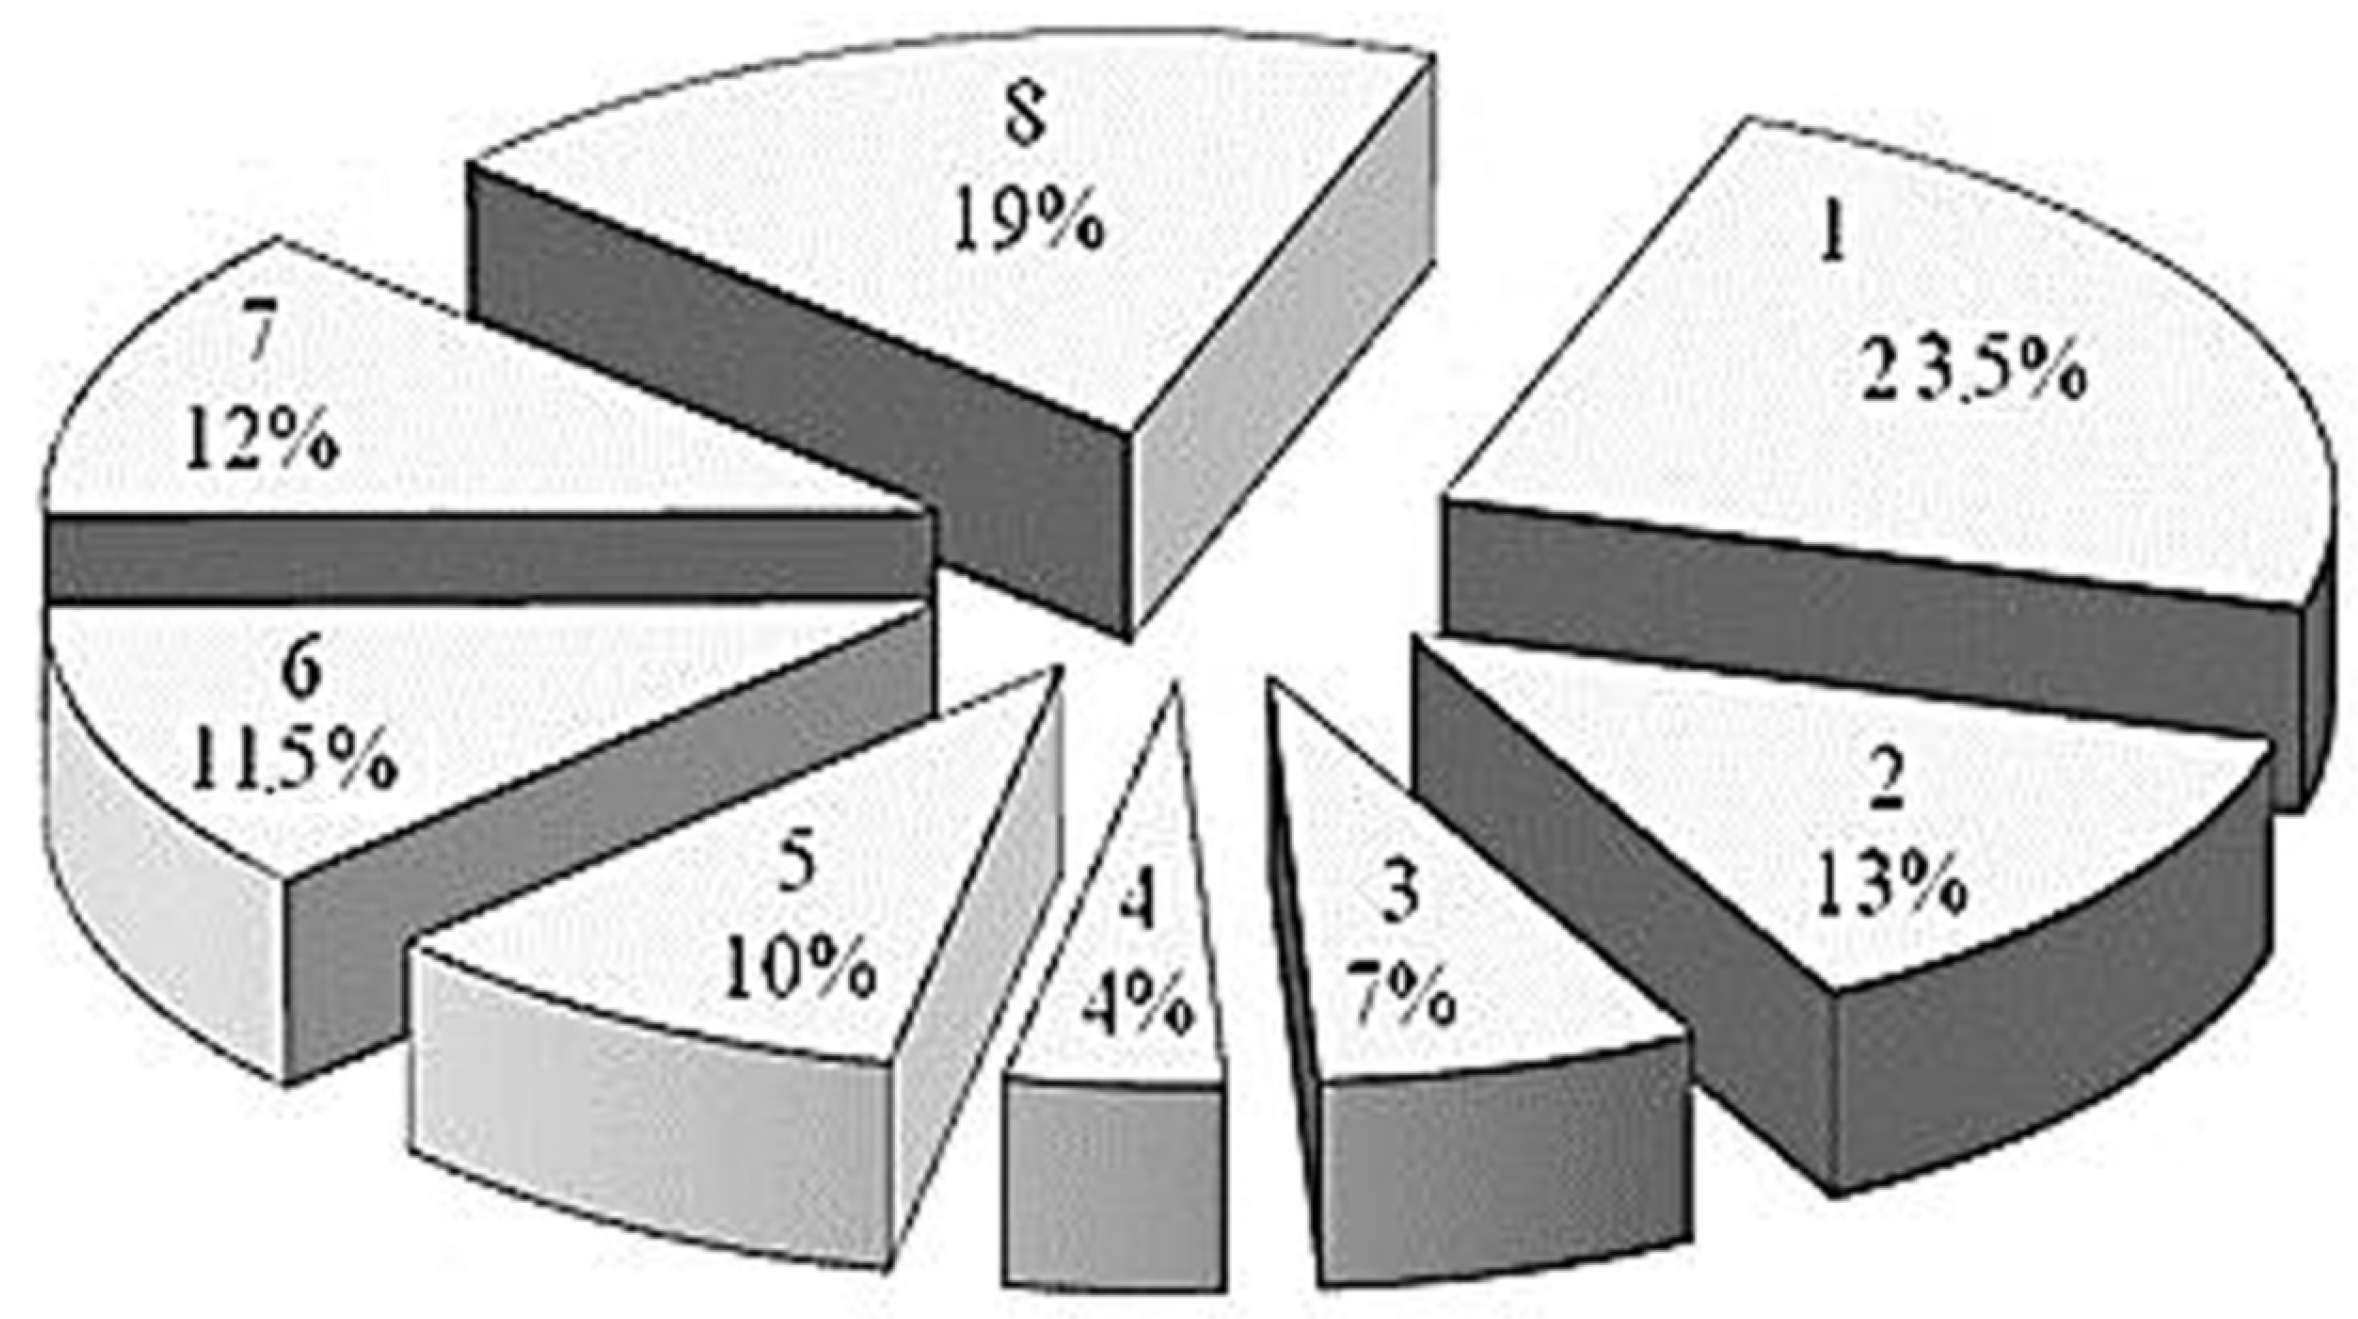
  • As a result of analyzing the data on the operation of the traction motors EDP-800 of the BelAZ dump trucks, a high percentage of failures related to the wear of the brushes was revealed.
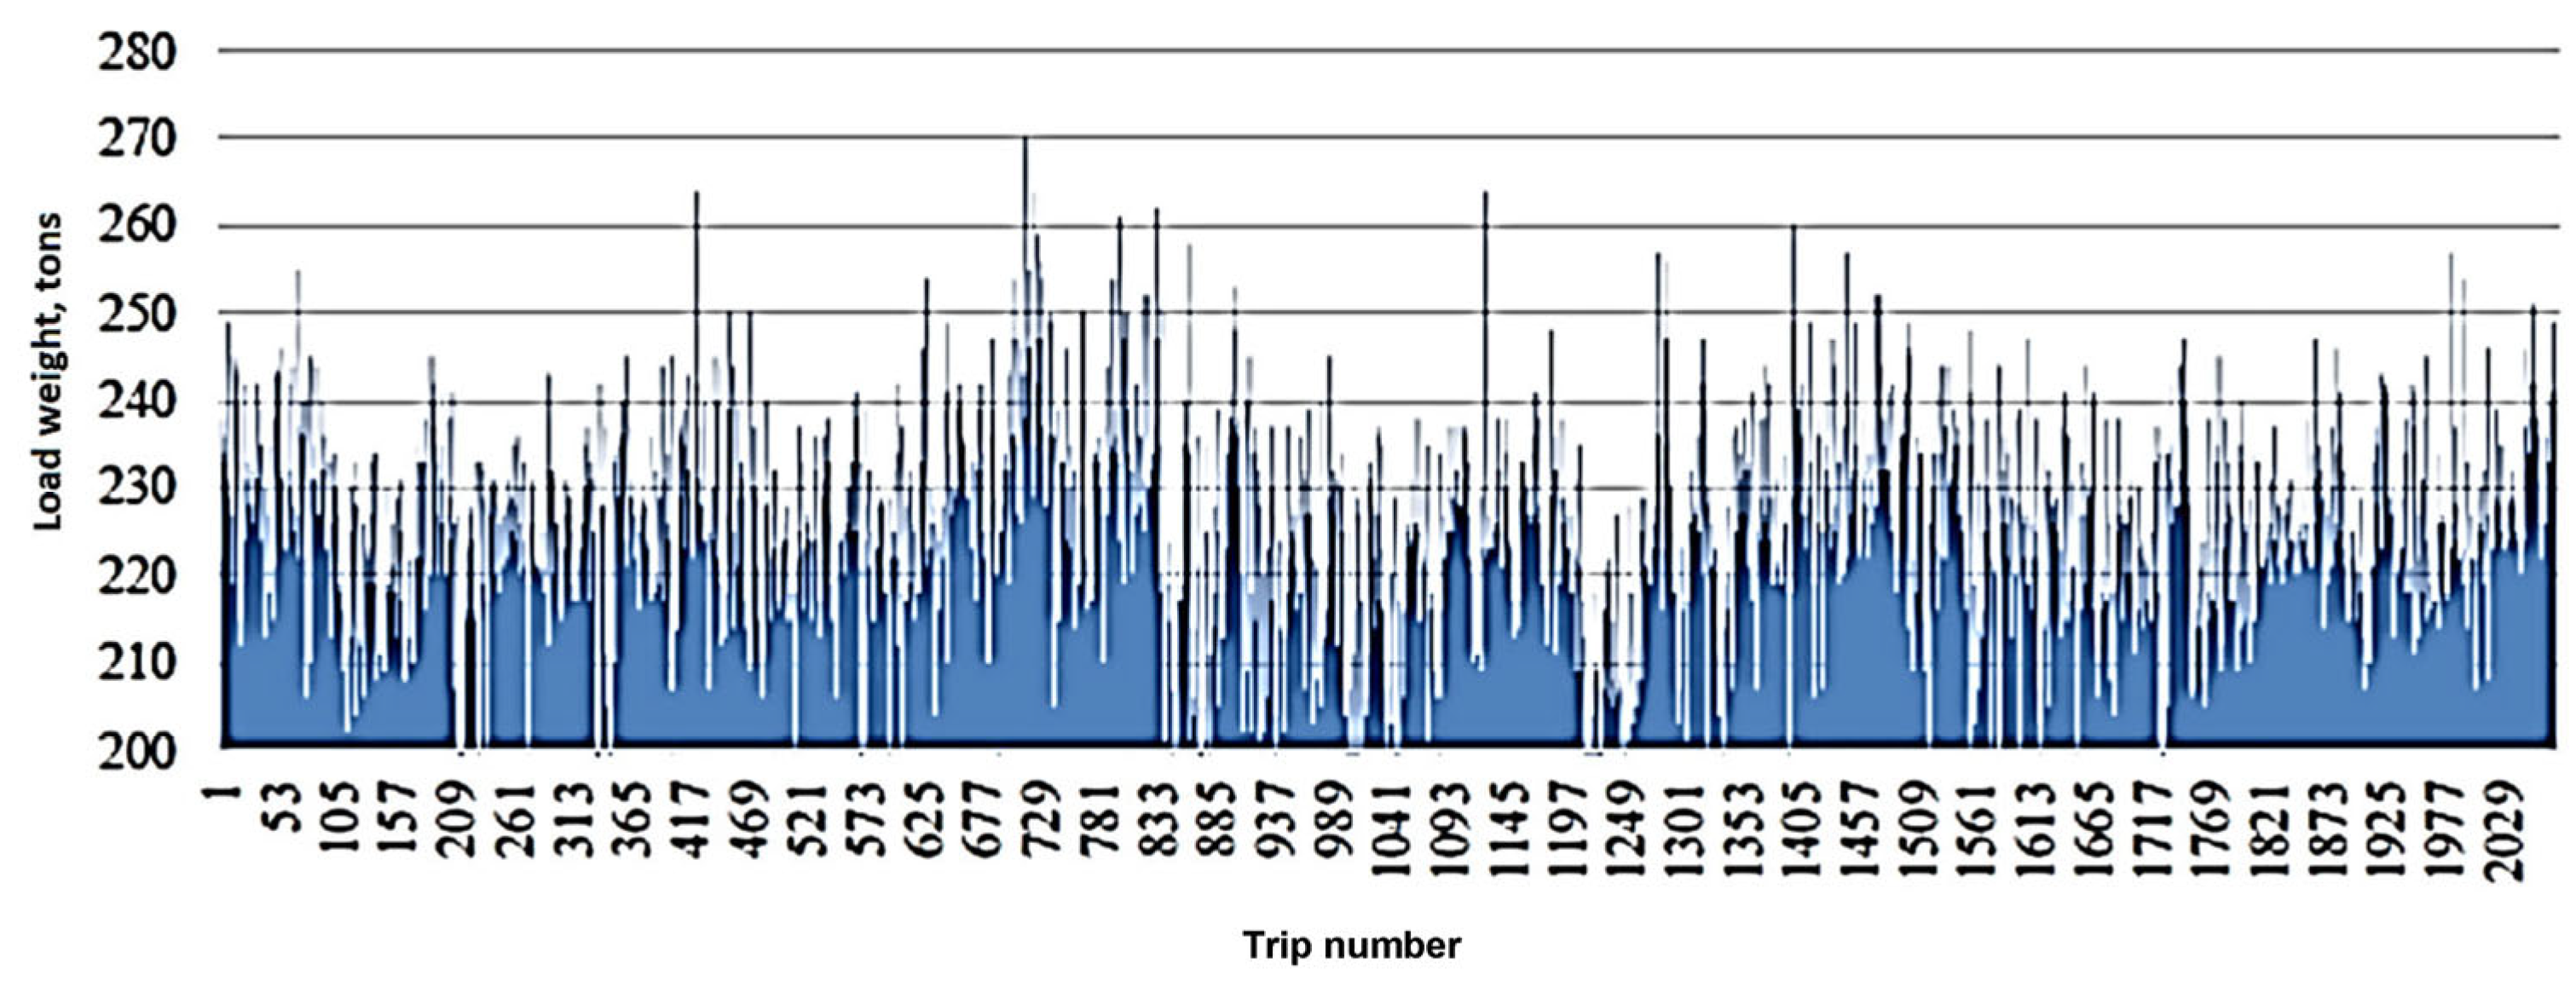
  • The presented mathematical model of data processing allowed the evaluation of such parameters as the wear time and the failure-free operation of the brush, determining the vehicle mileage and the brush wear amount; the probability of the failure-free operation of the brush; the flow of failures; the remaining life of the brush before its complete wear; and the wear rate of the brush depending on the operation time. These allow conclusions about the suitability of the brush for the work in its actual technical condition.
  • Future research will include collecting new technical information and a processing platform created on the basis of artificial intelligence and deep machine learning intended for processing more parametric information to determine the proportion and minimizing the number of random failures.

Author Contributions

Conceptualization, O.A.F., B.V.M. and N.V.M.; methodology, S.N.S. and E.A.E.; software, M.Q.; validation, S.N.S. and E.A.E.; formal analysis, S.N.S. and E.A.E.; investigation, D.V.V.; resources, D.V.V.; data curation, D.V.V.; writing—original draft preparation, O.A.F., B.V.M. and N.V.M.; writing—review and editing, O.A.F., B.V.M. and N.V.M.; visualization, M.Q. All authors have read and agreed to the published version of the manuscript.

Funding

This research received no external funding.

Data Availability Statement

The data presented in this study are available from the corresponding authors upon reasonable request.

Conflicts of Interest

The authors declare no conflict of interest.

References

  1. The Program for the Development of the Coal Industry in Russia for the Period Up to 2035 (Approved by the Order of the Government of the Russian Federation Dated June 13, 2020 no. 1582-r). Ministry of Energy of the Russian Federation. Available online: https://minenergo.gov.ru/node/433 (accessed on 25 August 2023).
  2. Sychev, Y.A.; Kostin, V.N.; Serikov, V.A.; Alad’in, M.E. Analysis of non-sinusoidal regimes in power supply systems of mining enterprises with a non-linear load and capacitor units. Min. Inform. Analyt. Bull. 2023, 1, 159–179. [Google Scholar] [CrossRef]
  3. Khazin, M.L.; Apakashev, R.A. Mining dump trucks running on hydrogen fuel. Min. Inform. Analyt. Bull. 2022, 1, 47–59. [Google Scholar] [CrossRef]
  4. Makarova, I.; Mavlyautdinova, G.; Mavrin, V.; Makarov, D.; Barinov, A. Improving the Environmental Friendliness of the Mining Complex Through Alternative Fuel for Mine Dump Trucks. Transp. Res. Procedia 2023, 68, 755–760. [Google Scholar] [CrossRef]
  5. Siami-Irdemoosa, E.; Dindarloo, S.R. Prediction of fuel consumption of mining dump trucks: A neural networks approach. Appl. Energy 2015, 151, 77–84. [Google Scholar] [CrossRef]
  6. Komissarov, A.P.; Lagunova, Y.A.; Nabiullin, R.S.; Khoroshavin, S.A. Digital model of the process of excavation of rocks by the working equipment of a quarry excavator. Min. Inform. Analyt. Bull. 2022, 4, 156–168. [Google Scholar] [CrossRef]
  7. Abramov, B.I.; Ivanov, A.G.; Shilenkov, V.A.; Kuzmin, I.K.; Shevyrev, Y.V. Electric drive of modern mine hoisting machines. Min. Inform. Analyt. Bull. 2022, 5-2, 145–162. [Google Scholar] [CrossRef]
  8. Kosmodamiansky, A.S.; Inkov, Y.M.; Menshchikov, I.A.; Batashov, S.I. Diagnostics of Traction Electric Motors of Electric Rolling Stock Using Artificial Neural Networks. Russ. Electr. Eng. 2022, 93, 576–583. [Google Scholar] [CrossRef]
  9. Ekanayake, S.; Dutta, R.; Rahman, M.F.; Xiao, D. Direct torque and flux control of interior permanent magnet synchronous machine in deep flux-weakening region. IET Electr. Power Appl. 2018, 12, 98–105. [Google Scholar] [CrossRef]
  10. Yu, Y.; Cong, L.; Tian, X.; Mi, Z.; Li, Y.; Fan, Z.; Fan, H. A stator current vector orientation based multi-objective integrative suppressions of flexible load vibration and torque ripple for PMSM considering electrical loss. CES Trans. Electr. Mach. Syst. 2020, 4, 161–171. [Google Scholar] [CrossRef]
  11. Martyushev, N.V.; Malozyomov, B.V.; Sorokova, S.N.; Efremenkov, E.A.; Qi, M. Mathematical Modeling the Performance of an Electric Vehicle Considering Various Driving Cycles. Mathematics 2023, 11, 2586. [Google Scholar] [CrossRef]
  12. Kachin, O.S.; Karakulov, S.A.; Serov, A.B. An Analysis of the Main Factors on the Wear of Brushes for Brush-Type Motors and the Ways of Increasing their Lifetime. Appl. Mech. Mater. 2015, 792, 107–112. [Google Scholar] [CrossRef]
  13. Meskhi, B.C.; Pleshko, M.S.; Voinov, I.V.; Kaishau, Z.Z. Ensuring the safe operation of transport tunnels based on predictive modeling of intensive geomechanical processes. Min. Inform. Analyt. Bull. 2020, 8, 86–96. [Google Scholar] [CrossRef]
  14. Mao, Y.; Zuo, S.; Cao, J. Effects of Rotor Position Error on Longitudinal Vibration of Electric Wheel System in In-Wheel PMSM Driven Vehicle. IEEE/ASME Trans. Mechatron. 2018, 23, 1314–1325. [Google Scholar] [CrossRef]
  15. Gerike, P.B.; Gerike, B.L. Formation of a single diagnostic criterion for assessing the technical condition of mining equipment. Min. Equip. Electromech. 2021, 2, 17–22. [Google Scholar]
  16. Malozyomov, B.V.; Martyushev, N.V.; Sorokova, S.N.; Efremenkov, E.A.; Qi, M. Mathematical Modeling of Mechanical Forces and Power Balance in Electromechanical Energy Converter. Mathematics 2023, 11, 2394. [Google Scholar] [CrossRef]
  17. Moskvichev, V.V.; Kovalev, M.A. Investigation of the reliability indicators of the main groups of equipment for open-pit hydraulic excavators. Min. Inform. Analyt. Bull. 2021, 7, 96–112. [Google Scholar] [CrossRef]
  18. Gerike, P.B. On a single diagnostic criterion for detecting defects in electrical machines according to the parameters of mechanical vibrations. Bull. Ural. State Min. Univ. 2019, 2, 100–106. [Google Scholar]
  19. Khodayar, M.E.; Wu, L.; Li, Z. Electric Vehicle Mobility in Transmission-Constrained Hourly Power Generation Scheduling. IEEE Trans. Smart Grid 2013, 4, 779–788. [Google Scholar] [CrossRef]
  20. Abu-Abed, F.N.; Martynov, D.V.; Sergienko, S.V.; Kordyukov, R.Y. Simulation model for evaluating the performance of the repair and diagnostic complex. Softw. Prod. Syst. 2015, 5, 107–116. [Google Scholar] [CrossRef]
  21. Bolvashenkov, I.; Herzog, H.G. Use of Stochastic Models for Operational Efficiency Analysis of Multi Power Source Traction Drives. In Proceedings of the 2016 Second International Symposium on Stochastic Models in Reliability Engineering, Life Science and Operations Management (SMRLO), Beer Sheva, Israel, 15–18 February 2016; pp. 124–130. [Google Scholar] [CrossRef]
  22. Aldannawy, H.; Rouabhi, A.; Gerbaud, L. Percussive drilling: Experimental and numerical investments-tigations. Rock Mech. Rock Eng. 2022, 55, 1555–1570. [Google Scholar] [CrossRef]
  23. Vinogradov, A.B.; Gnezdov, N.E.; Zhuravlev, S.V.; Sibirtsev, A.N. Results of development and testing of a set of electrical equipment for a mining dump truck with a carrying capacity of 240 tons. J. Electr. Engin. 2015, 3, 39–45. [Google Scholar]
  24. Faessler, B.; Kepplinger, P.; Petrasch, J. Field testing of repurposed electric vehicle batteries for price-driven grid balancing. J. Energy Storage 2019, 21, 40–47. [Google Scholar] [CrossRef]
  25. Zhang, W.; Yang, J.; Zhang, W.; Ma, F. Research on regenerative braking of pure electric mining dump truck. World Electr. Veh. J. 2019, 10, 39. [Google Scholar] [CrossRef]
  26. Martyushev, N.V.; Malozyomov, B.V.; Sorokova, S.N.; Efremenkov, E.A.; Valuev, D.V.; Qi, M. Review Models and Methods for Determining and Predicting the Reliability of Technical Systems and Transport. Mathematics 2023, 11, 3317. [Google Scholar] [CrossRef]
  27. Isametova, M.E.; Nussipali, R.; Martyushev, N.V.; Malozyomov, B.V.; Efremenkov, E.A.; Isametov, A. Mathematical Modeling of the Reliability of Polymer Composite Materials. Mathematics 2022, 10, 3978. [Google Scholar] [CrossRef]
  28. U.S. Department of Transportation. 2017 NHTS Data User Guide; Federal Highway Administration Office of Policy Information: Washington, DC, USA, 2018; Volume 2018.
  29. Zhang, P.; Qian, K.; Zhou, C.; Stewart, B.G.; Hepburn, D.M. A methodology for optimization of power systems demand due to electric vehicle charging load. IEEE Trans. Power Syst. 2012, 27, 1628–1636. [Google Scholar] [CrossRef]
  30. Martyushev, N.V.; Malozyomov, B.V.; Sorokova, S.N.; Efremenkov, E.A.; Qi, M. Mathematical Modeling of the State of the Battery of Cargo Electric Vehicles. Mathematics 2023, 11, 536. [Google Scholar] [CrossRef]
  31. Billinton, R.; Allan, R.N. Reliability Evaluation of Power Systems, 2nd ed.; Springer: Boston, MA, USA, 1996. [Google Scholar]
  32. Adefarati, T.; Bansal, R.C. Reliability assessment of distribution system with the integration of renewable distributed generation. Appl. Energy 2017, 185, 158–171. [Google Scholar] [CrossRef]
  33. Esau, Z.; Jayaweera, D. Reliability assessment in active distribution networks with detailed effects of PV systems. J. Mod. Power Syst. Clean Energy 2014, 2, 59–68. [Google Scholar] [CrossRef]
  34. Al-Muhaini, M.; Heydt, G.T. Evaluating Future Power Distribution System Reliability Including Distributed Generation. IEEE Trans. Power Deliv. 2013, 28, 2264–2272. [Google Scholar] [CrossRef]
  35. Billinton, R.; Allan, R.N. System reliability evaluation using probability distributions. In Reliability Evaluation of Engineering Systems; Springer: Boston, MA, USA, 1992; pp. 221–259. [Google Scholar]
  36. Młyńczak, M.; Nowakowski, T.; Restel, F.; Werbińska-Wojciechowska, S. Problems of Reliability Analysis of Passenger Transportation Process. In Proceedings of the European Safety and Reliability Conference, Balkema, Leiden, 2–4 October 2011; pp. 1433–1438. [Google Scholar]
  37. Fricker, J.D.; Whitford, R.K. Fundamentals of Transportation Engineering; A Multimodal Systems Approach; Pearson Education, Inc.: Upper Saddle River, NJ, USA, 2004; pp. 243–276. [Google Scholar]
  38. Levinson, H.S. The Reliability of Transit Service: An Historical Perspective. J. Urban. Technol. 2005, 12, 99–118. [Google Scholar] [CrossRef]
  39. Barabino, B.; Di Francesco, M.; Mozzoni, S. An Offline Framework for the Diagnosis of Time Reliability by Automatic Vehicle Location Data. IEEE Trans. Intell. Transp. Syst. 2016, 18, 583–594. [Google Scholar] [CrossRef]
  40. Barabino, B.; Di Francesco, M.; Mozzoni, S. Time Reliability Measures in Bus Transport Services from the Accurate use of Automatic Vehicle Location raw data. Qual. Reliab. Eng. Int. 2017, 33, 969–978. [Google Scholar] [CrossRef]
  41. Pulugurtha, S.S.; Imran, M.S. Modeling Basic Freeway Section Level-of-Service Based on Travel Time and Reliability. Case Stud. Transp. Policy 2020, 8, 127–134. [Google Scholar] [CrossRef]
  42. Zhao, L.; Guan, H.; Zhang, X.; Zhao, P.; Wang, P. Study on Travel Time Reliability Considering Route Travel Time Boundary. J. South. China Univ. Technol. 2019, 47, 127–135. [Google Scholar]
  43. Tu, Q.; Cheng, L.; Sun, C.; Tang, F.; Li, M. Reliability-Based Network Equilibrium Model with Truncated Stochastic Travel. Time J. Southeast. Univ. 2020, 50, 175–181. [Google Scholar]
  44. Zheng, L.; Hensher, D.A.; Rose, J.M. Willingness to Pay for Travel Time Reliability in Passenger Transportation: A Review and some New Empirical Evidence. Transp. Res. Part. E Logist. Transp. Rev. 2010, 46, 384–403. [Google Scholar]
  45. Malozyomov, B.V.; Martyushev, N.V.; Konyukhov, V.Y.; Oparina, T.A.; Zagorodnii, N.A.; Efremenkov, E.A.; Qi, M. Mathematical Analysis of the Reliability of Modern Trolleybuses and Electric Buses. Mathematics 2023, 11, 3260. [Google Scholar] [CrossRef]
  46. Lacey, G.; Putrus, G.; Bentley, E. Smart EV charging schedules: Supporting the grid and protecting battery life. IET Electr. Syst. Transp. 2017, 7, 84–91. [Google Scholar] [CrossRef]
  47. Salvatti, G.A.; Carati, E.G.; Cardoso, R.; da Costa, J.P.; Stein, C.M.D.O. Electric Vehicles Energy Management with V2G/G2V Multifactor Optimization of Smart Grids. Energies 2020, 13, 1191. [Google Scholar] [CrossRef]
  48. Chakrabarti, S. The Demand for Reliable Transit Service: New Evidence Using Stop Level Data from the Los Angeles Metro Bus System. J. Transp. Geogr. 2015, 48, 154–164. [Google Scholar] [CrossRef]
Figure 1. Exterior view of BELAZ KT30 B-240.
Mathematics 11 04836 g001
Figure 2. Distribution of failures by mining truck systems.
Mathematics 11 04836 g002
Figure 3. Diagram of traction motor malfunctions: 1—breakdown of insulation and interturn short circuits of the armature; 2—melting of solder from collector cockerels; 3—lubricant ingress into the skeleton; 4—beating the collector; 5—damage caused to anchor bearings; 6—low insulation of the windings; 7—breakdown of insulation and interturn short circuits; 8—other malfunctions.
Mathematics 11 04836 g003
Figure 4. Three-dimensional image of the components of the AC-DC BELAZ traction electric drive (1—traction generator; 2—converter cabinet with the control equipment; 3—traction motor; 4—installation of ventilated braking resistors).
Mathematics 11 04836 g004
Figure 5. Data on the BELAZ 75306 dump truck operation depending on the trip number.
Mathematics 11 04836 g005
Figure 6. Algorithm for determining the technical condition of the brush.
Mathematics 11 04836 g006
Figure 7. Dependence of the wear value of the brush hav on time t, days per month.
Mathematics 11 04836 g007
Figure 8. Algorithm intended for analyzing the experiments on identifying defects.
Mathematics 11 04836 g008
Figure 9. Interval change of the BCC failure rate: I—brush lapping period, II—operation; III—brush emergency wear.
Mathematics 11 04836 g009
Figure 10. (a) polygon: 1—empirical frequencies, 2—theoretical frequencies of BCA failures; (b) plot of the calculated normal law distribution function of BCA failures.
Mathematics 11 04836 g010
Figure 11. Nomogram of the brush uptime (brush height during operation).
Mathematics 11 04836 g011
Figure 12. Nomogram of the approximated research results.
Mathematics 11 04836 g012
Figure 13. Probability of the trouble-free operation of the EG61AK brushes with a height of 40 mm (curve 1) and advanced brush holders equipped with composite brushes (curve 2).
Mathematics 11 04836 g013
Table 1. Types and frequency of maintenance.
Type of InspectionEngine Run TimeMileage
Daily maintenance (DMS)
Dump truck maintenance (TM-1)250 h of operation5000 km of tipper mileage
Dump truck maintenance (TM-2)500 h of operation10,000 km mileage of the truck
Dump truck maintenance (TM-3)1000 h of operation20,000 km run of the truck
Seasonal maintenance (SMA)Performed when preparing the truck for spring–summer or autumn–winter operating conditions
Table 2. Technical characteristics of the BELAZ KT30 B-240 dump truck with a 240-ton payload.
Parameter NameValue
Power at the generator output, kW, not more1600
DC bus voltage (at the output of rectifiers), V:
 in traction mode, not more than1000
 in braking mode, not more than1200
Power of the braking resistor unit, kW2 × 1200
Power on the shaft of the asynchronous motor, kW:
 in long traction mode (ultimate)700
 in prolonged braking mode1200
Maximum starting torque on the motor shaft, kNm30
Maximum rotation speed of the asynchronous traction motor, rpm3000
Table 3. Results of the mining truck research.
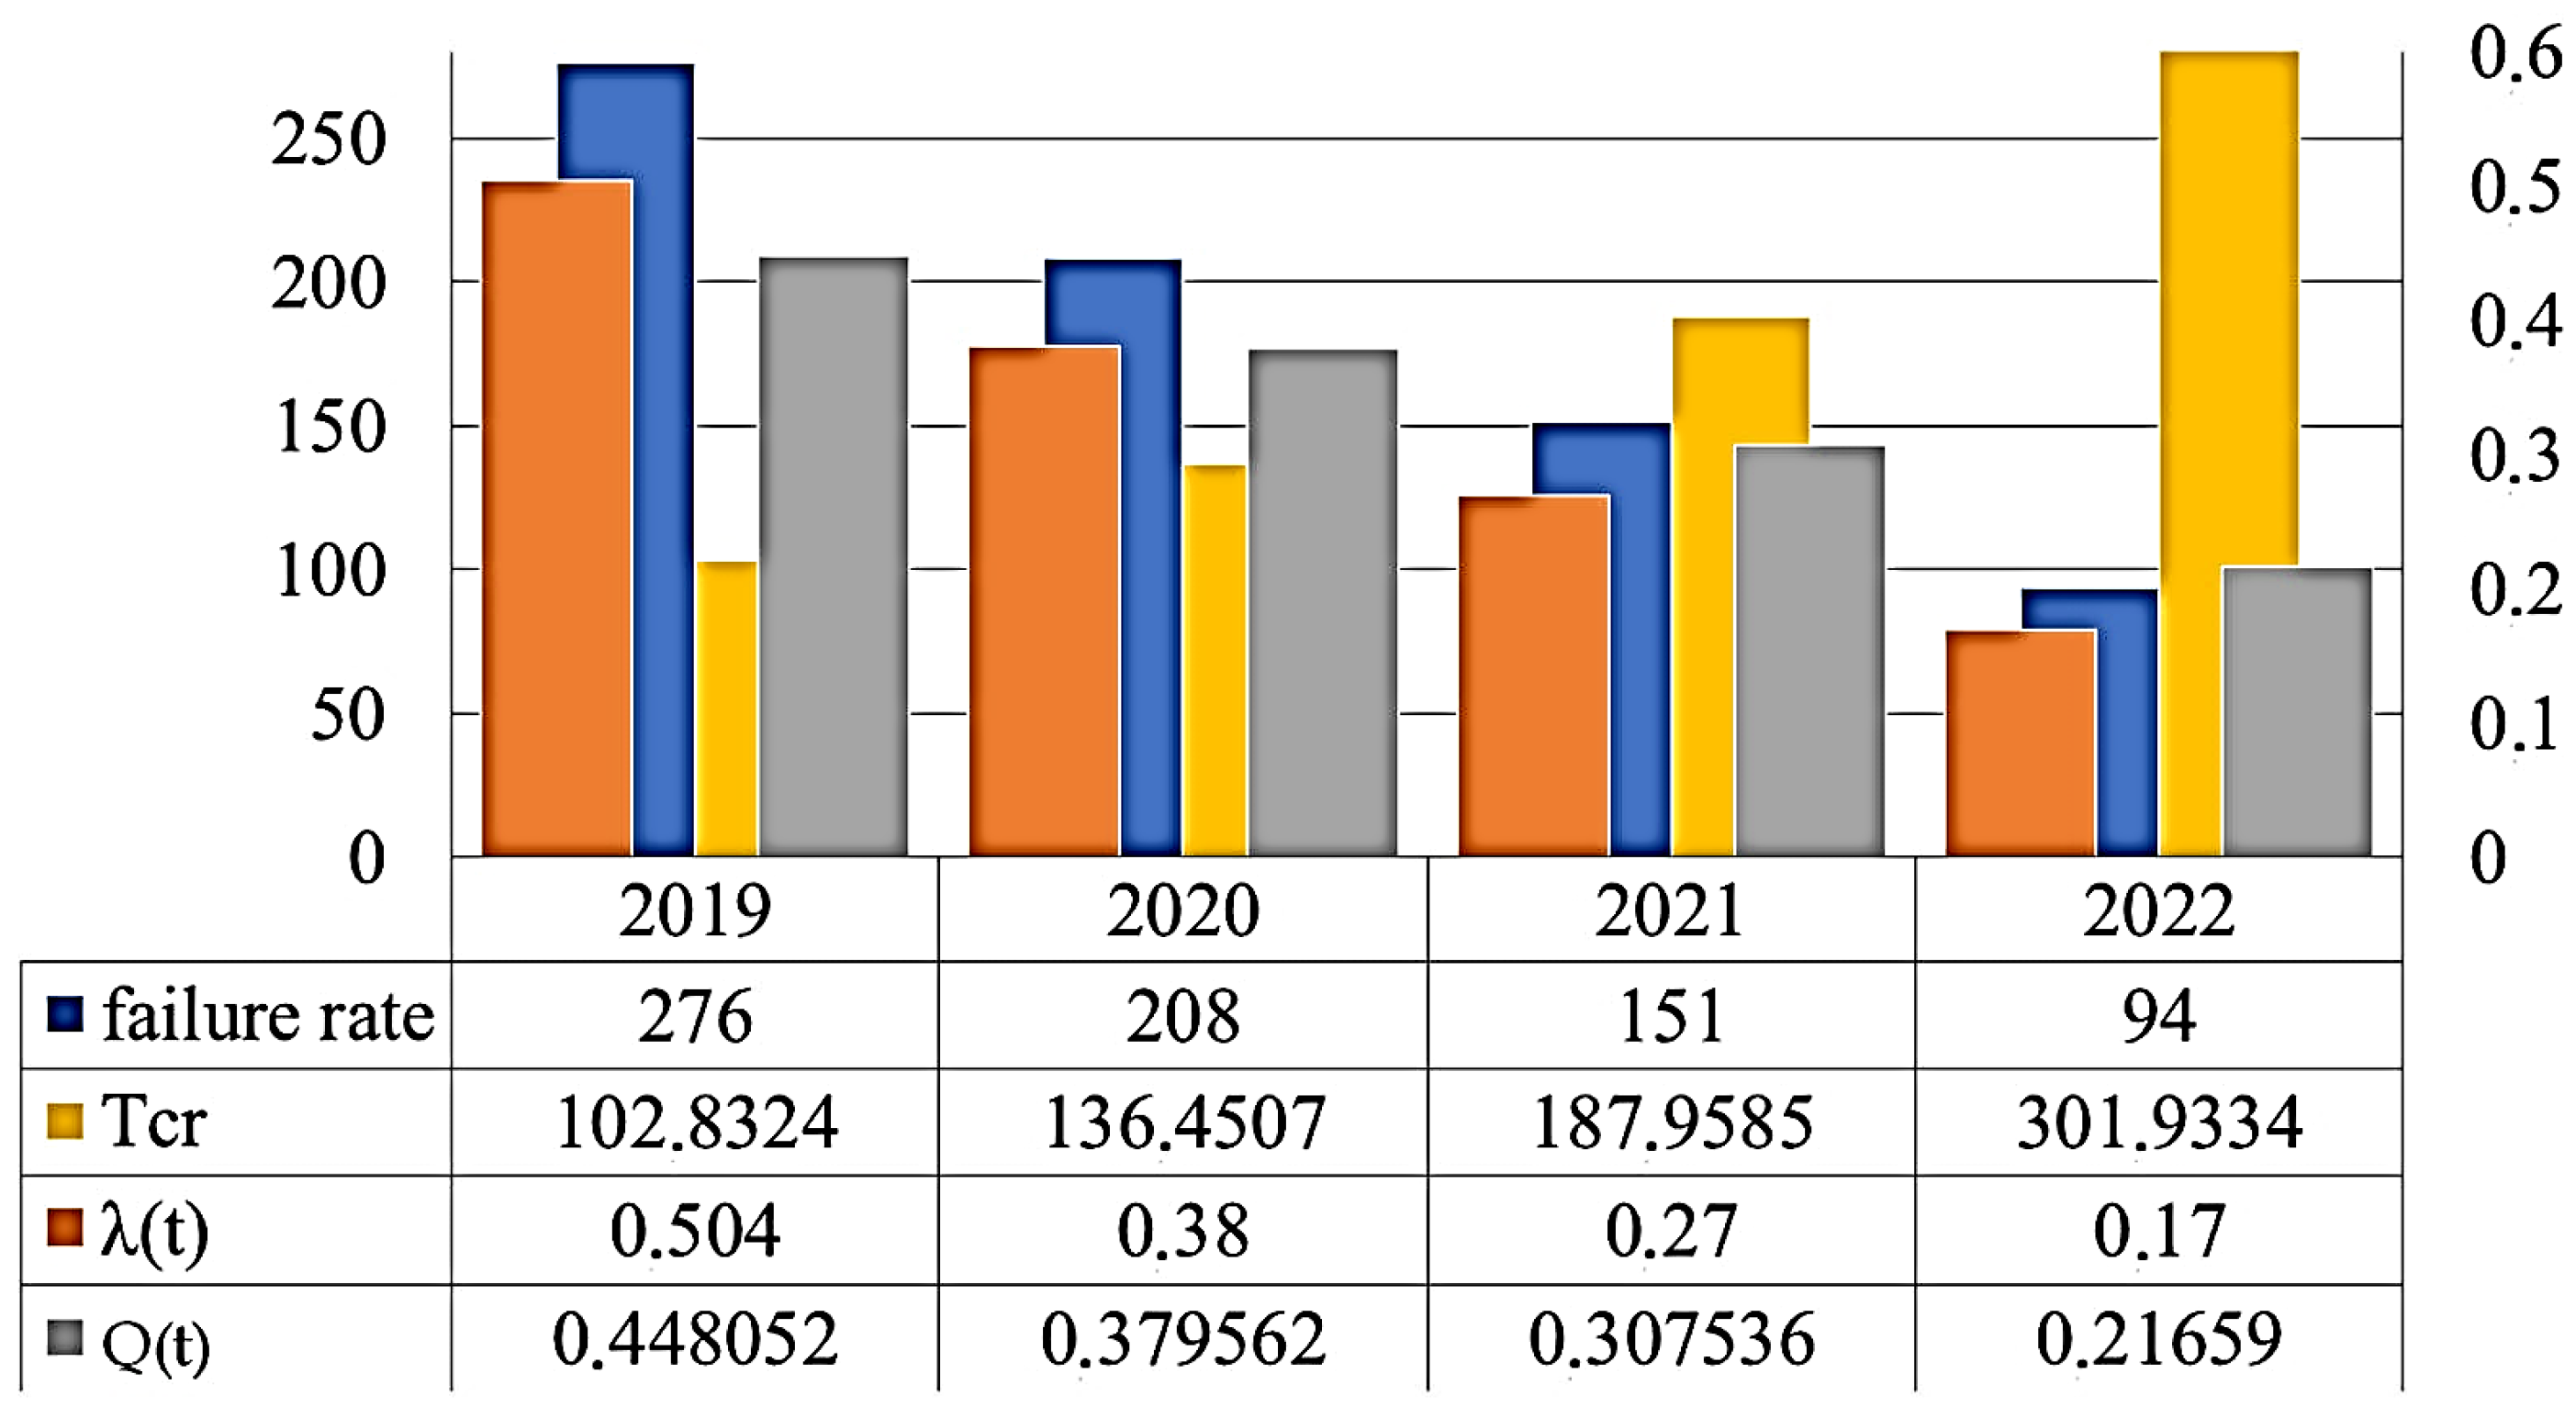
Number of TEMs That Failed Due to the Switchgear and Controlgearλ(t) 1/hP(t)Q(t)Average (Expected) Service Life, Tcf, h
1200.5040.4480520.551948102.8324
600.380.3795620.620438136.4507
220.270.3075360.692464187.9585
200.170.216590.78341301.9334
Disclaimer/Publisher’s Note: The statements, opinions and data contained in all publications are solely those of the individual author(s) and contributor(s) and not of MDPI and/or the editor(s). MDPI and/or the editor(s) disclaim responsibility for any injury to people or property resulting from any ideas, methods, instructions or products referred to in the content.

