Abstract
Vehicular ad hoc networks consist of self-organizing nodes using multi-hop wireless links for communication without any infrastructure support. Traditionally, ad hoc routing protocols use the minimum hop count for their routing metric since a smaller number of transmissions is typically equivalent to a higher throughput, lower delay, and minimal power consumption. However, with the muti-rate capability of emerging radio interfaces, e.g., 802.11ax/be standards, the min-hop metric no longer results in high throughput. For instance, if the higher data rate links are selected for the route, it could result in a higher throughput even if the route takes more hop counts. In this paper, we propose a high throughput routing scheme, called MARV, which makes two key contributions. MARV searches for high throughput paths using an on-demand route searching algorithm so that the routing overhead is smaller compared to other multi-rate-aware routing schemes. MARV also searches for multiple paths to maintain both min-hop and high-throughput paths to select the adequate path depending on the data packet size. We conduct simulations to demonstrate that MARV outperforms not only min-hop path metrics but also previously proposed high-throughput metrics.
MSC:
68M10
1. Introduction
Vehicle-to-vehicle (V2V) communication in autonomous driving is an essential technology to enable driver safety and traffic efficiency [1,2,3,4]. For example, consider the domain of autonomous driving, where precise vehicle localization demands stringent latency requirements [5]. Furthermore, automated navigation systems, which rely on real-time map and traffic information, necessitate minimum throughput for seamless operation [6]. Here, autonomous vehicles can communicate with each other via ad hoc communications, which does not require infrastructure support [7]. However, due to the limited transmission range of wireless interfaces, the vehicles in vehicular networks may need multi-hop transmissions to communicate with each other. In recent years, many routing protocols have been developed to solve the multi-hop routing problem in vehicular ad hoc networks [8,9,10,11,12,13]. Conventional routing protocols take the minimum hop count (min-hop) as the metric for routing. In a single-rate physical environment, min-hop corresponds to the minimum number of transmissions, thus achieving throughput increase, small delay, and low power consumption.
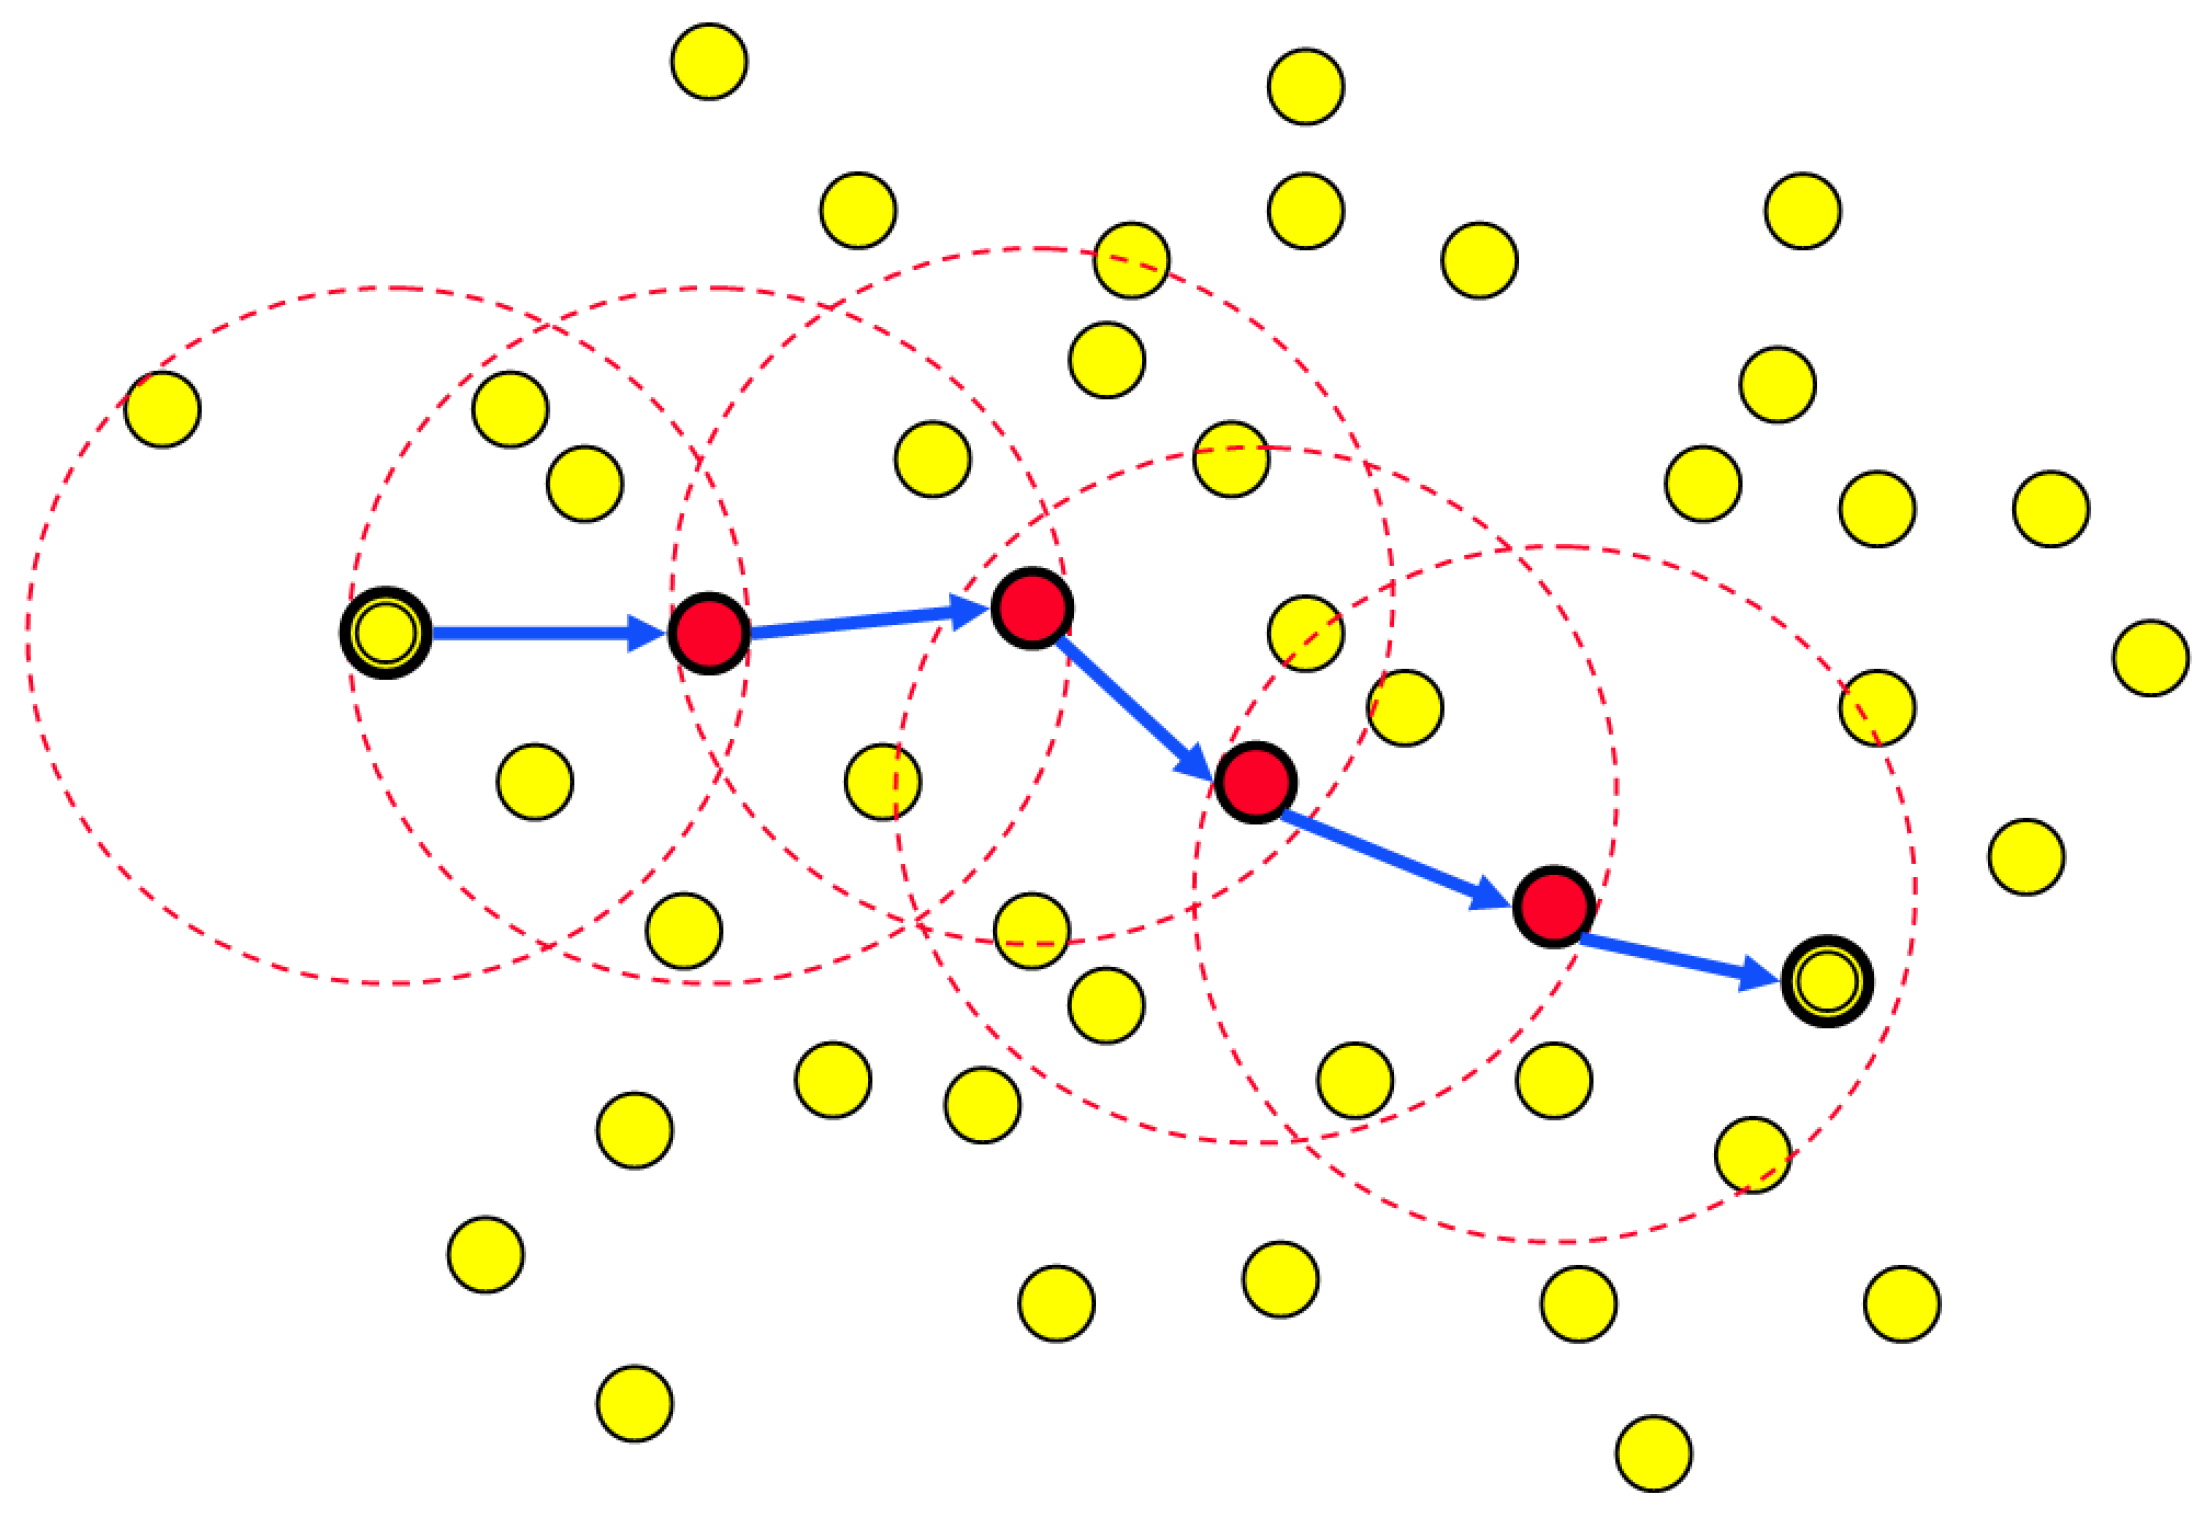
The recent development of wireless devices such as 802.11ax/be standards [14,15] enables high-bandwidth multi-rate capability. In multi-rate physical environments, min-hop routing may cause throughput loss and reliability loss [16]. Figure 1 shows an example of a vehicular ad hoc routing using min-hop as the metric. We can easily see that the min-hop metric normally chooses long distance links. This means that the link’s channel quality is poor, and thus it operates at a low data rate. This results in a large amount of medium time to transmit data, which in turn causes the overall network throughput to decrease. Long-distance links may also cause high bit-error rate (BER), in other words, reliability loss due to the path loss.
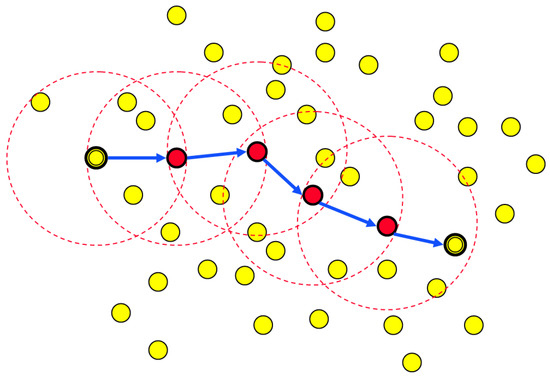
Figure 1.
Source node selects the path to destination using the min-hop metric in a vehicular ad hoc network example.
However, using high-data-rate links does not always produce a higher throughput. There is a strict trade-off between the data rate and the transmission range. The long distance range transmissions must operate at a low data rate while high-data-rate transmissions must run on a short distance range. Accordingly, by selecting high-data-rate links, the ad hoc routing protocol must suffer from an increased number of hops. This tradeoff creates a more complex problem in multi-rate-aware routing protocols.
Furthermore, the packet size is an important factor in selecting the adequate path in multi-rate environments. Since the IEEE 802.11 medium access control (MAC) protocol [17] always spends a certain amount of medium time on the fixed physical (PHY) and MAC overhead, the effective throughput is lower than the physical data rate. Due to this fact, the data rate does not affect much on the throughput of small data packets compared to the large ones. This shows that the adequate path may differ according to the packet size.
In this paper, we propose a high throughput routing scheme called multi-path ad hoc routing protocol for vehicular networks, in short MARV. MARV makes three key contributions. First, MARV searches for high throughput paths using an on-demand routing searching algorithm so that the routing is more effective compared to other multi-rate-aware schemes, which are based on proactive routing [16,18,19]. Here, MARV searches for multiple high-throughput paths while limiting the control overhead. Second, MARV searches for multiple paths to maintain both min-hop and high-throughput paths to select the adequate path depending on the flow size. Third, we conduct extensive experiments to show that MARV outperforms the previous methods in terms of throughput, end-to-end delay, and control overhead.
The remainder of this paper is organized as follows. We briefly review previous work related to multi-rate-aware MAC and ad hoc routing protocols in Section 2. We discuss the main motivation of this paper in Section 3, and then in Section 4, we present the effectiveness of MARV and describe it in detail. Section 6 contains performance results, and we provide concluding remarks in Section 7.
2. Related Work
Many MAC protocols have been proposed to utilize the multi-rate functionality. The auto rate fallback (ARF) [20,21] is typically implemented in commercial 802.11 products. ARF chooses to raise or lower its transmission rate according to consecutive transmission successes or failures, respectively. In the receiver-based auto rate (RBAR) [22,23], the receiver selects an adequate transmission rate according to the channel quality measured from the received request-to-transmit (RTS) frame. The opportunistic auto rate (OAR) [24,25] protocol is based on RBAR but provides a temporal fairness among the nodes. In effect, the network throughput increases since the high-data-rate links get more opportunities. We employed RBAR for the multi-rate utilization in consideration.
Several multi-rate-aware routing protocols have been proposed to exploit the high throughput routing paths. multi-rate-aware sub-layer (MAS) [19] takes the reciprocal of the estimated raw data rate as the routing metric. To estimate the channel conditions, MAS employs HELLO packets for proactive routing protocols while overhearing RTS/CTS packets for on-demand routing protocols. However, raw data rates are actually different from the effective throughput due to the PHY/MAC overheads as considered in this paper. Exchanging HELLO packets will result in high overhead, while obtaining the channel quality only through RTS/CTS overhearing will not provide enough information.
Medium time metric (MTM) [26] selects the paths with the lowest medium time. The medium time metric is measured by the reciprocal of the effective throughput, which takes into account the PHY/MAC overheads. However, MTM uses DSDV to trade the channel quality information. Since DSDV is a proactive routing protocol, it will cost constant high overhead. MTM also assumes that the data packet size is fixed at 1500 bytes, which is very unrealistic.
The authors in [27] propose a VANET routing protocol that considers real-time road vehicle density as its routing metric. This enables to acquire the route that offers minimum delay. However, this scheme aims to provide high packet-delivery ratio and does not consider throughput.
W-GeoR [28] introduces innovation by incorporating key routing metrics, including node mobility, link expiration time, channel signal-to-noise ratio (SNR), and destination proximity information, to make distinct routing decisions when selecting the next-hop vehicle during the ad hoc route discovery process. Nevertheless, W-GeoR is custom-tailored for health monitoring applications.
The authors in [29] exploit blockchain features to implement a secure VANET routing protocol. They modified the existing AODV routing protocol to compute the trust scores of neighbor nodes. However, this proposal mainly focuses on security rather than throughput.
We summarize the above related work in Table 1.

Table 1.
VANET routing protocol comparison.
3. Motivation
In this section, we discuss the main motivation of this paper. First, we compare proactive and reactive routing protocols and then reveal that payload size determines the optimal routing path.
3.1. Proactive vs. Reactive
We can classify ad hoc routing protocols into two major categories: proactive and reactive routing protocols. Proactive routing protocols such as DSDV [12] and OLSR [13] are quite similar to the routing protocols used in wired networks. The nodes employ periodic control messages to exchange routing information with each other. Reactive routing protocols, such as DSR [10] and AODV [11], send out control messages only when required.
The problem with proactive routing protocols is that the nodes have to send out periodic routing messages even when they are not sending any data packets. Although this is not a big concern in wired networks, it would lead to higher power consumption and bandwidth wastage in wireless networks. Furthermore, as the routing information is updated periodically, there is a high possibility that the routing information may become stale, depending on the update period. However, reactive routing protocols send out routing messages only when needed so that the routing information is always fresh. J. Broch et al. [30] showed that the proactive routing protocol performs poorly in the aspect of packet delivery ratio and routing overhead compared to reactive protocols.
Most of the previously proposed multi-rate-aware routing protocols [19,26] modified the proactive routing protocols to achieve their goals since they have to maintain the link quality information of the entire network. Therefore, it would cause huge overhead and power consumption throughout the network. For that reason, we modified the on-demand routing protocol DSR [10] as the muti-rate-aware routing protocol.
3.2. Payload Size Determines Optimal Path
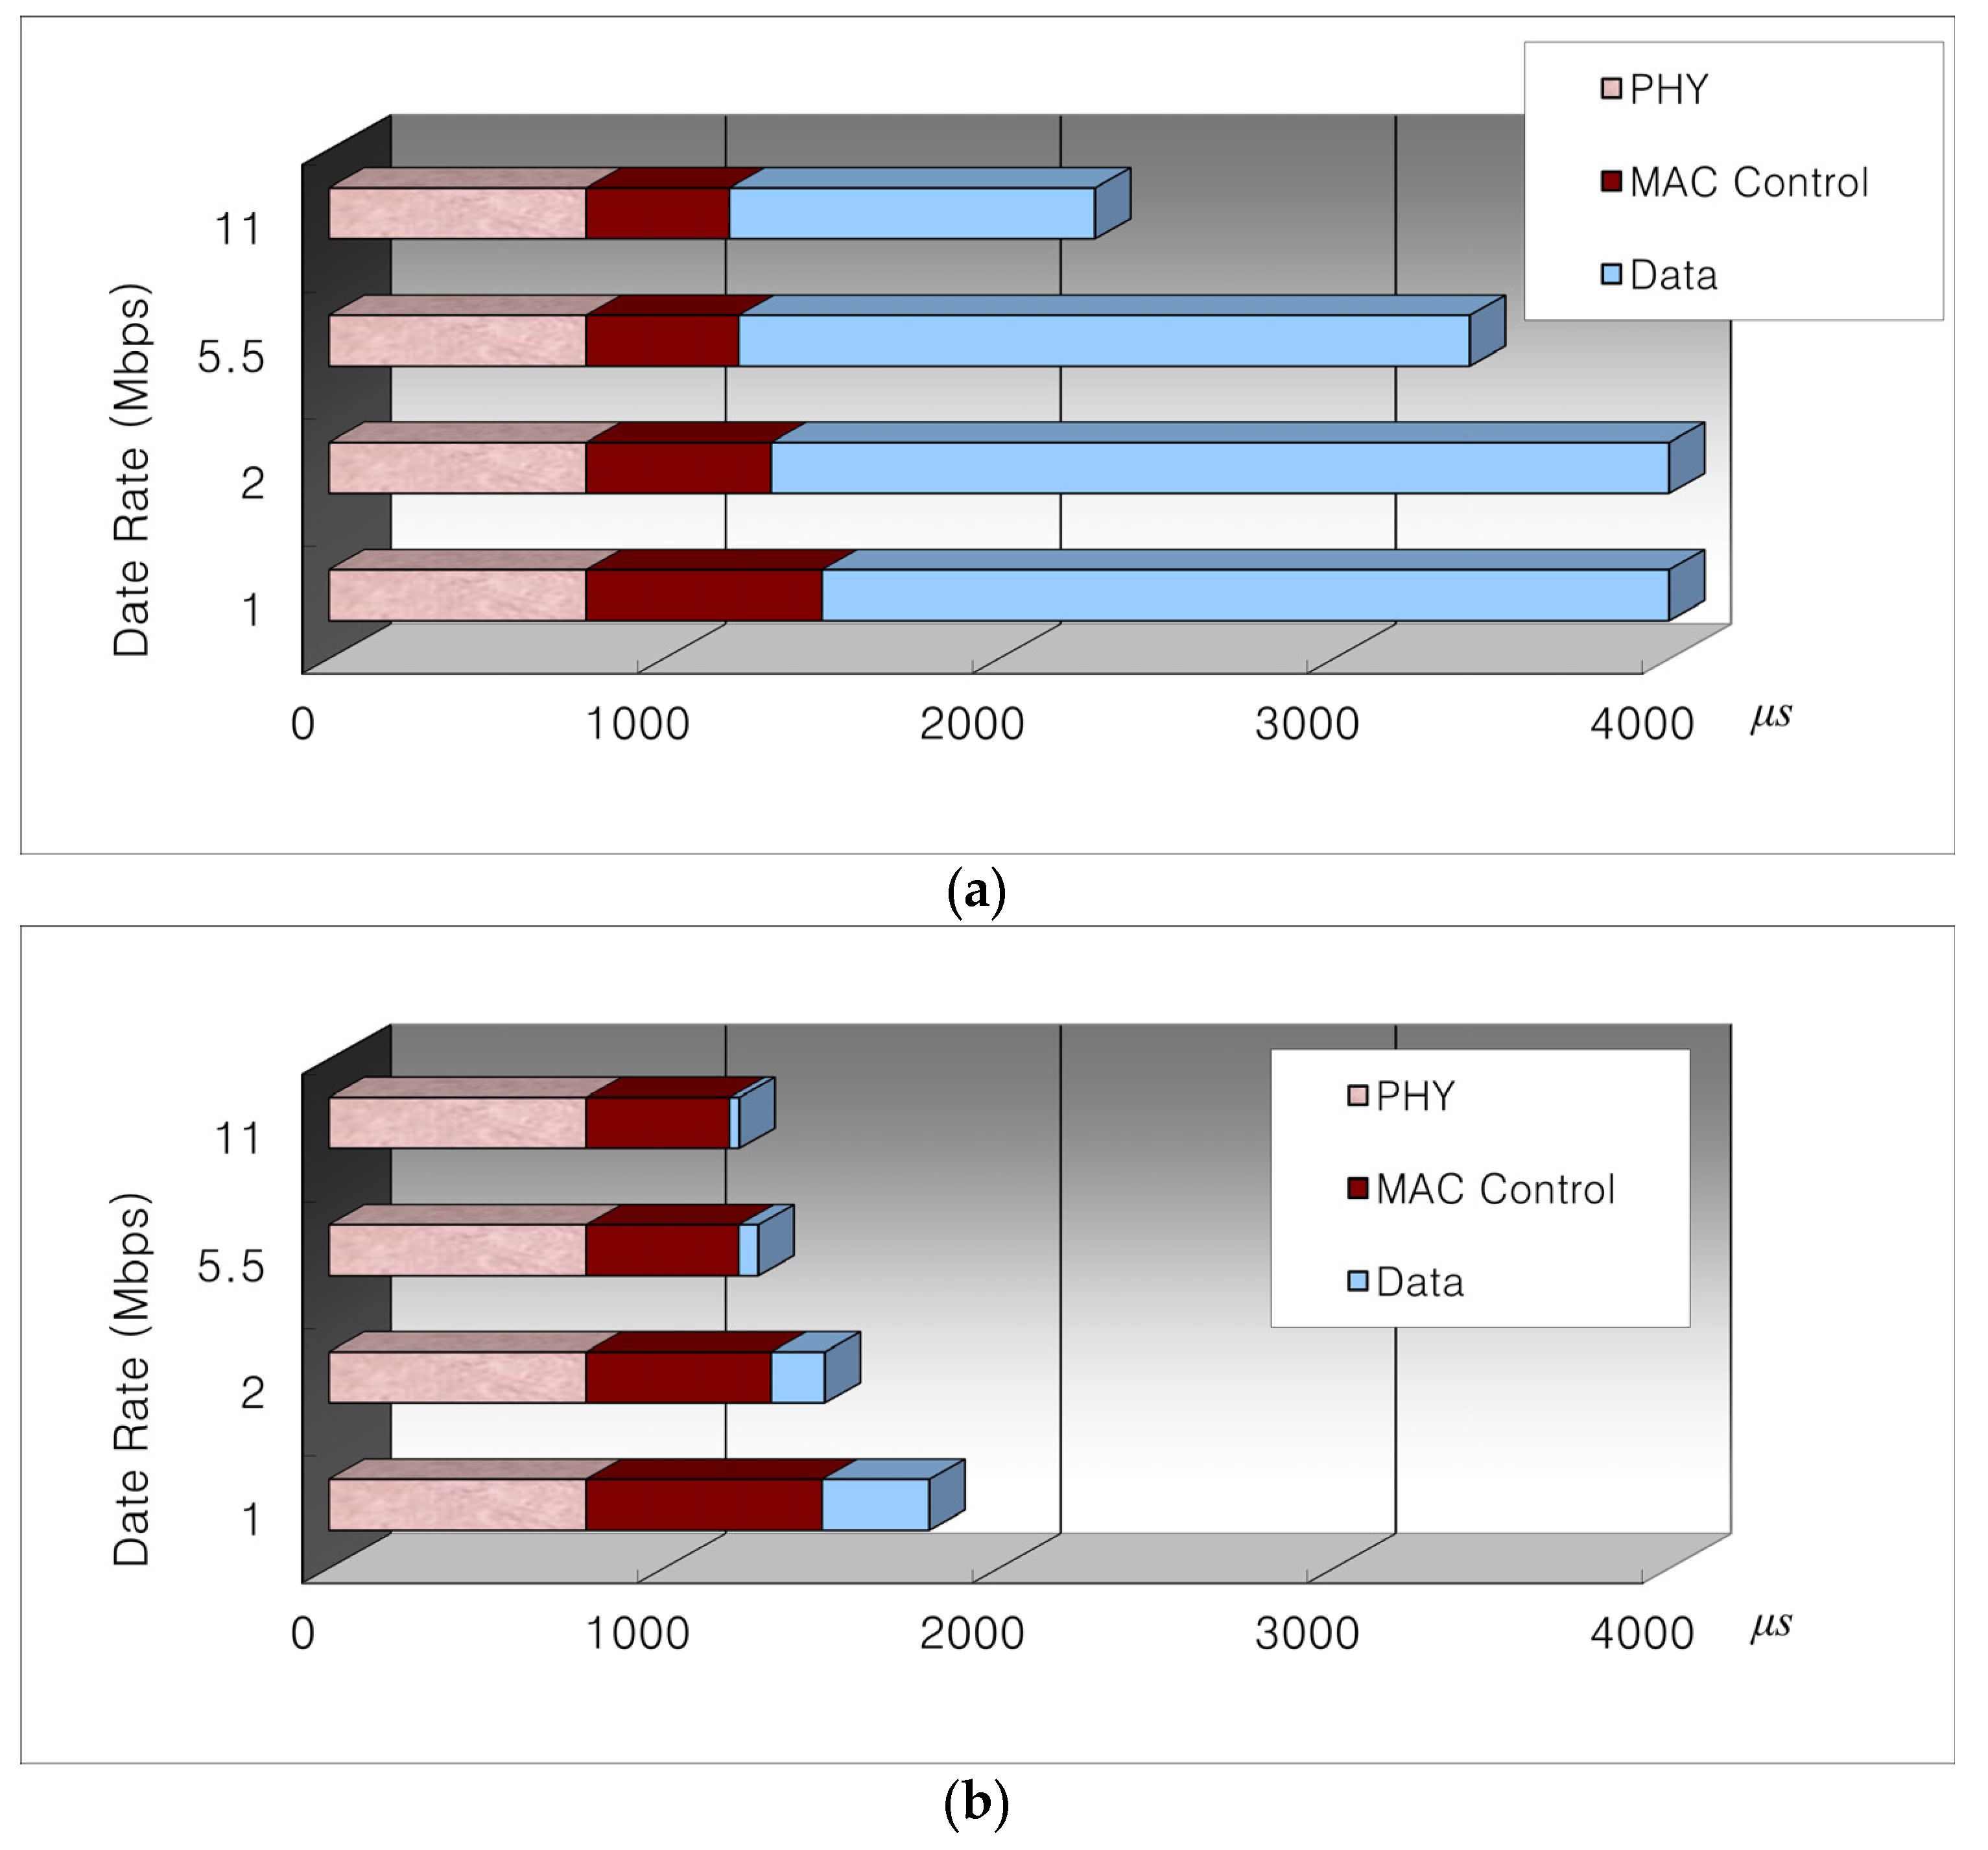
The effective throughput of the wireless links is much lower compared to the physical link rates. For example, when we send a 1500-byte data packet on an 11 Mbps link, the maximum effective throughput would be somewhat close to 5 Mbps. The major cause of this phenomenon is the fixed PHY/MAC overheads, including PHY preamble and header, MAC header, RTS/CTS/ACK frames, DIFS/SIFS, backoff duration, and so on. We call these overheads “fixed overheads” since they are transmitted at a predetermined rate spending a fixed amount of medium time. Figure 2 shows the fixed PHY/MAC overheads independent of the selected transmission rate.

Figure 2.
MAC medium time when sending (a) a 1500-byte and (b) a 40-byte data payload on 1, 2, 5.5, and 11 Mbps links.
The multi-rate-aware routing protocol proposed by Awerbuch et al. [26] uses medium-time as the routing metric. They calculate the medium time as the reciprocal of the effective throughput. One rough assumption is that the MAC payload is fixed at 1500 bytes. In real life, the packet size varies depending on the applications. According to the report from the Cooperative Association for Internet Data Analysis (CAIDA) [31], the actual Internet traffic is governed by small-sized packets of under 100 bytes comprising more than 50%. Most of these small-sized packets are TCP-ACK packets that are 40 bytes in length. Most of the large-sized packets, which are mostly TCP data packets, are about 550 bytes from TCP implementations that do not use path maximum transfer unit (MTU) discovery and 1500 bytes from those use it. Accordingly, fixing the MAC payload at a very high size, e.g., 1500 bytes, would be very unrealistic.
Figure 2a shows the MAC medium time distribution when a 1500-byte payload (the same size as a TCP data packet when path MTU discovery is used) is transmitted, while Figure 2b shows the same distribution when a 40-byte payload (the same size as a TCP-ACK packet) is transmitted. For Figure 2a, the medium time spent by the 1500-byte data payload usually dominates the total medium time. On the other hand, for Figure 2b, the medium time spent by the PHY/MAC overhead occupies most of the medium time. What this means is that when a small-sized packet is transmitted, the data rate does not affect the throughput performance much. In fact, by selecting a high-data-rate link, the source nodes would tend to select a path that has a large number of hops, thus decreasing the overall throughput.
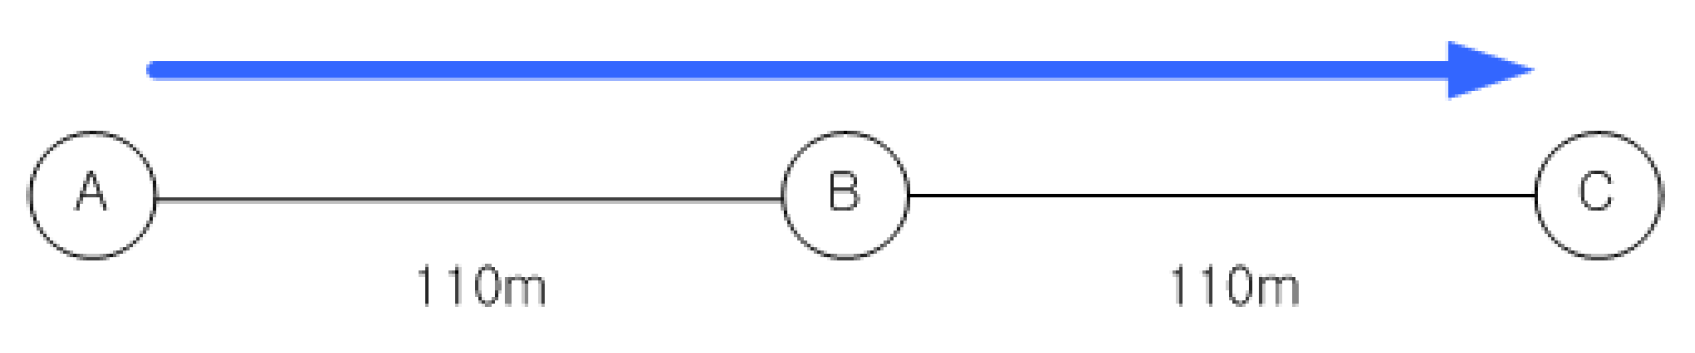
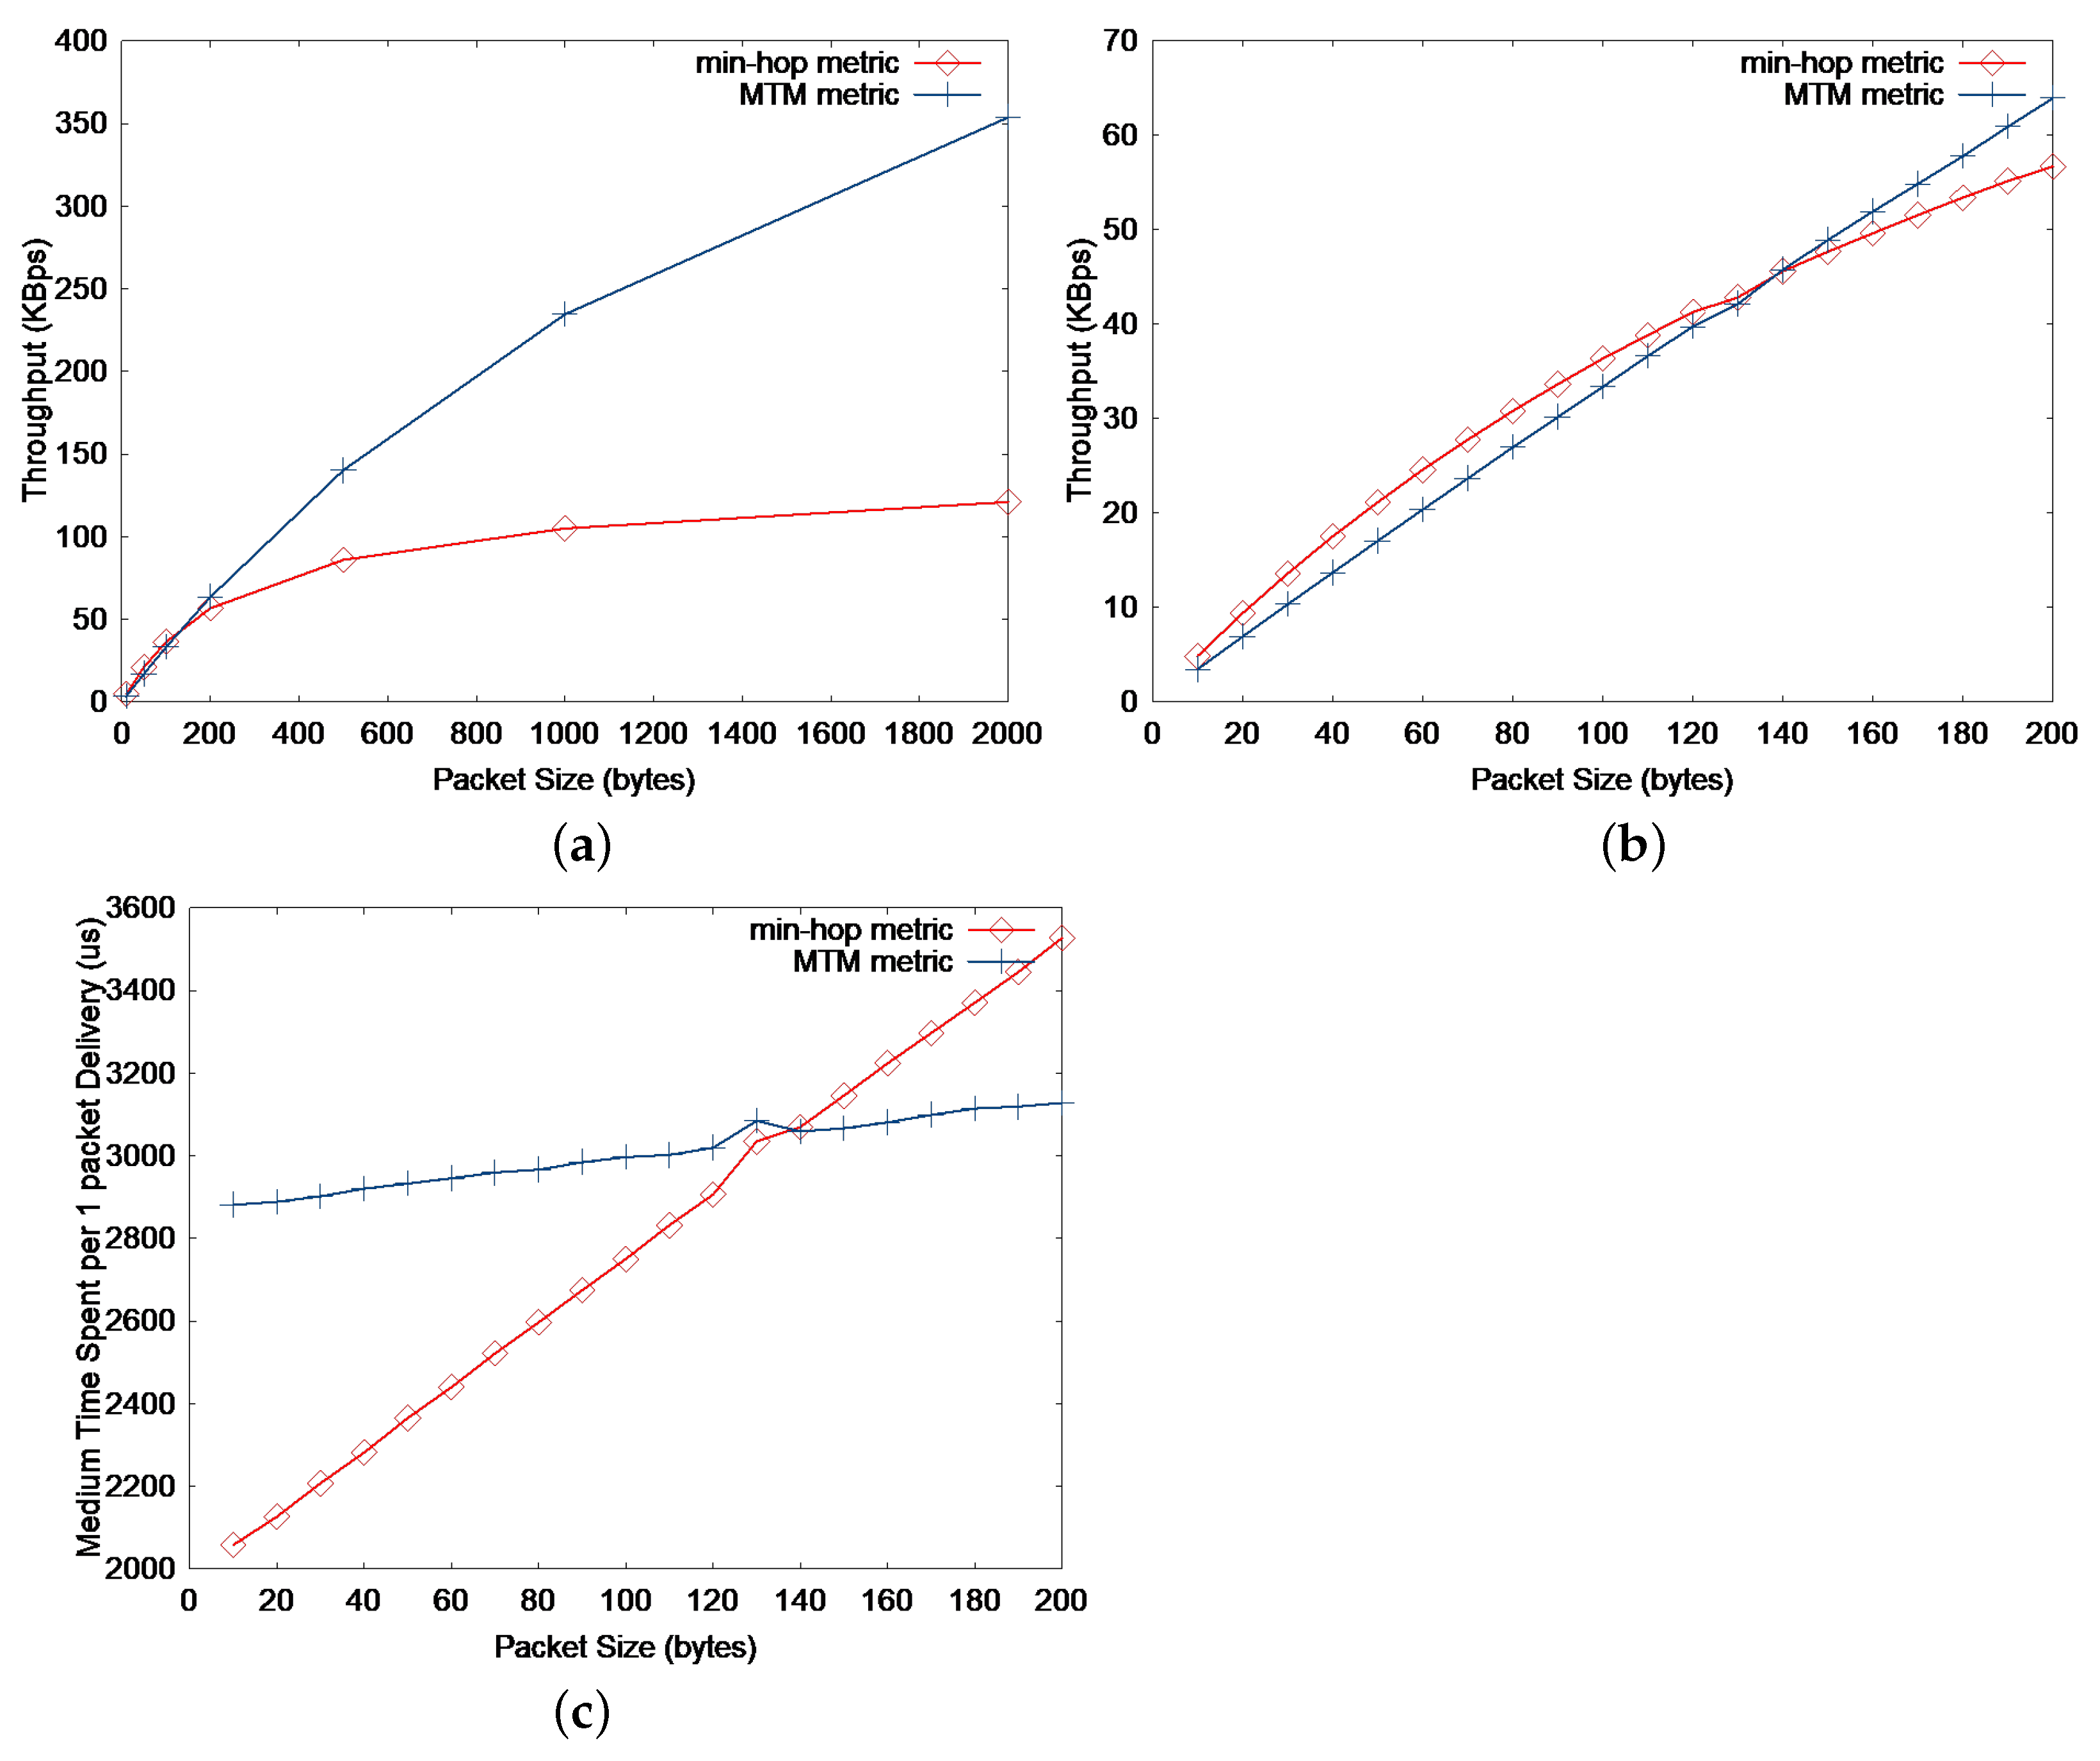
Figure 3 shows a simple three-node topology, where node A is the source node and node C is the destination for constant bit-rate (CBR) traffic. When min-hop routing is used, source node A sends directly to node C, while node B is used as an intermediate hop when MTM is applied. Figure 4a compares the two metrics by the throughput performance for the topology using the ns-2 simulations as the application packet size is varied. The details of the simulation setup are presented in Section 6.1. It seems reasonable to use the MTM when large-sized packets are used, but a further glance at Figure 4b indicates that the min-hop metric is reasonable for small-sized packets. The threshold application packet size is about 140 bytes, which is 172 bytes (adding the UDP and IP header size) as a MAC payload. This also agrees with the actual Internet packet size distribution, where more than 50% of the IP packets are smaller than 100 bytes. This means that more that 50% of the packets may experience performance degradation by always using MTM as the routing metric. We will delve into this issue in Section 4.3.
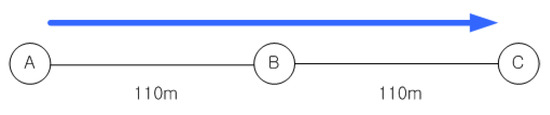
Figure 3.
A simple 3-node topology.
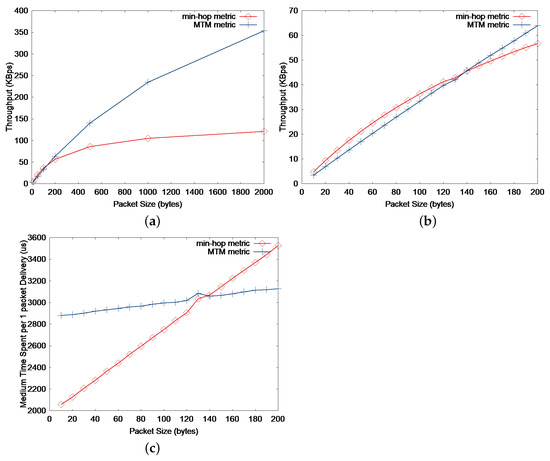
Figure 4.
(a) Throughput vs application packet size of 0 to 2000 bytes. (b) Throughput vs. application packet size of 0 to 200 bytes. (c) Medium time spent per 1 packet delivery vs. application packet size of 0 to 200 bytes. The simple network topology in consideration is shown in Figure 3.
In essence, the optimal path that generates the maximum throughput would depend on the packet size. For small-sized packets, the min-hop metric is preferable, whereas the large-sized packets would show better performance by using MTM.
At first glance, one may argue that the throughput increase by using min-hop metric instead of MTM for small-sized packets is not significant according to Figure 4b. Actually, the maximum application throughput increase by using min-hop instead of MTM is merely 33.8 kbps (4.2 KBps) when the packet size is 60 bytes. However, the main effect of using min-hop instead of MTM is the reduction in medium time spent per packet delivery as shown in Figure 4c. By reducing the medium time spent for small-sized packets, some other flow that transmits large-sized data packets can utilize the saved medium time and increase the overall network throughput. Furthermore, by using the min-hop metric for small-sized packets, the end-to-end delay would decrease compared to MTM, which can be easily figured out in Figure 2. We will further discuss these issues with the simulation results in Section 6.
4. Design
4.1. Operation of MARV
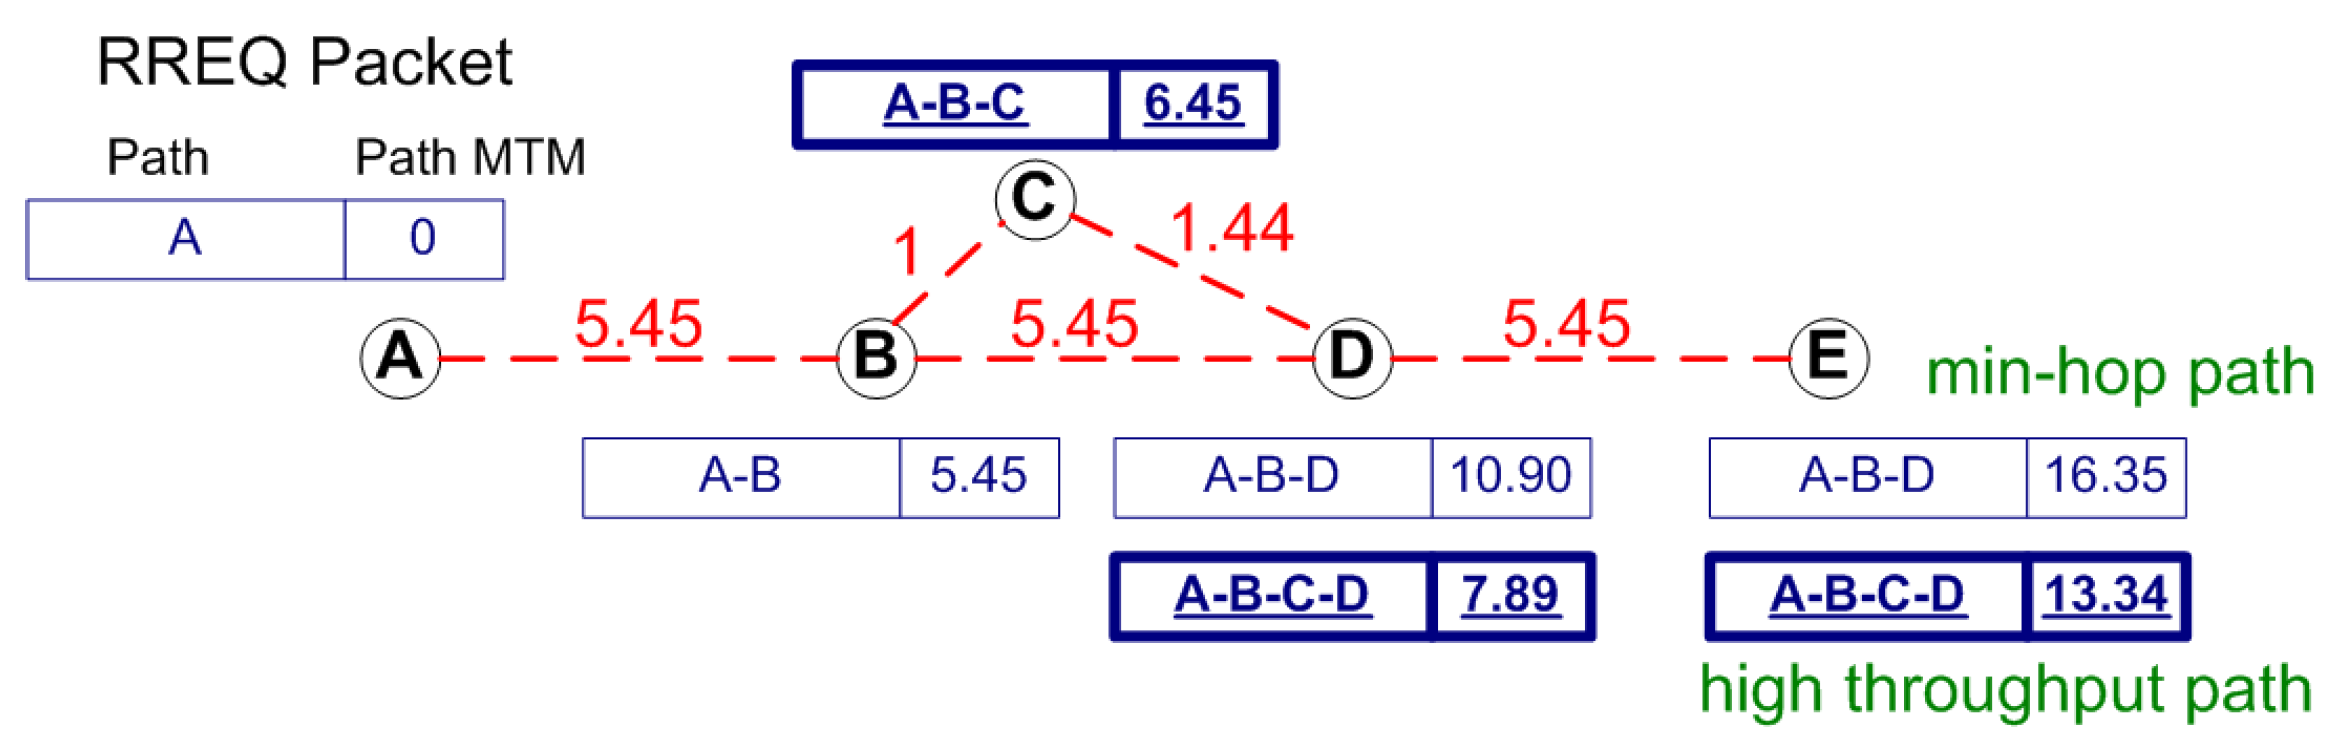
Figure 5 shows the basic operation of MARV. The numbers on the link indicate the medium time metric for a 1500-byte packet to be sent. The packet format shown in the figure is the abstract format of the route request (RREQ) packet of MARV. The RREQ of MARV contains the path link quality field, i.e., the path MTM field, which indicates the total sum of the link medium times of the path. Therefore, whenever a node receives an RREQ packet, it adds the MTM value of the receiving link to the path MTM field before rebroadcasting it.
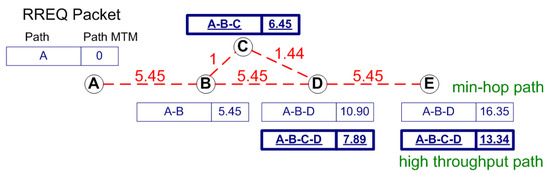
Figure 5.
The basic operation of MARV.
The main objective of the route search mechanism in MARV is to find the path with the lowest path MTM value, i.e., the high-throughput path. Therefore, MARV has to search for link disjoint paths to find the path with the lowest path MTM value. By using the basic DSR route search mechanism, the destination is capable of finding multiple paths, which are node disjoint. However, the basic DSR route search mechanism cannot find the link disjoint multiple paths. For example in Figure 5, assume that node B is the source and node D is the destination. Node D is capable of finding node disjoint paths B-C-D and B-D via the basic route search mechanism. Now, let us assume that node A is the source and node E is the destination. Although A-B-C-D-E and A-B-D-E are link-disjoint paths, the basic route search mechanism forces node D to discard the route request from node C, making the A-B-C-D-E path unknown to destination node E.
There has been some work on multi-path routing in DSR [32], but these mechanisms result in very high routing overhead since route requests are rebroadcasted multiple times. In MARV, we use a similar approach, but with a tighter constraint. For example, in Figure 5, suppose node A is the source and node E is the destination. Node A generates a RREQ packet to be flooded into the network. Node D rebroadcasts the RREQ packet received from node B. Then, node D receives the RREQ sent by node C. Although the RREQ sequence is not new, instead of just discarding the RREQ, node D compares the path MTM value of the newly received RREQ with the minimum path MTM value of the previously received RREQ by using the ignoreRREQ() shown in Algorithm 1. The constant will be further discussed in Section 4.2. This approach enables MARV to eventually find the high-throughput paths. In this example, node B compares the path MTM values and finds out that the path MTM value 7.89 from node C is smaller than the previously received minimum path MTM value 10.90 and hence rebroadcasts the RREQ packet. Node E will eventually receive the RREQ packet sent via the link–disjoint path A-B-C-D-E.
Destination node E basically replies to all the route requests received, but will check by using the same algorithm used when forwarding the RREQ (see ignoreRREQ() function in Algorithm 1). In other words, the destination will send out an RREP only if the path MTM value of the received RREQ is smaller than the previous received minimum path MTM value.
Source node A then receives multiple RREPs from destination node E and will select between the min-hop path and minimum path MTM path. Function selectPATH() in Algorithm 2 shows the algorithm to select the adequate path for the data packets. Basically, MARV selects the path based on the size of the data packet. For small-sized packets, MARV selects the min-hop path while selecting the minimum MTM path for larger packets. In reality, bulk data traffic for FTP normally takes the high throughput path while small TCP ack packets or small http packets take the min-hop path.
| Algorithm 1 MARV operation. |
|
| Algorithm 2 MARV operation. |
|
4.2. A Closer Look into MARV
As shown in the paper of [26], as the density of the network increases, the multi-rate-aware protocols will find more high-throughput paths. However, one problem of using Algorithm 1 is that the control overhead may also increase along with the network density. We use an additional constraint to solve this problem. By setting the constant value (as shown in line 2 in Algorithm 1) to 3, we can earn two benefits. First, each intermediate node can rebroadcast only once or twice, since no path MTM value is greater than 6 (as shown in Table 3). Second, this helps the MARV protocol to find only very-high-throughput paths, since it will rebroadcast an RREQ only if it is far better than the previous one.
Network failures such as node or link failures can happen. The node or link failures can be considered either at the network layer or the link layer. First, at the network layer, our proposal is an enhanced version of the previously proposed routing protocols, such as DSR [10]. We can directly adopt the link failure recovery mechanisms used in these original routing protocols. At the link layer, the link failures can be dealt by MAC retransmissions.
4.3. Selection of Packet Size Threshold
By setting to 3, as discussed in Section 4.2, MARV selects high throughput paths when the current selected link is a 1 Mbps path and the new path consists of either two 11 Mbps links or one 5.5 Mbps link and one 11 Mbps link. As a result, if the medium time taken by one 5.5 Mbps path and one 11 Mbps path should be smaller than the medium time taken by one 1 Mbps path, the RREQ will be rebroadcasted.
We calculate the medium time to get the packet size threshold of choosing between min-hop and MTM. The medium time taken by a data payload length x bytes at m Mbps data rate are given by
where denotes the medium time, and and are the medium times taken by the physical and MAC overheads, respectively.
To meet the constraint in the previous section, the following equation should hold.
Note that if the above equation holds, it means that the min-hop metric outperforms the high-throughput path using the MTM metric. Inserting the values yields bytes. Therefore, if the IP packet size (equivalent to the MAC payload) is smaller than 240 bytes, the source selects the min-hop path, whereas the source selects the MTM metric path when the packet size exceeds 240 bytes.
5. Mathematical Analysis
In this section, we derive the probability of finding a high-throughput path using MARV via a simple analytic model and then present the analytical results.
5.1. Probability of Finding a High-Throughput Path
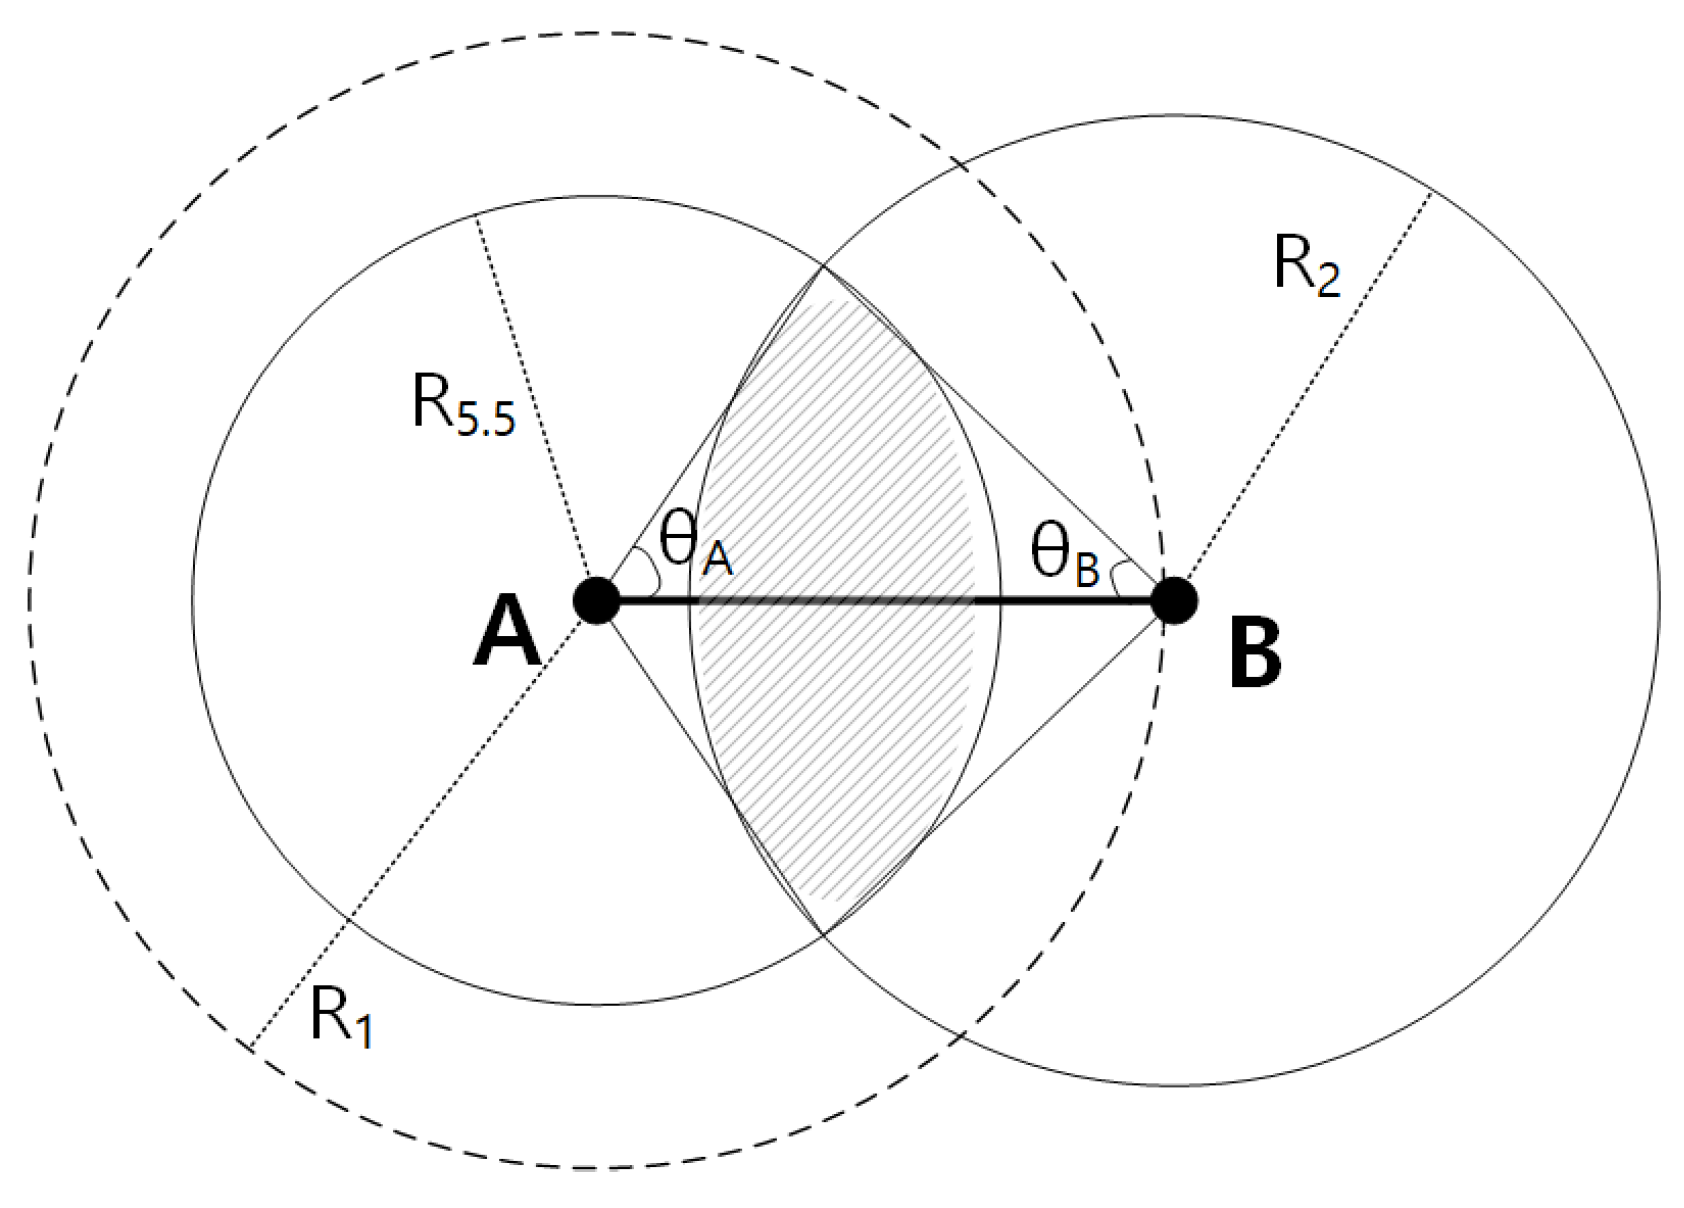
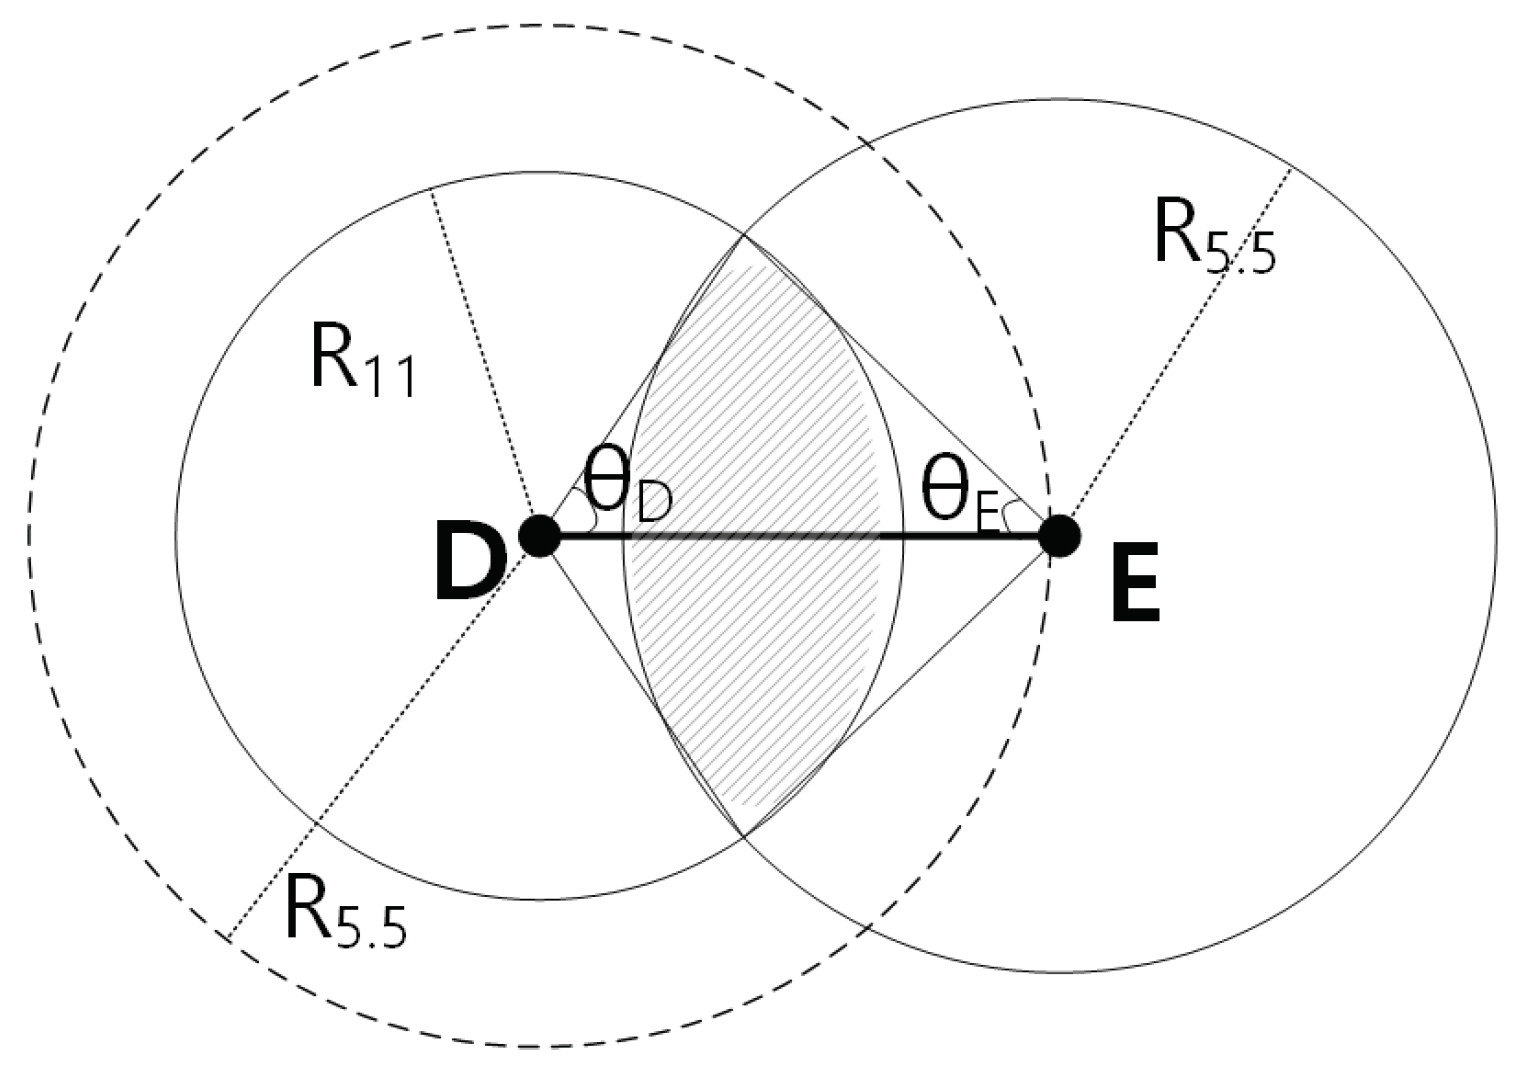
Figure 6 shows a scenario where node A is transmitting to node B. , , and denote the maximum transmission range for data rates 1, 2, and 5.5 Mbps, respectively, and the values as shown in Table 3.
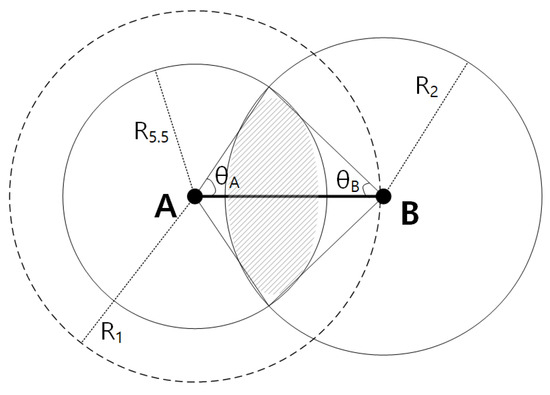
Figure 6.
Node A is transmitting to node B, and the nodes are distance apart. If a node exists in the shaded area, then MARV can take advantage of the high-throughput path.
Let us assume node A is using min-hop and is transmitting to node B, which is at the edge of the maximum transmission range . In order to leverage a higher throughput path, there need to exist a node in the middle which can relay the data to node B, and let that node be named as C. As explained in Section 4.3, the links AC and CB should enable at least the data rates of 2 Mbps and 5.5 Mbps to be effective. To enable this, relay node C should be placed in the overlapping area of the two circles, i.e., the shaded area as shown in Figure 6.
We next compute the shaded area. First, we obtain the angles and via the cosine law as follows:
Thus,
Let us denote the left part of the shaded area as , and the right part as , and the total area as , thus . Using the results in Equation (6),
Here we assume that the nodes are randomly distributed following the Poisson distribution [33], with density . The average number of nodes in area can be denoted as . Finally, the probability for a node to exist in the area A can be expressed as follows:
Random variable X denotes the number of nodes in the area A. Equation (8) presents the probability of finding a high-throughput path, thus the effectiveness of the MARV protocol.
Next, let us assume another case where the distance between node D and E is instead of , as shown in Figure 7. In order to exploit a higher throughput path, we again assume that a node F in the middle has to exist, and links DF and FE links should allow at least data rates of 5.5 Mbps and 11 Mbps, due to the MTM values shown in Table 3. We repeat the computation process above for the newly defined ranges.
Again, let us denote the left part of the shaded area as , and the right part as , and the total area as , thus . Using the results in Equation (9),

Figure 7.
Node A is transmitting to node B, and the nodes are distance apart.
Finally, we use the results of Equation (10), and again use Equation (8) to acquire the probability of finding a high-throughput path, p. Note that, if the distance between the two nodes is equal or less than , then there are no relay nodes that can improve the throughput. In the next subsection, we present the analytical results of the model presented above.
5.2. Analytical Results
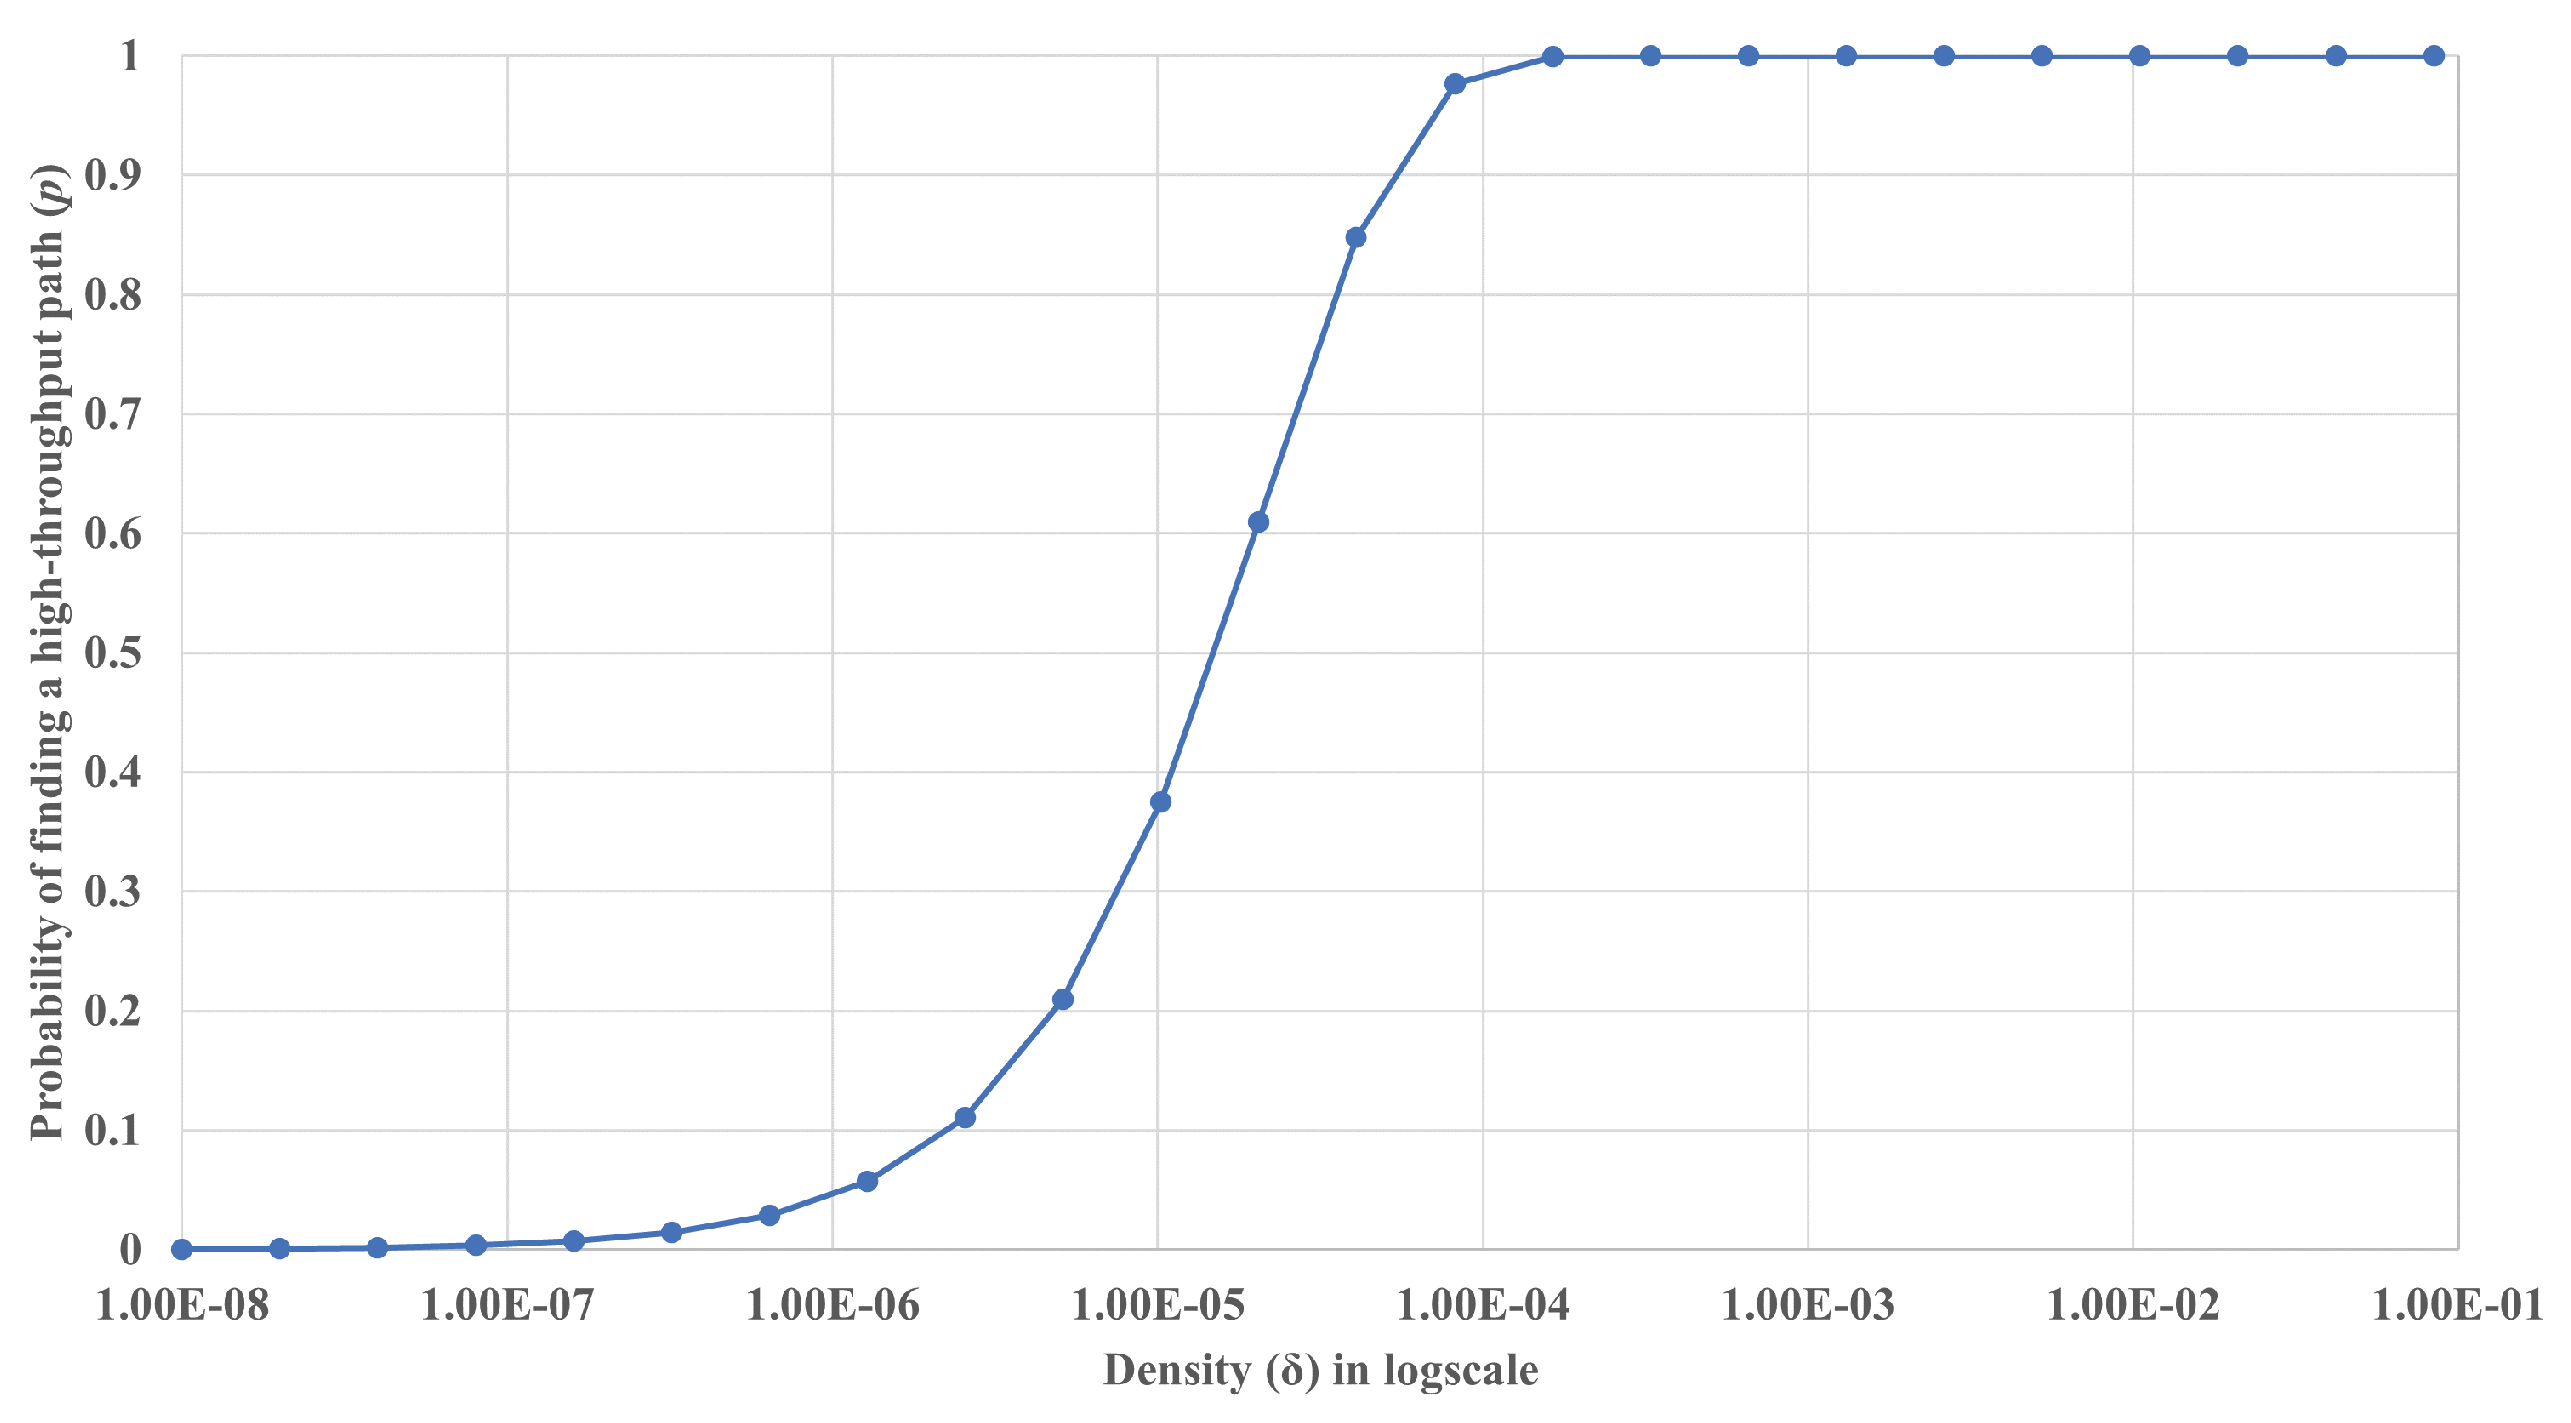
In this section we present the results of the mathematical analysis conducted in Section 5.1. Here, we compute for the case when the distance between the two nodes is the maximum transmission range, . Note that this work can easily be extended to the case when the distance is . As presented in Figure 8, in a very-low-density environment where the density of the nodes () is around nodes/m2, the probability of finding a high-throughput path (p) is close to zero (0.00046). Note that this density translates to around nodes per the area covered by the maximum transmission range ().
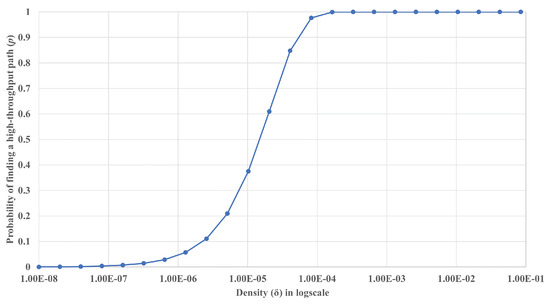
Figure 8.
The probability of finding a high-throughput path (p) vs. node density (). The node density () is number of nodes per m2 and is presented in log scale.
For the probability to reach around 0.5 (50%), has to be at least nodes/m2, or 2.94 nodes per . When reaches nodes/m2, or 32.2 nodes per , then p reaches 0.9995, and we can safely assume that a high-throughput path always exists.
6. Evaluation
In this section, we evaluate the performance of MARV by comparing it with other routing protocols. The simulations ran for 100 s simulation time and were performed on a 500 m × 500 m space with 100 randomly placed fixed nodes unless otherwise stated. Each result is computed by averaging the results from 5 to 10 random scenarios.
6.1. Evaluation Setup
The physical model used in this paper is based on IEEE 802.11b [17]. IEEE 802.11b supports four data rates, namely, 1, 2, 5.5, and 11 Mbps. For the parameters shown in Table 2 and Table 3, we refer to the specifications of the ORiNOCO PC Card [34]. The propagation model is based on the two-ray ground model of ns-2 [35].
Table 2.
Physical parameters.
Table 3.
Sensitivity, transmission range, medium time metric (MTM) vs. data rate.
We use the ns-2 simulator [35] to conduct the simulations. We use the multi-rate extensions from the Rice Networks Group [36] for the implementations of RBAR based on the ns-2.1b7a code. We have also directly adopted the metric values used in [26] for multi-rate-aware routing as shown in Table 3. The medium time metric is the normalized estimated medium time for a 1500-byte payload to be transmitted using 802.11b with RTS/CTS.
6.2. Throughput and Delay vs. Packet Size
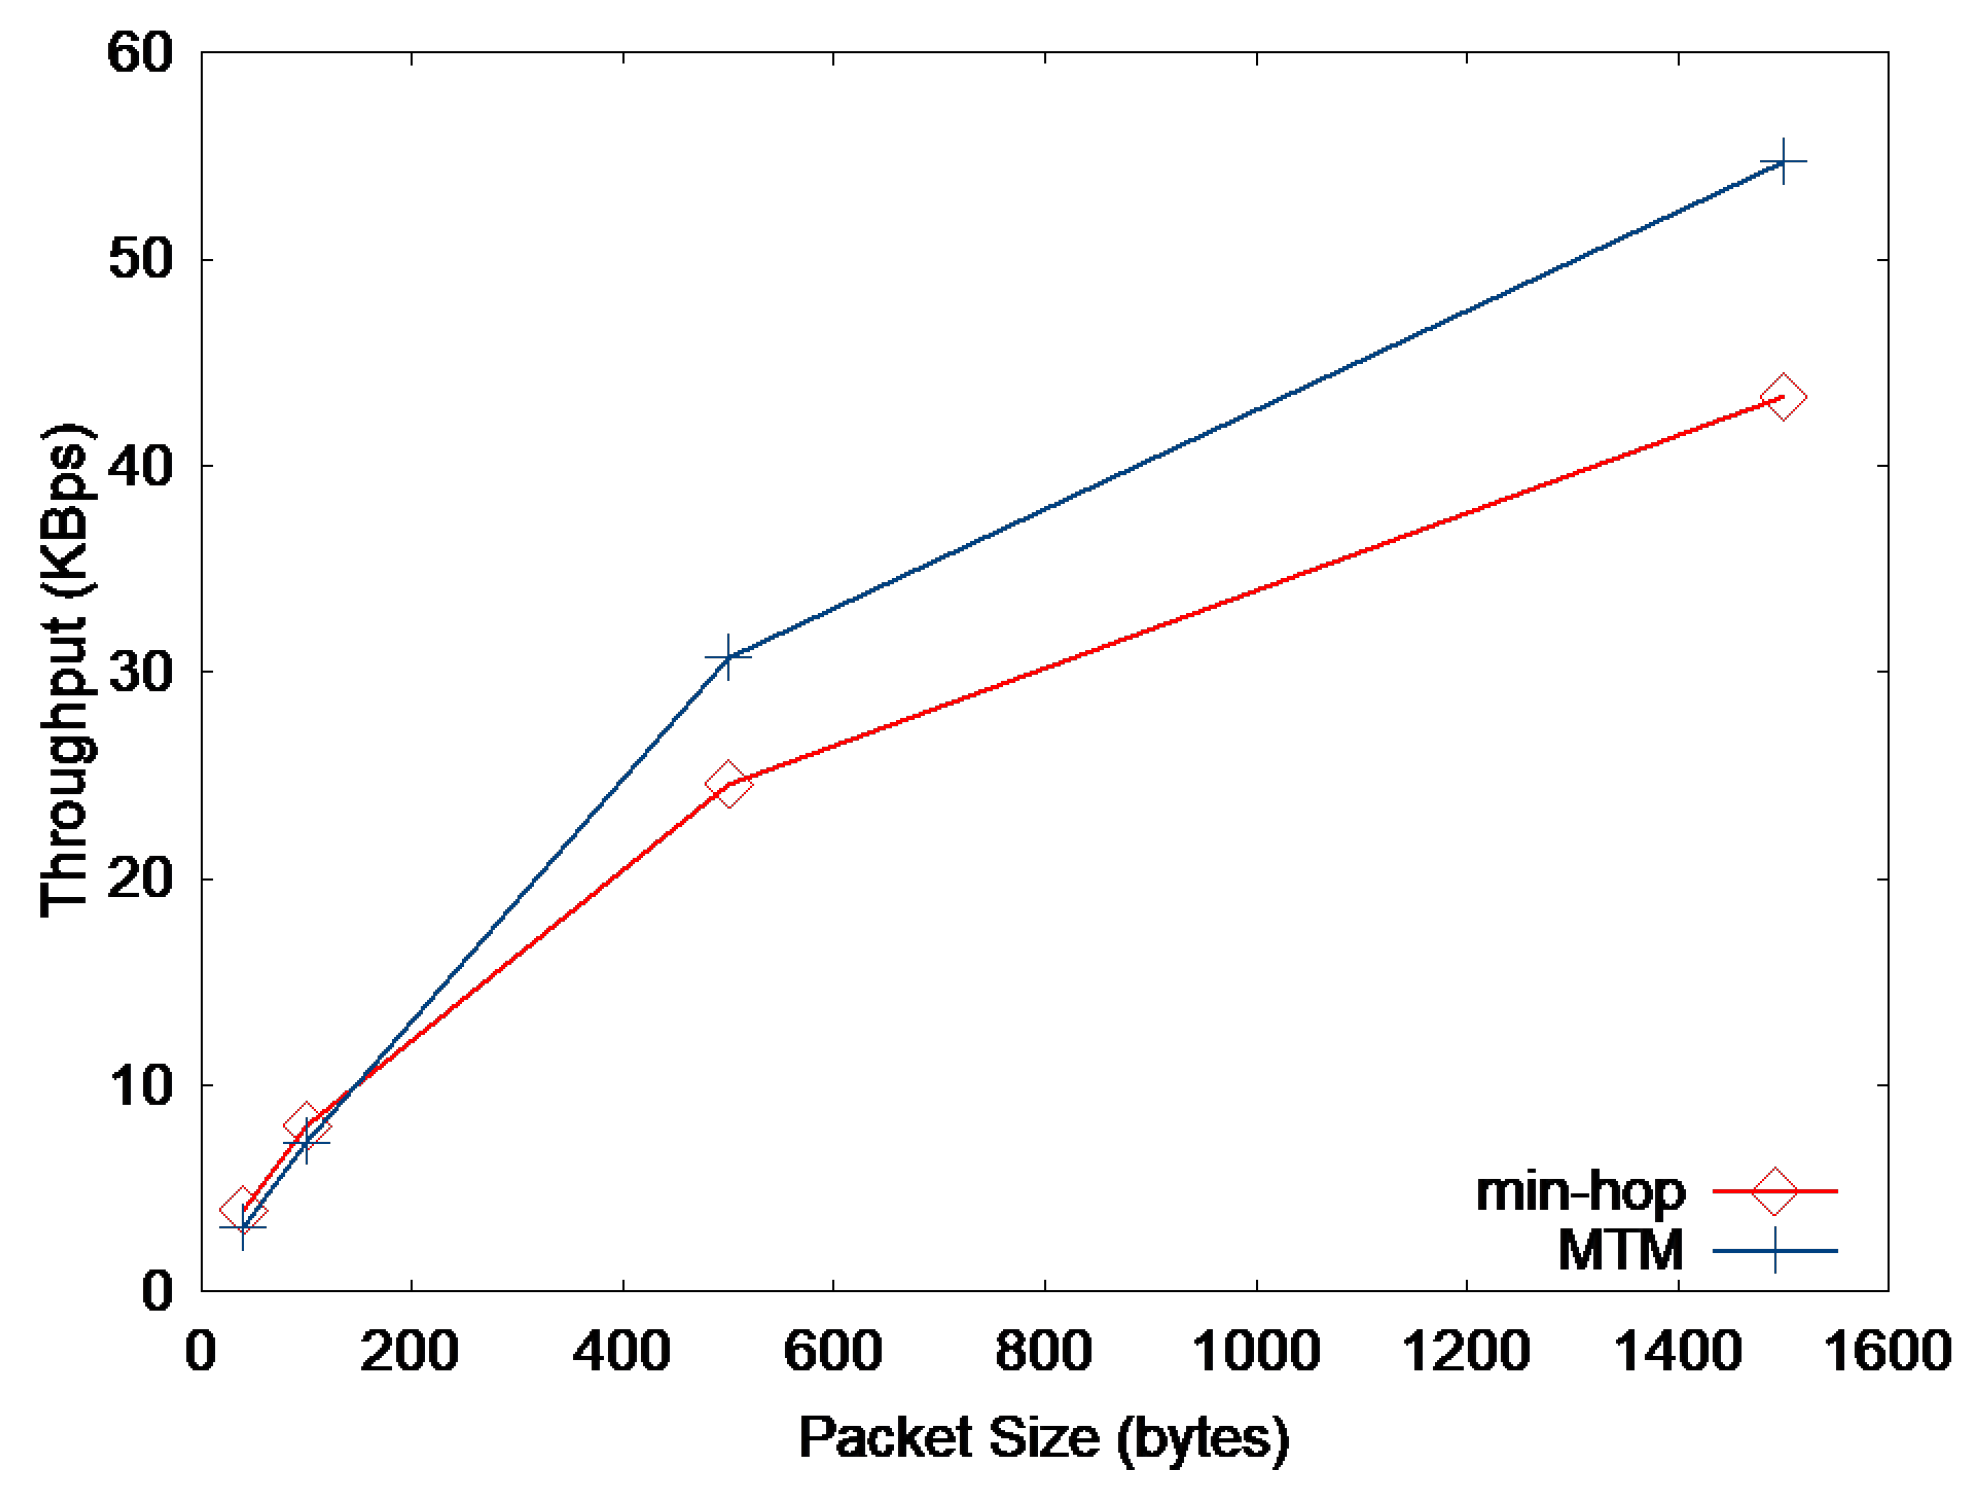
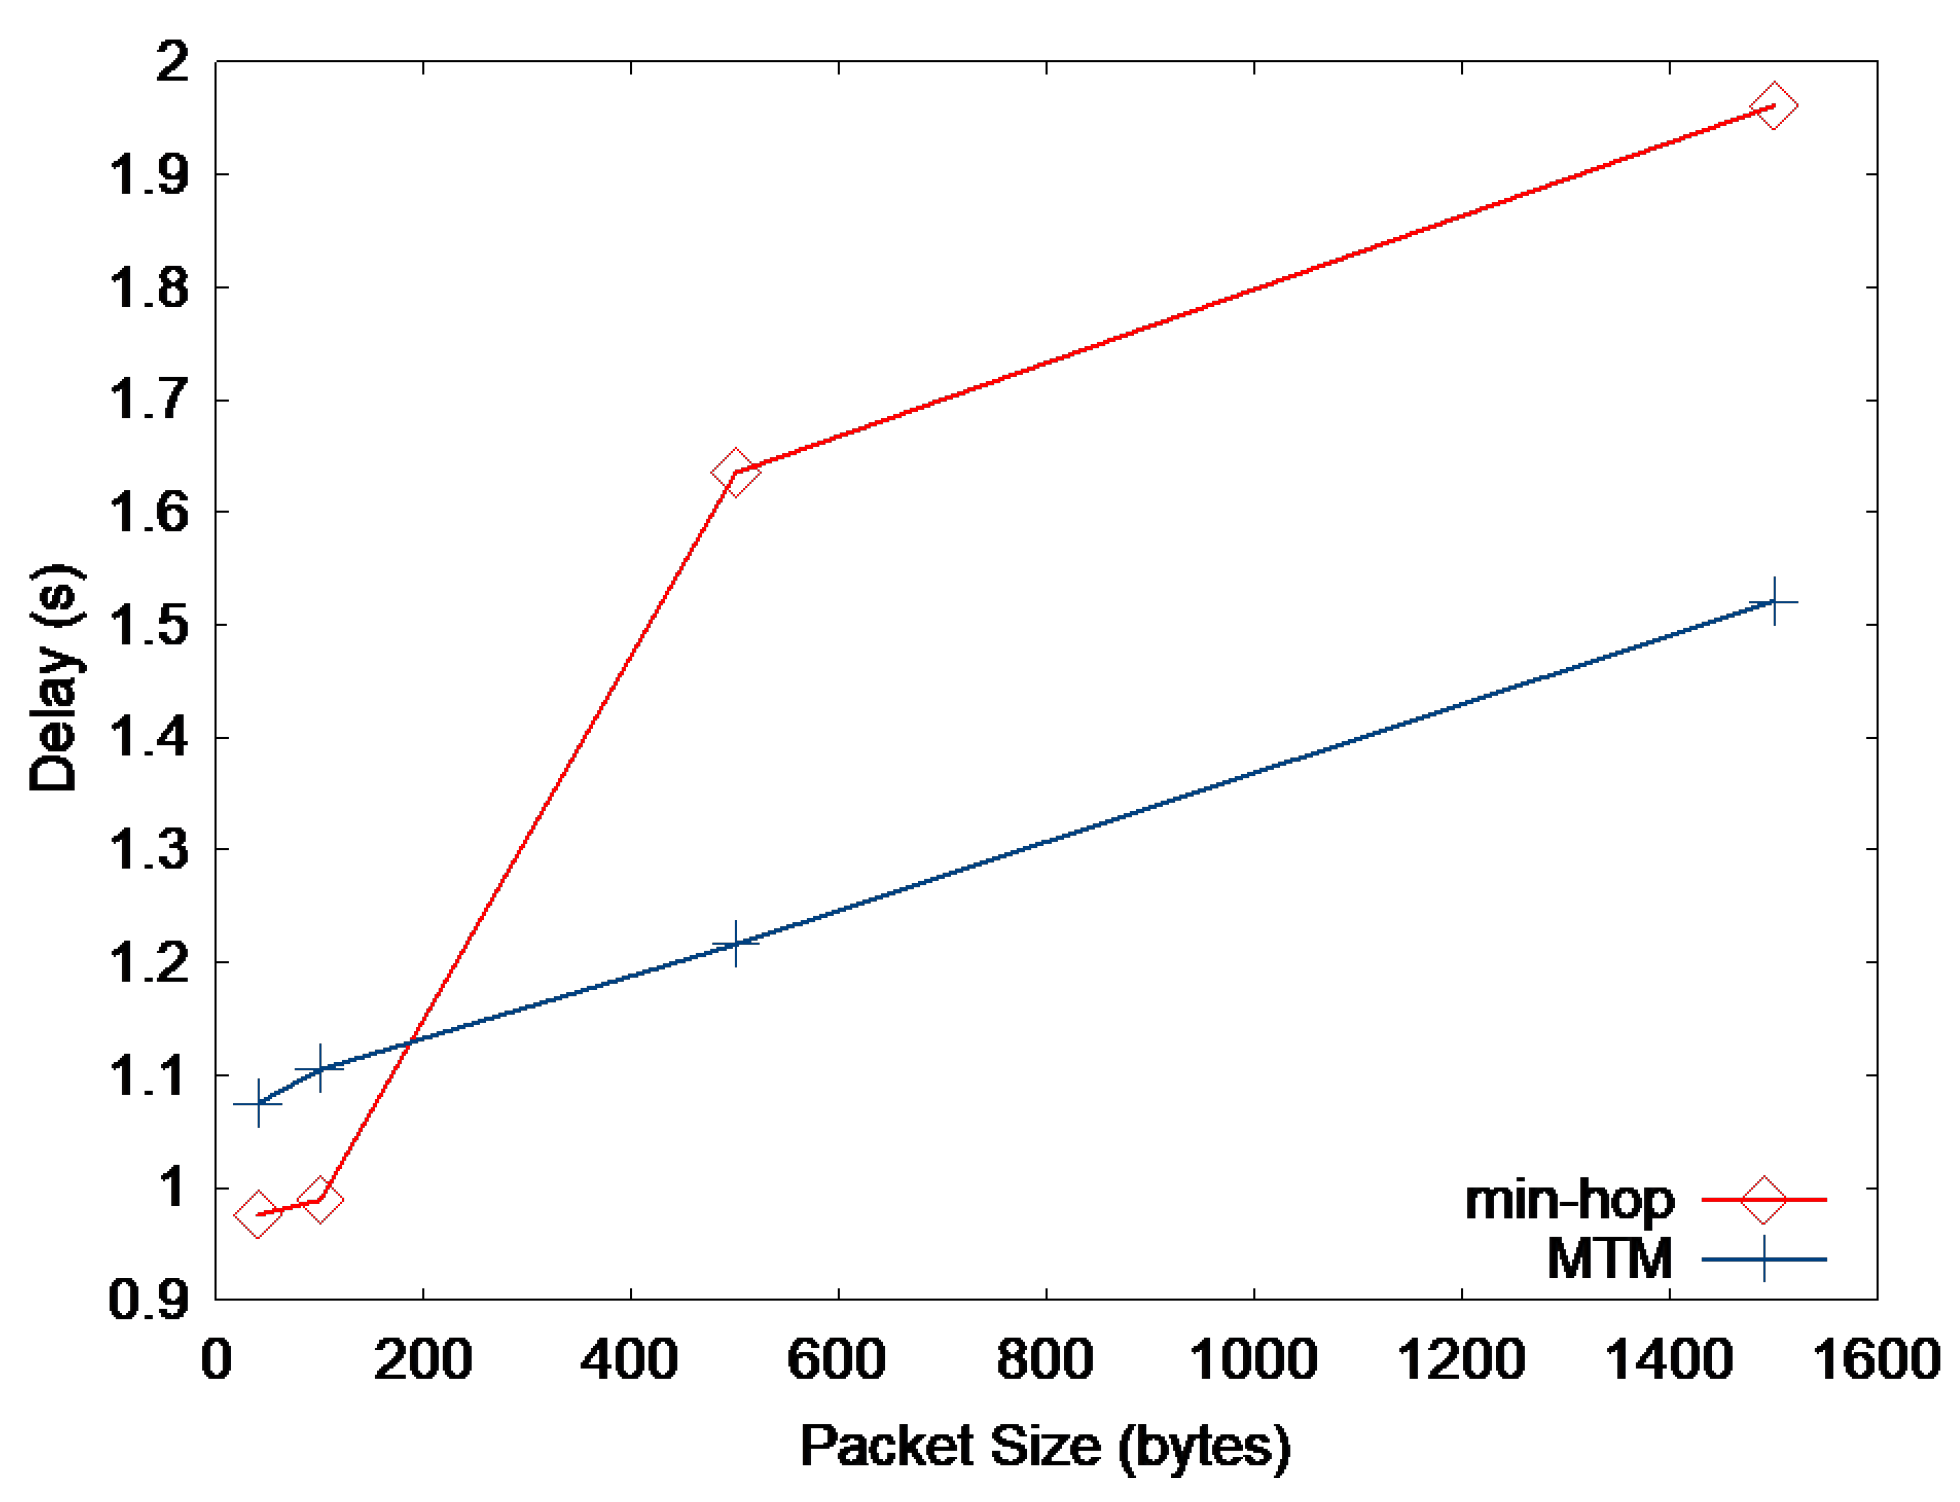
Figure 9 and Figure 10 present the throughput and delay when the packet size is varied, respectively. We generate 10 CBR sources randomly chosen from the nodes. This simulation is quite similar to the one in Figure 3 but is performed in a more general network with more nodes. As expected, we can see in Figure 9 that the throughput of min-hop metric is higher than MTM when the packet size is small, and vice versa. Figure 10 shows that min-hop causes smaller delay than MTM when small-sized packets are transmitted. This result shows that medium time taken by small-sized packets depends more on the number of transmissions, i.e., the hop count, than transmission rate.
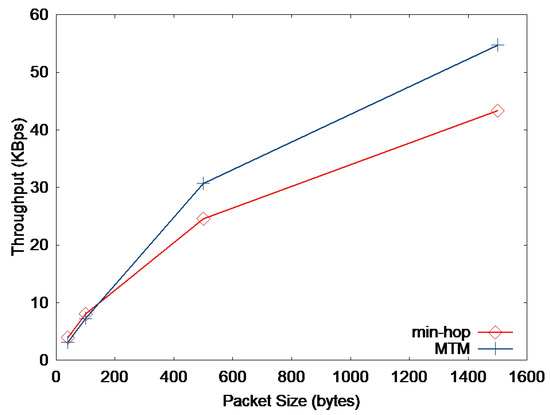
Figure 9.
Network throughput vs. packet size.
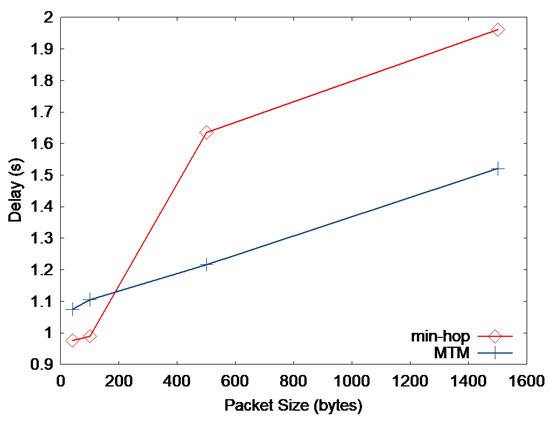
Figure 10.
End-to-end packet delay vs. packet size.
6.3. Using UDP
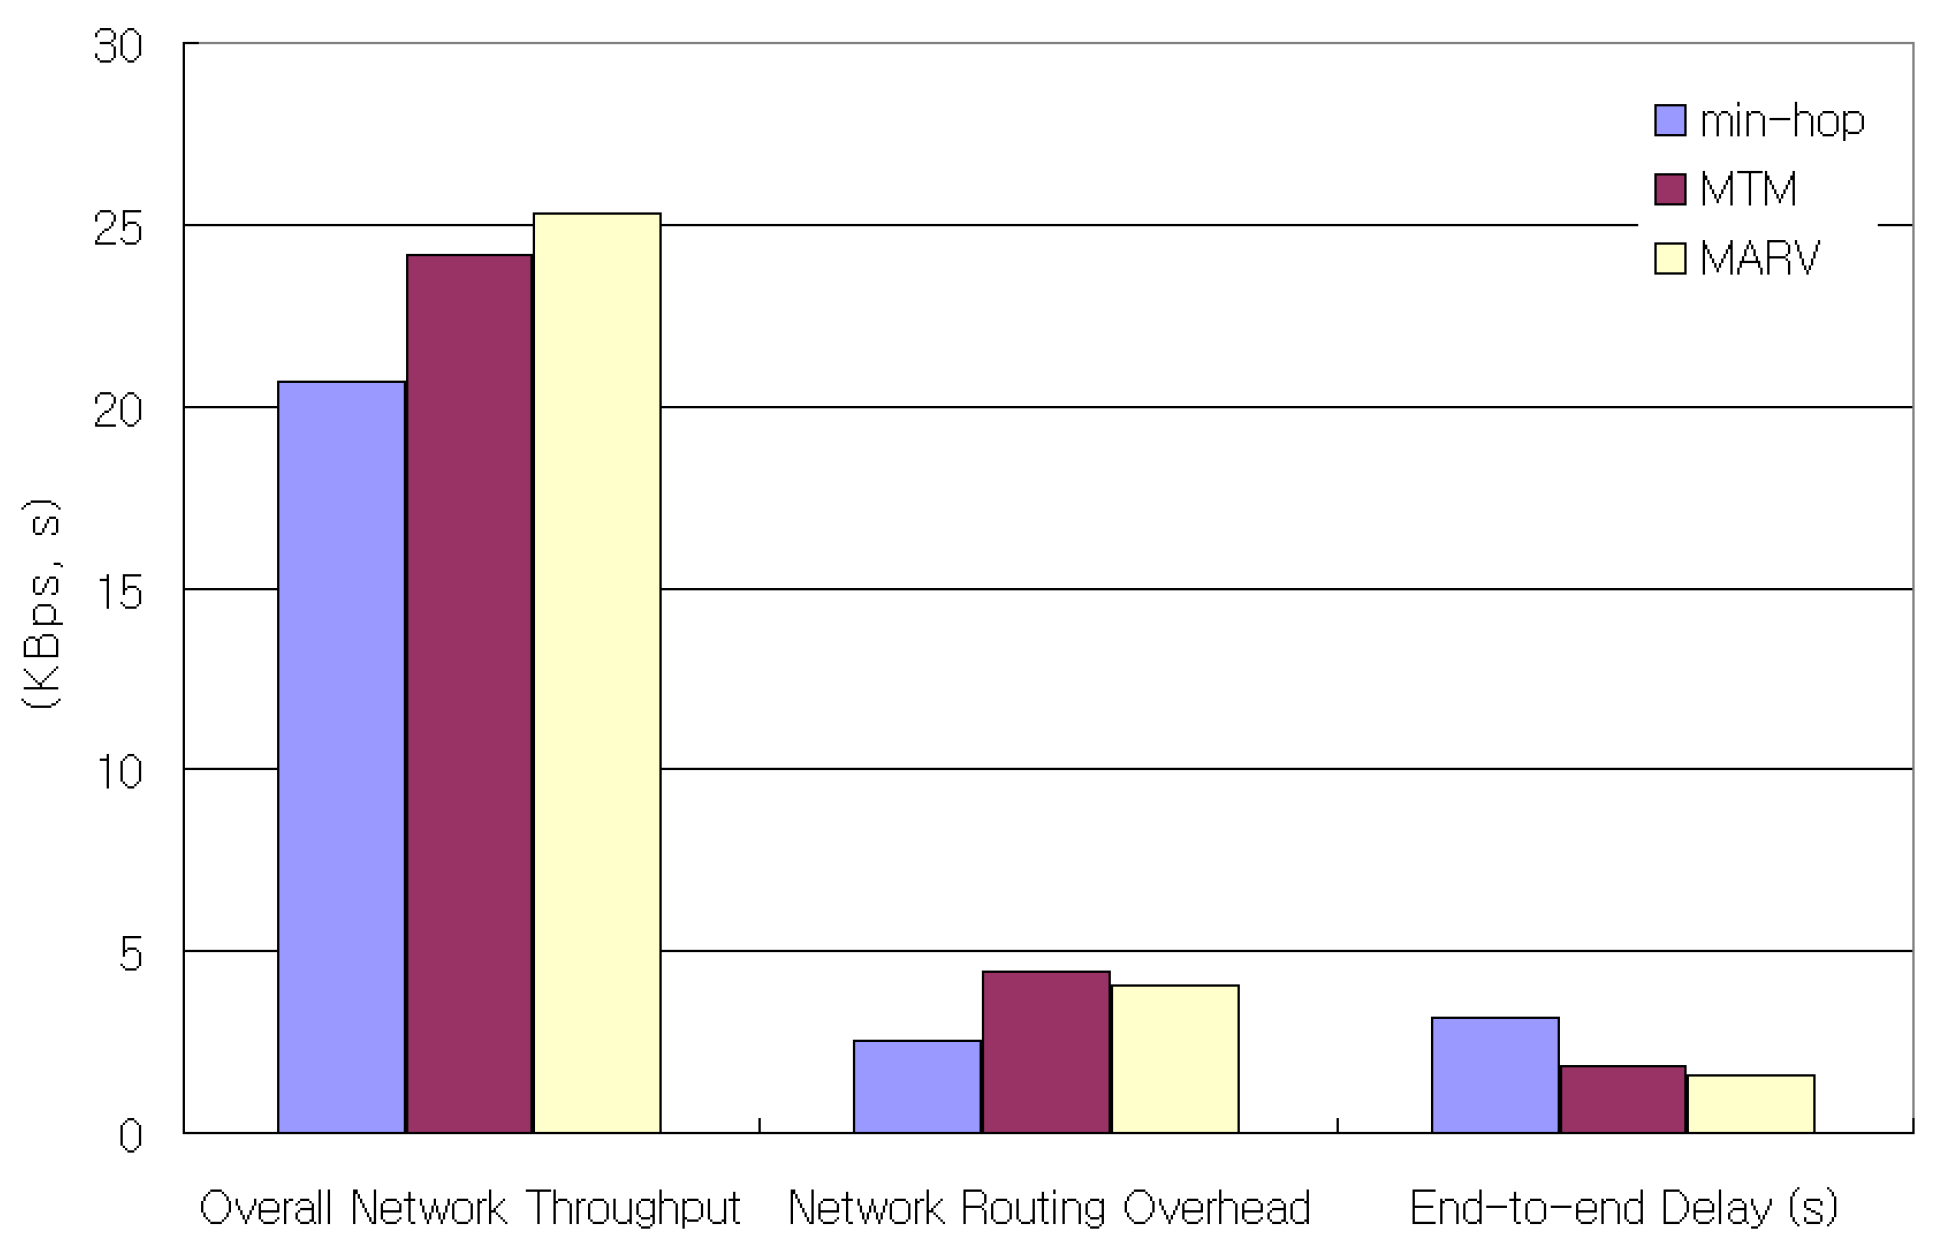
In this simulation, we generated 40 constant bit-rate (CBR) flows, where the sources were randomly picked from 100 nodes in a 300 × 1500 m sized space. Among the CBR flows, 50% of them are 40-byte CBR packet flows, while the other 50% are 500-byte CBR packet flows. We use 40-byte and 500-byte packets to represent the actual Internet traffic presented in [31]. Figure 11 shows the throughput, average end-to-end packet delay, and normalized control overhead of the simulation. The throughput increase over min-hop when only MTM is used is about 16%, while the throughput increase in MARV over min-hop is 22%. This is due mainly to the medium time saved by the small-sized packet flows sent by the min-hop metric. The average end-to-end delay of MARV also decreases about 260 msec more compared to MTM. The normalized control overhead is the value obtained by dividing the total number of control packets by the total number of received packets. We can see that MARV generates less network control overheads compared to MTM.

Figure 11.
Overall network throughput, normalized routing overhead, and end-to-end delay for 40 CBR (UDP) flows.
6.4. Using TCP
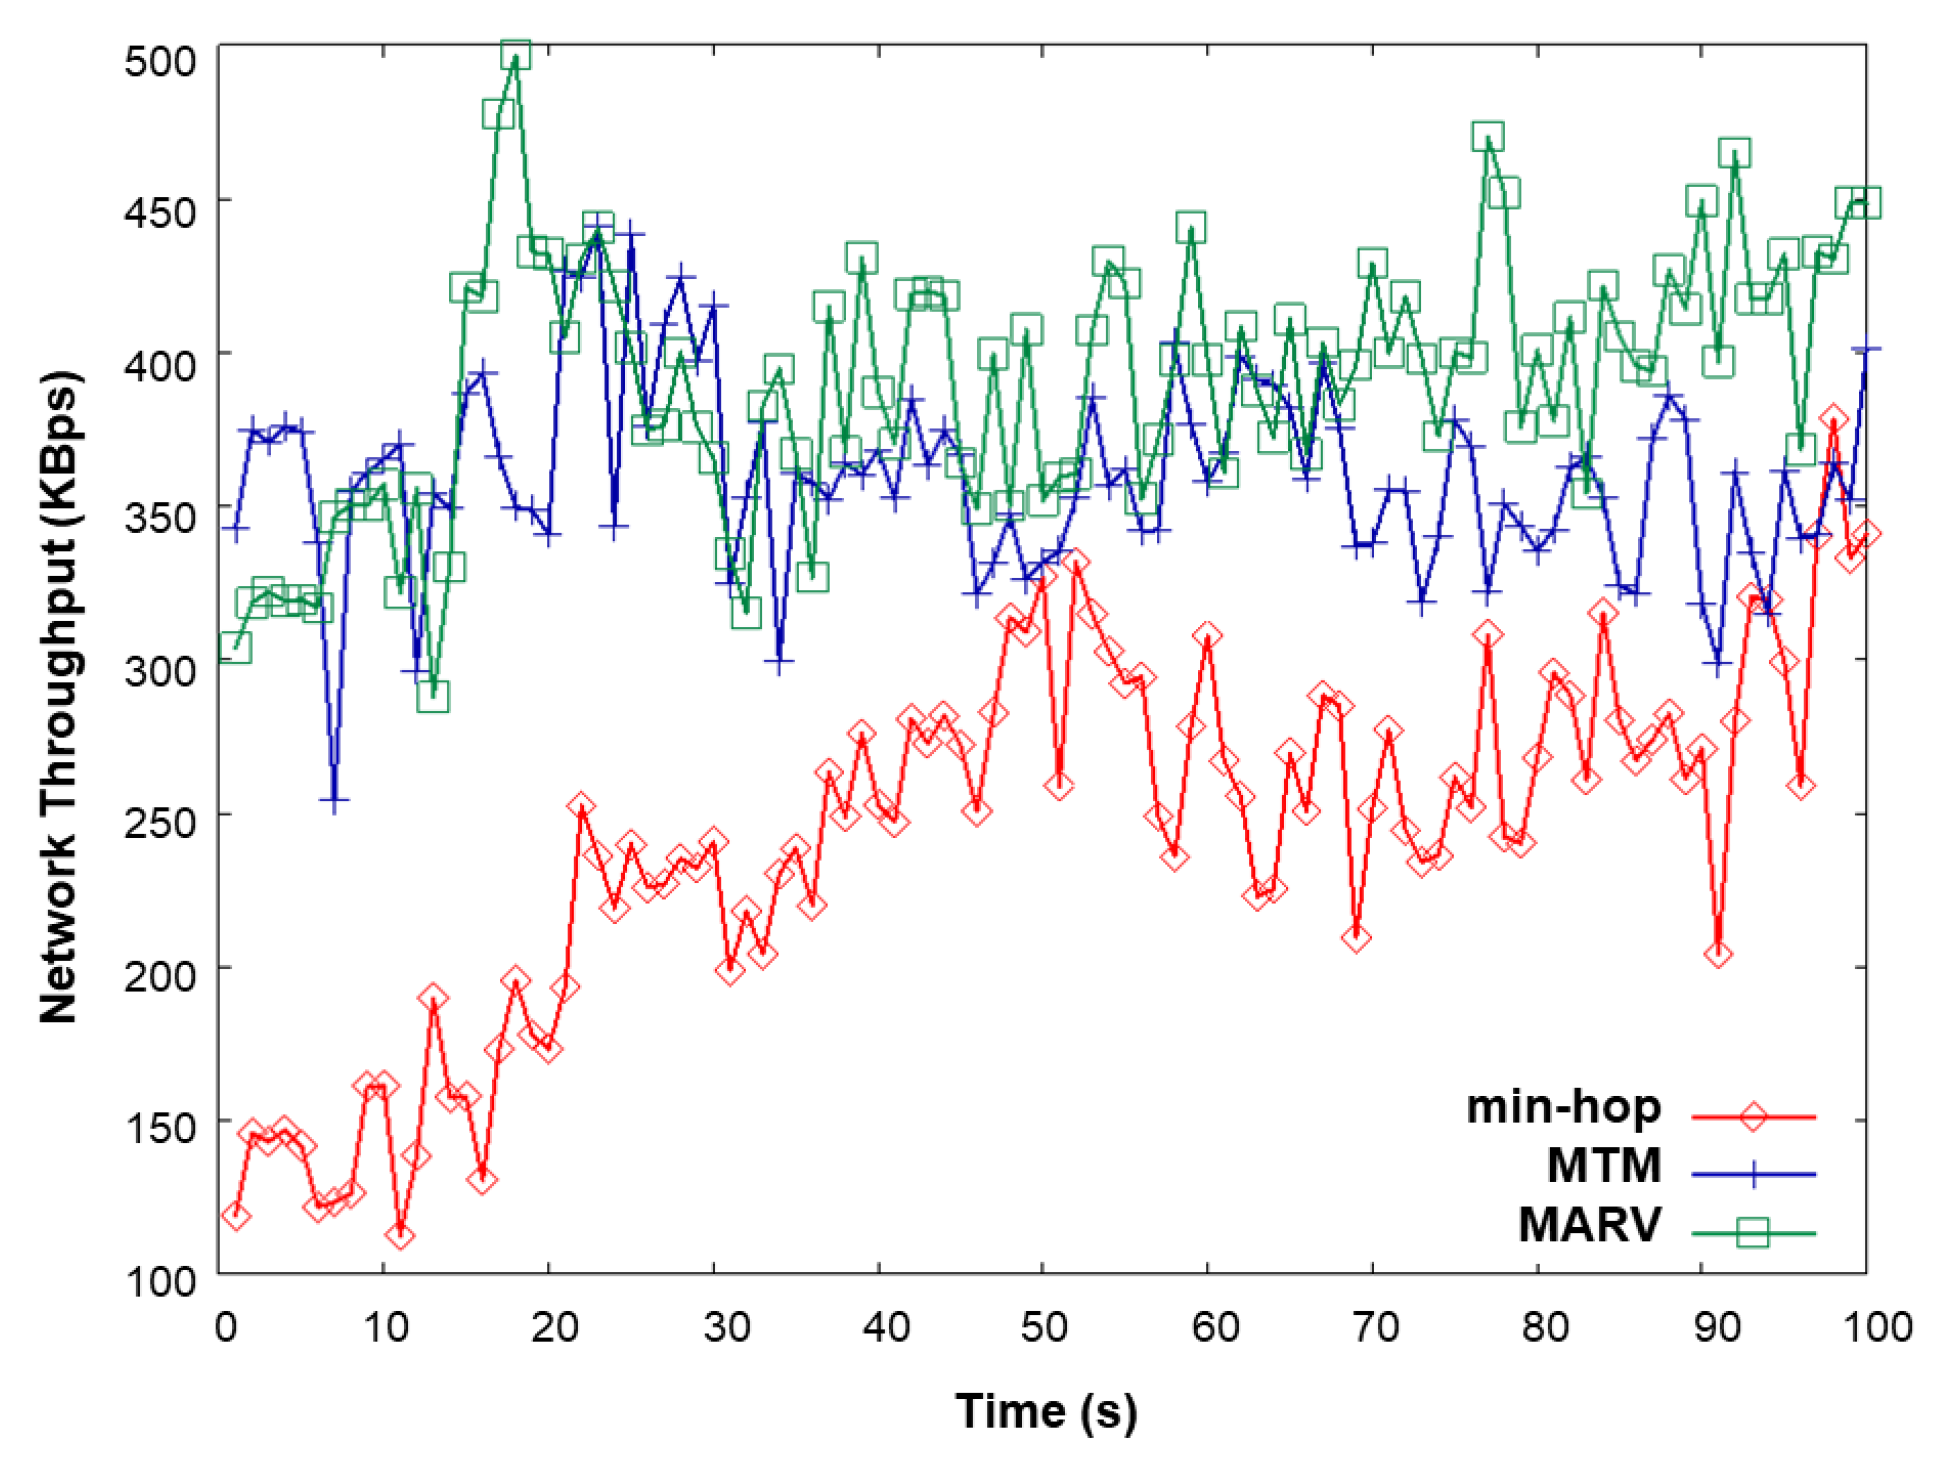
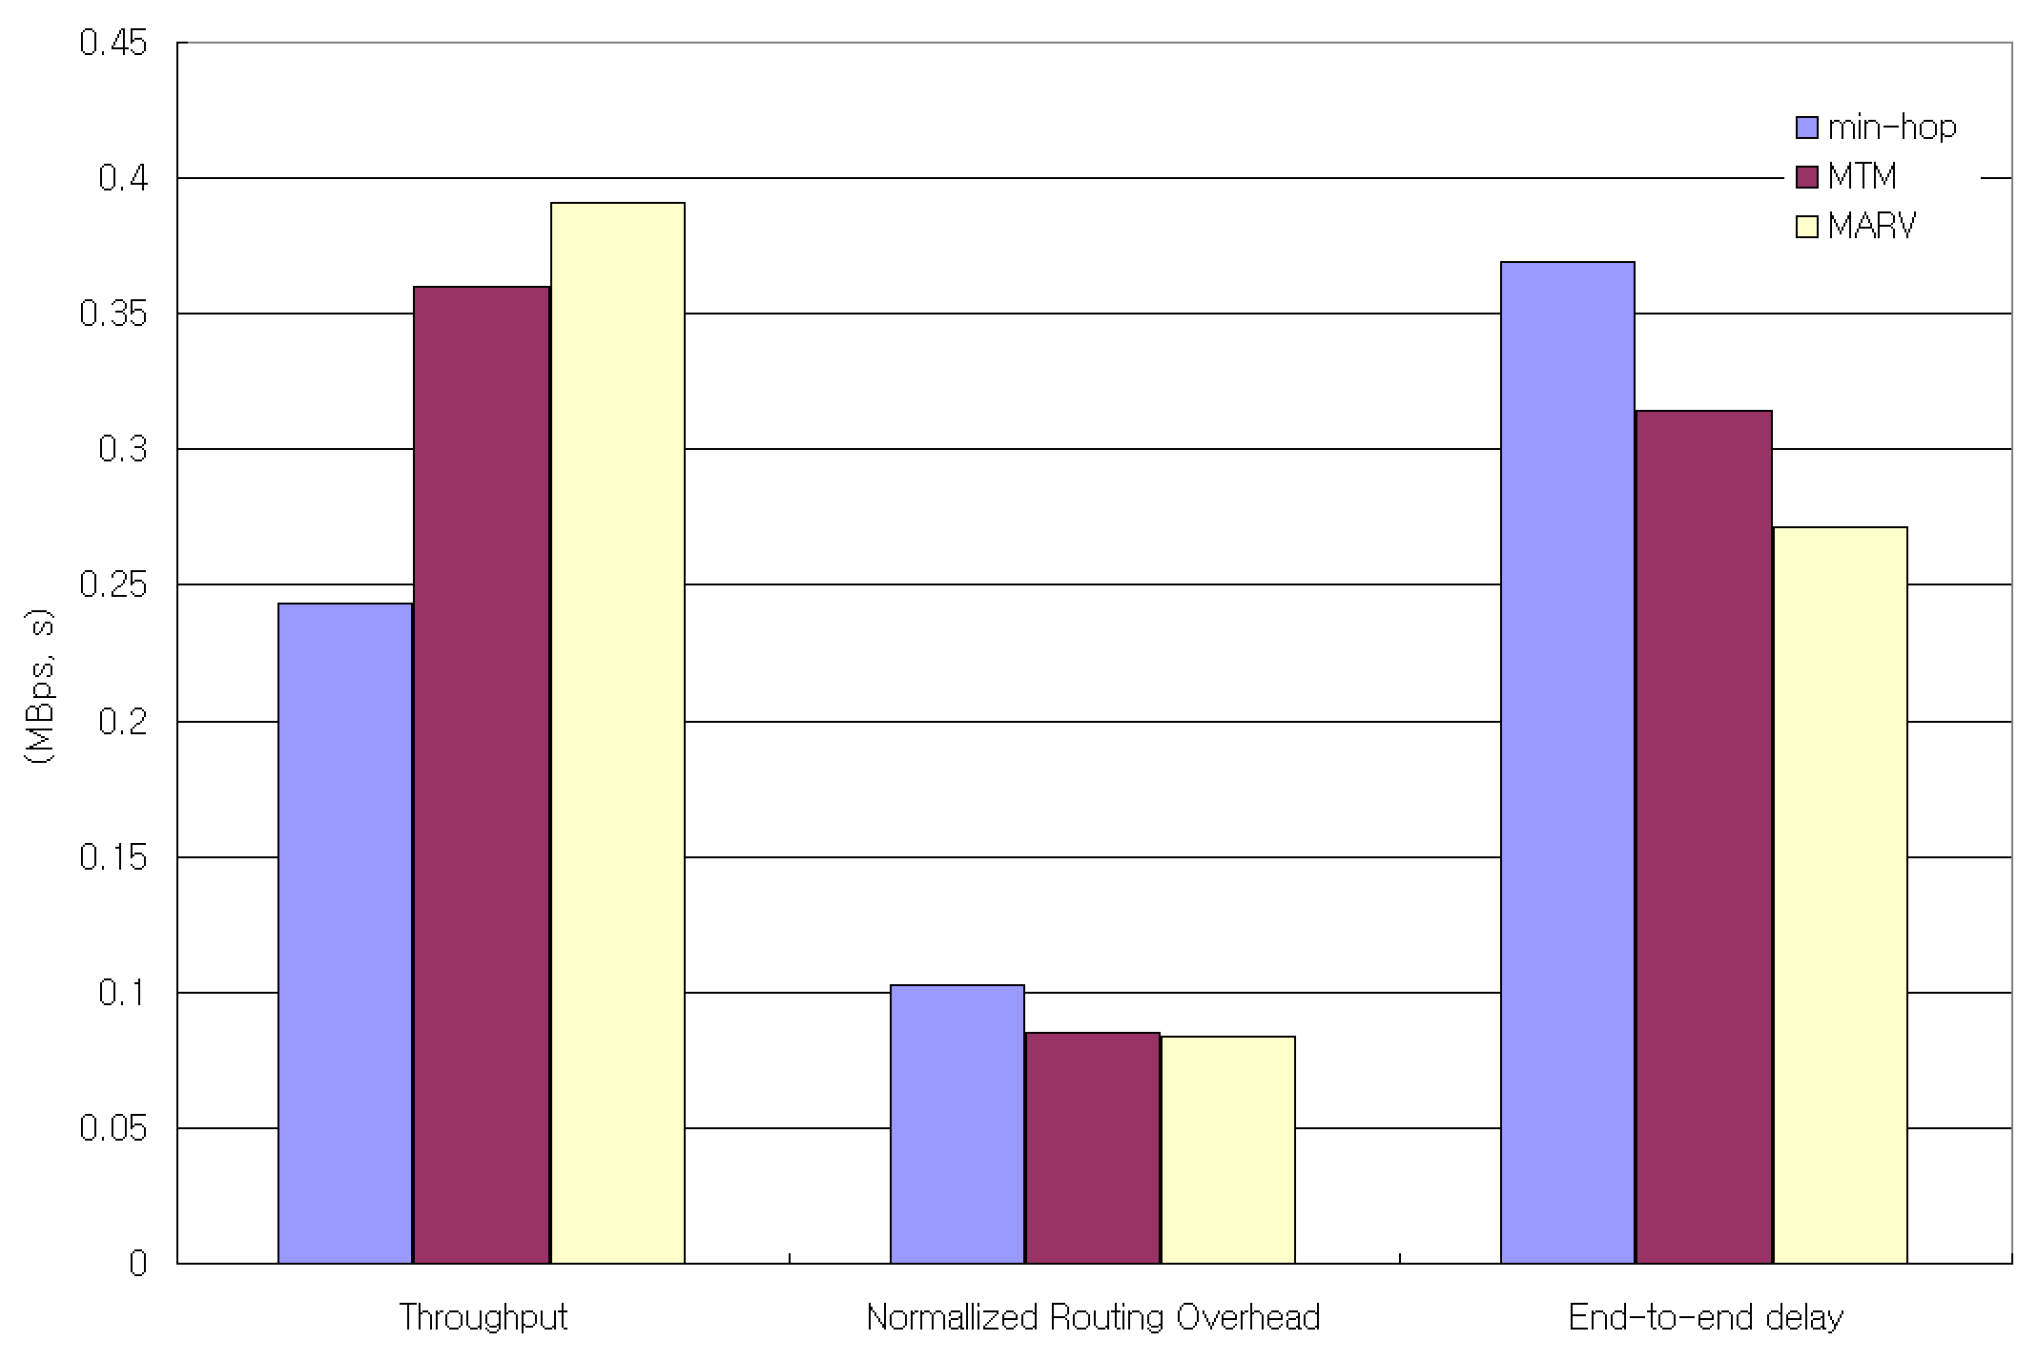
In this simulation, we use 10 file transfer protocol (FTP) sources generating 550- and 1500-byte packets. A new source starts to generate its flow every 5 s, thus increasing the traffic load as time goes. The packet sizes correspond to the actual Internet packet distribution [31]. Figure 12 compares the network throughput of min-hop, MTM, and MARV with the increasing TCP traffic load. MARV is found to outperform both MTM and min-hop. Figure 13 shows the overall network throughput, normalized routing overhead, and end-to-end delay of the simulation.
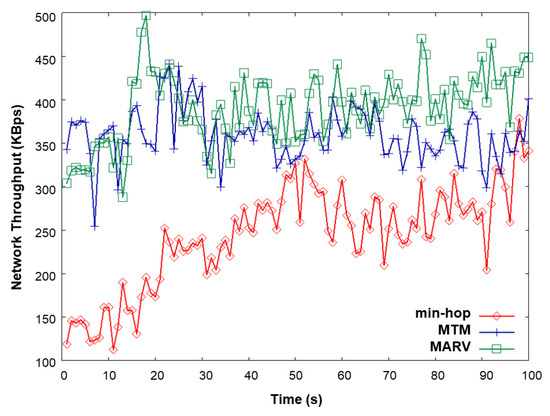
Figure 12.
Network throughput vs. time (traffic load) when TCP is used.
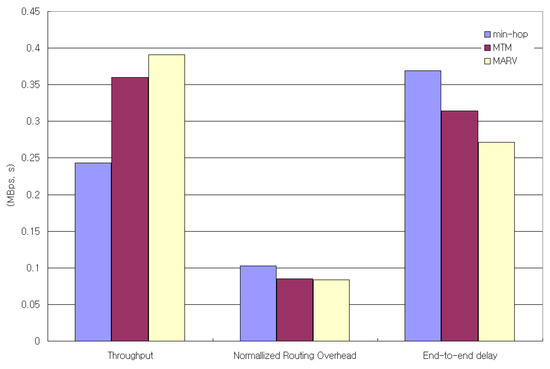
Figure 13.
Overall network throughput, normalized routing overhead, and end-to-end delay for 10 FTP (TCP) flows.
The control overhead of MARV is lower than both min-hop and MTM. By setting the constant value (as discussed in Section 4.2), the intermediate node can rebroadcast only once or twice. This limits the control overhead of MARV while acquiring high-throughput paths.
One thing to note is that as the number of nodes increase, there may be issues in the MAC layer due to high contention and packet collisions. In case of the multi-rate routing, the high-density scenario could be advantageous since it will offer more choices for better high-throughput routes. On the other hand, the routing overhead may increase, but this is limited by the constant value as discussed in Section 4.2.
7. Conclusions and Future Work
Vehicle-to-vehicle communication plays a crucial role in autonomous driving, enabling essential applications, like driver safety, vehicle localization, and automated navigation. Nevertheless, because of the limited transmission range, vehicles may require multi-hop transmissions to establish communication with one another. In this paper, we have proposed an on-demand multi-rate-aware routing protocol called MARV, which selects adequate routing paths depending on the particular packet size. By selecting the adequate path depending on the packet size, MARV gains higher network throughput, lower delay without much control increase.
In our evaluations, we have taken into account network throughput, end-to-end delay, and routing overhead. However, exploring additional parameters, such as transmission power and thermal noise, can be an intriguing issue, as they have potential impact on the transmission range of vehicles. Additionally, real-world scenarios will improve the quality of the performance evaluation. We plan to implement our proposal in real-world settings, such as vehicle mobility, high-density traffic, sudden obstacles, and outdoor wireless, that consider factors such as interference and hardware constraints.
Computation power and memory is a concern when we add more intelligence to the routing algorithm. However, MARV makes minor modifications to the original routing algorithm, so we do not expect much higher computation and memory increase. However, if we are to extend MARV to mobile devices, instead of vehicles, then it would be beneficial to study the effect on computation and memory. We leave this as future work.
Real-world experiments by implementing MARV in real vehicle systems will render new challenges and interesting discussions. We leave the real-world implementation as future work.
Funding
This work was in part supported by the National Research Foundation of Korea (NRF) grant funded by the Korean government (MSIT) (2021R1F1A1063640).
Data Availability Statement
Data sharing is not applicable to this article.
Conflicts of Interest
The author declare no conflict of interest.
Abbreviations
The following abbreviations are used in this manuscript:
| V2V | Vehicle-to-Vehicle |
| BER | Bit-Error Rate |
| MAC | Medium Access Control |
| PHY | Physical |
| MARV | Multi-Path Ad Hoc Routing Protocol for Vehicular Networks |
| ARF | Auto Rate Fallback |
| RBAR | Receiver-Based Auto Rate |
| RTS | Request-to-Send |
| OAR | Opportunistic Auto Rate |
| MAS | Multi-Rate-Aware Sub-Layer |
| MTM | Medium Time Metric |
| CAIDA | Cooperative Association for Internet Data Analysis |
| MTU | Maximum Transfer Unit |
| RREQ | Route Request |
| CBR | Constant Bit Rate |
| FTP | File Transfer Protocol |
References
- Wang, J.; Liu, J.; Kato, N. Networking and communications in autonomous driving: A survey. IEEE Commun. Surv. Tutor. 2018, 21, 1243–1274. [Google Scholar] [CrossRef]
- Liu, S.; Yu, B.; Tang, J.; Zhu, Y.; Liu, X. Communication challenges in infrastructure-vehicle cooperative autonomous driving: A field deployment perspective. IEEE Wirel. Commun. 2022, 29, 126–131. [Google Scholar] [CrossRef]
- Venkitaraman, A.K.; Kosuru, V.S.R. A review on autonomous electric vehicle communication networks-progress, methods and challenges. World J. Adv. Res. Rev. 2022, 16, 013–024. [Google Scholar] [CrossRef]
- Namatherdhala, B.; Mazher, N.; Sriram, G.K. Uses of Artificial Intelligence in Autonomous Driving and V2X communication. Int. Res. J. Mod. Eng. Technol. Sci. 2022, 4, 1932–1936. [Google Scholar]
- Fascista, A.; Ciccarese, G.; Coluccia, A.; Ricci, G. Angle of arrival-based cooperative positioning for smart vehicles. IEEE Trans. Intell. Transp. Syst. 2017, 19, 2880–2892. [Google Scholar] [CrossRef]
- Ort, T.; Paull, L.; Rus, D. Autonomous vehicle navigation in rural environments without detailed prior maps. In Proceedings of the 2018 IEEE International Conference on Robotics and Automation (ICRA), Brisbane, Australia, 21–25 May 2018; pp. 2040–2047. [Google Scholar]
- Hamdi, M.M.; Audah, L.; Rashid, S.A.; Mohammed, A.H.; Alani, S.; Mustafa, A.S. A review of applications, characteristics and challenges in vehicular ad hoc networks (VANETs). In Proceedings of the 2020 International Congress on Human-Computer Interaction, Optimization and Robotic Applications (HORA), Ankara, Turkey, 26–28 June 2020; pp. 1–7. [Google Scholar]
- Belamri, F.; Boulfekhar, S.; Aissani, D. A survey on QoS routing protocols in Vehicular Ad Hoc Network (VANET). Telecommun. Syst. 2021, 78, 117–153. [Google Scholar] [CrossRef]
- Nazib, R.A.; Moh, S. Reinforcement learning-based routing protocols for vehicular ad hoc networks: A comparative survey. IEEE Access 2021, 9, 27552–27587. [Google Scholar] [CrossRef]
- Johnson, D.B.; Maltz, D.A.; Broch, J. DSR: The dynamic source routing protocol for multi-hop wireless ad hoc networks. Hoc Netw. 2001, 5, 139–172. [Google Scholar]
- Perkins, C.; Belding-Royer, E.; Das, S. Ad hoc on-Demand Distance Vector (AODV) Routing. No. rfc3561. 2003. Available online: https://datatracker.ietf.org/doc/html/rfc3561 (accessed on 1 July 2023).
- Perkins, C.E.; Bhagwat, P. Highly dynamic destination-sequenced distance-vector routing (DSDV) for mobile computers. ACM Sigcomm Comput. Commun. Rev. 1994, 24, 234–244. [Google Scholar] [CrossRef]
- Clausen, T.; Jacquet, P. Optimized Link State Routing Protocol (OLSR). No. rfc3626. 2003. Available online: https://www.rfc-editor.org/rfc/rfc3626.html (accessed on 1 July 2023).
- IEEE 802.11ax; IEEE Standard for Information Technology–Telecommunications and Information Exchange between Systems Local and Metropolitan Area Networks–Specific Requirements—Part 11: Wireless LAN Medium Access Control (MAC) and Physical Layer (PHY) Specifications Amendment 1: Enhancements for High-Efficiency WLAN. The IEEE Standards Association: Piscataway, NJ, USA, 2021.
- IEEE 802.11be; IEEE Draft Standard for Information Technology–Telecommunications and Information Exchange between systems Local and Metropolitan Area Networks–Specific Requirements—Part 11: Wireless LAN Medium Access Control (MAC) and Physical Layer (PHY) Specifications Amendment: Enhancements for Extremely High Throughput (EHT). The IEEE Standards Association: Piscataway, NJ, USA, 2021.
- Awerbuch, B.; Holmer, D.; Rubens, H. Effects of multi-rate in ad hoc wireless networks. Tech. Rep. 2003. Available online: https://citeseerx.ist.psu.edu/pdf/fa4be2ead8cdb07ccde997113c69aeebc68013a4 (accessed on 1 July 2023).
- IEEE 802.11-2016; IEEE Standard for Information Technology–Telecommunications and Information Exchange between Systems Local and Metropolitan Area Networks–Specific Requirements—Part 11: Wireless LAN Medium Access Control (MAC) and Physical Layer (PHY) Specifications. The IEEE Standards Association: Piscataway, NJ, USA, 2016; pp. 1–767.
- ur Rehman, S.; Khan, M.A.; Imran, M.; Zia, T.A.; Iftikhar, M. Enhancing quality-of-service conditions using a cross-layer paradigm for ad-hoc vehicular communication. IEEE Access 2017, 5, 12404–12416. [Google Scholar] [CrossRef]
- Seok, Y.; Park, J.; Choi, Y. Multi-rate aware routing protocol for mobile ad hoc networks. In Proceedings of the the 57th IEEE Semiannual Vehicular Technology Conference, 2003. VTC 2003-Spring, Jeju, Republic of Korea, 22–25 April 2003; Volume 3, pp. 1749–1752. [Google Scholar]
- Karmakar, R.; Chattopadhyay, S.; Chakraborty, S. Impact of IEEE 802.11 n/ac PHY/MAC high throughput enhancements on transport and application protocols—A survey. IEEE Commun. Surv. Tutor. 2017, 19, 2050–2091. [Google Scholar] [CrossRef]
- Kamerman, A.; Monteban, L. WaveLAN®-II: A high-performance wireless LAN for the unlicensed band. Bell Labs Tech. J. 1997, 2, 118–133. [Google Scholar] [CrossRef]
- Zanella, A. Best practice in RSS measurements and ranging. IEEE Commun. Surv. Tutor. 2016, 18, 2662–2686. [Google Scholar] [CrossRef]
- Holland, G.; Vaidya, N.; Bahl, P. A rate-adaptive MAC protocol for multi-hop wireless networks. In Proceedings of the 7th Annual International Conference on Mobile Computing and Networking, Rome Italy, 16 July 2001; pp. 236–251. [Google Scholar]
- Asadi, A.; Mancuso, V. A survey on opportunistic scheduling in wireless communications. IEEE Commun. Surv. Tutor. 2013, 15, 1671–1688. [Google Scholar] [CrossRef]
- Sadeghi, B.; Kanodia, V.; Sabharwal, A.; Knightly, E. OAR: An opportunistic auto-rate media access protocol for ad hoc networks. Wirel. Netw. 2005, 11, 39–53. [Google Scholar] [CrossRef]
- Awerbuch, B.; Holmer, D.; Rubens, H. High throughput route selection in multi-rate ad hoc wireless networks. In Proceedings of the IFIP Working Conference on Wireless On-Demand Network Systems, Madonna di Campiglio, Italy, 21–23 January 2004; Springer: Berlin/Heidelberg, Germany, 2004; pp. 253–270. [Google Scholar]
- Yu, H.; Yoo, J.; Ahn, S. A VANET routing based on the real-time road vehicle density in the city environment. In Proceedings of the 2013 Fifth International Conference on Ubiquitous and Future Networks (ICUFN), Da Nang, Vietnam, 2–5 July 2013; pp. 333–337. [Google Scholar]
- Singh, P.; Raw, R.S.; Khan, S.A.; Mohammed, M.A.; Aly, A.A.; Le, D.N. W-GeoR: Weighted geographical routing for VANET’s health monitoring applications in urban traffic networks. IEEE Access 2021, 10, 38850–38869. [Google Scholar] [CrossRef]
- Kudva, S.; Badsha, S.; Sengupta, S.; La, H.; Khalil, I.; Atiquzzaman, M. A scalable blockchain based trust management in VANET routing protocol. J. Parallel Distrib. Comput. 2021, 152, 144–156. [Google Scholar] [CrossRef]
- Broch, J.; Maltz, D.A.; Johnson, D.B.; Hu, Y.C.; Jetcheva, J. A performance comparison of multi-hop wireless ad hoc network routing protocols. In Proceedings of the 4th Annual ACM/IEEE International Conference on Mobile Computing and Networking, Dallas, TX, USA, 25–30 October 1998; pp. 85–97. [Google Scholar]
- McCreary, S.; Claffy, K. Trends in wide area IP traffic patterns-A view from Ames Internet Exchange. In Proceedings of the ITC Specialist Seminar, Monterey, CA, USA, 18–20 September 2000. [Google Scholar]
- Lee, S.J.; Gerla, M. Split multipath routing with maximally disjoint paths in ad hoc networks. In Proceedings of the ICC 2001. IEEE International Conference on Communications. Conference Record (Cat. No. 01CH37240), Helsinki, Finland, 11–14 June 2001; Volume 10, pp. 3201–3205. [Google Scholar]
- Consul, P.C.; Jain, G.C. A generalization of the Poisson distribution. Technometrics 1973, 15, 791–799. [Google Scholar] [CrossRef]
- Proxim Wireless. Available online: https://proxim.com/ (accessed on 1 July 2023).
- The Network Simulator–ns2. Available online: https://www.isi.edu/nsnam/ns/ (accessed on 1 July 2023).
- Rice Networks Group. Available online: https://networks.rice.edu/ (accessed on 1 July 2023).
Disclaimer/Publisher’s Note: The statements, opinions and data contained in all publications are solely those of the individual author(s) and contributor(s) and not of MDPI and/or the editor(s). MDPI and/or the editor(s) disclaim responsibility for any injury to people or property resulting from any ideas, methods, instructions or products referred to in the content. |
© 2023 by the author. Licensee MDPI, Basel, Switzerland. This article is an open access article distributed under the terms and conditions of the Creative Commons Attribution (CC BY) license (https://creativecommons.org/licenses/by/4.0/).