Article

Proactive Coordination of Traffic Guidance and Signal Control for a Divergent Network

1
Faculty of Architecture, Civil and Transportation Engineering, Beijing University of Technology, Beijing 100124, China
2
Department of Civil Engineering, Tsinghua University, Beijing 100080, China
3
College of Civil Engineering and Architecture, Zhejiang University, Hangzhou 310058, China
*
Author to whom correspondence should be addressed.
Mathematics 2023, 11(20), 4262; https://doi.org/10.3390/math11204262
Submission received: 18 September 2023 / Revised: 9 October 2023 / Accepted: 11 October 2023 / Published: 12 October 2023
(This article belongs to the Special Issue Advanced Methods in Intelligent Transportation Systems)

Abstract

:
In the realm of transportation system optimization, enhancing overall performance through the proactive coordination of traffic guidance and signal control in a divergent network can tackle the challenges posed by traffic congestion and inefficiency. Thus, we propose an innovative approach to first allow the information on variable message signs (VMS) that deviates from estimated travel times. This proactive approach guides drivers towards optimal routes from a system-wide perspective, such as minimizing vehicle hours traveled. The deviation is constrained both by the lower bound of drivers’ long-term compliance rate and the upper bound of the favored traffic signal operation. The proposed approach coordinates the traffic guidance system with the signal control system. The traffic signal control system sets the upper limit for information deviation in the traffic guidance system, while the traffic guidance system provides demand predictions for the traffic signal control system. Overall, the objective function of the approach is the network-level performance of all users. We gauge traveler satisfaction as a measure of system credibility, using both a route choice module and a satisfaction degree module established through stated preference surveys. Numerical results demonstrate that proactive-coordinated (PC) strategies outperform reactive-coordinated (RC), proactive-independent (PI), and reactive-independent (RI) strategies by improving the system performance, meanwhile keeping the system trustworthy. Under the normal traffic scenario, the PC strategy reduces total travel time by approximately 10%. Driver satisfaction with the PC strategy increases from a baseline of 76% to 95%. Moreover, in scenarios with sudden changes in either traffic demand or supply, e.g., accidents or large events, the proactive guidance strategy is more flexible and can potentially improve more from the system perspective.

1. Introduction

Traffic congestion is one of the major issues that most metropolises worldwide face. One main reason for this issue is the unmatched growth of road infrastructure and travel demand [1]. Therefore, an interconnected urban transportation service and management network is important to improve the system’s efficiency [2]. Presently, an important network service is the traffic flow guidance based on roadside equipment, vehicle terminals, or mobile devices. Many studies have been focused on traffic flow guidance by providing drivers with real-time information [3], such as Dynamic traffic assignment (DTA). DTA can be traced back to the work of Wardrop’s user-equilibrium and system optimum. The assignment was based on optimization to assign each origin-destination (OD) flow onto various alternate paths from that specific origin to the destination node [4]. In recent years, the surrogate-based optimization (SBO) method has been applied to some transportation research [5,6,7]. Different from the equilibration process of simulation-based DTA, SBO does not need to carry out simulations iteratively till the user-equilibrium condition is obtained within some tolerance limit.
To realize effective traffic guidance, accurate prediction of traffic conditions is a prerequisite and important [8]. Here, travel behavior consists of a driver’s response to the guidance information and his/her compliance behavior [9]. Most previous research focused on consistency between the prediction of traffic conditions for traffic guidance and traffic conditions under-realized traffic guidance strategies. A series of approaches were proposed to keep consistency, e.g., the singular value decomposition approach for consistency [10], and the integration of demand consistency with network state consistency [11]. In this context, a day-to-day traffic assignment model is proposed to capture traveler path-switching behaviors under advanced information [12]. Information-based network control strategies were further proposed to both estimate and manage queue lengths at individual intersections, while also addressing the overall network congestion. [13]. A fuzzy control approach was developed to determine the best routes for all drivers based on the estimation of drivers’ response behavior [14]. For traffic guidance, consistency has an impact on drivers’ compliance rate, which is also a key element in understanding route choice behavior. Ozbay suggested that compliance behavior should be well-considered in a traffic guidance system [15]. The compliance rate represented the degree of trust in information, and a high compliance rate was the foundation of an effective traffic guidance system. The level of compliance should not remain constant; instead, it should be a dynamic variable influenced by the knowledge and experiences of travelers. Xu et al. [16] studied control effects under a variable compliance rate. Their split rate was the sum of experiential splitting ratios multiplied by the compliance rate. Considering robustness in the proposed strategies is significant because of the uncertainty in driver behavior [17].
The coordination of traffic guidance strategy and signal control strategy has appeared in the literature to further improve network-level performance [18,19]. Interactions and interdependence exist between travel guidance services and traffic signal operations. Traffic guidance strategies affect the spatial distribution of traffic. Signal control strategies affect the travel experiences of drivers directly and their preference for guidance systems indirectly [20]. Coordinated strategies for guidance and signal control aiming to improve system performance by providing information via variable message signs (VMS) and favored traffic signal operations. Previous attempts had predicted travel behavior through the concept of user equilibrium or dynamic user equilibrium [21,22]. Some major assumptions in these studies were rational thinking and complete knowledge of network-level performance. The advanced data collection means, particularly mobile technologies and vehicle-infrastructure networks will lead to the availability of information on behavior preferences and characteristics of road users [23]. Discrete behavior modeling can improve the prediction accuracy of behavior and decisions of users. A proactive guidance model with predicted traffic conditions and expected choices of drivers can potentially alleviate recurrent congestions or incident-induced impacts by adjusting control measures in advance. Thus, a system that is capable of providing predicted traffic information to drivers can provide a proactive route guidance mechanism that could decrease travel times [24]. Claes and Holvoet explained a proactive traffic route guidance system that utilizes an online embedded simulation distributed across road infrastructures, coupled with a delegate multi-agent system, all operating on the foundation of a symbiotic relationship [25]. They found that proactive traffic guidance strategies could outperform reactive traffic guidance mechanisms. Adbelghany et al. [26] proposed a decision support system for proactive-robust traffic network management, which accounts for uncertainty in the network’s operational conditions.
The robustness of the proposed behavior-based control strategies should be examined due to the uncertainty of driver behavior. Yin and Yang [27] developed a control system to effectively ensure the robustness of control strategies due to travel time uncertainty under recurrent network congestion. Hong and Tung [28] defined route choice behavior in the context of uncertain travel times, employing the concept of probabilistic user equilibrium. Lindsey et al. [29] studied the effect of pre-trip information on route-choice decisions. However, the uncertainty in the route selection behavior of users based on the road traffic performance and the satisfaction of users has not been well addressed in the literature. Given that such uncertainty in driver behavior and travel demand is significant, controller stability is necessary to be carefully considered [30,31]. Here, user satisfaction is a measure of the consistency between guidance information and the realized traffic states from the perspective of road users. In general, the higher consistency corresponds to a higher user satisfaction degree.
To make a modest contribution to the fast-developing research field of behavior-based traffic control approach, this study formulates a proactive-coordinated model predictive controller to optimize the coordinated strategies of traffic signal and VMS guidance for a divergent network. This paper integrates several components in a rolling horizon framework to analyze the coordination of proactive traffic guidance and signal control: behavior-based proactive traffic guidance model, coordination of traffic guidance and traffic signal control, a multinomial Logit route choice model, a traffic flow simulator SUMO as an evaluation method of strategies. The main highlights can be condensed as follows:
(1)
The key innovation lies in the proactive coordination approach, allowing VMS to guide drivers based on system optimization while respecting compliance rates and preferred traffic signal operations.
(2)
The approach integrates traffic guidance and signal control systems, with traffic signal control setting upper bounds for information deviation, and the traffic guidance system providing demand predictions, ultimately optimizing network-level performance.
(3)
The proactive coordination strategy demonstrates flexibility, particularly in scenarios with sudden changes in traffic conditions, such as accidents or events, where it outperforms reactive and independent strategies.
The remainder of this paper is summarized as follows. Section 2 briefly presents the optimization framework, develops driver behavior models based on the stated preference (SP) survey, and then elucidates the optimization-based methodology. Section 3 presents computational results in a typical divergent network. Section 4 discusses the key findings, implications, and limitations. Finally, Section 5 concludes our findings and suggests future work.

2. The Proposed Method

2.1. The Overall Logical Architecture

At present, traffic guidance systems passively present the current traffic information on VMS and allow drivers to make their own route choices [32]. Once decisions are made, traffic signal control systems rely on road sensors to detect vehicles’ presence to allocate time and resources among various signal phases. In order to achieve better system performance, the proposed approach allows the information on VMS to deviate from the current status in order to proactively guide drivers toward route choice from the system perspective. The deviation from the “current” status is constrained by the lower bound of drivers’ long-term satisfaction rate and the upper bound of the favored traffic signal operation. Through proactive guidance and coordinated system modeling, the proposed approach has the potential to achieve better overall system performance.
Essentially, the proposed approach is not constrained by the size and shape of the road network. However, the growth in network size and complexity would definitely increase the difficulty of computation and implementation. Certainly, the traffic control modeling can vary to accommodate the size and complexity of the network, e.g., the adaptive control algorithm for small or large networks, and the green-band control for a medium-size network. Among various network shapes, the divergent network with two route alternatives is a fundamental element of a general road network when considering traffic guidance and area-wide signal control. The paper focuses on a divergent network of medium-size, e.g., no more than 10 intersections on each leg.
Figure 1 conceptually shows the logical architecture of the proposed coordinated approach. In this framework, we formulate a proactive-coordinated (PC) model predictive controller to optimize coordinated strategies of traffic signal and VMS guidance for the divergent network. The proposed approach aims to identify strategies for improved performance but without any guarantee and any relationship to the unknown global optima. In this framework, the optimization process is closely integrated with the estimation of driver behavior.
The control approach consists of the following four components:
  • Control input: The system utilizes traffic demand, and traffic states as the control input.
  • Optimizer: The optimizer can accomplish the joint optimization of the proactive signal operation and VMS guidance strategies. The objective function of the optimizer is to minimize the total travel time of all drivers in the divergent network.
  • Flow split estimation and traffic state prediction: The general route choice behavior can be estimated on the basis of a given VMS strategy. The route choice behavior model together with the compliance behavior model can estimate the flow split rate, which can further impact traffic states. The change in traffic states will result in a different satisfaction rate. Correspondingly, the previous compliance rate will be updated. An equilibrium and convergence process exists, as shown on the right side of Figure 1.
  • Control output: The controlled traffic states are sent back to the optimizer to evaluate the objective function. Improved coordinated strategies are obtained at the end of the entire control process.

2.2. Route Choice Behavior Model

The proposed route choice behavior model is to estimate how travelers make their route choices under the information provision by the VMS at the divergent location. As shown in Figure 1, the behavior model consists of three modules: en-route route choice module, satisfaction degree module, and learning process module. In this study, all of the modules are calibrated based on the data from the SP survey for the divergent network. In a real network with a realistic number of possible OD pairs and route choices, a route guidance system would provide travelers with information for multiple alternative routes. Since the divergent network is a classical and simplified component of a complicated network, this study chooses the divergent network for a theoretical analysis. Such analysis results can be a reference for further studies on a more complicated network representation.

2.2.1. Stated Preference Survey

Graphic VMS panels release information with a “congestion scale”, i.e., a graphic road network with different colors. To illustrate, red represents that the average speed is lower than 20 km/h, yellow represents that the average speed is 20 km/h through 40 km/h, and green represents that the average speed is higher than 40 km/h. Mao et al. [33] conducted an SP survey to investigate driver diversion behavior under VMS guidance and explore the driver’s satisfaction degree in VMS. In that research, ratios of red, yellow, and green segments on a certain route were utilized as a measure.
Driver attributes are classified into the following categories:
  • Sociodemographic attributes of drivers: Age, gender, personal income, household income, driving years, average annual mileage, educational level, occupation, and car type.
  • Preference information: Diversion behavior of drivers to VMS; satisfaction degree of drivers in VMS compared with their actual experience.
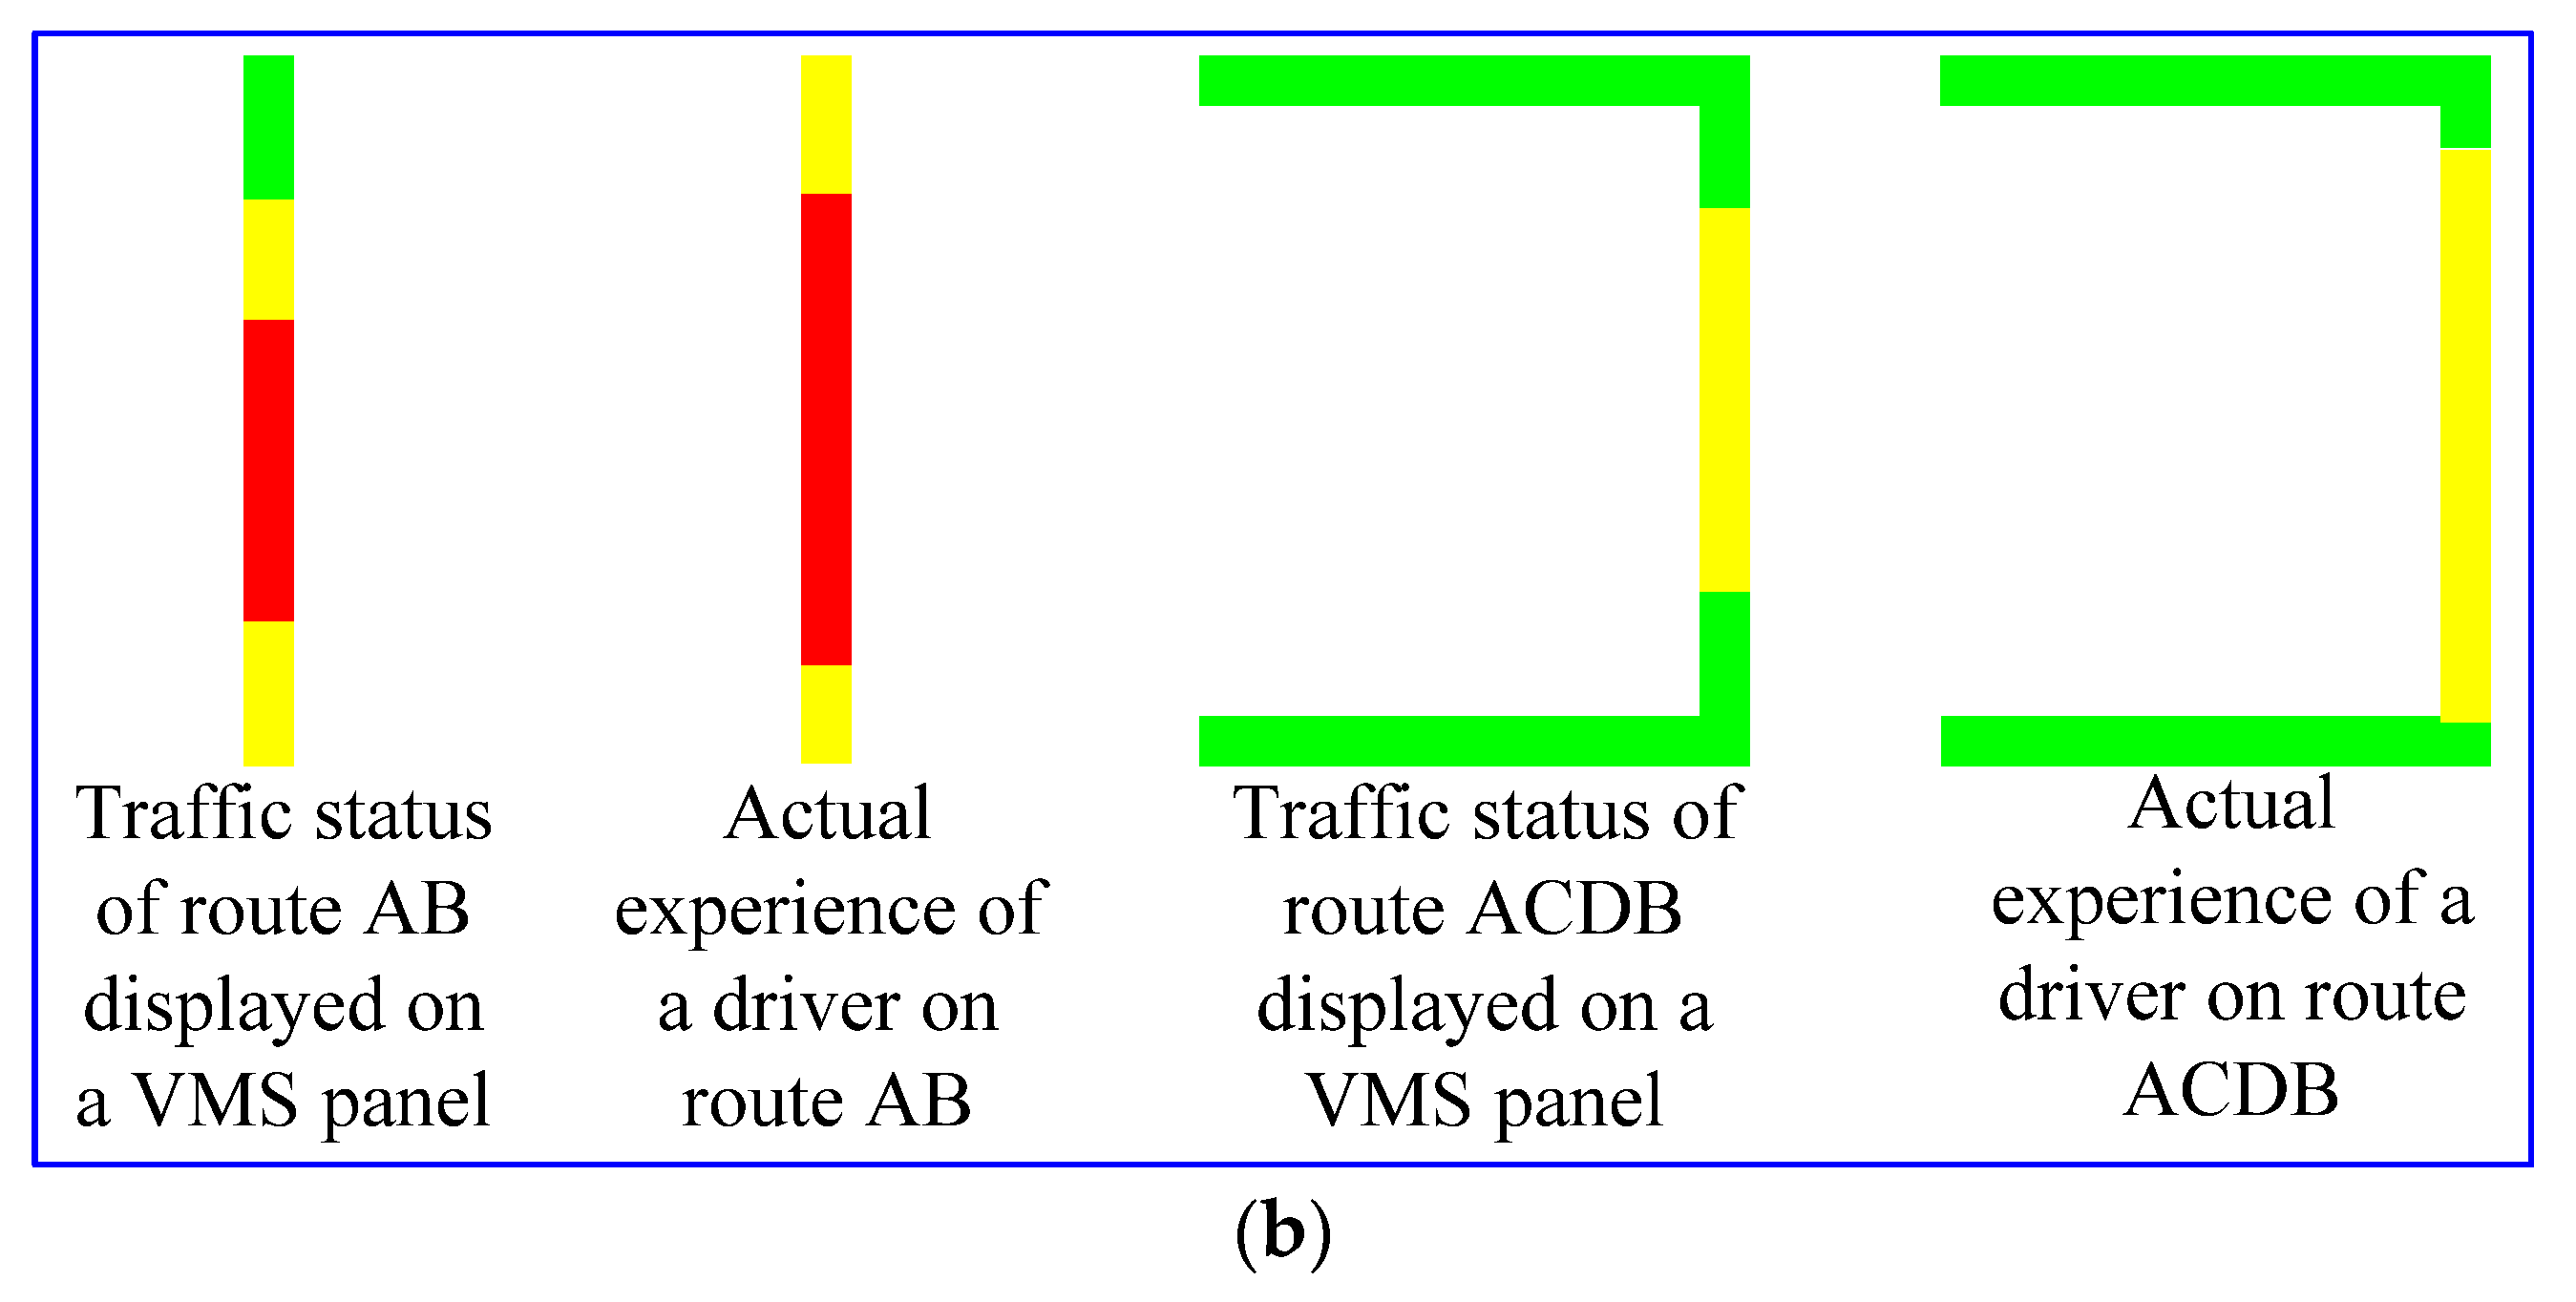
  • Dynamic graphics information on VMS panels (Figure 2): Lengths of the pre-trip route (AB) and detour route (ACDB); color ratios of green, yellow, and red ratios on each route; diversion advice.
The notations for behavior modeling are listed in Table 1.

2.2.2. En-Route Route Choice Module

The drivers’ response to VMS was represented using a binary Logit model with two choices (0/1). In this model, ‘0’ indicates sticking to the original route, while ‘1’ indicates taking a diversion. Logistic regression was employed to analyze the data related to driver diversions. As previously mentioned, many factors influence route switching and compliance behavior, including traffic states displayed on VMS panels.
In this study, we extracted the following six variables: red segment ratio on route A-B, yellow segment ratio on route A-B, red segment ratio on route A-C-D-B, length of route A-B, length of route A-C-D-B, and diversion suggestion.
We utilized the responses from drivers who paid attention to the VMS-based information. Before conducting the regression analysis, a Chi-square test was performed, and a significance analysis was also carried out. The parameter calibration results of the binary Logit model are presented in Table 2. It is worth noting that the estimated coefficients of these variables were found to be statistically significant at the 95% confidence level. The likelihood of diversion was positively affected by the length of route AB, diversion suggestion, and red segment ratio of route AB, whereas it was negatively affected by the length of route ACDB and red segment ratio on route ACDB.
Thus, the utility function ( V n ) of the driver n in choosing the alternative route is formulated as
V n = α 0 + α 1 l 1 + α 2 l 2 + α 3 R L R 1 + α 4 R L R 2 + α 5 δ s u g g e s t i o n
The probability ( P n ) for individual n to choose the alternative route (divert) can be given by
P n = exp ( V n ) 1 + exp ( V n )

2.2.3. Satisfaction Degree Module

The satisfaction degree reflects a driver’s perception of the accuracy or consistency of a guidance strategy. This degree of satisfaction can be influenced by various factors, including the personal characteristics of drivers, their travel patterns, and the level of deviation between the traffic information provided by VMS and the actual traffic conditions experienced by the driver. In this survey, we developed a questionnaire to assess the level of satisfaction among drivers. Initially, respondents were inquired about their sociodemographic characteristics. Subsequently, they were presented with a set of questions related to their opinions and preferences regarding information services provided through VMS. Figure 2b illustrates the information conveyed through VMS and the real traffic status. Respondents provided their satisfaction ratings using a six-point Likert scale. The Likert scale was chosen to gather substantial data and gain a better understanding of driver behavior. However, for the sake of simplifying the satisfaction degree model, we converted the Likert scale into a binary choice. Respondents who selected 3, 4, or 5 were considered dissatisfied with the VMS service, while those who selected 0, 1, or 2 were considered satisfied. The satisfaction degree of drivers in the VMS guidance service was modeled by a binary Logit model. Two options were employed, represented by the values 0 and 1. In this context, ‘0’ signifies satisfaction with the guidance, while ‘1’ indicates dissatisfaction with the guidance. We obtained the significant variable, differences in red segment ratio, which can also be detected by the real-world system. The coefficient, standard error, and significance are shown in Table 3. Although gender and commute time are also significant in the satisfaction degree of drivers, we cannot consider it as the input of the controller because it is impossible for a system to detect such information directly.
Thus, driver n’s utility function ( U n ) of satisfying with guidance is formulated as
U n = β 0 + β 1 Δ R L R
The satisfaction degree ( S n ) that individual n is satisfied with the VMS guidance can be further obtained in the following equation:
S n = exp ( U n ) 1 + exp ( U n )

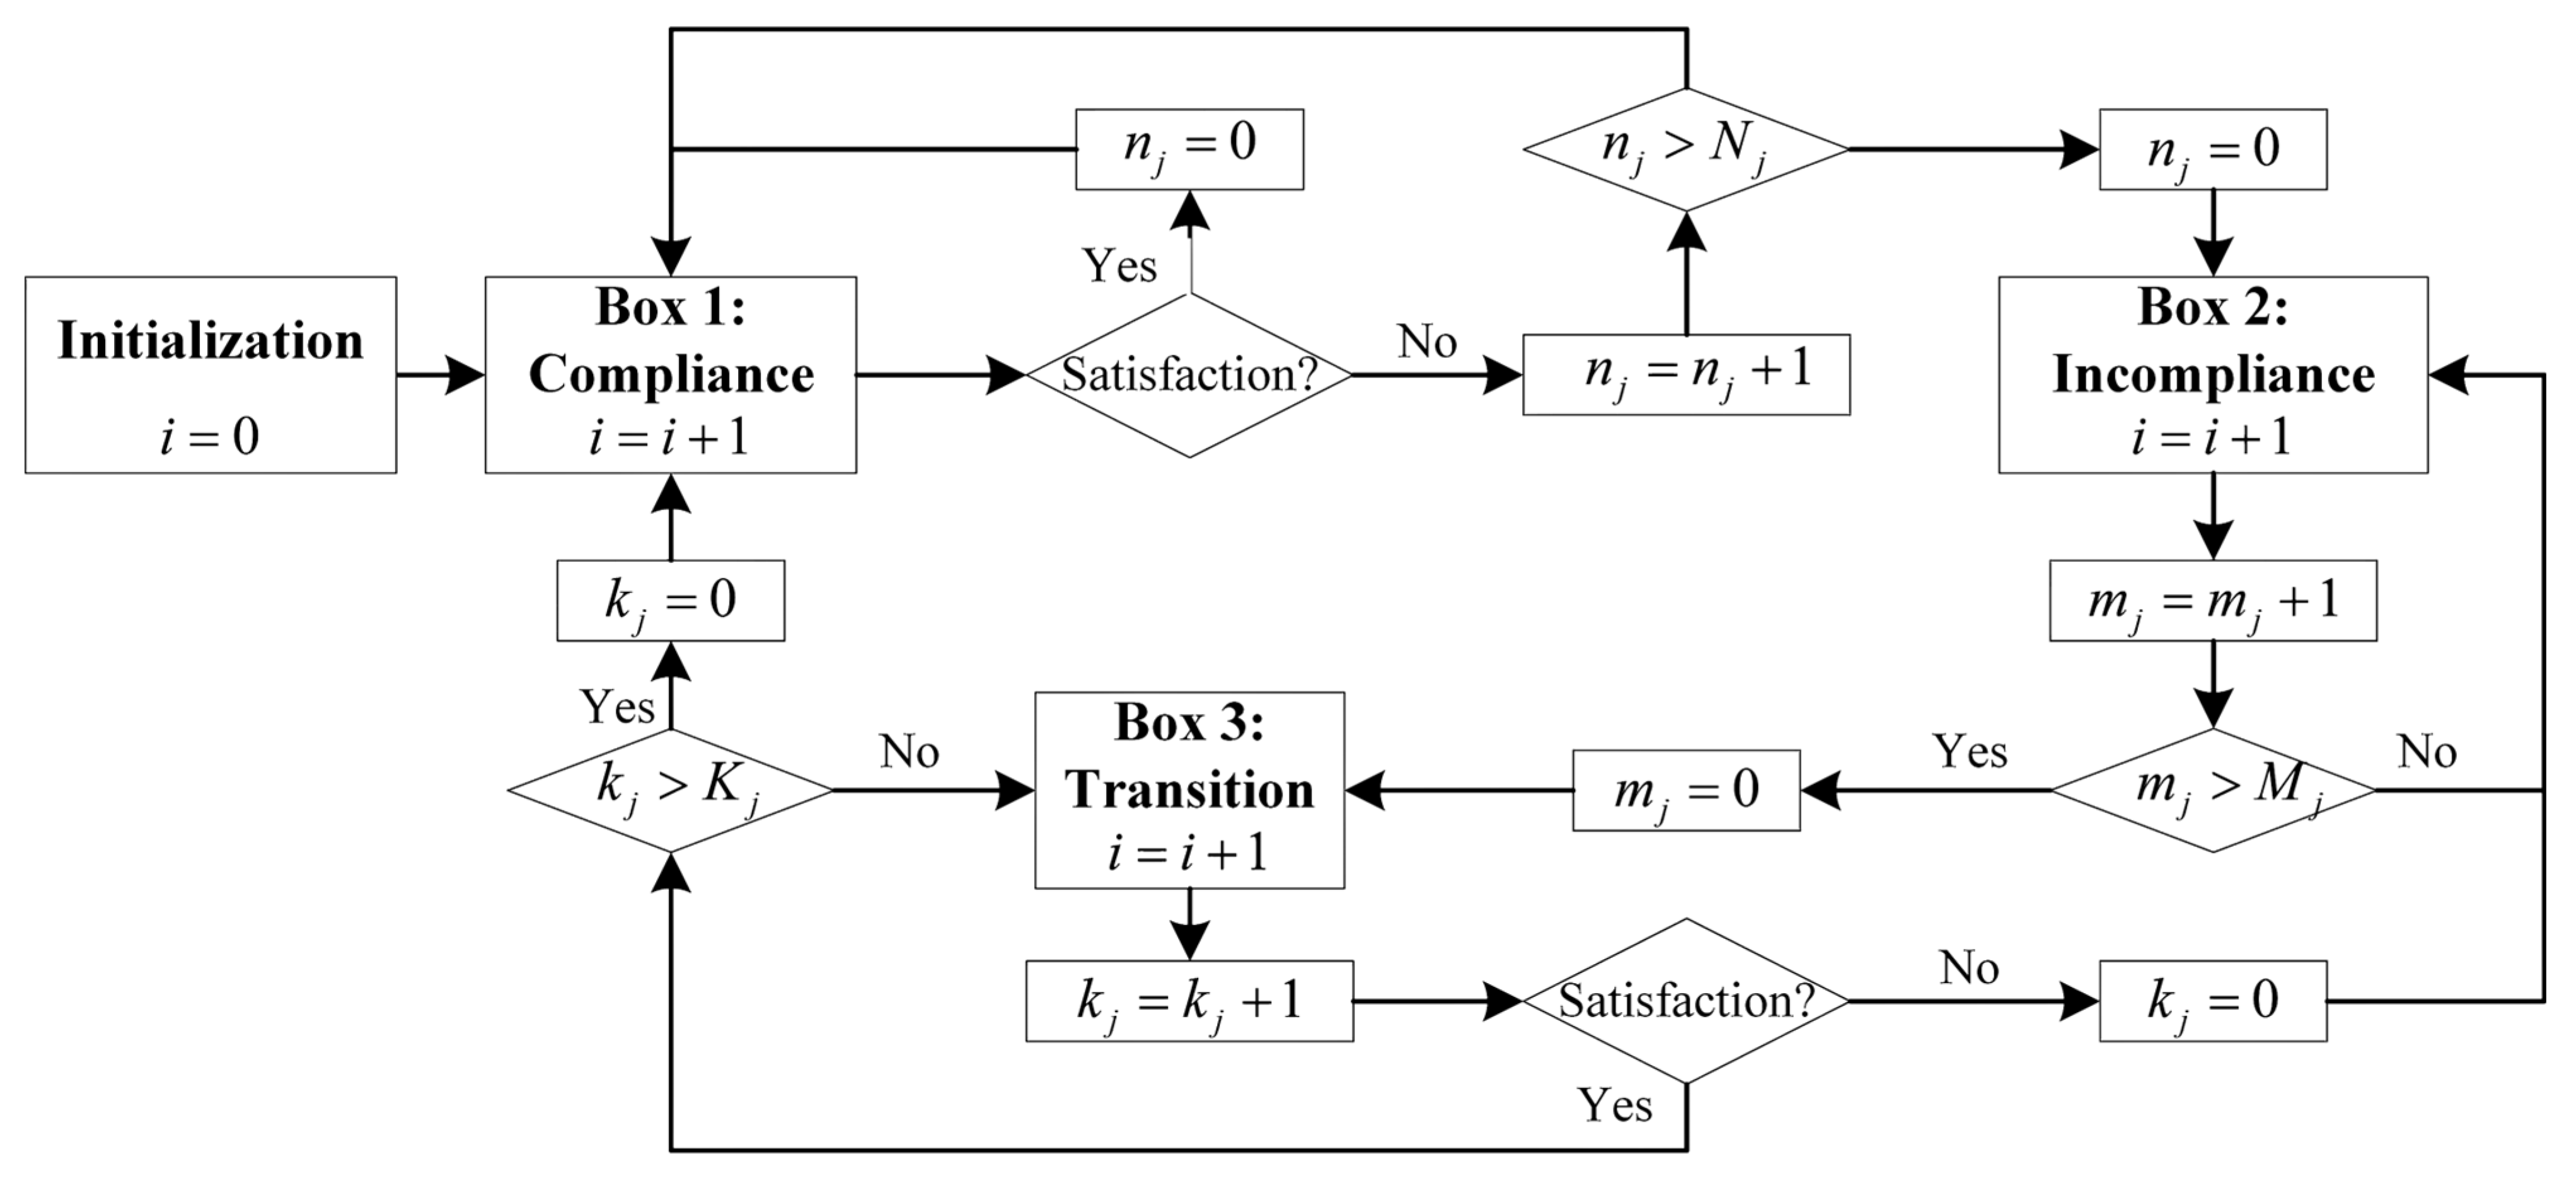
2.2.4. Learning Process Module

VMS guidance is not obligatory for drivers; it is a voluntary choice for them to follow or not. The recognition of compliance behavior aims to identify the decisions made by multiple respondents based on a series of questions regarding their choices as agents. In this research, we assumed that the compliance behavior of drivers varied according to their level of satisfaction. Specifically, each driver (referred to as an agent) possesses individual characteristics and a history of compliance behavior, as shown in Table 4 and Table 5. The record of compliance behavior includes information such as the number of times an agent receives VMS-based information, the agent’s ID, and the box ID (indicating the compliance status of drivers) during the i-th round of information provision.
Figure 3 includes three boxes (i.e., compliance box, in compliance box, and transition box) that represent the compliance behavior of an agent when he/she receives the VMS-based guidance information. Their compliance behavior (box ID) changes according to the following rules:
  • If continuous dissatisfaction number n j > N j , the agent j transitions from compliance to incompliance status;
  • If continuous incompliance number m j > M j , the agent j transitions from incompliance to transition status;
  • If dissatisfaction occurs during the transition period, the agent j transitions from the transition to incompliance status;
  • If the number of continuous transitions k j > K j , the agent j transitions from the transition to compliance status.
The specific thresholds for these rules were determined based on survey data. As a result, the compliance rate under a certain satisfaction level can be calculated by considering a larger number of agents in the analysis.

2.2.5. Relationship between Satisfaction Rate and Compliance Rate

The compliance rate is a measure that quantifies the proportion of drivers who decide to rely on the VMS information. When all drivers choose to trust the information, it is assumed that the route choice follows the Logit model. Conversely, if all drivers become frustrated with the information and decide not to use it, it is assumed that they will stick to their experiential or habitual choices instead. Computational experiments were carried out to investigate and establish the connection between the satisfaction rate and the compliance rate. Static and dynamic properties of agents in Table 4 and Table 5 can be determined based on SP surveys. As shown in Figure 3, agents learn to adjust their compliance behavior under a certain satisfaction rate. Given a satisfaction rate SR, the agents who are satisfied with VMS information are randomly selected for N times in every simulation step. With each random selection among N, those satisfied agents make their decisions between “compliance” and “in compliance” following the learning process. Each simulation step generates a minimum, a maximum and an average compliance rate among N selections. The overall compliance rate under a given satisfaction rate converges to a certain level. The compliance rate typically exhibits a positive correlation with the satisfaction rate. When the satisfaction rate is low, the compliance rate tends to be low as well. Conversely, when the satisfaction rate is high, the compliance rate approaches 1. This relationship between the compliance rate and the satisfaction rate can be characterized by the following calibrated polynomial model:
C R = F ( S R ) = 3.02 S R 4 + 4.4 S R 3 0.427 S R 2 + 0.0648 S R + 0.0018

2.3. Coordinated Mechanism of Traffic Guidance and Signal Control

2.3.1. Optimization Model

Among most traffic guidance systems in practice, the current detected traffic status information is displayed on VMS to assist travelers in making their route choice decisions. It is a reactive strategy because the information provision is not from the perspective of system optimization. In comparison, the proactive traffic guidance strategy can actively adjust the information provision within a certain boundary in order to achieve better system performance. On the other hand, most present traffic signal control systems are independent of traffic guidance systems. In our proposed approach, the traffic control system can coordinate with the traffic guidance system for improved flow splits at diverging locations and timings along each route in considering dynamic traffic demands and behaviors.
The major advantage of the coordinated approach is to improve the system’s performance by proactively guiding travelers through information display and traffic signal control. In order to deploy the proactive and coordinated strategy, a time-rolling horizon scheme is proposed as shown in Figure 4. The time-rolling horizon procedure has a pre-determined planning horizon. From the roll period σ , the coordinated optimizer iteratively converges to update the signal timing plan and VMS parameters for the time horizon σ + 1 . The time horizon is divided into a roll period and a tail period. In the numerical example, the time horizon is set as 180 s and the roll period is set as 60 s. The resulting plan is implemented during the roll period. Thus, VMS and signal timing are optimized for the next 180 s at a 60-s frequency, and only the first 60 s from the optimized timing plan is actually implemented.
In order to compare the system performance under various strategies, we design four representative strategies in this study:
  • Reactive-Independent (RI) strategy. The traffic guidance system simply displays the current traffic status information. While the signal control system adjusts signal timing based on the upstream detection of traffic flow. This strategy is similar to the current practice.
  • Reactive-Coordinated (RC) strategy. The traffic guidance system only displays the current traffic status information. The route choice model estimates the dynamic flow split at the diverging location. Such a flow split is an essential input to the signal control system for signal timing optimization. In this sense, the traffic signal control system is coordinated with the traffic guidance system to optimize signal timings.
  • Proactive-Independent (PI) strategy. The traffic guidance system can actively adjust the information provision by VMS in order to obtain a better split of traffic flow at the diverging location. While the traffic signal control system does not have any input from the traffic guidance system but only relies on traffic detection.
  • PC strategy. The traffic guidance system can actively adjust the information provision by VMS. In addition, the traffic control system can coordinate with the traffic guidance system for improved flow splits at diverging locations along each route considering dynamic demand and behavior.
This section considers an optimization-based framework for the strategies, consistent with driver behavior. The notations and definitions are listed in Table 6.
The optimization problem can be formulated as follows:
min z = r R w T T t , r q t , r
The optimization is subject to:
  • Flow conservation constraint
    r R w q t , r = q t w , w W
  • Constraints for the traffic guidance parameters
    R L R 2 , t V M S = R L R 2 , t + δ 2 , t R L R Y L R 2 , t V M S = Y L R 2 , t + δ 2 , t Y L R R L R 1 , t V M S = R L R 1 , t + δ 1 , t R L R Y L R 1 , t V M S = R L R 1 , t + δ 1 , t Y L R δ suggestion { 0 , 1 }
  • Estimation of the split rate
    τ j = α 0 + α 1 l 1 + α 2 l 2 + α 3 R L R 1 , t V M S + α 4 R L R 2 , t V M S + α 5 δ s u g g e s t i o n ,    j N c o m p l i a n c e P d i v e r s i o n j = e τ j 1 + e τ j + η 1 ,   j N c o m p l i a n c e λ 1 , t = f ( P d i v e r s i o n j ) λ 2 , t = λ 0 ( 1 C R t ) + λ 1 , t C R t
  • Constraints for the traffic signal control
    S t = { c 1 , t 1 , , c 1 , t m , c 2 , t 1 , , c 2 , t n , g 1 , t 1 , , g 1 , t m , g 2 , t 1 , , g 2 , t n } c r , i ( C min , C max ) , g r , i ( G min , G max ) r , i
  • Traffic state prediction
    T T t r = G ( S t , λ 2 , t , q t , r ) r
  • Estimation of the satisfaction rate of drivers
    Δ R L R 1 , t = R L R 1 , t A c t u a l R L R 1 , t V M S Δ R L R 2 , t = R L R 2 , t A c t u a l R L R 2 , t V M S τ s a t i s f a c t i o n 1 = β 0 + β 1 Δ R L R 1 , t , j N c o m p l i a n c e j Q 1 τ s a t i s f a c t i o n 2 = β 0 + β 1 Δ R L R 2 , t , j N c o m p l i a n c e j Q 2 P s a t i s f a c t i o n , 1 j = e τ s a t i s f a c t i o n 1 1 + e τ s a t i s f a c t i o n 1 , j N c o m p l i a n c e j Q 1 P s a t i s f a c t i o n , 2 j = e τ s a t i s f a c t i o n 1 1 + e τ s a t i s f a c t i o n 1 , j N c o m p l i a n c e j Q 2 S R t = f ( P s a t i s f a c t i o n , 1 j ) + f ( P s a t i s f a c t i o n , 2 j ) q t , 1 + q t , 2 + η 2
  • Estimation of the compliance rate of drivers
    C R t = F ( S R t )
Equation (6) is used to minimize the total travel time from the network level. Equation (7) is the flow conservation constraint. Equations (8) and (9) are the constraints of the traffic guidance parameters. Equation (10) indicates the constraints of traffic signal control. Equation (11) represents the travel time with respect to path flow and signal control parameters. Considering the differences between VMS-based information and actual traffic status, we focus on the satisfaction and compliance rates of drivers in Equations (12) and (13), respectively.
A nonlinear constraint of the satisfaction rate is introduced to ensure a high compliance rate.
S R t 85 %
In our objective function, we have introduced a penalty function that includes a penalty coefficient. This coefficient serves as a quantification of how much the satisfaction constraint is being violated.
min z = r R w T T t r q t , r + ω max ( 85 % S R t , 0 )
where ω max ( 85 % S R t , 0 ) is the penalty function, and ω is the penalty coefficient.
The compliance rate C R t is used in Equation (9) and computed in Equation (13). Hence, the fixed-point problem can be resolved through the utilization of the bisection algorithm in combination with iterative methods.
In the numerical study, we make use of the proposed driver diversion model (as indicated by Equations (1) and (2)) in simulations, as a proxy of the real world. For the behavior-estimation module in the controller, we assume that there exist certain estimation errors in diversion behavior. Therefore, we add a random error term to the diversion behavior in the optimization procedure (as indicated in Equation (9)).

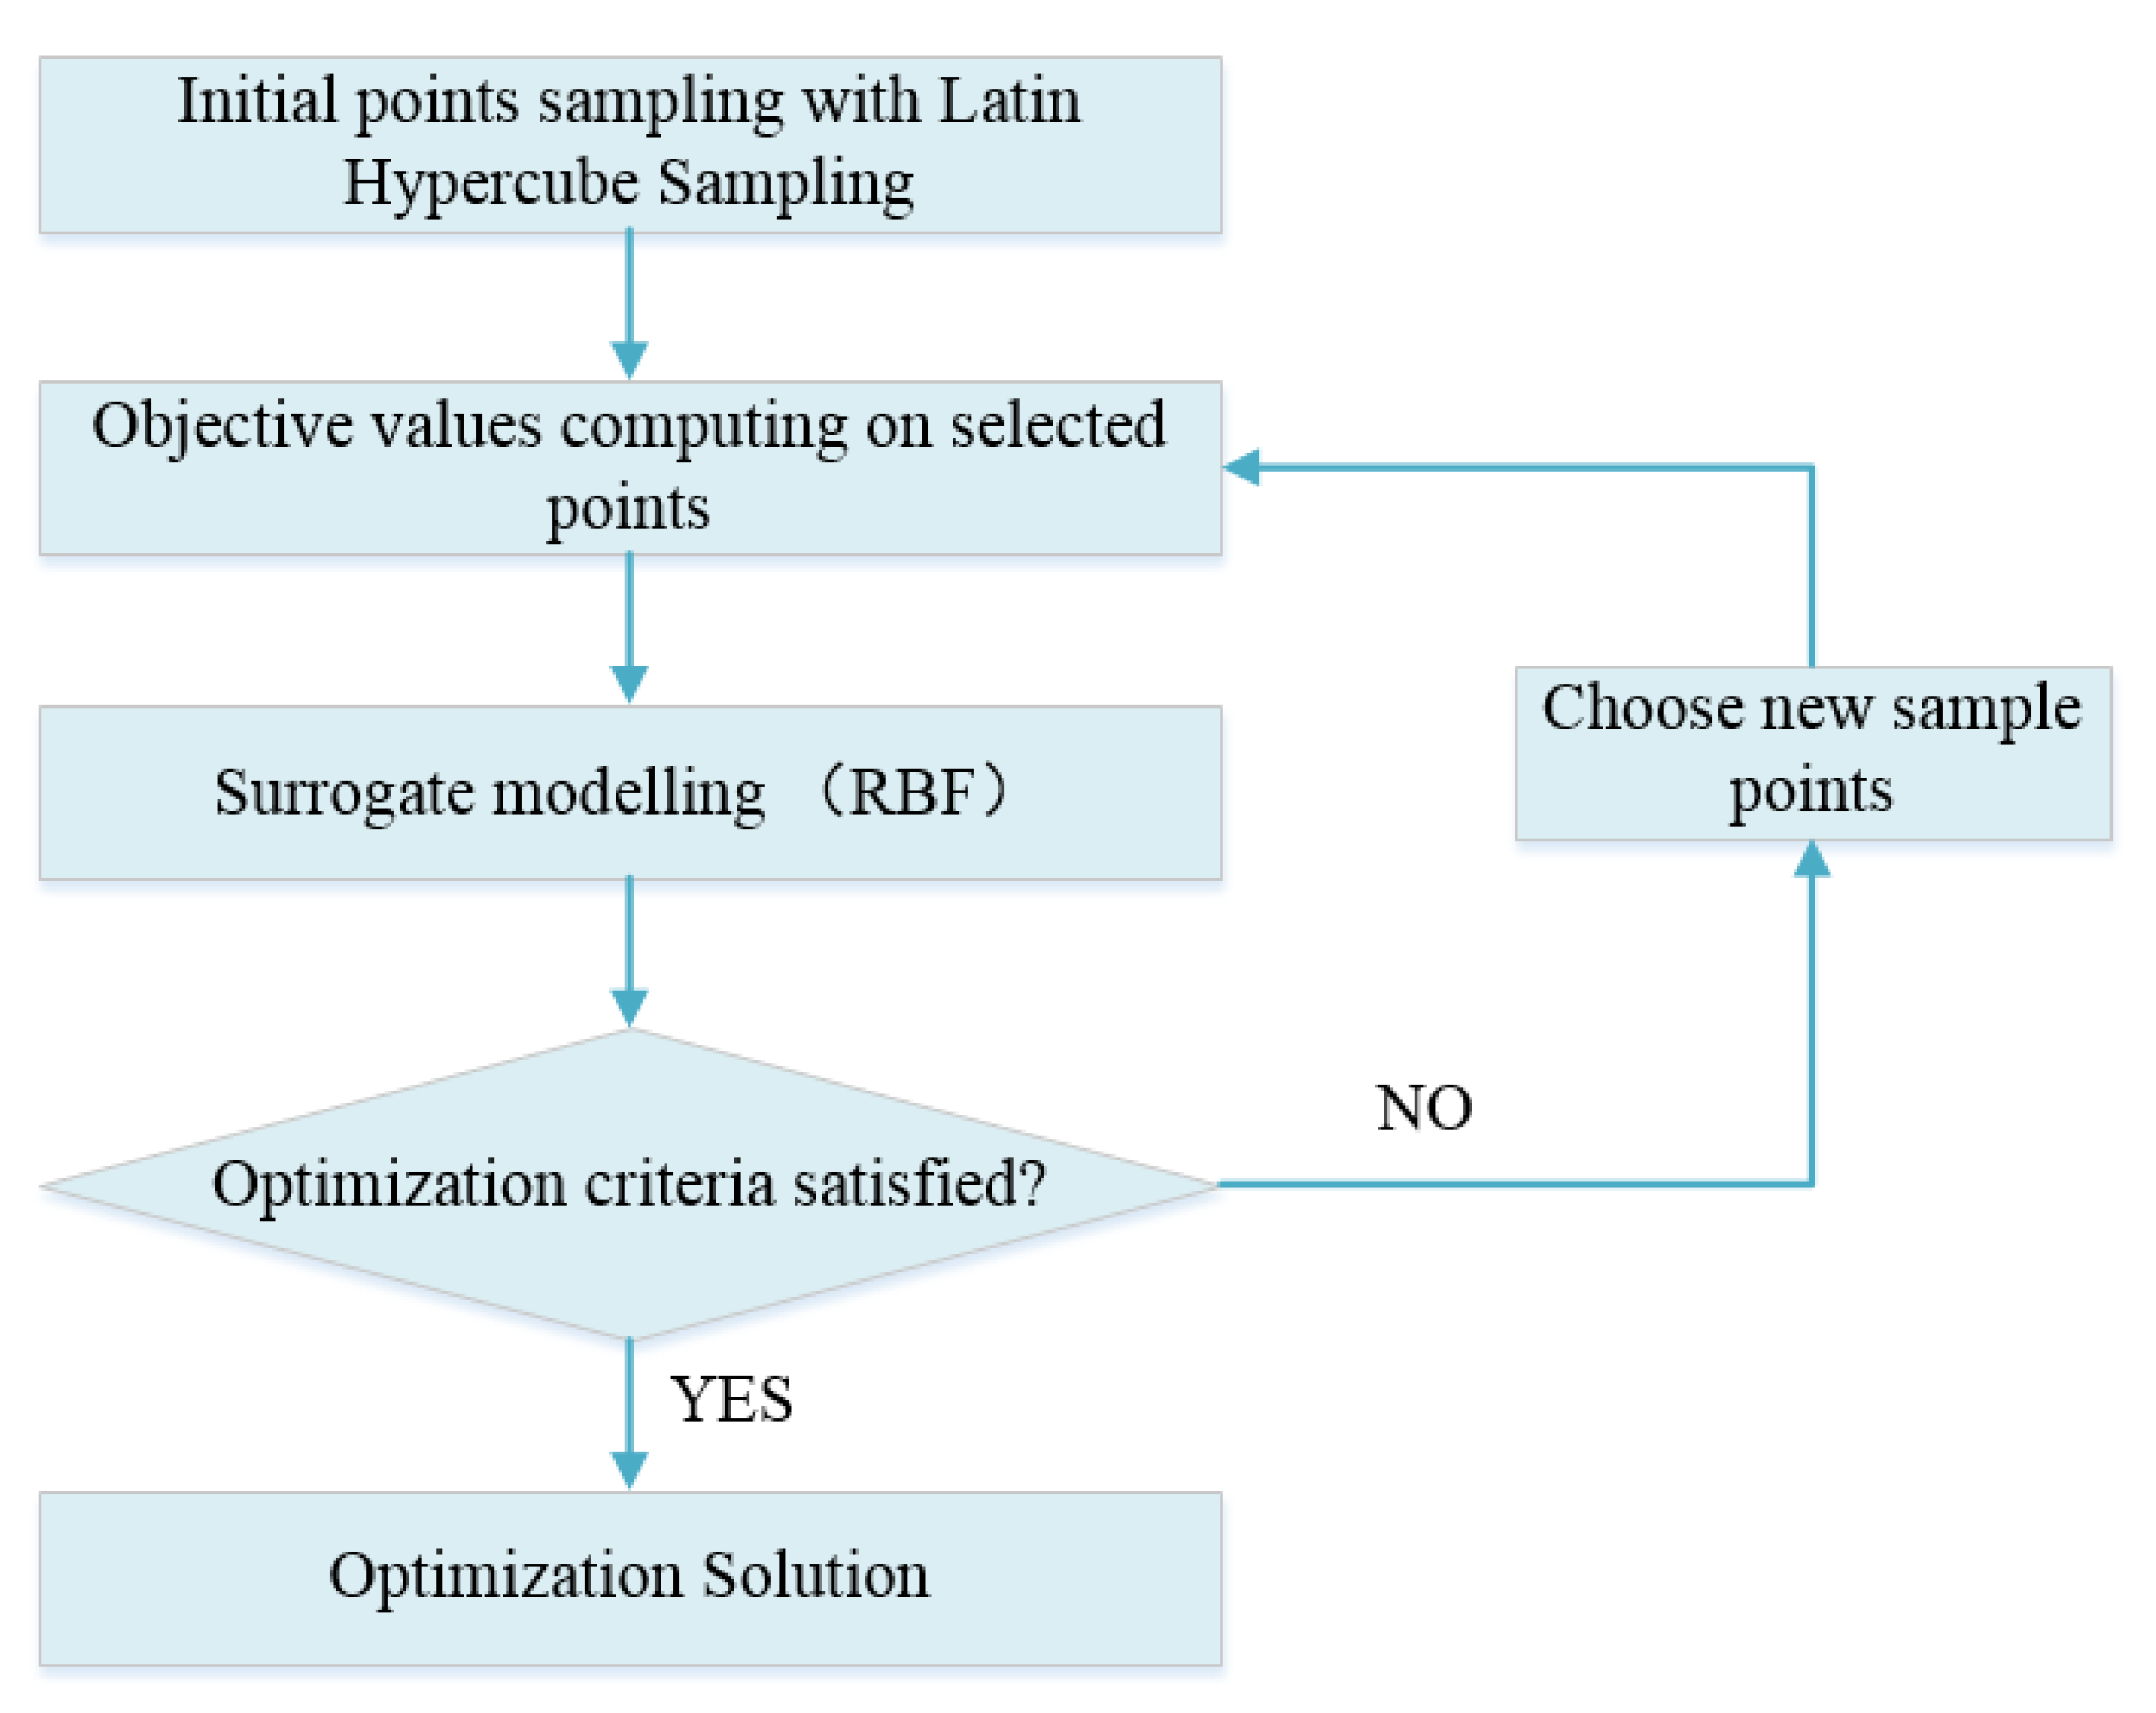
2.3.2. Solution Procedure

The optimization problem of coordinated strategies is complicated and difficult to solve because of the non-convexity of the controller-estimated behavior. The presence of nonlinear constraints and a combination of both continuous and discrete variables classify this problem as a typical mixed-integer nonlinear programming (MINP) problem. We utilize an improved surrogate-based optimization algorithm designed specifically for MINP. The optimization process is illustrated in Figure 5.
The optimization procedure is described as follows:
  • Step 1. Initial point sampling is conducted with Latin hypercube sampling.
  • Step 2. Objective values are calculated on the selected points.
  • Step 3. Surrogate modeling is performed (by the radial basis function in this study).
  • Step 4. If the stopping criteria have been met, Step 5 is performed; otherwise, a random sampling strategy is used in the current surrogate model to determine the subsequent group of points to evaluate, and Step 2 is repeated.
  • Step 5. The minimum objective function value of all points in the group is generated as the final solution.

3. Experimental Results

This experiment explores an innovative approach to traffic management through a bounded divergent network, comprising VMS and signalized intersections, which is employed to evaluate the impact of various strategies on network-level performance. The study considers two scenarios: normal traffic and incidents, and compares various control strategies. The experiment also addresses the robustness of the proposed approach by examining its performance under varying levels of estimation errors.

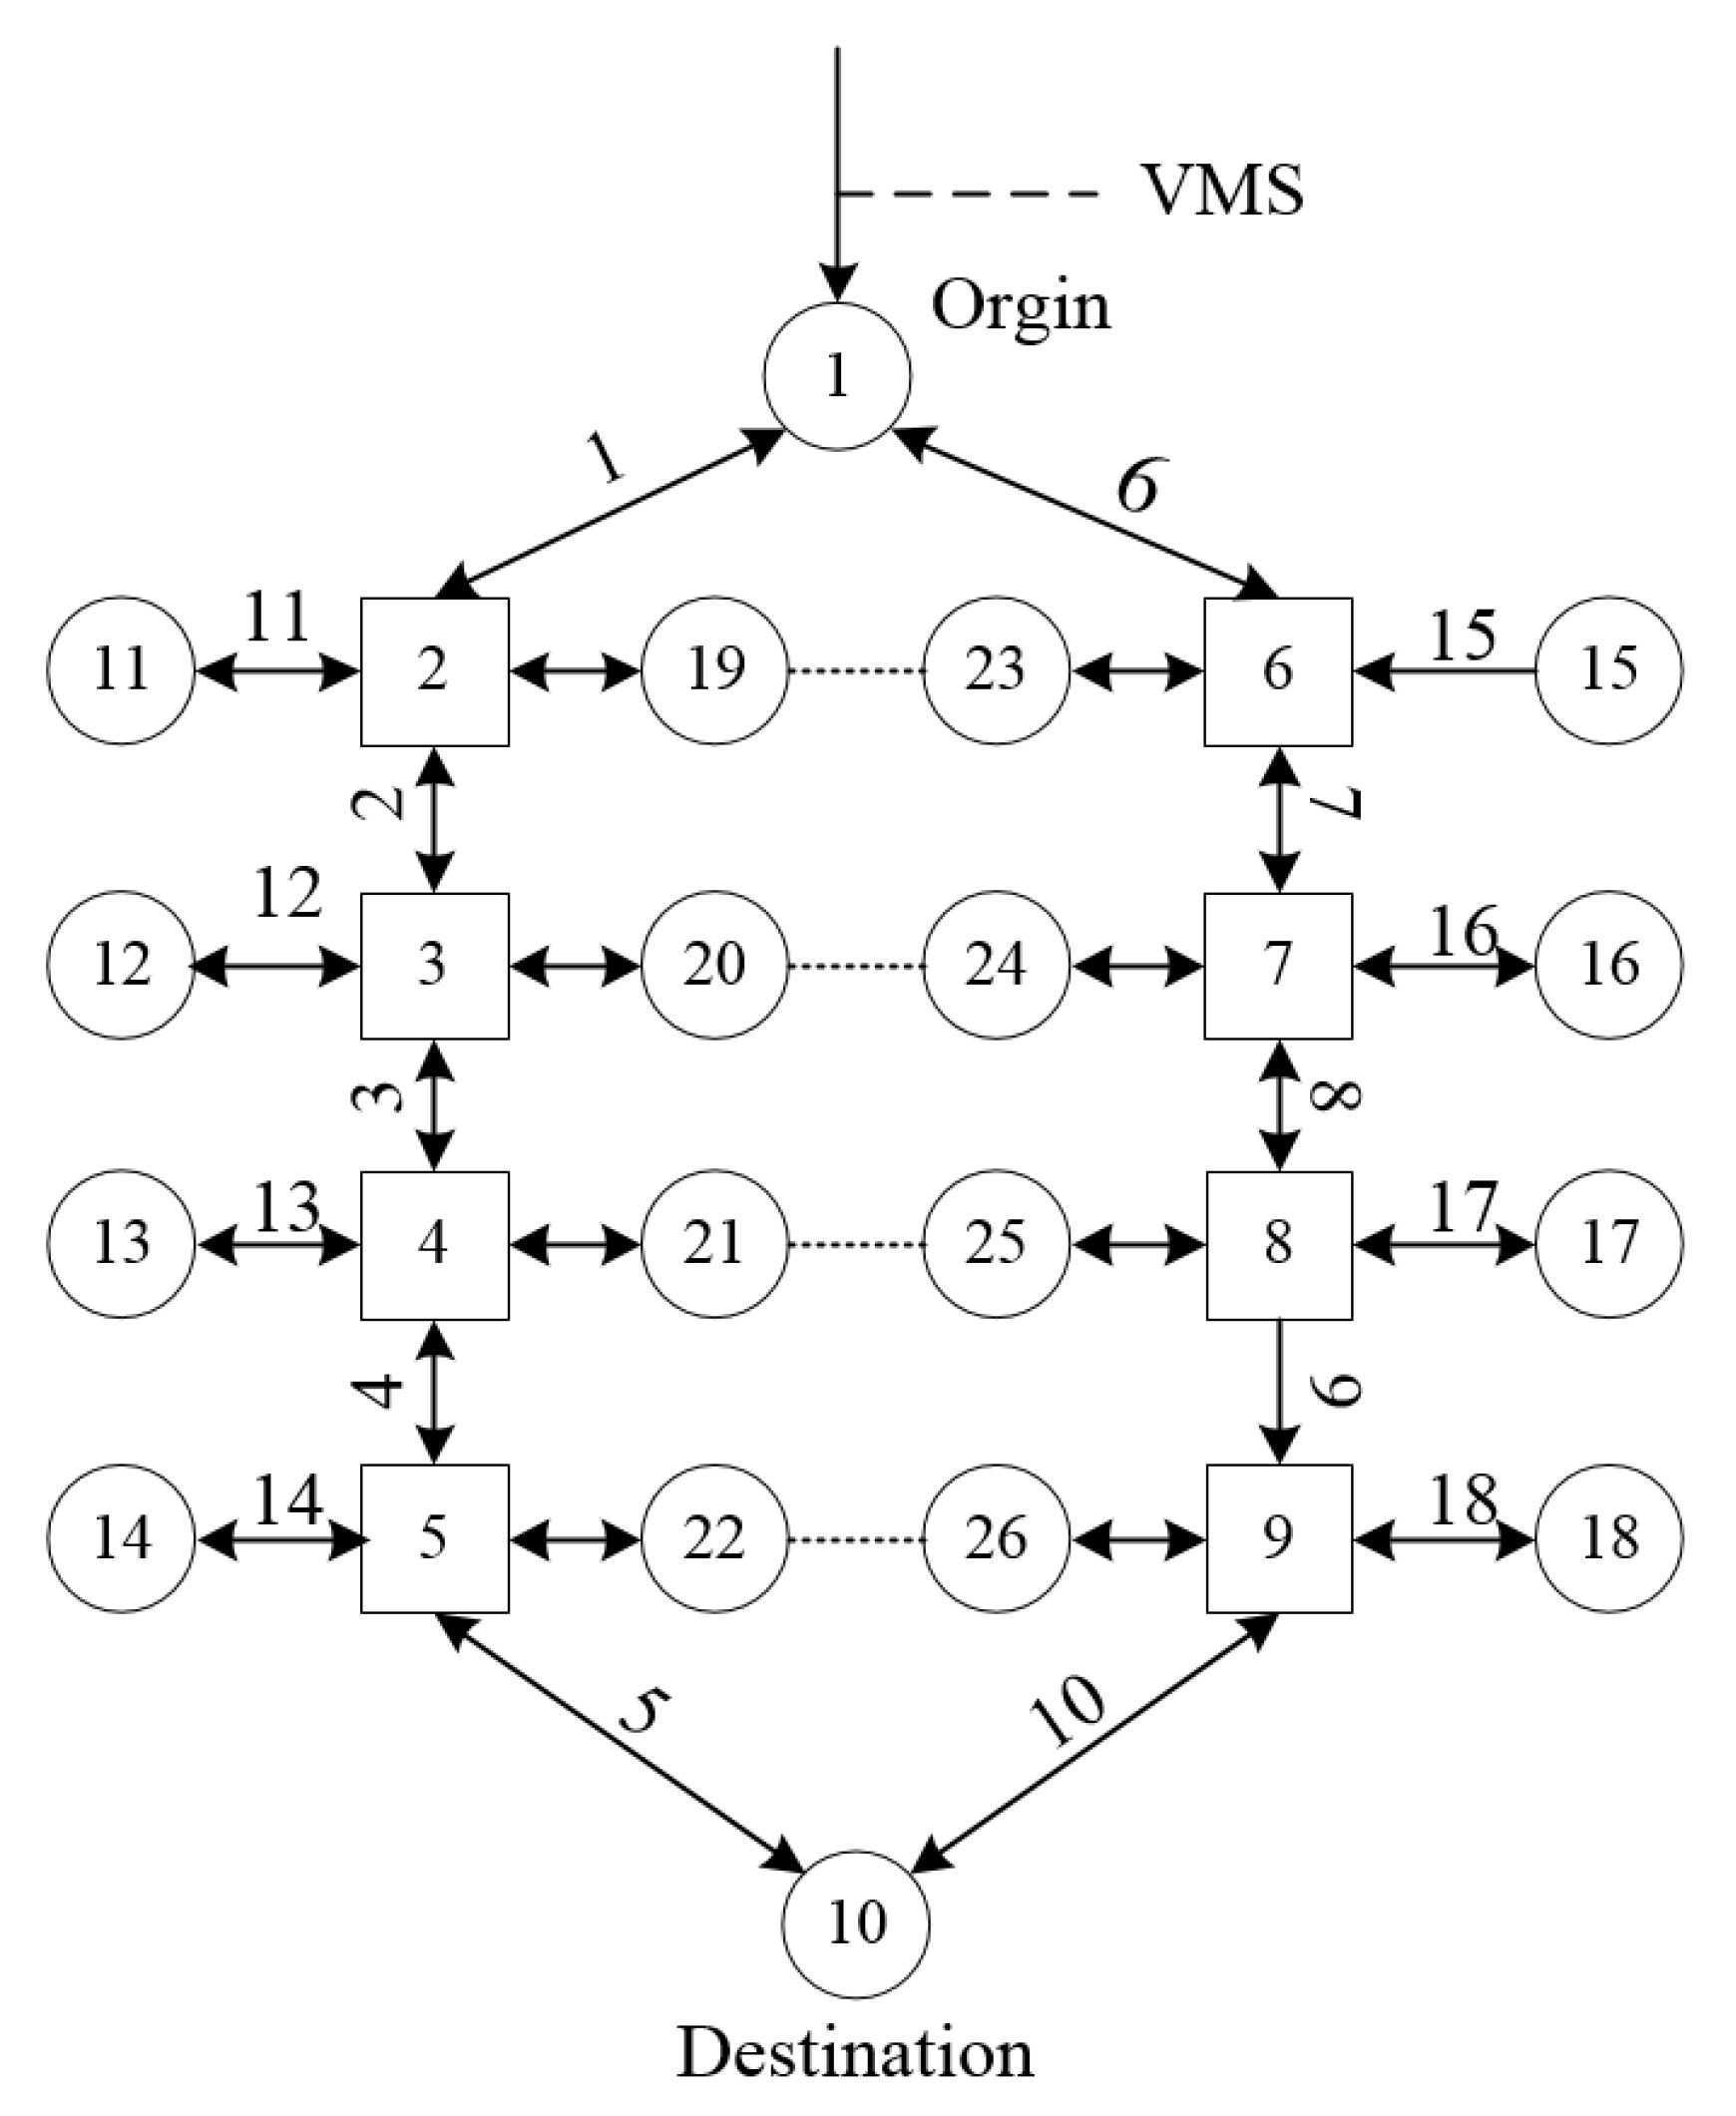
3.1. Network Setup and Parameter Settings

In the numerical example, a bounded divergent network with one VMS and eight signalized intersections (square-shaped nodes: 2–9) is designed to test the effect of strategies on the network-level performance. The network structure is specified in this section, as illustrated in Figure 6. The road network includes 5 OD pairs (1→10, 11→15, 12→16, 13→17 and 14→18), 26 nodes and 18 road sections (links). For example, links 1, 2, 3, 4, and 5 have a capacity of 3000 veh/h and a free-flow travel time of 30 s. The main demand from node 1 to node 10 is 4000 veh/h. Given the network layout and initial supply and demand parameters, a flow split can be determined under the user-equilibrium condition. The flow split (X:Y) is set as the initial condition for the simulation.
For simplification, only the cycle length and green splits are considered as the decision variables for the signal operation. Meanwhile, each signal is under the two-phase control. The VMS panel is located at the upstream of node 1. On VMS, the display information includes graphical traffic conditions (represented by red and yellow ratios in the proposed model) and route choice suggestions. In summary, 16 continuous variables (i.e., cycles and green splits of eight signalized nodes) and five discrete variables (e.g., red and yellow ratios, and diversion suggestion) are considered as the control variables of the coordinated optimizer. It is worth mentioning that the red and yellow ratios cannot be continuous variables because the traffic status displayed on the VMS panel is segmented.
In order to demonstrate the performance of the proposed PC approach, the numerical study consists of two scenarios, i.e., normal traffic and incident. In the normal traffic scenario, the link capacity remains the same value as shown in Table 7. While in the incident scenario, the capacity of link 3 drops by V for 30 min. In this study, the reduced capacity is 1500 veh/h. The demand remains at 4000 veh/h. All the aforementioned four strategies, i.e., PC, PI, RC, and RI (baseline), have been evaluated in a one-hour simulation study.
The optimization parameters are set as follows. The number of initial points is 43, which is required to be two times more than the dimensions of the solution space. The total simulation times are 300. VMS displays non-personalized real-time information on traffic conditions to drivers encountering them. Unlike an in-vehicle navigation system, VMS is constrained to display generic information. Moreover, due to the limited ability of VMS to display messages, each VMS panel is designed to show traffic states of a divergent network with one or two possible diversion routes. In this paper, we propose a coordinated optimization method in such a divergent network. Large-scale networks can be divided into some sub-networks, and each sub-network is controlled by an optimal controller. Each controller works on the basis of real-time detection data and estimation of driver en-route diversion behavior within a sub-network. Additionally, the diversion behavior model should be further calibrated for specific sub-networks. Therefore, under endemic recurrent congestion or incident, each controller works separately to improve network-level performance. While under serious incidents or special events, controllers in the affected area can work together by controlling the input and output flows of sub-networks to improve network-level performances.

3.2. Optimization Results

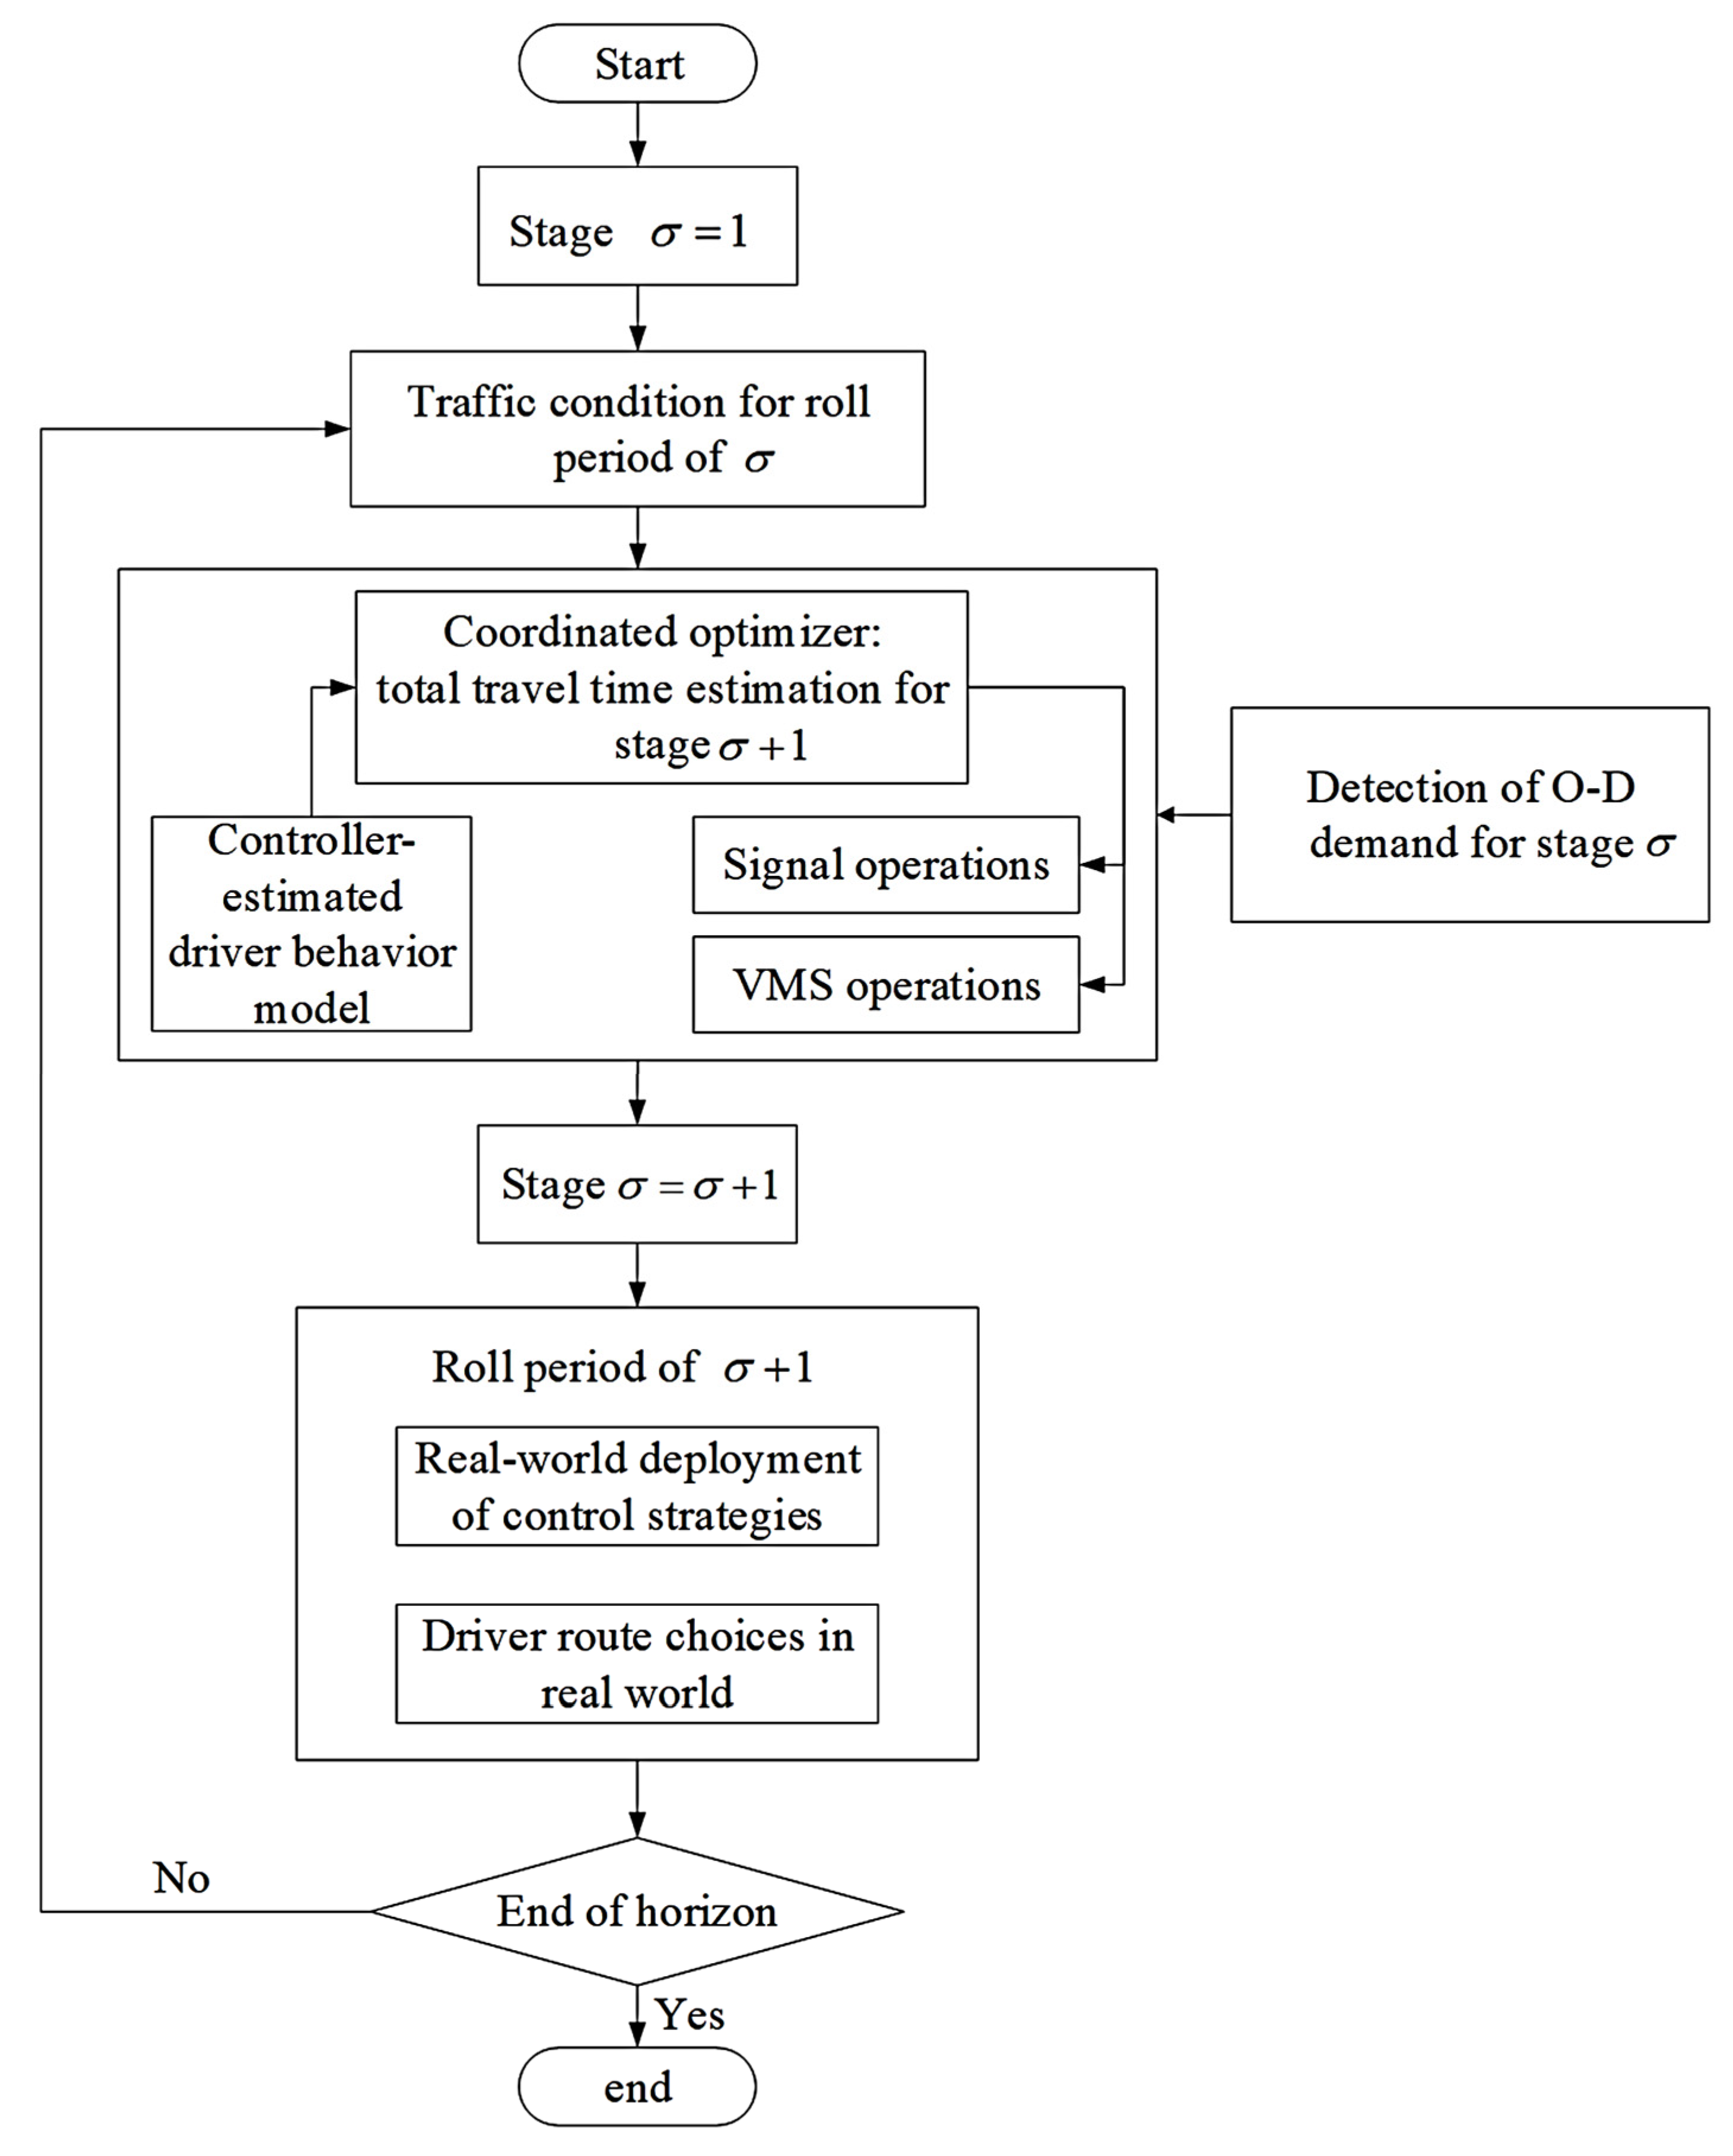
3.2.1. Real-Time Traffic Control under Rolling Horizon Framework

Table 8 presents a quantitative analysis of the network-level performance under the four strategies. Under the normal traffic scenario, the PC control strategy has an approximate 10% reduction in total travel time in comparison with the traditional strategy, i.e., the RI strategy. One of the major reasons for the performance improvement is that the coordinated approach can proactively share the predicted demand information between the guidance system and the signal control system for their joint optimization. In addition, the drivers’ satisfaction degree for PC strategy has improved from the baseline of 76% to 95%. Such an improvement together with the system performance demonstrates that the proposed approach is able to improve the system operation meanwhile keeping the system trustworthy. The lower satisfaction degree boundary could further improve the system performance due to the relaxation of the key constraint. In contrast, the lower satisfaction degree might jeopardize users’ trust and the long-term system performance. A future study might be able to discover the optimal boundary for users’ satisfaction degrees to balance the short-term and long-term system performance. Moreover, the RC strategy performs better than the PI strategy.
In the incident scenario, the PC strategy has a significant advantage over the baseline strategies in the network-level performance. The major reason is that the proposed PC strategy can help the system operation respond to the change in either the dynamic demand or supply. Moreover, it can help the users to make a decision from the system perspective. Therefore, the more significant system “change” leads to the more significant advantage of the proposed PC strategy. The PI strategy works better than the RC strategy. It demonstrates that the proactive guidance for users in the incident scenario is more meaningful than the coordination of the guidance and the signal control system from the system perspective.

3.2.2. Robustness Analysis

The performance of the proposed approach relies on the estimation accuracy of behavioral responses, e.g., the compliance rate, the diversion rate, and the flow split. The robustness analysis is to testify to the performance reliability of the proposed approach under various levels of estimation errors. In the proposed approach, the estimation of the diversion rate is the key to deciding the guidance information and signal timings. In this study, the estimation error of the diversion rate is assumed to follow a normal distribution with zero mean. The estimation error term is defined as η 1 in Equation (9). As shown in Table 9, the system performance is evaluated under the four cases with standard deviations of 10%, 20%, 30% and 40%, respectively. With the increment of the standard deviation of the estimation error, the network-level performance worsens. The total travel time increases by 6.46% when the standard deviation rises from 10% to 30%. For Case 4, the total travel time is much longer than those in Cases 1, 2 and 3. The total travel time increases by 19.14% than Case 1. The proposed approach is reasonably robust with the standard deviation of the estimation error smaller than 30%. When the standard deviation is 40% or above, the proposed approach is no longer robust. Therefore, thorough surveys or field observations are necessary to keep the standard deviation less than 30% and achieve robust system performance.

4. Discussion

This study presents a comprehensive evaluation of a novel traffic management approach, with a focus on network-level performance and driver satisfaction. The research employs a bounded divergent network featuring one VMS and eight signalized intersections, examining the impact of various strategies under normal traffic and incident scenarios. The primary findings encompass the advantages of the PC strategy, notably its ability to significantly reduce total travel time (by approximately 10%) compared to the traditional RI strategy under normal traffic conditions. Additionally, the PC strategy demonstrates a remarkable enhancement in driver satisfaction, elevating it from a baseline of 76% to an impressive 95%. Moreover, the PC strategy outperforms baseline strategies in incident scenarios, showcasing its adaptability to dynamic changes in demand or supply.
The results underscore the potential of proactive coordination in optimizing traffic management systems, leading to improved network-level performance and elevated user satisfaction. The PC strategy’s ability during incidents highlights its effectiveness in handling unexpected disruptions in traffic flow. The implications of this research can extend to the realm of effective traffic management. Proactive coordination between traffic guidance and signal control systems can reduce travel times and enhance user satisfaction. The adaptability of the PC strategy to incident scenarios highlights its potential for bolstering overall network resilience.
This study has several limitations, including the use of a simplified model that may not fully capture the complexities of real-world traffic conditions. Additionally, the assumption of estimation errors following a normal distribution with a mean of zero may not entirely align with practical scenarios. Future research directions include real-world testing and validation of the proposed approach to assess its efficacy in complex and dynamic traffic scenarios.

5. Conclusions

In current traffic management practices, conventional traffic guidance systems passively relay real-time traffic information through VMS, leaving route choices in the hands of individual drivers. To enhance overall system performance, we introduce an innovative approach that proactively guides drivers towards optimal route choices, aligning with system-level objectives such as minimizing vehicle hours traveled. This proactive guidance allows for deviations from estimated travel times, subject to the constraints of drivers’ long-term compliance rates and preferred traffic signal operations. The proposed approach coordinates the traffic guidance system with the signal control system to optimize network-level performance for all users. The traffic signal control system determines the upper bounds for information deviation on VMS, while the traffic guidance system offers demand predictions to inform the traffic signal control system.
In our numerical study, we evaluate four distinct strategies (PC, PI, RC, and RI) within two scenarios: normal traffic conditions and incidents. The results reveal that the PC strategy consistently outperforms other strategies, delivering a substantial reduction in total travel time (approximately 10% reduction in the normal traffic scenario and a remarkable 29% reduction in the incident scenario). This performance improvement is complemented by a high user satisfaction rate (95%), which is pivotal for maintaining long-term trust in the system. Thus, the proposed approach not only enhances system operation but also preserves its trustworthiness. In sum, the significant innovation lies in the introduction of a proactive approach to traffic management, which actively guides drivers towards optimal routes, aligning with system-level objectives. This innovation empowers the system to dynamically adapt to changes in demand or supply while enhancing user satisfaction, thus preserving the system’s trustworthiness.
For future work, the optimal boundary for users’ satisfaction degrees to balance the short-term and long-term system performances might be discovered. Moreover, we can extend the study to a larger network by combining our model of divergent networks together under certain rules. Special events, such as accidents, and large events with evolvement characteristics should also be considered. Furthermore, we can take sustainable factors (e.g., fuel consumption and emission) as part of the optimization objective to address the crucial traffic environmental issues.

Author Contributions

Conceptualization, Y.G., X.C. and M.L.; methodology, Y.G., K.Z. and M.L.; software, Y.G., validation, Y.G., K.Z. and X.C.; formal analysis, Y.G. and K.Z.; writing—original draft preparation, Y.G.; writing—review and editing, X.C., M.L. and K.Z.; project administration, X.C., and M.L.; supervision, X.C. and M.L.; funding acquisition, M.L. All authors have read and agreed to the published version of the manuscript.

Funding

This research is partially supported by grants from National Key Research and Development Program of China (2018YFB1601600).

Data Availability Statement

Not applicable.

Conflicts of Interest

The authors declare no conflict of interest.

References

  1. Hadjidimitriou, N.S.; Lippi, M.; Mamei, M. A data driven approach to match demand and supply for public transport planning. IEEE Trans. Intell. Transp. Syst. 2020, 22, 6384–6394. [Google Scholar] [CrossRef]
  2. Hrelja, R.; Khan, J.; Pettersson, F. How to create efficient public transport systems? A systematic review of critical problems and approaches for addressing the problems. Transp. Pol. 2020, 98, 186–196. [Google Scholar] [CrossRef]
  3. Poulopoulou, M.; Spyropoulou, I. Active traffic management in urban areas: Is it effective for professional drivers? The case of variable message signs. Transp. Res. Part A Pol. Pract. 2019, 130, 412–423. [Google Scholar] [CrossRef]
  4. Schweizer, J.; Poliziani, C.; Rupi, F.; Morgano, D.; Magi, M. Building a large-scale micro-simulation transport scenario using big data. Int. J. Geo-Inf. 2021, 10, 165. [Google Scholar] [CrossRef]
  5. Osorio, C.; Bierlaire, M. A Surrogate Model for Traffic Optimization of Congested Networks: An Analytic Queueing Network Approach; Report Transp-OR 090825; Ecole Polytechnique F’ed’erale de Lausanne: Lausanne, Switzerland, 2009; pp. 1–23. [Google Scholar]
  6. Rodriguez-Roman, D.; Ritchie, S.G. Surrogate-based optimization for multi-objective toll design problems. Transp. Res. Part A Pol. Pract. 2020, 137, 485–503. [Google Scholar] [CrossRef]
  7. Bliek, L. A Survey on Sustainable Surrogate-Based Optimisation. Sustainability 2022, 14, 3867, Towards. Sustain. AI. 2022, 161. [Google Scholar] [CrossRef]
  8. Wang, R.; Li, J.; Bai, R. Prediction and Analysis of Container Terminal Logistics Arrival Time Based on Simulation Interactive Modeling: A Case Study of Ningbo Port. Mathematics 2023, 11, 3271. [Google Scholar] [CrossRef]
  9. Diop, E.B.; Zhao, S.; Song, S.; Van, D. Modelling travellers’ route switching behaviour in response to variable message signs using the technology acceptance model. Transport 2020, 35, 533–547. [Google Scholar] [CrossRef]
  10. Chen, X.; Chen, Y.; Saunier, N.; Sun, L. Scalable low-rank tensor learning for spatiotemporal traffic data imputation. Transp. Res. Part C Emerg. Technol. 2021, 129, 103226. [Google Scholar] [CrossRef]
  11. Cantarella, G.E.; Watling, D.; De Luca, S.; Di Pace, R. Dynamics and Stochasticity in Transportation Systems: Tools for Transportation Network Modelling; Elsevier: Amsterdam, The Netherlands, 2019. [Google Scholar]
  12. Zhao, X.; Wan, C.; Bi, J. Day-to-day assignment models and traffic dynamics under information provision. Netw. Spat. Econ. 2019, 19, 473–502. [Google Scholar] [CrossRef]
  13. Moradi, H.; Sasaninejad, S.; Wittevrongel, S.; Walraevens, J. The contribution of connected vehicles to network traffic control: A hierarchical approach. Transp. Res. Part C Emerg. Technol. 2022, 139, 103644. [Google Scholar] [CrossRef]
  14. Almadi, A.I.M.; Mamlook, R.E.; Almarhabi, Y.; Ullah, I.; Jamal, A.; Bandara, N. A fuzzy-logic approach based on driver decision-making behavior modeling and simulation. Sustainability 2022, 14, 8874. [Google Scholar] [CrossRef]
  15. Ozbay, K.; Bartin, B. Estimation of economic impact of VMS route guidance using microsimulation. Res. Transp. Econ. 2004, 8, 215–241. [Google Scholar] [CrossRef]
  16. Xu, T.; Hao, Y.; Peng, Z.R.; Sun, L.J. Anticipatory En Route Guidance Consistent with Drivers’ Diversion Behavior: Methodology and Case Study. In Proceedings of the Transportation Research Board 93rd Annual Meeting, Washington, DC, USA, 7–14 January 2014; Volume 14. [Google Scholar]
  17. Chen, Y.; Shafi, S.Y.; Chen, Y. Simulation pipeline for traffic evacuation in urban areas and emergency traffic management policy improvements through case studies. Transp. Res. Interdiscip. Perspect. 2020, 7, 100210. [Google Scholar] [CrossRef]
  18. Qadri, S.S.S.M.; Gökçe, M.A.; Öner, E. State-of-art review of traffic signal control methods: Challenges and opportunities. Eur. Transp. Res. Rev. 2020, 12, 55. [Google Scholar] [CrossRef]
  19. Vatchova, B.; Boneva, Y. Design of Fuzzy and Conventional Controllers for Modeling and Simulation of Urban Traffic Light System with Feedback Control. Mathematics 2023, 11, 373. [Google Scholar] [CrossRef]
  20. Su, H.; Zhong, Y.D.; Chow, J.Y.J.; Dey, B.; Jin, L. EMVLight: A multi-agent reinforcement learning framework for an emergency vehicle decentralized routing and traffic signal control system. Transp. Res. Part C Emerg. Technol. 2023, 146, 103955. [Google Scholar] [CrossRef]
  21. Huang, R.; Han, L.D.; Huang, Z. A new network equilibrium flow model: User-equilibrium with quantity adjustment. Transp. Res. Part E Logist. Transp. Rev. 2022, 163, 102719. [Google Scholar] [CrossRef]
  22. Ameli, M.; Lebacque, J.P.; Leclercq, L. Improving traffic network performance with road banning strategy: A simulation approach comparing user equilibrium and system optimum. Simul. Model. Pract. Theory 2020, 99, 101995. [Google Scholar] [CrossRef]
  23. Abdelkader, G.; Elgazzar, K.; Khamis, A. Connected vehicles: Technology review, state of the art, challenges and opportunities. Sensors 2021, 21, 7712. [Google Scholar] [CrossRef]
  24. Zheng, B.; Hong, Z.; Tang, J.; Han, M.; Chen, J.; Huang, X. A Comprehensive Method to Evaluate Ride Comfort of Autonomous Vehicles under Typical Braking Scenarios: Testing, Simulation and Analysis. Mathematics 2023, 11, 474. [Google Scholar] [CrossRef]
  25. Claes, R.; Holvoet, T. Maintaining a distributed symbiotic relationship using delegate multiagent systems. In Proceedings of the 2010 Winter Simulation Conference; IEEE: New York, NY, USA, 2010; pp. 2981–2990. [Google Scholar]
  26. Abdelghany, K.; Hashemi, H.; Khodayar, M.E. A decision support system for proactive-robust traffic network management. IEEE Trans. Intell. Transp. Syst. 2018, 20, 297–312. [Google Scholar] [CrossRef]
  27. Yin, Y.; Yang, H. Simultaneous determination of the equilibrium market penetration and compliance rate of advanced traveler information systems. Transp. Res. Part A Pol. Pract. 2003, 37, 165–181. [Google Scholar] [CrossRef]
  28. Lo, H.K.; Tung, Y.K. Network with degradable links: Capacity analysis and design. Transp. Res. Part B Methodol. 2003, 37, 345–363. [Google Scholar] [CrossRef]
  29. Lindsey, R.; Daniel, T.; Gisches, E.; Rapoport, A. Pre-trip information and route-choice decisions with stochastic travel conditions: Theory. Transp. Res. Part B Methodol. 2014, 67, 187–207. [Google Scholar] [CrossRef]
  30. Liu, W.; Hua, M.; Deng, Z.; Meng, Z.; Huang, Y.; Hu, C.; Song, S.; Gao, L.; Liu, C.; Shuai, B.; et al. A systematic survey of control techniques and applications in connected and automated vehicles. In IEEE Internet of Things Journal; IEEE: New York, NY, USA, 2023. [Google Scholar]
  31. Ali, Y.; Sharma, A.; Haque, M.M.; Zheng, Z.; Saifuzzaman, M. The impact of the connected environment on driving behavior and safety: A driving simulator study. Accid. Anal. Prev. 2020, 144, 105643. [Google Scholar] [CrossRef] [PubMed]
  32. Wu, Z.; Liang, Y. Variable message sign location selection basing on drivers’ perception. Transp. Res. Procedia 2017, 25, 1745–1754. [Google Scholar] [CrossRef]
  33. Mao, C.; Zou, M.; Liu, Y.; Xue, W. Comparison of Agent-based Modeling and Equation-based Modeling for Transportation Behavioral Studies. CICTP 2015, 3610–3625. [Google Scholar] [CrossRef]
Figure 1. Proposed logical architecture.
Mathematics 11 04262 g001
Figure 2. Illustration of the SP survey: (a) driver diversion behavior survey; (b) driver diversion behavior survey.
Mathematics 11 04262 g002aMathematics 11 04262 g002b
Figure 3. Agent recognition of compliance behavior.
Mathematics 11 04262 g003
Figure 4. Solution framework for coordinated strategy optimization.
Mathematics 11 04262 g004
Figure 5. Surrogate-based optimization procedure.
Mathematics 11 04262 g005
Figure 6. The case network.
Mathematics 11 04262 g006
Table 1. Notations used in driver behavior models.
NotationExplanation
l 1 distance of the route A-B
l 2 distance of the route A-C-D-B
R L R 1 red segment ratio of the route A-B
R L R 2 red segment ratio of the route A-C-D-B
δ s u g g e s t i o n 1 denotes that the recommended route is A-C-D-B;
0 denotes that the recommended route is A-B
Δ R L R differences between displayed RLR and realized RLR for certain route:
(+): realized RLR is bigger than displayed RLR;
(−): realized RLR is smaller than displayed RLR
V n utility of individual n choosing the alternative route
U n utility of individual n satisfied with traffic guidance
P n probability that individual n chooses an alternative route
S n satisfaction degree that individual n is satisfied with the VMS guidance
C R guidance compliance rate
SRsatisfaction rate
Table 2. Binary Logit model for the en-route route choice.
VariablesCoefficientEstimatesStandard ErrorSignificance
l 1 α 1 0.9650.0960.001
l 2 α 2 −0.4390.0760.001
R L R 1 α 3 3.5100.6060.000
R L R 2 α 4 −6.2401.3710.000
δ s u g g e s t i o n α 5 0.4310.2110.000
Constant α 0 −3.0321.3140.021
Table 3. Binary Logit model for the satisfaction degree of drivers.
VariablesCoefficientEstimatesStandard ErrorSignificance
Δ R L R β 1 −8.8511.3320.000
Constant β 0 2.9351.0190.004
Table 4. Illustration of agent static information.
Static InformationNotation
Agent ID j
Threshold for the number of continuous dissatisfaction N j
Threshold for the number of continuous incompliance M j
Threshold for the number of continuous transition K j
Table 5. Illustration of agent dynamic information.
Dynamic InformationNotation
The round of information provision i
Box ID (1, 2, or 3) b j i
Number of continuous dissatisfaction n j
Number of continuous incompliance m j
Number of continuous transition k j
Table 6. Notations and definitions.
NotationsDefinitions
Z objective function
T T t , r total travel time on route r R w between origin–destination (OD) pair w W
ω penalty parameter
γ weighting parameter in robust control
n number of scenarios considered in robust control
z i objective value under scenario i
Q 1 group of drivers who choose route 1
Q 2 group of drivers who choose route 2
N c o m p l i a n c e group of drivers who comply with VMS-based information
R w set of routes between OD pair w W
q t , r traffic flow rate on route r R w at time t
S R t satisfaction rate of VMS information at time t
C R t compliance rate of VMS information service at time t
R L R i , t V M S ratio of red segments in the VMS panel on route i at time t
Y L R i , t V M S ratio of yellow segments in the VMS panel on route i at time t
R L R i , t estimated ratio of red segments on route i at time t
Y L R i , t estimated ratio of yellow segments on route i at time t
δ i , t R L R proactive adjustment of red segment ratio on route i at time t
δ i , t Y L R proactive adjustment of yellow segment ratio on route i at time t
η 1 disturbance or random component to describe the uncertainty in diversion behavior
η 2 disturbance or random component to describe the uncertainty in the satisfaction rate
α i parameters of the driver diversion model
l i total length of route i
δ suggestion dummy variable of diversion advice, i.e., 1 indicates diversion advice on VMS panel, and 0 indicates no diversion advice
β i parameters of driver satisfaction model
P d i v e r s i o n j probability of diversion for driver j
P s a t i s f a c t i o n , i j probability of driver j satisfied with VMS service on route i
λ 0 experiential split rate
λ 1 , t split rate of drivers who comply with VMS-based information at time t
λ 2 , t actual split rate at time t
c i , t j cycle time at intersection j on route i at time t
g i , t j green split at intersection j on route i at time t
S t group of signal control parameters at time t
G traffic state estimation function
F function of the compliance rate with respect to satisfaction rate
f decision function based on the probabilities of different choices
Table 7. Link capacity and free-flow travel time.
LinkFree-Flow Time (s)Capacity (veh/h)Length (m)
1, 2, 4, 5303000300
3303000– V 300
6,7, 8, 9, 10302000300
11, 12, 13, 14301000300
15, 16, 17, 18301000300
Table 8. Network-level performances under various strategies.
Traffic Flow RateScenarioResultsPCRCPIRI (Baseline)Improvement
4000 veh/hNormal trafficTotal travel time78.6583.0185.2787.329.9%
Satisfaction rate0.950.830.930.7620%
IncidentTotal travel time85.97116.9695.64121.5428.8%
Satisfaction rate0.890.580.780.7423.8%
Table 9. Network-level performances under various estimation errors.
Case  i Standard Deviation of the Estimation Error Term η 1 Total Travel Time (h): T i Difference (%): T i b e s t b e s t
110%87.32-
220%90.14+3.23%
330%92.96+6.46%
440%104.03+19.14%
Disclaimer/Publisher’s Note: The statements, opinions and data contained in all publications are solely those of the individual author(s) and contributor(s) and not of MDPI and/or the editor(s). MDPI and/or the editor(s) disclaim responsibility for any injury to people or property resulting from any ideas, methods, instructions or products referred to in the content.

