Abstract
This study uses daily COVID-19 news series to determine their impact on financial market volatility. This paper assesses whether U.S. financial markets react differently to COVID-19 news than emerging markets and if such markets are impacted differently by country-specific and global news. To detect the spillover effects from news on market volatility, a time-varying DCC-GARCH model was applied. The results suggest that the U.S. and emerging markets are affected differently by pandemic news, global series have a stronger impact on emerging markets than country-specific ones, and misleading information plays a significant role in financial market volatility, especially for the U.S.
Keywords:
COVID-19 news; volatility; granger causality; time-varying; time series; financial markets MSC:
37M10; 62P05; 91B28
1. Introduction
The pandemic, declared by the World Health Organization (WHO) on 11 March, 25 2020 [1], caused by the coronavirus (COVID-19), represents an unprecedented shock to the world economy. Starting in Wuhan, China, in December 2019, the shock rapidly spread throughout the world due to its simultaneous impacts on the world’s demand and supply sectors. However, its economic impacts have been particularly hard for Latin American countries [2]. This pandemic has been followed by a climate of panic, misinformation, and uncertainty that has shocked global financial markets. For some, this uncertainty has forced economic agents to leave the stock market altogether, which created additional volatility and uncertainty due to COVID-19 [3,4,5].
In the U.S., the Standard and Poor’s 500 index (S&P), which measures the performance of 500 major companies in the U.S. stock market, lost almost 30% of its value at the beginning of the pandemic (1 January–18 March 2020). Between 6 March and 18 March 2020, the index fell by almost 15% [6]. Government interventions, such as the implementation of the Coronavirus Aid, Relief, and Economic Security (CARES) Act in the U.S., helped stabilize financial markets and the economy [7,8]. In Latin America, countries usually tend to lack the financial resources that might help lessen the impacts of the pandemic on financial markets and their economies, which can lead to further reductions in capital investments and economic growth [9,10]. Moreover, it has been found that government response time and the size of the stimulus package are important to offset the impact of COVID-19 on emerging stock markets [11]. In general terms, financial markets have reacted to the heightened level of uncertainty and volatility brought about by the pandemic. This increase in uncertainty and volatility has led researchers to understand the direct implications for financial markets, specifically in terms of volatility for different commodities and markets, which can be used as a diversification and hedging strategy [12].
Several studies have examined the link between the COVID-19 pandemic and financial markets. Several studies relate financial market volatility to economic, financial, and other types of variables during the pandemic [13,14,15]. Financial volatility can also be clustered throughout time—volatility today tends to be followed by high volatility tomorrow [16]—and these changes in market volatility might be related to COVID-19 news. Specifically, there are studies that link financial markets’ volatility to infectious disease news, such as the Infectious Disease Equity Market Volatility Tracker (EMV-ID) series from [17], which considers COVID-19 news and the impact on different economic and financial variables [18,19,20,21]. There are also other real-time news indexes, such as the Coronavirus Media Monitor [22], that have been linked to different financial and economic variables [23,24,25]. These news series have been analyzed to assess the asymmetry between the stock market returns and COVID-19 news [26,27]. Others have measured the lead–lag correlation between the news and volatility of central commercial banks traded in the Chinese stock market [24], while others [28] have evaluated how the stock markets have integrated public information about COVID-19 and used it to forecast the volatility of China’s crude oil [29].
In terms of specific COVID-19 news series that might impact investor psychology (sentiment), studies analyze the impact of sentiment variables on stock market volatility [30,31], and others have shown that investor sentiment in one of the leading causes of stock return asymmetry [32]. Furthermore, the authors of [33] propose a new approach to estimating investor sentiment and its implications for global financial markets. The authors of [34] emphasize that the COVID-19 pandemic has resulted in unprecedented news coverage and an outpouring of opinion in this age of rapid information, and this has created uncertainty in financial markets that leads to greater volatility in prices. There is also the possibility that investors, overwhelmed by the volume of sometimes conflicting news, prefer to do nothing and make no changes to their portfolios. This behavior is known as the ostrich effect [35,36].
Regarding the specific nature of the news–financial market relation, there seems to be evidence of time-varying predictability of several predictors from the literature on stock markets’ returns [37]. It is suggested that predictability might exist only over some phases of time and not necessarily over the entire sample period. This paper considers a similar dynamic relationship between COVID-19 news indexes and stock market volatilities in the U.S. and emerging markets. Given the unprecedented nature of the COVID-19 pandemic, it is not clear if this dynamic relationship holds in the case of Latin American markets. This paper considers global, U.S.-based, and country-specific COVID-19 news indexes, in order to analyze such a relationship in detail. In that regard, the impact of COVID-19 pandemic news on emerging market economies might differ for the news source. The differential impact of these news indexes on distinct stock markets may be due to each country’s financial and cultural differences, which condition investors’ decision-making processes. In that sense, a group of heterogeneous investors analyzes and interprets local and global pandemic information, and that can have an impact on fundamental valuations and market conditions for each country [38,39].
Considering the predominant role of the U.S. in the global economy, particularly in the case of Mexico and other Latin American countries, and the relative close fitting of country-specific news indexes, we might observe a different impact from global news indexes than from country-specific ones. However, the unprecedented nature of the COVID-19 pandemic shock makes it particularly hard to predict. Furthermore, emerging markets, given their financial constraints and cultural idiosyncrasies, might react significantly differently than developed countries in regard to similar COVID-19 pandemic news.
In summary, the main goals of this study are to analyze country-specific COVID-19 news indexes through time and determine how they might affect the volatility of financial markets in the U.S. and several emerging markets and to analyze how global news indexes might impact the volatility of financial markets of emerging economies.
This study also contributes to the literature on how COVID-19 news might cause panic and uncertainty in financial markets [34]. In this regard, the news’ impacts might not be realized immediately in financial markets, so the effects might be asynchronous—the news one day might be reflected on a later day—and this, in turn, might affect the market volatility. Accordingly, a cross-correlation approach will be used to capture the Granger causality using a time-varying model such as DCC-GARCH [40]. This model can capture the spillover effects from instantaneous information on financial markets, as the news keeps flowing.
The result shows that global news indexes impacted the stock market’s volatility more than local news indexes. One to three local news indexes caused stock volatility in Latin American markets. In contrast, the global news indexes demonstrated greater causality in Latin America.
2. Data and Methods
The daily COVID-19 news series range from 22 January to 12 November 2020, for a total of 204 observations per series (data obtained from Bloomberg.com, accessed on 20 November 2022). Six stock market indexes were considered in this study: S&P from the U.S., MEXBOL from Mexico, COLCAP from Colombia, BOVESPA from Brazil, IPSA from Chile, MERVAL from Argentina, and IGBVL from Peru. The local series contain news specific to each country and include the Panic Index (PI), the level of news conversations related to panic about COVID-19; the Media Hype Index (MHI), the percentage of news about COVID-19 relative to the total news; the Fake News Index (FNI), the percentage of false news about COVID-19; the Sentiment Index (SI), the difference between positive and negative COVID-19 news; the Coronavirus Infodemic Index (CII), the percentage of COVID-19 information to which the user is exposed from unreliable sources; the Media Coverage Index (MCI), the proportion of all news sources covering the coronavirus (data obtained from https://www.ravenpack.com, accessed on 20 November 2022). All of these series use a scale between 0 and 100, except for the SI, which goes from −100 to 100. A value of 0 is considered neutral. These series contain information gathered from news outlets such as the Dow Jones Newswire, Wall Street Journal, and Stocktwits, among others [26,41]. This analysis also considers the EMV-ID index, which contains information about several infectious diseases news from almost 3000 newspapers in the U.S., from January of 1985 until today (data obtained from https://www.policyuncertainty.com/infectiousEMV.html, accessed on 20 November 2022). From the perspective of emerging markets, this index is considered a global index. In terms of other global news indexes, this paper considers the Global Fear Index (GFI), the fear and panic about the transmission and severity of COVID-19 [42]. This index is composed of two separate indexes, the COVID-19 Case Reporting Index (CRI) and the Death Reporting Index (DRI) (GFI provided by [42]). All three indexes are on a scale of 0 to 100, where a value of 50 represents moderate fear. Another set of global news indexes includes the COVID-19-Induced Uncertainty Stock Tracker composite index (ciustk.cmp, accessed on 20 November 2022), which combines an index of global news related to COVID-19 (ciustk.news, accessed on 20 November 2020) and the index of uncertainty due to global economic indicators (ciustk.mac, accessed on 20 November 2022), which contains information for the price of oil, gold, and raw materials, exchange rates, and stock prices [43] (indexes provided by [43]). Like the GFI, the scale of the indexes is from 0 to 100; the larger the value, the greater the perceived vulnerability of the stock market due to the effects of COVID-19. The last set of global news indexes includes the Aggregate Index of COVID-19 (A_COVID _I), Medical Index (MI), Travel Index (TI), Uncertainty Index (UI), Vaccine Index (VI), and COVID Index (COVID_I) [44] (data obtained from: https://ael.scholasticahq.com/article/23491-new-measures-of-the-covid-19-pandemic-a-new-time-series-dataset, accessed on 20 November 2022). These indexes consider the number of reported COVID-19 deaths and cases but also the results from the 45 most popular worldwide newspapers’ keyword searches to capture important events in the pandemic, such as vaccine development, medical advances, travel restrictions, and overall uncertainty.
To start with, the country-specific news series were standardized, given that growth rates or logarithmic transformations cannot be used due to having several zero values in the EMV-ID and SI series (the series’ names for each country: add “_M” for Mexico; “_B” for Brazil; “_C” for Colombia; “_P” for Peru; “_CHI” for Chile; “_A” for Argentina; “_US” for the U.S.). Once standardized, the series show asymmetry and excess kurtosis. Accordingly, the Jarque–Bera test [45] was applied. The hypothesis of normality was rejected for all series, except for the SI for Mexico, Colombia, Chile, Brazil, and Argentina (the descriptive statistics and Jarque-Bera test results are available upon request). According to the Residual Augmented Least Squares-Lagrange Multiplier test results (RALS-LM) [46], the series were stationary and each one of them presents two breaks. Therefore, transformations of the series were not applied (results are available upon request.). Then, the ARCH-LM tests [47] were applied, and the results were not statistically significant for the PI and FNI of Mexico, Colombia, Brazil, and Peru. For the rest of the series, the hypothesis of not having ARCH effects was rejected (ARCH-LM test results are available upon request.). These results suggest that volatility in the series is implied, which might be due to having a kurtosis greater than zero. Accordingly, the Pruned Exact Linear Time test (PELT) [48] was applied to determine the changes in the variance of each series.
Table 1 presents the dates for changes in the variance for the series. The FNI series for Latin American countries tend to have more breaks in the variance than the other indexes. On the other hand, the SI series has breaks close to FNI’s dates with lags of a day or two. The rest of the series have dates for the changes in variance that are close to each other. The EMV-ID, for its part, has only one break in its variance.

Table 1.
Breaks in the variance for all countries and country-specific indexes.
The results obtained are significant because investors and governments can use the information to apply or adapt investment decisions such as portfolio diversification or market politics such as lockdowns during the pandemic. These structural breaks in the volatility are due to skewness, leptokurtosis, and non-normality according to their descriptive statistics. For this reason, the DCC-GARCH model is suitable for this analysis.
The next step was to apply the Dechert and Scheinkman test (BDS) [49]. The results for the PI and FNI series for Mexico, Colombia, Brazil, and Peru were not statistically significant. For the rest of the series, the null hypothesis that the residuals are independent and identically distributed (iid) was rejected (BDS test results are available upon request.). This exact same process was applied to global news indexes, and the results indicate the appropriateness of applying causality tests on all the global news series. Table 2 presents breaks in the variance for the ten global indexes. This indicates that applying a DCC-GARCH Hong test is appropriate in order to determine the instantaneous causality of the COVID-19 news series’ volatility on the specific country’s stock market volatility (series that were not statistically significant in different tests were not considered for TV-DCC-GARH modeling).
Table 2.
Breaks in the variance for global indexes.
The DCC-GARCH Hong test is widely used to analyze time-varying causality between pairs of economic and financial time series [20,50,51,52], and it offers several advantages when applied to test for instantaneous Granger causality [40,53]: (1) it allows identifying any immediate impact of news information on the stock market at any point in time, which occurs asynchronously due to how the information flows [52,54]; (2) it uses dynamic cross-correlation to assess causality according to the width of the time window [40]; (3) it allows determining the causal relationship in a unidirectional and bidirectional manner; (4) it allows determining the causality both in the mean and in the variance in a dynamic way; (5) it allows determining the volatility cluster where the causality occurs [55].
To apply the test, we start by analyzing the standardized residuals for each stationary series , for and is the sample size from a univariate GARCH(1,1) model, in order to remove any autocorrelation effects. To analyze the dynamic correlation, we introduce a DCC-GARCH model , where lag order. Following the procedure from [40,51,52], the DCC-GARCH model is defined by:
The dynamic correlation in the DCC-GARCH(1,1) is defined by:
where
The univariant Granger causality time varying is defined as :
Given that the majority of the news and stock market series have ARCH effects, a GARCH (1,1) model is applied to each of these series to obtain the residuals, removing any autocorrelation effects. Then, a DCC-GARCH model is applied in order to determine the instantaneous, one-way Granger causality between the COVID-19 news series and the stock market series for the U.S. and emerging markets.
3. Results and Discussion
Table 3 and Figure 1, Figure 2, Figure 3, Figure 4, Figure 5, Figure 6 and Figure 7 present the results of the instantaneous, one-way Granger-causality tests for different news series for each country. For the sake of space, only statistically significant results are presented. The line graph represents the causality estimates through time, and the vertical blue lines at the bottom of the figures represent the statistically significant causality at the 5% level. The “→” symbol represents the direction of causality.
Table 3.
One-way Granger-causality tests.
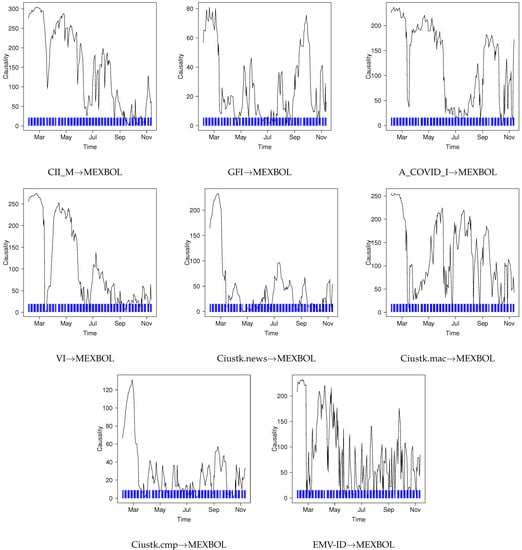
Figure 1.
Instantaneous, one-way Granger-causality from news series to MEXBOL (DCC-GARCH model).
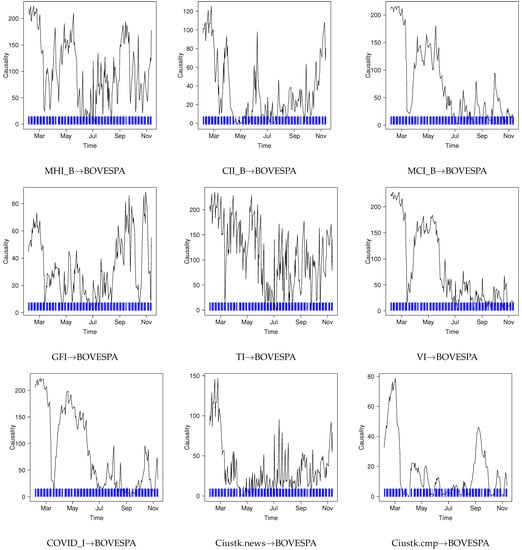
Figure 2.
Instantaneous, one-way Granger-causality from news series to BOVESPA (DCC-GARCH model).
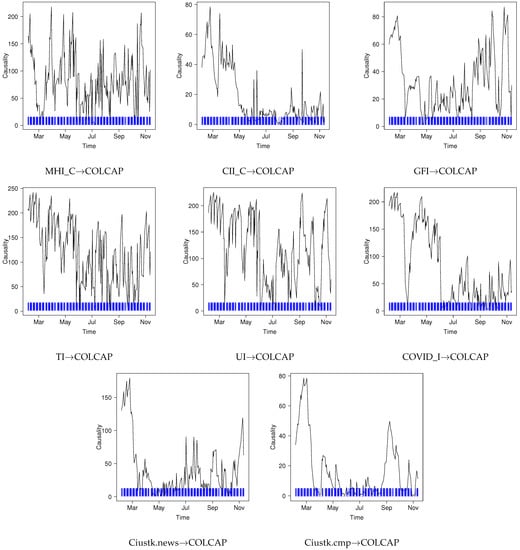
Figure 3.
Instantaneous, one-way Granger-causality from news series to COLCAP (DCC-GARCH model).
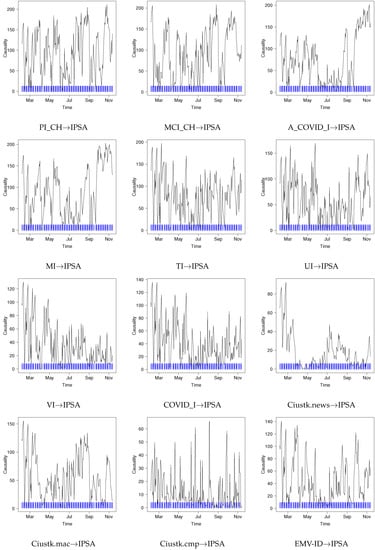
Figure 4.
Instantaneous, one-way Granger-causality from news series to IPSA (DCC-GARCH model).
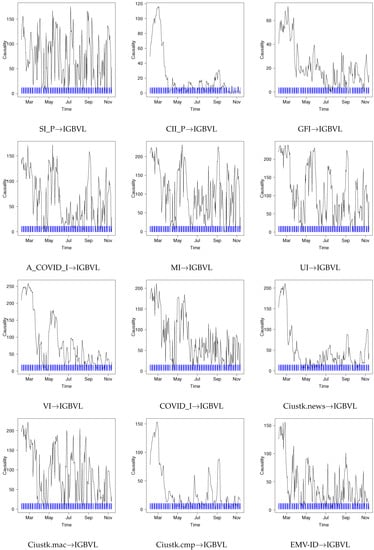
Figure 5.
Instantaneous, one-way Granger-causality from news series to IGBVL (DCC-GARCH model).
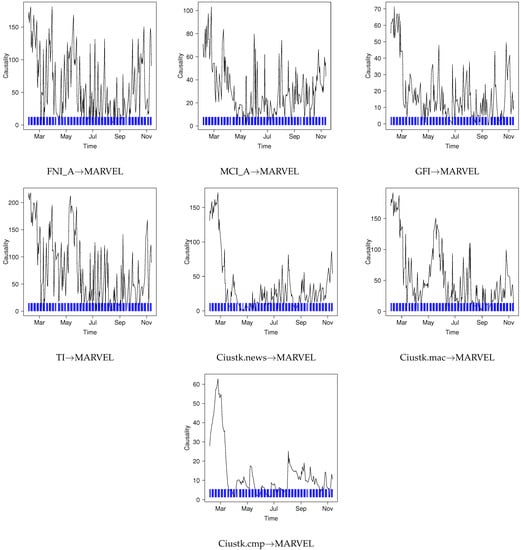
Figure 6.
Instantaneous, one-way Granger-causality from news series to MARVEL (DCC-GARCH model).
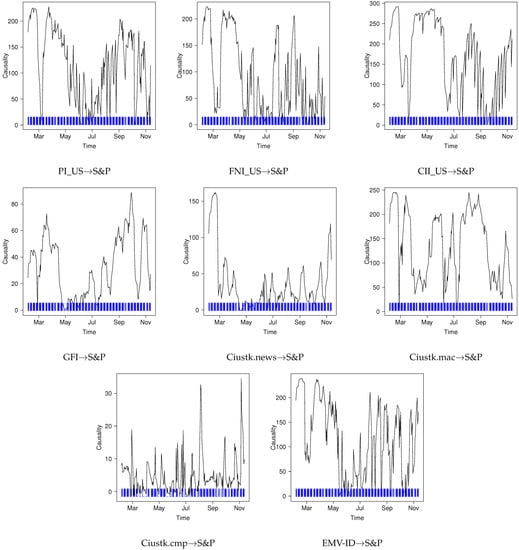
Figure 7.
Instantaneous, one-way Granger-causality from news series to S&P (DCC-GARCH model).
For statistically significant results, MEXBOL and COLCAP each have eight news series; BOVESPA has nine series; IPSA and IGBVL each have twelve series; MERVAL has seven series; S&P has eight news series. Overall, global news tends to have more impact on Latin American stock markets than country-specific news. Brazil and Mexico, the largest Latin American stock markets by far, represent evidence of this.
Among country-specific news series, the CII series is statistically significant for five of the seven countries considered here. As mentioned before, the Coronavirus Infodemic Index represents the percentage of Coronavirus news considered false rumors and unreliable information. This particular news index shows how susceptible countries, including the U.S., can be to the circulation and spreading of false and misleading information. Interestingly, only the most southern economies (Chile and Argentina) are not affected by this news index. This could mean that these countries have different or better ways to “filter out” misleading information or simply that investors in these countries receive significantly different information than most Latin American countries and the U.S. In addition to the CII, the MCI also affects three of the six Latin American markets considered.
Considering only the largest stock markets—the U.S., Brazil, and Mexico—one thing to note is that the Panic Index and the Fake News Index are statistically significant only for the U.S. This could mean that the U.S. market might be exposed to significantly more misleading information and this generates more panic and uncertainty than in other countries, but it could also mean that investors in the U.S. are simply more susceptible to this type of news. On the other hand, this feeling of fear on the part of investors may cause the direction of the stock price to change, leading to stocks being oversold or overbought, which could create bubbles in the market, and volatility. Investors’ decisions depend on governments’ actions regarding COVID-19 so they can make effective decisions to reduce their risk. Considering the CII, this suggests the latter is more likely for the U.S. Investors in the U.S. might be too quick to react to new COVID-19 information, but this could also mean they have little time to discern whether the information is accurate [56].
For Brazil, only the CII, MHI, and MCI are statistically significant, but the last two indexes capture only the proportion of COVID-19 news relative to all the news. For Mexico, the CII is the only local series that is statistically significant. Overall, these countries represent evidence that global news series tend to have a more significant impact than local news series.
In terms of global news indexes, the ciustk.cmp and ciustk.news series are statistically significant for all countries, including the U.S. Considering how these indexes are constructed, it is not a surprise to observe statistically significant results. These results are consistent with the findings in [57,58], who found there is a relation between some macro-level news and price volatility. Given the inherently uncertain nature of the COVID-19 pandemic, it is reasonable to see an overall reduction in the flow of capital, which could lead to increased volatility and stock markets’ decmidrule [59,60]. With the exception of Chile, the GFI is also statistically significant for all countries, which could be due to economic agents’ concerns about how the volatility is impacting financial markets [61].
The EMV-ID series is statistically significant for the U.S., Mexico, Chile, and Peru. These results are consistent with the findings in [62,63], which analyzed the correlation of the EMV-ID in several Latin American markets.
The Travel Index, Vaccine Index, and the COVID news series are statistically significant for the majority of Latin American markets but not for the U.S. This represents further evidence that Latin American markets respond differently to global news series than the U.S. The Travel Index is statistically significant for Brazil, Colombia, Chile, and Argentina, countries that imposed travel restrictions. Interestingly, Mexico did not impose travel restrictions during the pandemic, and its results are statistically insignificant. On the other hand, the U.S. imposed severe travel restrictions, but the result for the TI is statistically insignificant. The Vaccine Index, which captures information on vaccine development, is also statistically significant for most Latin American countries, including Mexico and Brazil, but not for the U.S. Once again, this might be due to the significant impact of false rumors and unreliable information on financial markets during the pandemic.
4. Conclusions
This study analyzed different types of COVID-19 news series over time to determine how they might affect the volatility of stock markets in the U.S. and several Latin American countries. Given the unprecedented nature of the COVID-19 pandemic, this paper investigates whether or not U.S. financial markets reacted differently to pandemic news than emerging financial markets. This paper also investigates whether or not country-specific news series tend to have a more significant impact than global news series on financial markets. Furthermore, the current analysis allows us to ascertain the relative impact of unreliable information.
Stock market indexes were considered, along with local and global daily COVID-19 news series. Using both types of series, a DCC-GARCH model was applied to each pair of series to determine the instantaneous, one-way Granger causality between the news series and the stock market series in the U.S. and emerging markets.
The beliefs of economic agents about the news triggers their irrational decision-making since they do not have all the information available. The results may also be related to the fact that economic agents are not homogeneous since they depend on the financial culture of the country. Therefore, their emotions and feelings can affect the market, which varies over time with the degree of market maturity.
Overall, COVID-19 news impacted U.S. financial markets differently than emerging markets. Additionally, global indexes tend to have a more statistically significant impact on Latin American stock markets than local news. The results for Brazil and Mexico, the largest Latin American stock markets by far, support this.
In terms of country-specific news series, the CII is statistically significant for five of the seven countries analyzed, including the U.S., Brazil, and Mexico. This particular news index shows how susceptible countries, including the U.S., can be to the circulation and spreading of false and misleading information. In addition, the Panic Index and the Fake News Index are statistically significant only for the U.S. This could mean that the U.S. financial market might be exposed to significantly more misleading information and, therefore, it generates more panic and market volatility than in other countries, but it could also mean that investors in the U.S. are simply more susceptible to this type of news. Considering that the CII series is also statistically significant for the U.S., this suggests the latter is more likely.
In terms of policy implications, the main results suggest that investors in Latin American markets tend to pay more attention to global and U.S.-based news series than to local ones. Whether this is good for the stability of financial markets in emerging markets remains to be determined, and it could be part of an extension of this work. To the extent that global and U.S.-based news series might be more complete and up-to-date, this could represent a desired feature of Latin American financial markets. In terms of false rumors and unreliable information, the results suggest that investors across the world should do a better job at filtering out this type of information and try not to be so quick to react. This hastened reaction might produce even more volatility and uncertainty in financial markets worldwide. The results suggest this might be particularly true for the U.S.
Some of the limitations of this work are the fact that comparisons should be included with these same variables with other countries from other regions, both developed and undeveloped, to determine their causality. At the same time, these same markets could be analyzed with other variables related to COVID-19, such as those provided in the coronanet database, which includes more than 1,300 data points related to the pandemic in 195 countries. Finally, the results could be compared with time-varying models that do not require the series to be stationary or through entropy. This study only focused on the univariate Granger causality of different series of local and global news towards that of the volatility of Latin American stock markets.
Author Contributions
Conceptualization, methodology, software, validation, writing—original draft preparation, writing—review, and editing, J.N.M., S.C., V.G., R.R.-M. and O.R. All the authors commented on the final version before the submission. All authors have read and agreed to the published version of the manuscript.
Funding
This research received no external funding.
Institutional Review Board Statement
Not applicable.
Data Availability Statement
Not applicable.
Conflicts of Interest
The authors declare no conflict of interest.
References
- World Health Organization. Rolling Updates on Coronavirus Disease (COVID-19). Available online: https://www.who.int/emergencies/diseases/novel-coronavirus-2019/events-as-they-happen (accessed on 20 November 2022).
- Economic Commission for Latin America and the Caribbean. Informe Sobre El Impacto Económico En América Latina y El Caribe de La Enfermedad Por Coronavirus (COVID-19); UNECLAC: Santiago, Chile, 2020; ISBN 9789210054140. [Google Scholar]
- Hasan, M.B.; Mahi, M.; Hassan, M.K.; Bhuiyan, A.B. Impact of COVID-19 Pandemic on Stock Markets: Conventional vs. Islamic Indices Using Wavelet-Based Multi-Timescales Analysis. N. Am. J. Econ. Financ. 2021, 58, 101504. [Google Scholar] [CrossRef]
- Yarovaya, L.; Elsayed, A.H.; Hammoudeh, S. Determinants of Spillovers between Islamic and Conventional Financial Markets: Exploring the Safe Haven Assets during the COVID-19 Pandemic. Financ. Res. Lett. 2021, 43, 101979. [Google Scholar] [CrossRef]
- Albulescu, C.T. COVID-19 and the United States Financial Markets’ Volatility. Financ. Res. Lett. 2021, 38, 101699. [Google Scholar] [CrossRef] [PubMed]
- Shehzad, K.; Xiaoxing, L.; Bilgili, F.; Koçak, E. COVID-19 and Spillover Effect of Global Economic Crisis on the United States’ Financial Stability. Front. Psychol. 2021, 12, 632175. [Google Scholar] [CrossRef] [PubMed]
- Nicola, M.; Alsafi, Z.; Sohrabi, C.; Kerwan, A.; Al-Jabir, A.; Iosifidis, C.; Agha, M.; Agha, R. The Socio-Economic Implications of the Coronavirus Pandemic (COVID-19): A Review. Int. J. Surg. 2020, 78, 185–193. [Google Scholar] [CrossRef]
- Wei, S.-J. Ten Keys to Beating Back COVID-19 and the Associated Economic Pandemic. In Mitigating the COVID Economic Crisis: Act Fast and Do Whatever It Takes; Baldwin, R., Weder di Mauro, B., Eds.; CEPR Press: London, UK, 2020; pp. 71–76. ISBN 978-1-912179-29-9. [Google Scholar]
- Sharma, S.S. A Note on the Asian Market Volatility During the COVID-19 Pandemic. Asian Econ. Lett. 2020, 1, 17661. [Google Scholar] [CrossRef]
- Hong, H.; Bian, Z.; Lee, C.C. COVID-19 and Instability of Stock Market Performance: Evidence from the U.S. Financ. Innov. 2021, 7, 12. [Google Scholar] [CrossRef]
- Topcu, M.; Gulal, O.S. The Impact of COVID-19 on Emerging Stock Markets. Financ. Res. Lett. 2020, 36, 101691. [Google Scholar] [CrossRef]
- Umar, Z.; Gubareva, M.; Teplova, T. The Impact of COVID-19 on Commodity Markets Volatility: Analyzing Time Frequency Relations between Commodity Prices and Coronavirus Panic Levels. Resour. Policy 2021, 73, 102164. [Google Scholar] [CrossRef]
- Corbet, S.; Hou, Y.; Hu, Y.; Lucey, B.; Oxley, L. Aye Corona! The Contagion Effects of Being Named Corona during the COVID-19 Pandemic. Financ. Res. Lett. 2021, 38, 101591. [Google Scholar] [CrossRef]
- Shaikh, I. On the Relation between the Crude Oil Market and Pandemic COVID-19. Eur. J. Manag. Bus. Econ. 2021, 30, 331–356. [Google Scholar] [CrossRef]
- Phan, D.H.B.; Narayan, P.K. Country Responses and the Reaction of the Stock Market to COVID-19 a Preliminary Exposition. Emerg. Mark. Financ. Trade 2021, 56, 2138–2150. [Google Scholar] [CrossRef]
- Javed, F.; Mantalos, P. Sensitivity of the Causality in Variance Test to the GARCH (1,1) Parameters. Chil. J. Stat. 2015, 6, 49–65. [Google Scholar] [CrossRef]
- Baker, S.R.; Bloom, N.; Kost, K.; Sammon, M.; Viratyosin, T. The Unprecedented Stock Market Impact of COVID-19; National Bureau of Economic Research: Cambridge, MA, USA, 2020. [Google Scholar]
- Bai, L.; Wei, Y.; Wei, G.; Li, X.; Zhang, S. Infectious Disease Pandemic and Permanent Volatility of International Stock Markets: A Long-Term Perspective. Financ. Res. Lett. 2020, 40, 101709. [Google Scholar] [CrossRef] [PubMed]
- Bouri, E.; Gkillas, K.; Gupta, R.; Pierdzioch, C. Forecasting Power of Infectious Diseases-Related Uncertainty for Gold Realized Variance. Financ. Res. Lett. 2021, 42, 101936. [Google Scholar] [CrossRef]
- Gupta, R.; Subramaniam, S.; Bouri, E.; Ji, Q. Infectious Disease-Related Uncertainty and the Safe-Haven Characteristic of US Treasury Securities. Int. Rev. Econ. Financ. 2021, 71, 289–298. [Google Scholar] [CrossRef]
- Li, Y.; Liang, C.; Ma, F.; Wang, J. The Role of the IDEMV in Predicting European Stock Market Volatility during the COVID-19 Pandemic. Financ. Res. Lett. 2020, 36, 101749. [Google Scholar] [CrossRef]
- RavenPack Coronavirus. Available online: https://coronavirus.ravenpack.com (accessed on 20 November 2022).
- Baig, A.S.; Butt, H.A.; Haroon, O.; Rizvi, S.A.R. Deaths, Panic, Lockdowns and US Equity Markets: The Case of COVID-19 Pandemic. Financ. Res. Lett. 2021, 38, 101701. [Google Scholar] [CrossRef]
- Ho, K.-Y.; Shi, Y.; Zhang, Z. News and Return Volatility of Chinese Bank Stocks. Int. Rev. Econ. Financ. 2020, 69, 1095–1105. [Google Scholar] [CrossRef]
- Akhtaruzzaman, M.; Boubaker, S.; Umar, Z. COVID-19 Media Coverage and ESG Leader Indices. Financ. Res. Lett. 2021, 45, 102170. [Google Scholar] [CrossRef]
- Cepoi, C.O. Asymmetric Dependence between Stock Market Returns and News during COVID-19 Financial Turmoil. Financ. Res. Lett. 2020, 36, 101658. [Google Scholar] [CrossRef]
- Tan, Ö. The Effect of Pandemic News on Stock Market Returns During the Covid-19 Crash: Evidence from International Markets. Connect. Istanb. Univ. J. Commun. Sci 2021, 60, 217–240. [Google Scholar] [CrossRef]
- Capelle-Blancard, G.; Desroziers, A. The Stock Market Is Not the Economy? Insights from the COVID-19 Crisis. SSRN Electron. J. 2020, 1–40. [Google Scholar] [CrossRef]
- Niu, Z.; Liu, Y.; Gao, W.; Zhang, H. The Role of Coronavirus News in the Volatility Forecasting of Crude Oil Futures Markets: Evidence from China. Resour. Policy 2021, 73, 102173. [Google Scholar] [CrossRef]
- Naseem, S.; Mohsin, M.; Hui, W.; Liyan, G.; Penglai, K. The Investor Psychology and Stock Market Behavior During the Initial Era of COVID-19: A Study of China, Japan, and the United States. Front. Psychol. 2021, 12, 626934. [Google Scholar] [CrossRef]
- Xiang, Y.-T.; Yang, Y.; Li, W.; Zhang, L.; Zhang, Q.; Cheung, T.; Ng, C.H. Timely Mental Health Care for the 2019 Novel Coronavirus Outbreak Is Urgently Needed. Lancet Psychiatry 2020, 7, 228–229. [Google Scholar] [CrossRef] [PubMed]
- Jawadi, F.; Namouri, H.; Ftiti, Z. An Analysis of the Effect of Investor Sentiment in a Heterogeneous Switching Transition Model for G7 Stock Markets. J. Econ. Dyn. Control 2018, 91, 469–484. [Google Scholar] [CrossRef]
- Huynh, T.L.D.; Foglia, M.; Nasir, M.A.; Angelini, E. Feverish Sentiment and Global Equity Markets during the COVID-19 Pandemic. J. Econ. Behav. Organ. 2021, 188, 1088–1108. [Google Scholar] [CrossRef] [PubMed]
- Haroon, O.; Rizvi, S.A.R. COVID-19: Media Coverage and Financial Markets Behavior—A Sectoral Inquiry. J. Behav. Exp. Financ. 2020, 27, 100343. [Google Scholar] [CrossRef] [PubMed]
- Dong, H.; Gil-Bazo, J.; Ratiu, R.V. Information Demand during the COVID-19 Pandemic. J. Account. Public Policy 2021, 40, 106917. [Google Scholar] [CrossRef]
- Galai, D.; Sade, O. The “Ostrich Effect” and the Relationship between the Liquidity and the Yields of Financial Assets. J. Bus. 2006, 79, 2741–2759. [Google Scholar] [CrossRef]
- Devpura, N.; Narayan, P.K.; Sharma, S.S. Is Stock Return Predictability Time-Varying? J. Int. Financ. Mark. Institutions Money 2018, 52, 152–172. [Google Scholar] [CrossRef]
- Fernandez-Perez, A.; Gilbert, A.; Indriawan, I.; Nguyen, N.H. COVID-19 Pandemic and Stock Market Response: A Culture Effect. J. Behav. Exp. Financ. 2021, 29, 100454. [Google Scholar] [CrossRef] [PubMed]
- Namouri, H.; Jawadi, F.; Ftiti, Z.; Hachicha, N. Threshold Effect in the Relationship between Investor Sentiment and Stock Market Returns: A PSTR Specification. Appl. Econ. 2018, 50, 559–573. [Google Scholar] [CrossRef]
- Lu, F.; Hong, Y.; Wang, S.; Lai, K.; Liu, J. Time-Varying Granger Causality Tests for Applications in Global Crude Oil Markets. Energy Econ. 2014, 42, 289–298. [Google Scholar] [CrossRef]
- Blitz, D.; Huisman, R.; Swinkels, L.; van Vliet, P. Media Attention and the Volatility Effect. Financ. Res. Lett. 2020, 36, 101317. [Google Scholar] [CrossRef]
- Salisu, A.A.; Akanni, L.O. Constructing a Global Fear Index for the COVID-19 Pandemic. Emerg. Mark. Financ. Trade 2020, 56, 2310–2331. [Google Scholar] [CrossRef]
- Salisu, A.A.; Ogbonna, A.E.; Oloko, T.F.; Adediran, I.A. A New Index for Measuring Uncertainty Due to the COVID-19 Pandemic. Sustainability 2021, 13, 3212. [Google Scholar] [CrossRef]
- Narayan, P.K.; Iyke, B.N.; Sharma, S.S. New Measures of the COVID-19 Pandemic: A New Time-Series Dataset. Asian Econ. Lett. 2021, 2, 1–14. [Google Scholar] [CrossRef]
- Bera, A.K.; Jarque, C.M. Efficient Tests for Normality, Homoscedasticity and Serial Independence of Regression Residuals. Econ. Lett. 1981, 7, 313–318. [Google Scholar] [CrossRef]
- Meng, M.; Lee, J.; Payne, J.E. RALS-LM Unit Root Test with Trend Breaks and Non-Normal Errors: Application to the Prebisch-Singer Hypothesis. Stud. Nonlinear Dyn. Econom. 2017, 21, 31–45. [Google Scholar] [CrossRef]
- Engle, R. Autoregressive Conditional Heteroscedasticity with Estimates of the Variance of United Kingdom Inflation. Econometrica 1982, 50, 987–1007. [Google Scholar] [CrossRef]
- Killick, R.; Fearnhead, P.; Eckley, I.A. Optimal Detection of Changepoints with a Linear Computational Cost. J. Am. Stat. Assoc. 2012, 107, 1590–1598. [Google Scholar] [CrossRef]
- Broock, W.A.; Scheinkman, J.A.; Dechert, W.D.; LeBaron, B. A Test for Independence Based on the Correlation Dimension. Econom. Rev. 1996, 15, 197–235. [Google Scholar] [CrossRef]
- Cevik, E.I.; Atukeren, E.; Korkmaz, T. Oil Prices and Global Stock Markets: A Time-Varying Causality-in-Mean and Causality-in-Variance Analysis. Energies 2018, 11, 2848. [Google Scholar] [CrossRef]
- Gupta, R.; Kanda, P.; Wohar, M.E. Predicting Stock Market Movements in the United States: The Role of Presidential Approval Ratings. Int. Rev. Financ. 2021, 21, 324–335. [Google Scholar] [CrossRef]
- Coronado, S.; Gupta, R.; Hkiri, B.; Rojas, O. Time-Varying Spillovers between Currency and Stock Markets in the USA: Historical Evidence from More than Two Centuries. Adv. Decis. Sci. 2020, 24, 1–32. [Google Scholar]
- Engle, R. Dynamic Conditional Correlation. J. Bus. Econ. Stat. 2002, 20, 339–350. [Google Scholar] [CrossRef]
- Kanda, P.; Burke, M.; Gupta, R. Time-Varying Causality between Equity and Currency Returns in the United Kingdom: Evidence from over Two Centuries of Data. Phys. A Stat. Mech. Appl. 2018, 506, 1060–1080. [Google Scholar] [CrossRef]
- Jammazi, R.; Ferrer, R.; Jareño, F.; Shahzad, S.J.H. Time-Varying Causality between Crude Oil and Stock Markets: What Can We Learn from a Multiscale Perspective? Int. Rev. Econ. Financ. 2017, 49, 453–483. [Google Scholar] [CrossRef]
- Gallotti, R.; Valle, F.; Castaldo, N.; Sacco, P.; De Domenico, M. Assessing the Risks of ‘Infodemics’ in Response to COVID-19 Epidemics. Nat. Hum. Behav. 2020, 4, 1285–1293. [Google Scholar] [CrossRef] [PubMed]
- Evans, K.P. Intraday Jumps and US Macroeconomic News Announcements. J. Bank Financ. 2011, 35, 2511–2527. [Google Scholar] [CrossRef]
- Jawadi, F.; Louhichi, W.; ben Ameur, H.; Ftiti, Z. Do Jumps and Co-Jumps Improve Volatility Forecasting of Oil and Currency Markets? Energy J. 2019, 40, 131–150. [Google Scholar] [CrossRef]
- Youssef, M.; Mokni, K.; Ajmi, A.N. Dynamic Connectedness between Stock Markets in the Presence of the COVID-19 Pandemic: Does Economic Policy Uncertainty Matter? Financ. Innov. 2021, 7, 13. [Google Scholar] [CrossRef] [PubMed]
- Azimli, A. The Impact of COVID-19 on the Degree of Dependence and Structure of Risk-Return Relationship: A Quantile Regression Approach. Financ. Res. Lett. 2020, 36, 101648. [Google Scholar] [CrossRef] [PubMed]
- Engelhardt, N.; Krause, M.; Neukirchen, D.; Posch, P.N. Trust and Stock Market Volatility during the COVID-19 Crisis. Financ. Res. Lett. 2021, 38, 101873. [Google Scholar] [CrossRef]
- Coronado, S.; Martinez, J.N.; Romero-Meza, R. Time-Varying Multivariate Causality among Infectious Disease Pandemic and Emerging Financial Markets: The Case of the Latin American Stock and Exchange Markets. Appl. Econ. 2021, 54, 3924–3932. [Google Scholar] [CrossRef]
- Romero-Meza, R.; Coronado, S.; Ibañez-Veizaga, F. COVID-19 y Causalidad En La Volatilidad Del Mercado Accionario Chileno. Estud. Gerenciales 2021, 37, 242–250. [Google Scholar] [CrossRef]
Disclaimer/Publisher’s Note: The statements, opinions and data contained in all publications are solely those of the individual author(s) and contributor(s) and not of MDPI and/or the editor(s). MDPI and/or the editor(s) disclaim responsibility for any injury to people or property resulting from any ideas, methods, instructions or products referred to in the content. |
© 2023 by the authors. Licensee MDPI, Basel, Switzerland. This article is an open access article distributed under the terms and conditions of the Creative Commons Attribution (CC BY) license (https://creativecommons.org/licenses/by/4.0/).