Article

The Bitcoin Halving Cycle Volatility Dynamics and Safe Haven-Hedge Properties: A MSGARCH Approach

1
Institute for Advanced Studies, Universiti Malaya, Kuala Lumpur 50603, Malaysia
2
Department of Management, Faculty of Business and Economics, Universiti Malaya, Kuala Lumpur 50603, Malaysia
3
Department of Mathematics, Faculty of Science and Mathematics, Universiti Pendidikan Sultan Idris, Tanjong Malim 35900, Malaysia
4
Faculty of Information and Communication Technology, Universiti Tunku Abdul Rahman, Kampar 31900, Malaysia
5
Department of Computer Science and Information Engineering, National Taipei University of Technology, Taipei 106344, Taiwan
*
Authors to whom correspondence should be addressed.
Mathematics 2023, 11(3), 698; https://doi.org/10.3390/math11030698
Submission received: 4 January 2023 / Revised: 20 January 2023 / Accepted: 23 January 2023 / Published: 30 January 2023

Abstract

:
This paper introduces a unique perspective towards Bitcoin safe haven and hedge properties through the Bitcoin halving cycle. The Bitcoin halving cycle suggests that Bitcoin price movement follows specific sequences, and Bitcoin price movement is independent of other assets. This has significant implications for Bitcoin properties, encompassing its risk profile, volatility dynamics, safe haven properties, and hedge properties. Bitcoin’s institutional and industrial adoption gained traction in 2021, while recent studies suggest that gold lost its safe haven properties against the S&P500 in 2021 amid signs of funds flowing out of gold into Bitcoin. Amid multiple forces at play (COVID-19, halving cycle, institutional adoption), the potential existence of regime changes should be considered when examining volatility dynamics. Therefore, the objective of this study is twofold. The first objective is to examine gold and Bitcoin safe haven and hedge properties against three US stock indices before and after the stock market selloff in March 2020. The second objective is to examine the potential regime changes and the symmetric properties of the Bitcoin volatility profile during the halving cycle. The Markov Switching GARCH model was used in this study to elucidate regime changes in the GARCH volatility dynamics of Bitcoin and its halving cycle. Results show that gold did not exhibit safe haven and hedge properties against three US stock indices after the COVID-19 outbreak, while Bitcoin did not exhibit safe haven or hedge properties against the US stock market indices before or after the COVID-19 pandemic market crash. Furthermore, this study also found that the regime changes are associated with low and high volatility periods rather than specific stages of a Bitcoin halving cycle and are asymmetric. Bitcoin may yet exhibit safe haven and hedge properties as, at the time of writing, these properties may manifest through sustained adoption growth.

1. Introduction

A Bitcoin halving event is defined as an event that decreases a Bitcoin miner’s reward by half, which occurs roughly every four years [1]. Bitcoin price chart and past studies showed that the halving event impacted Bitcoin price in specific manners that formed the Bitcoin halving cycle.
In 
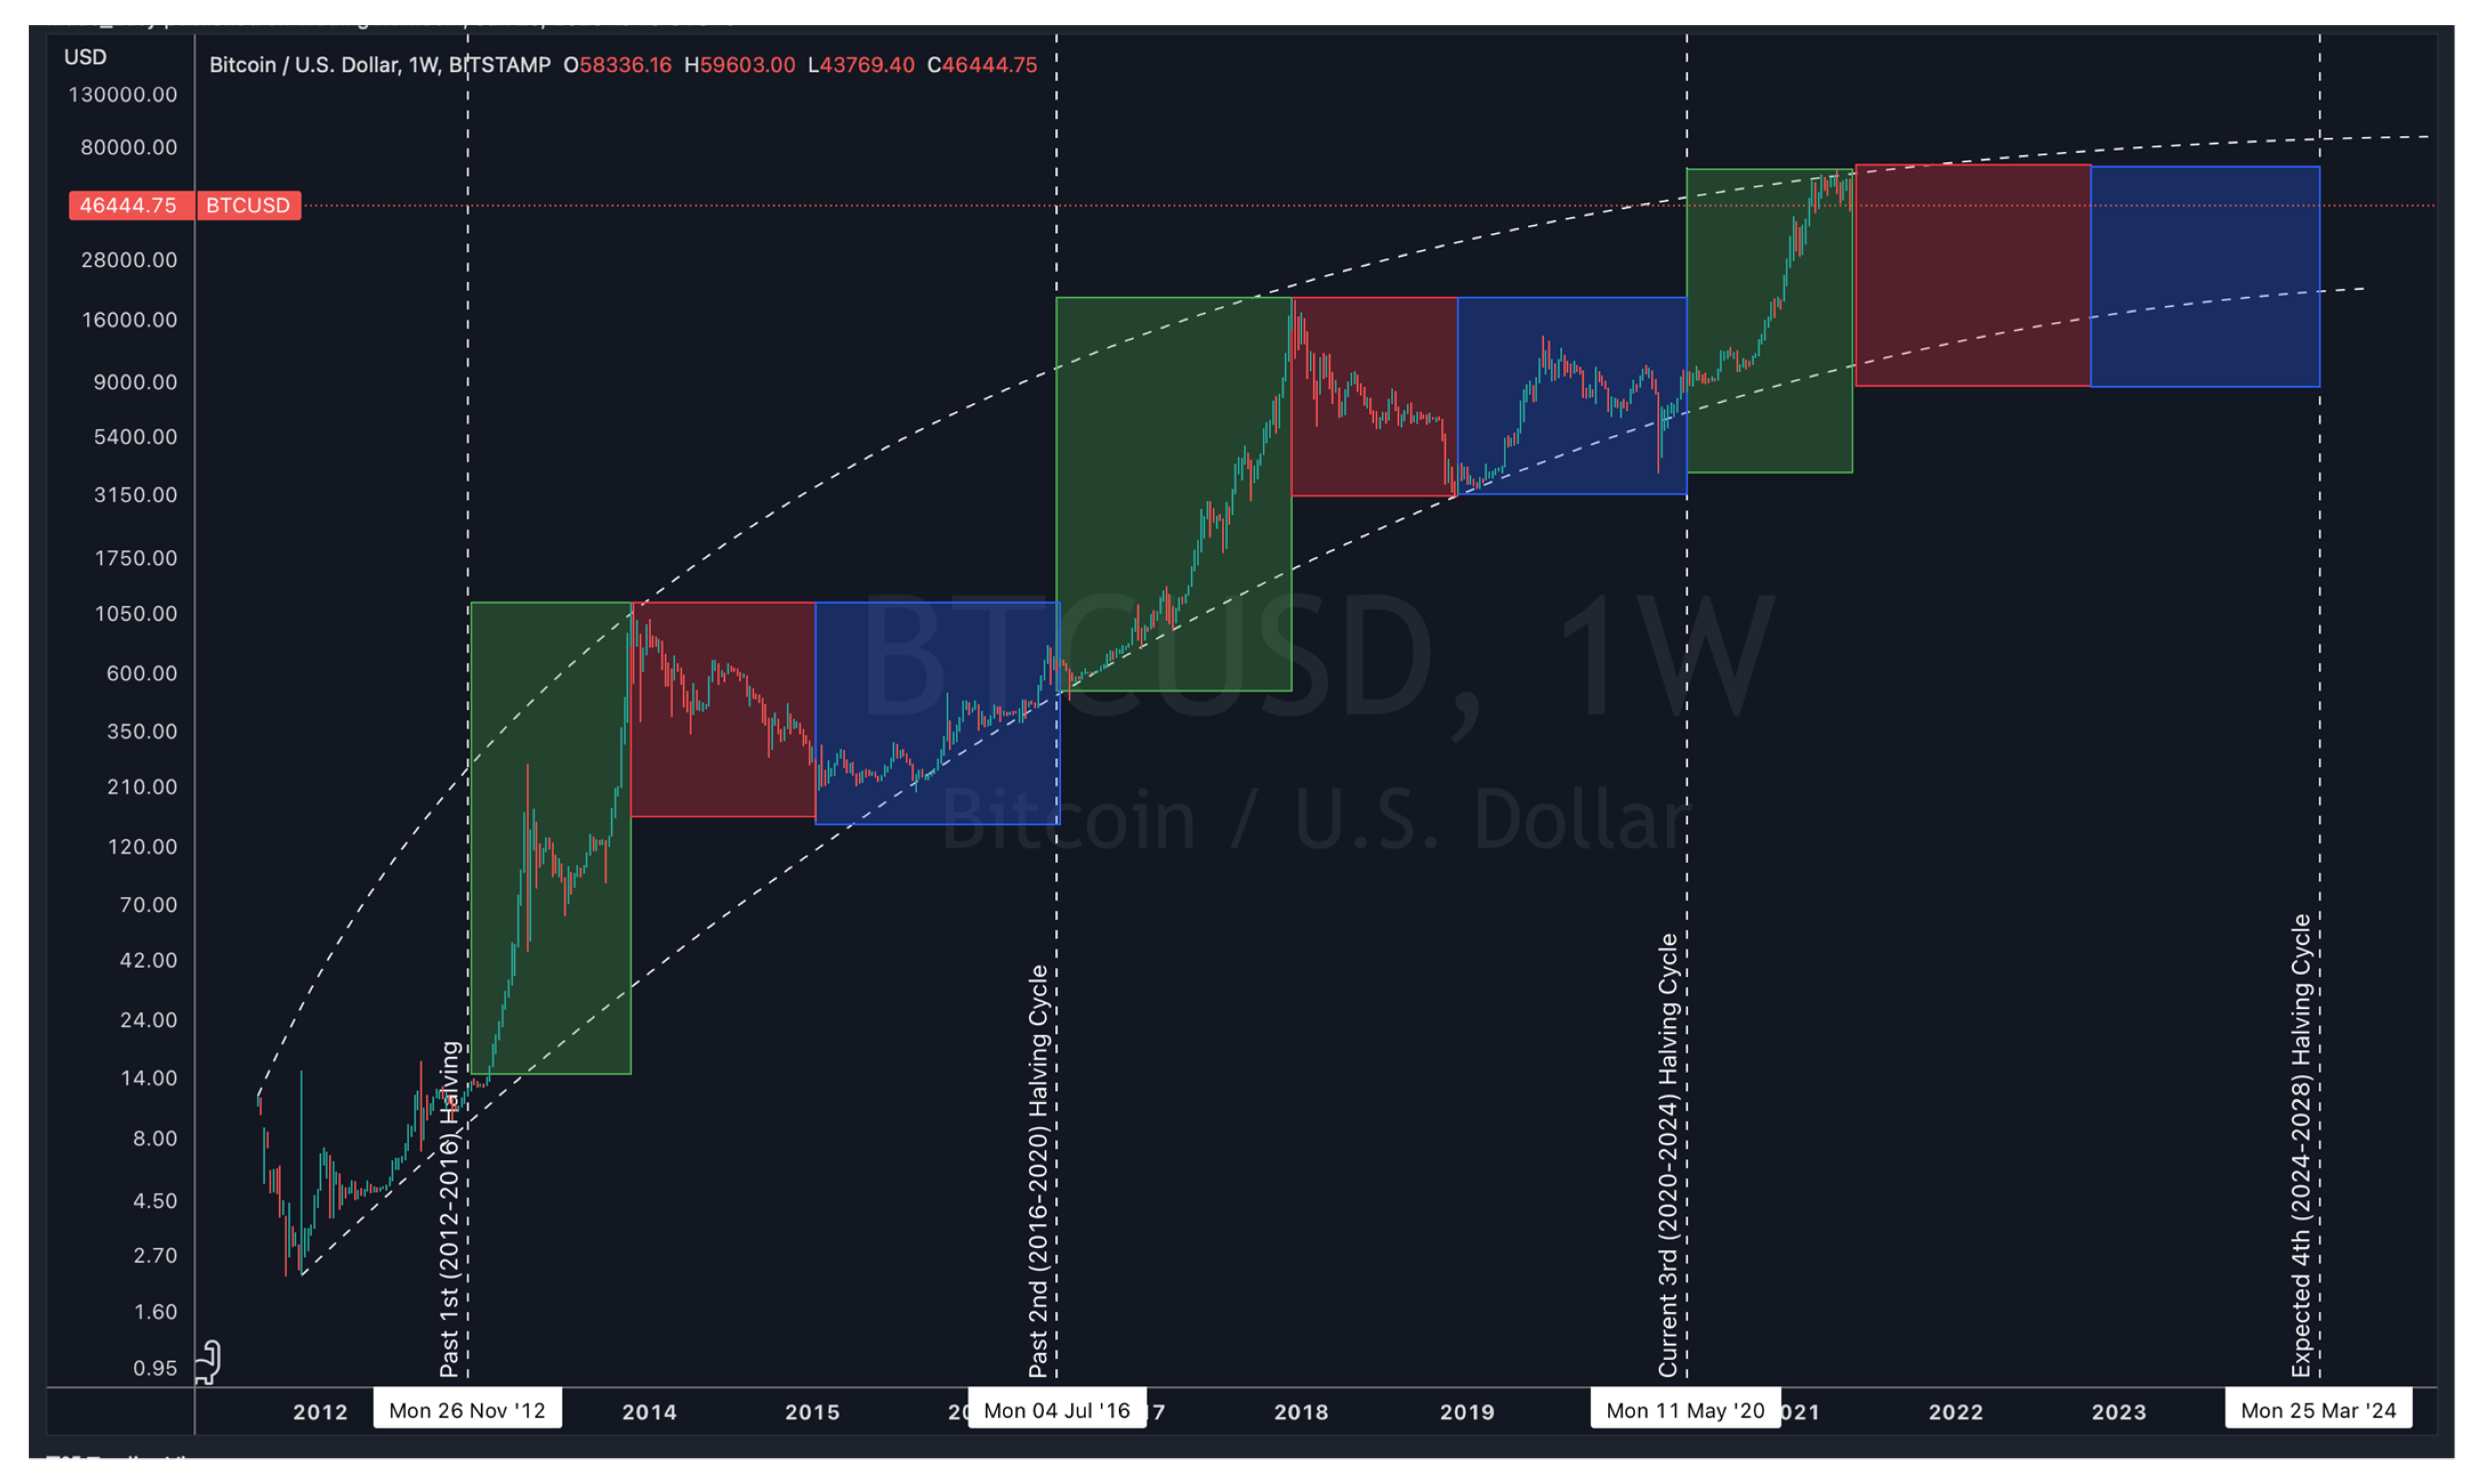
Figure 1, each cycle is segregated by vertical dash lines. Each of the three boxes within a cycle represents the Bitcoin bull market, bear market, and stagnation, respectively. By examining the Bitcoin price chart illustrated in Figure 1, it can be seen that a Bitcoin halving cycle typically consists of three stages: a one-year bull market, followed by a one-year bear market, followed by a two-year stagnation. During the one-year bull market, Bitcoin surpasses its previous high to achieve a new all-time high, per Meynkhard’s [1] findings and has stood the test of time as of the time of this writing. It can also be seen in Figure 1 that Bitcoin is in its third halving cycle and has completed its one-year bull market. Therefore, Bitcoin is expected to be in the one-year bear market stage as of the time of this writing.
  • There are specific sequences of events during each of the three stages of a Bitcoin halving cycle. Figure 2, Figure 3, Figure 4 and 
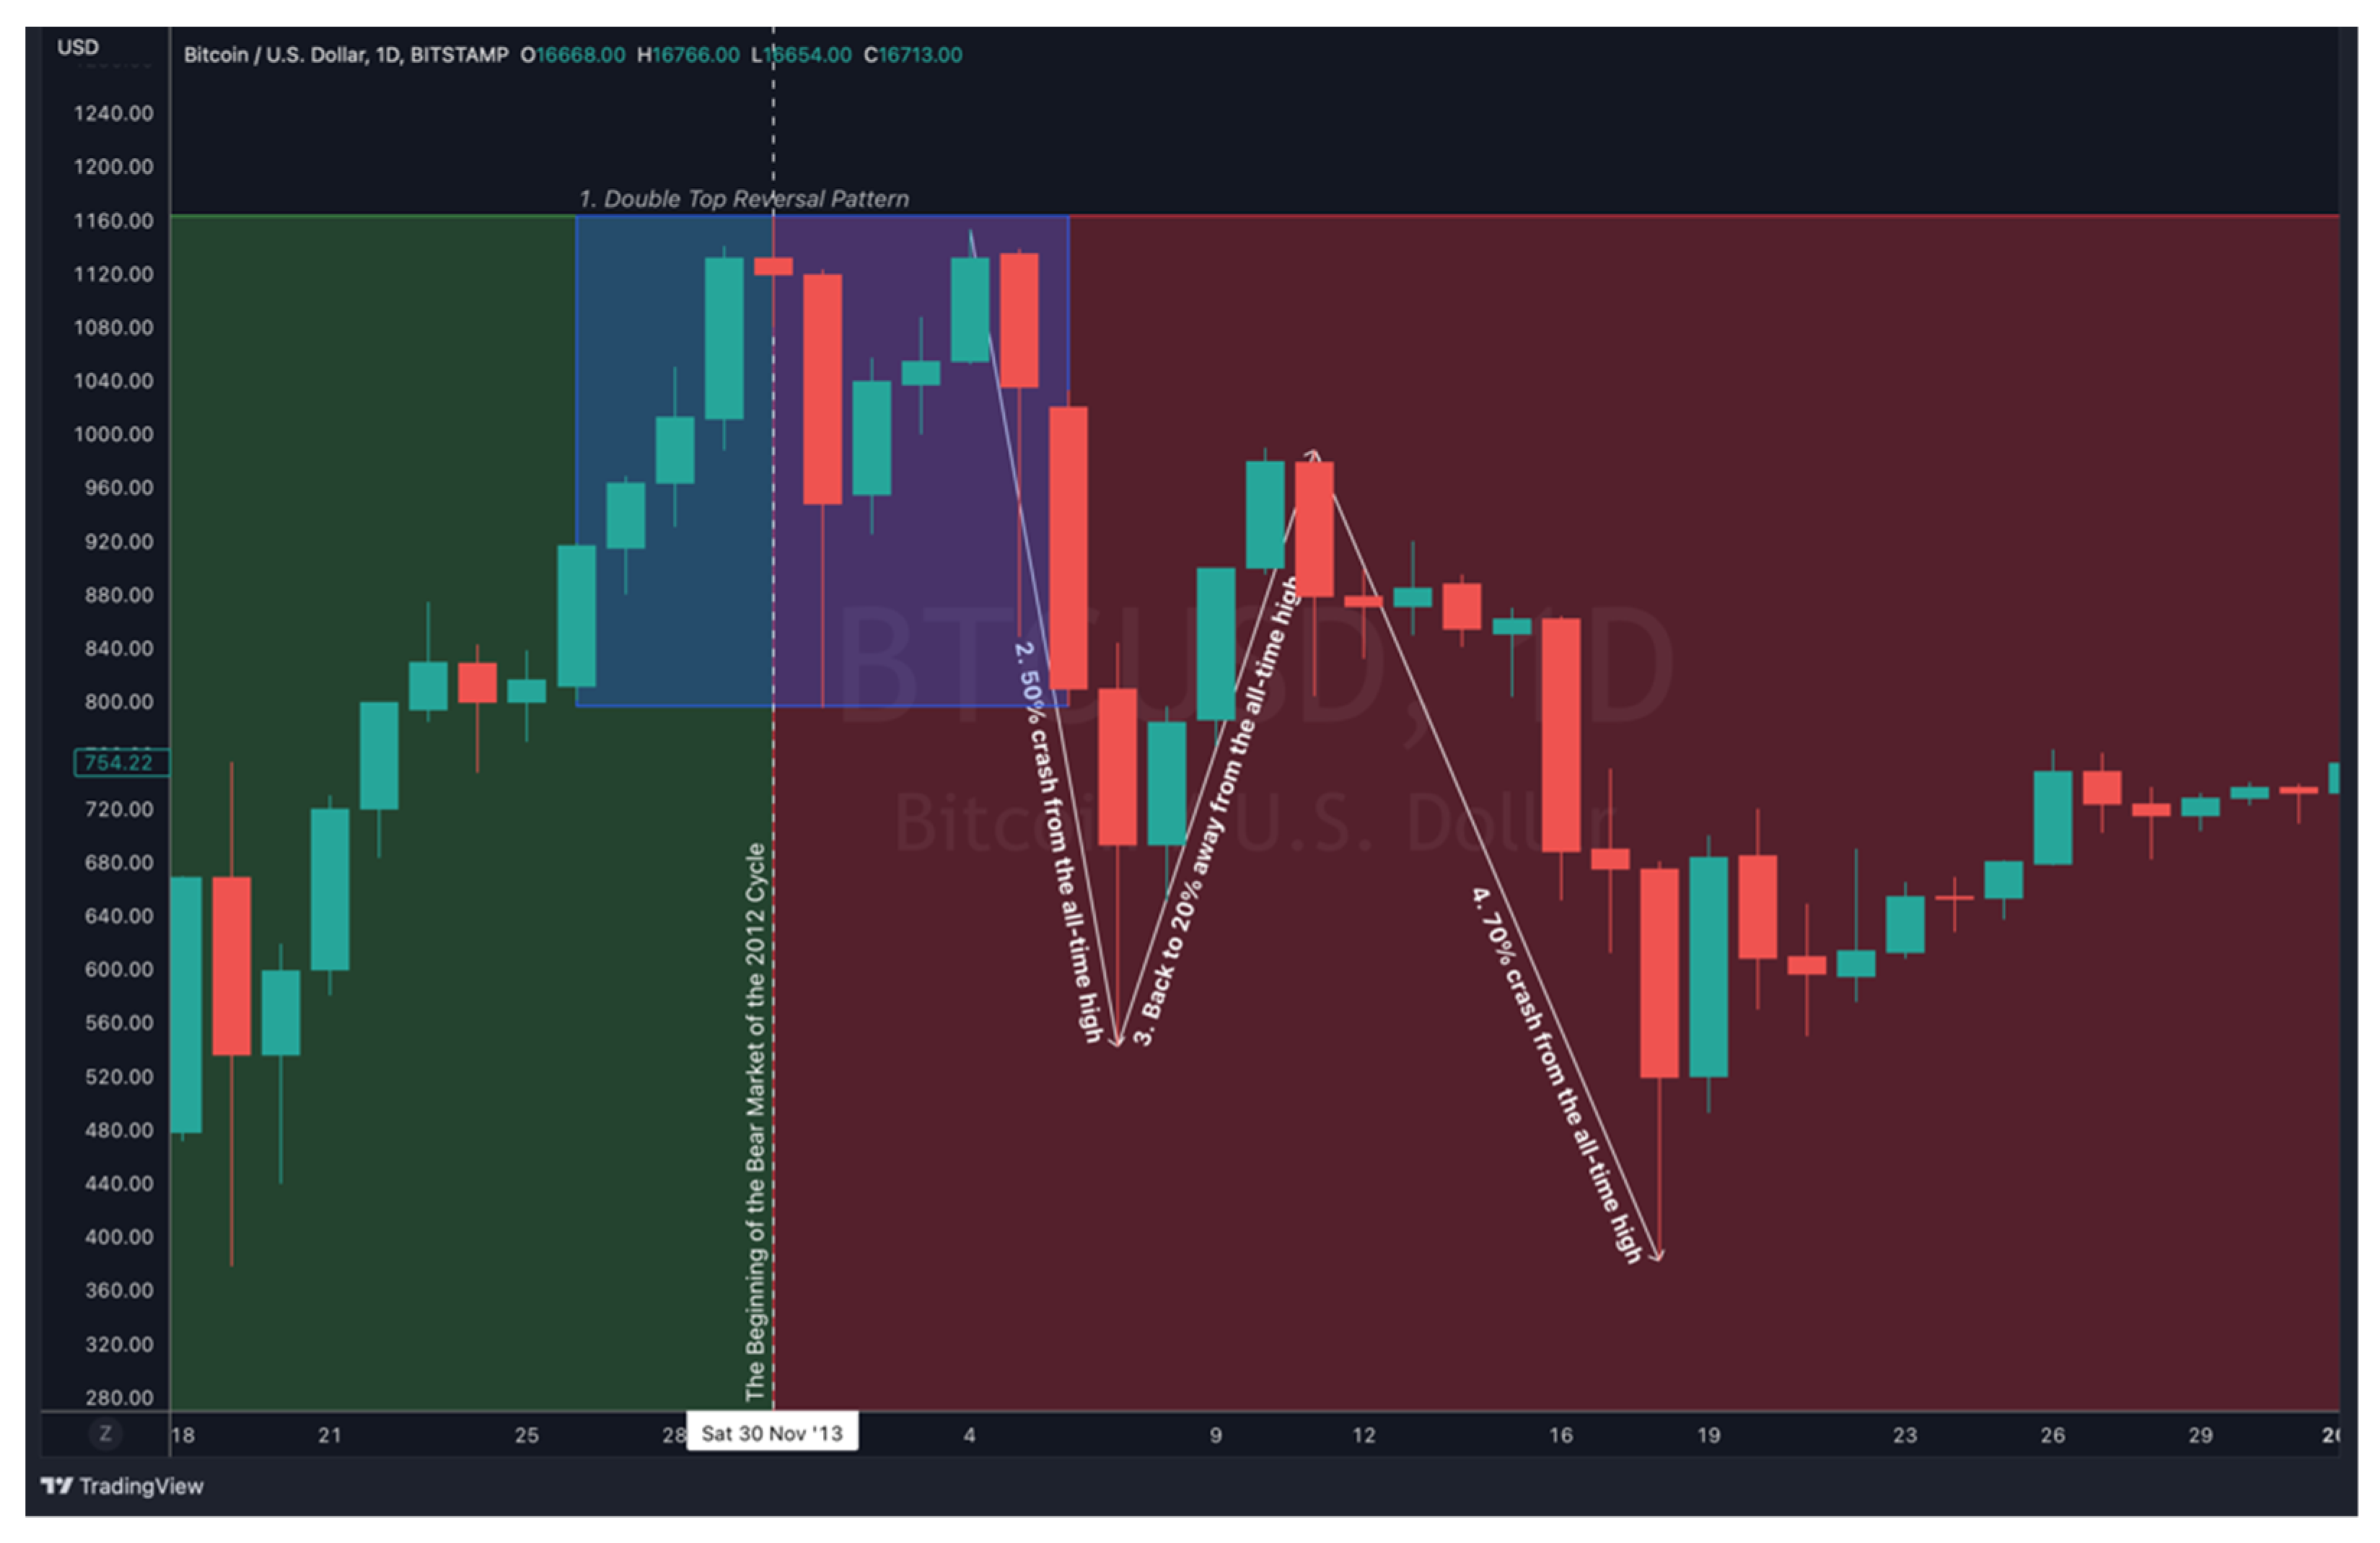
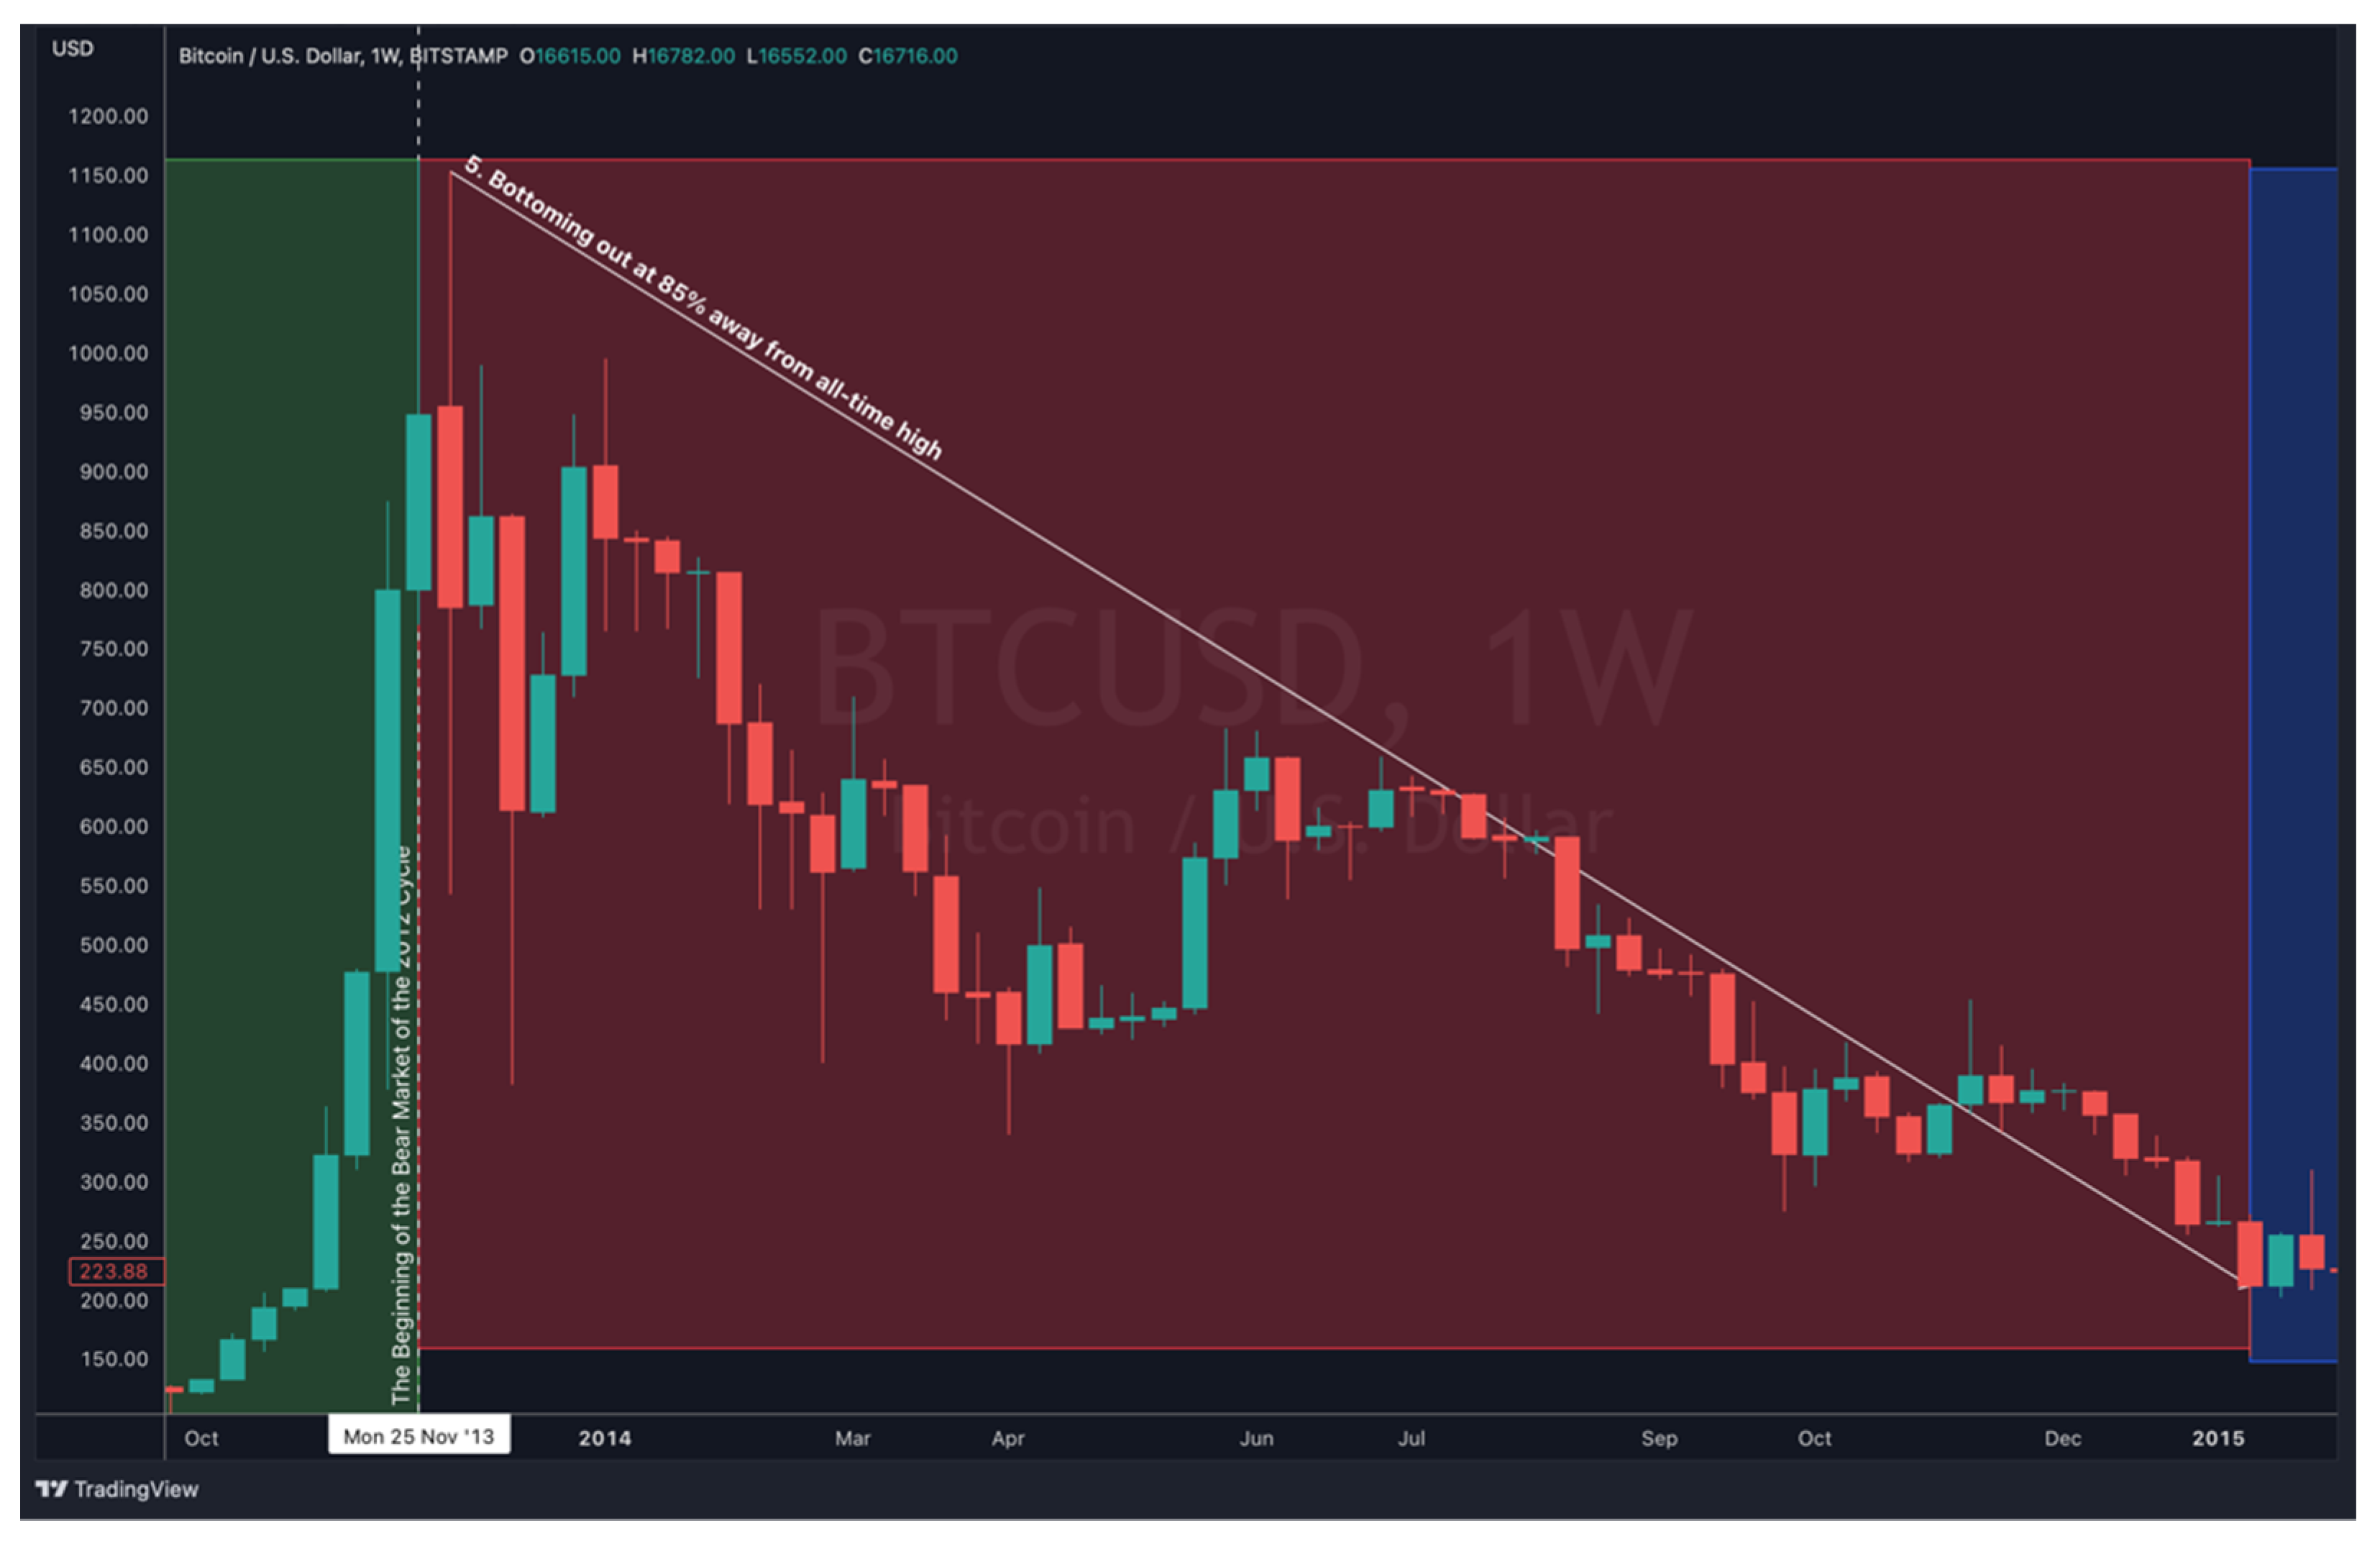
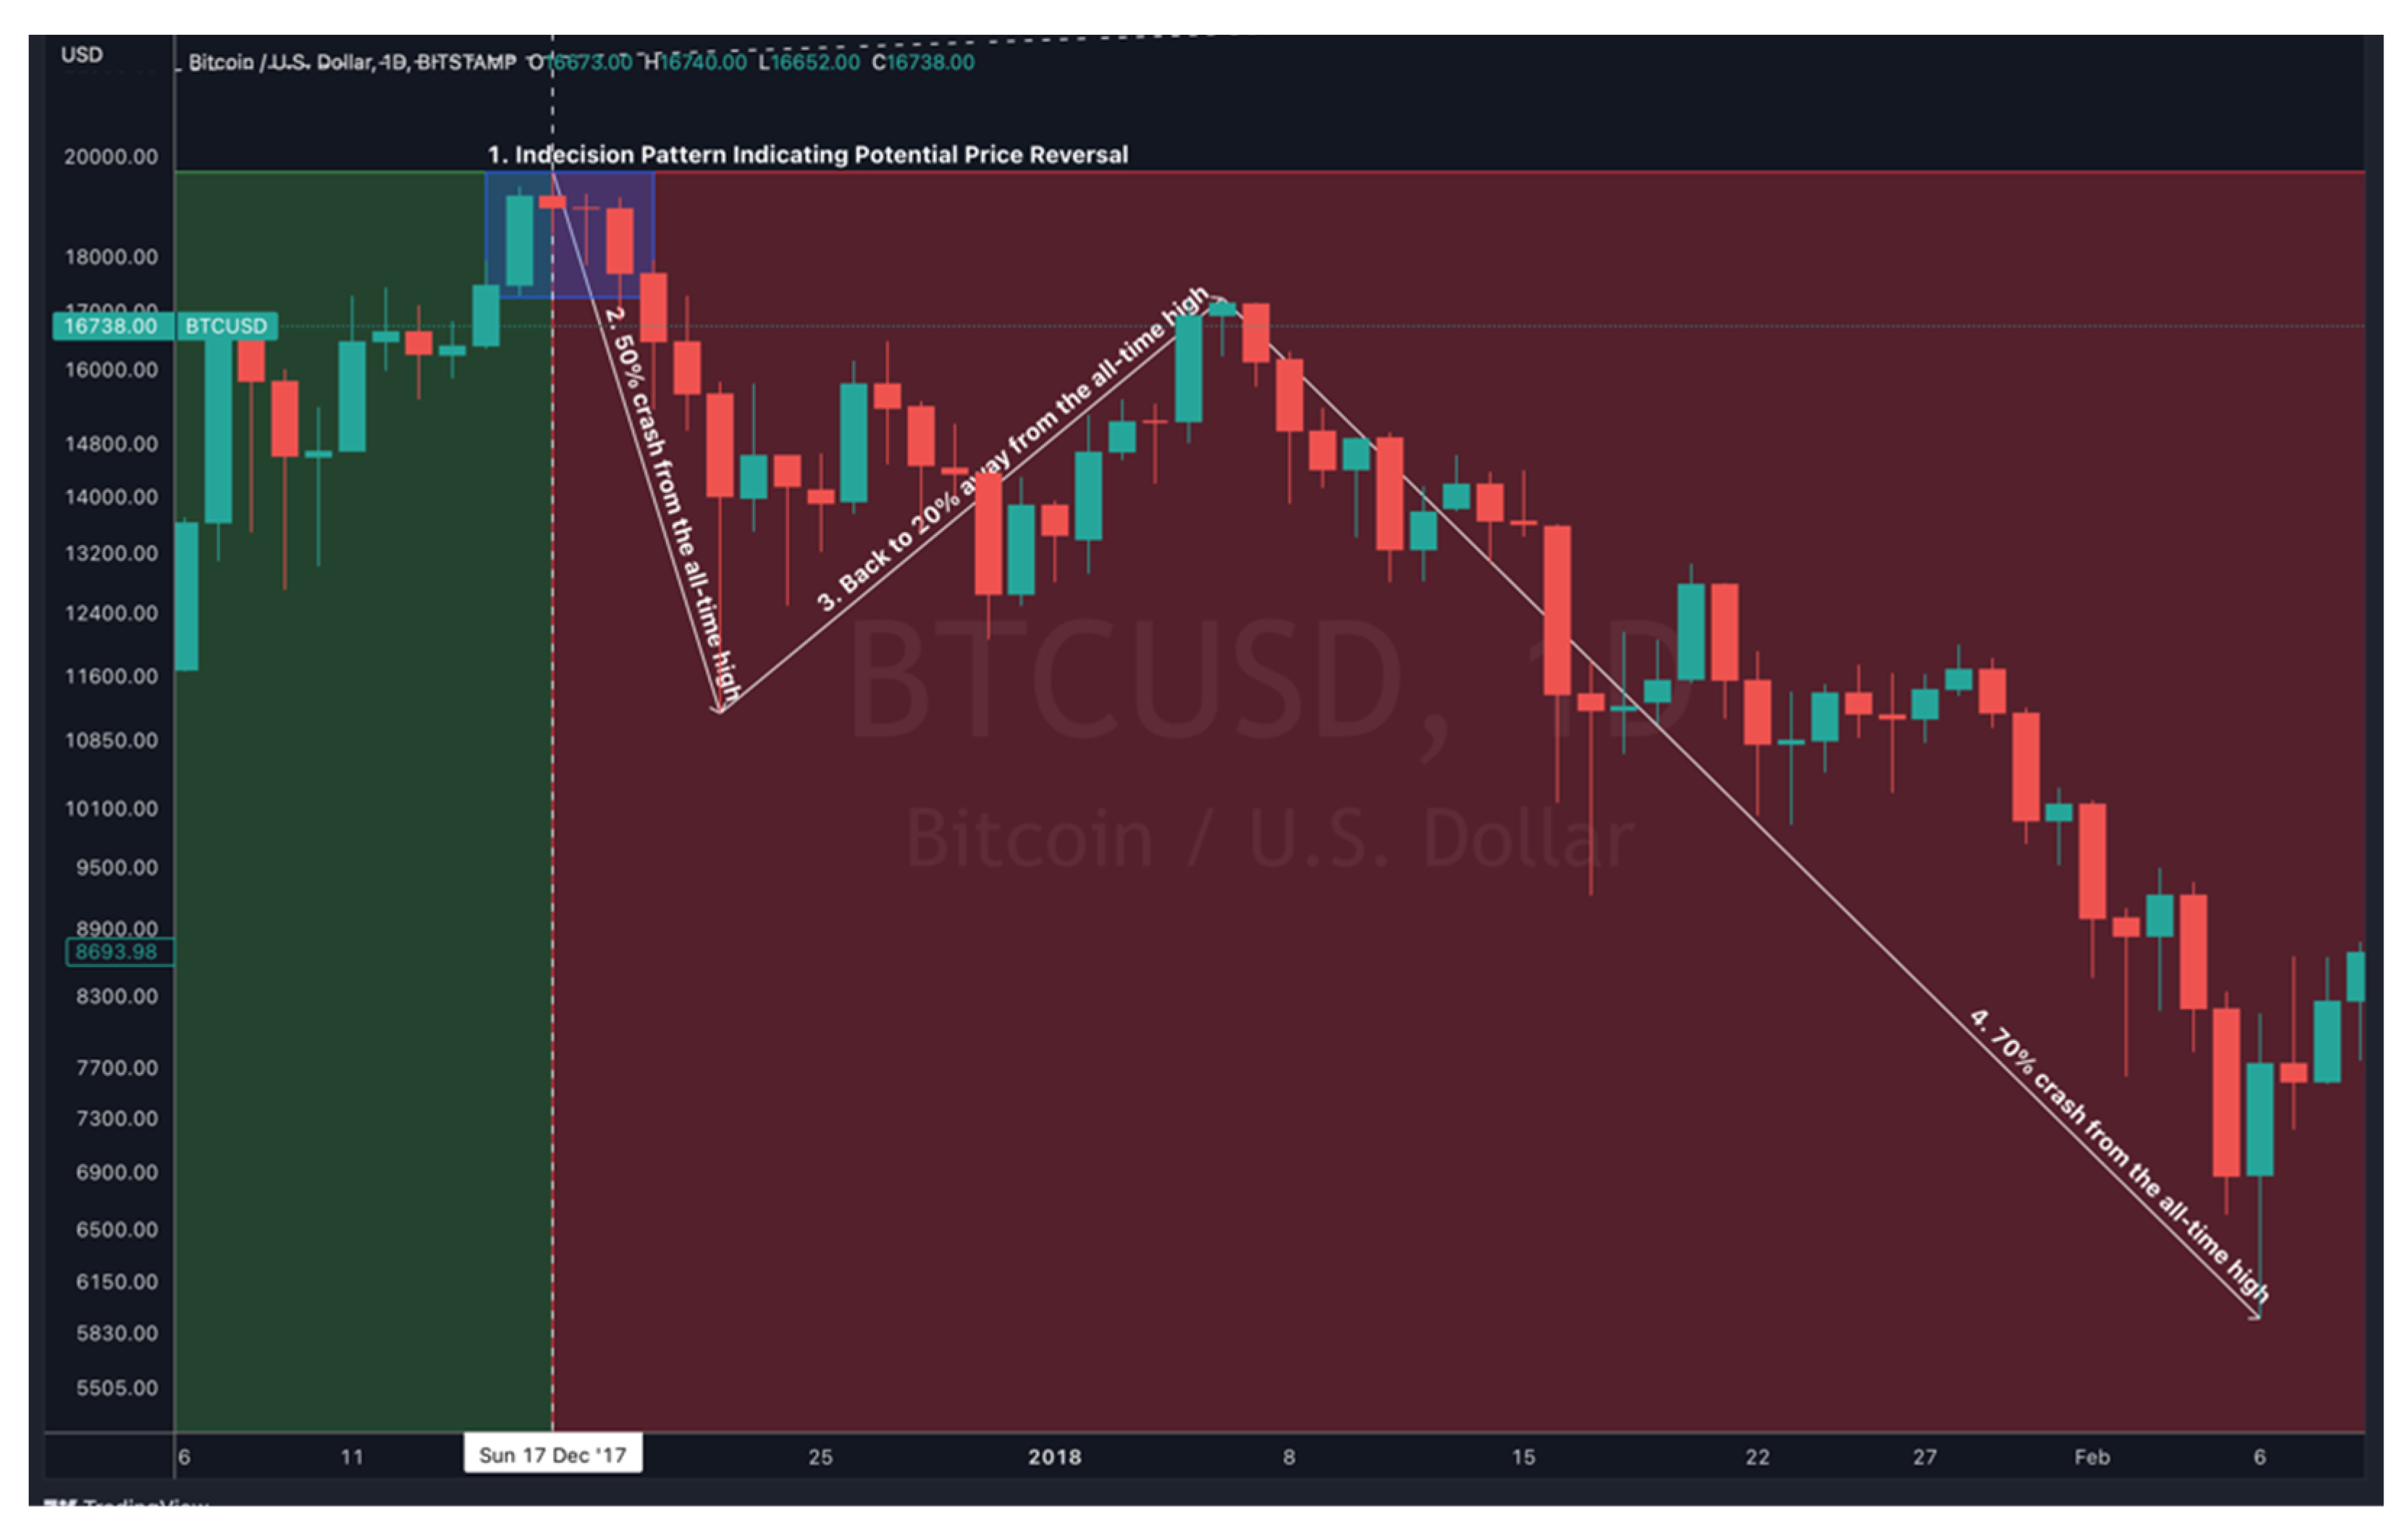
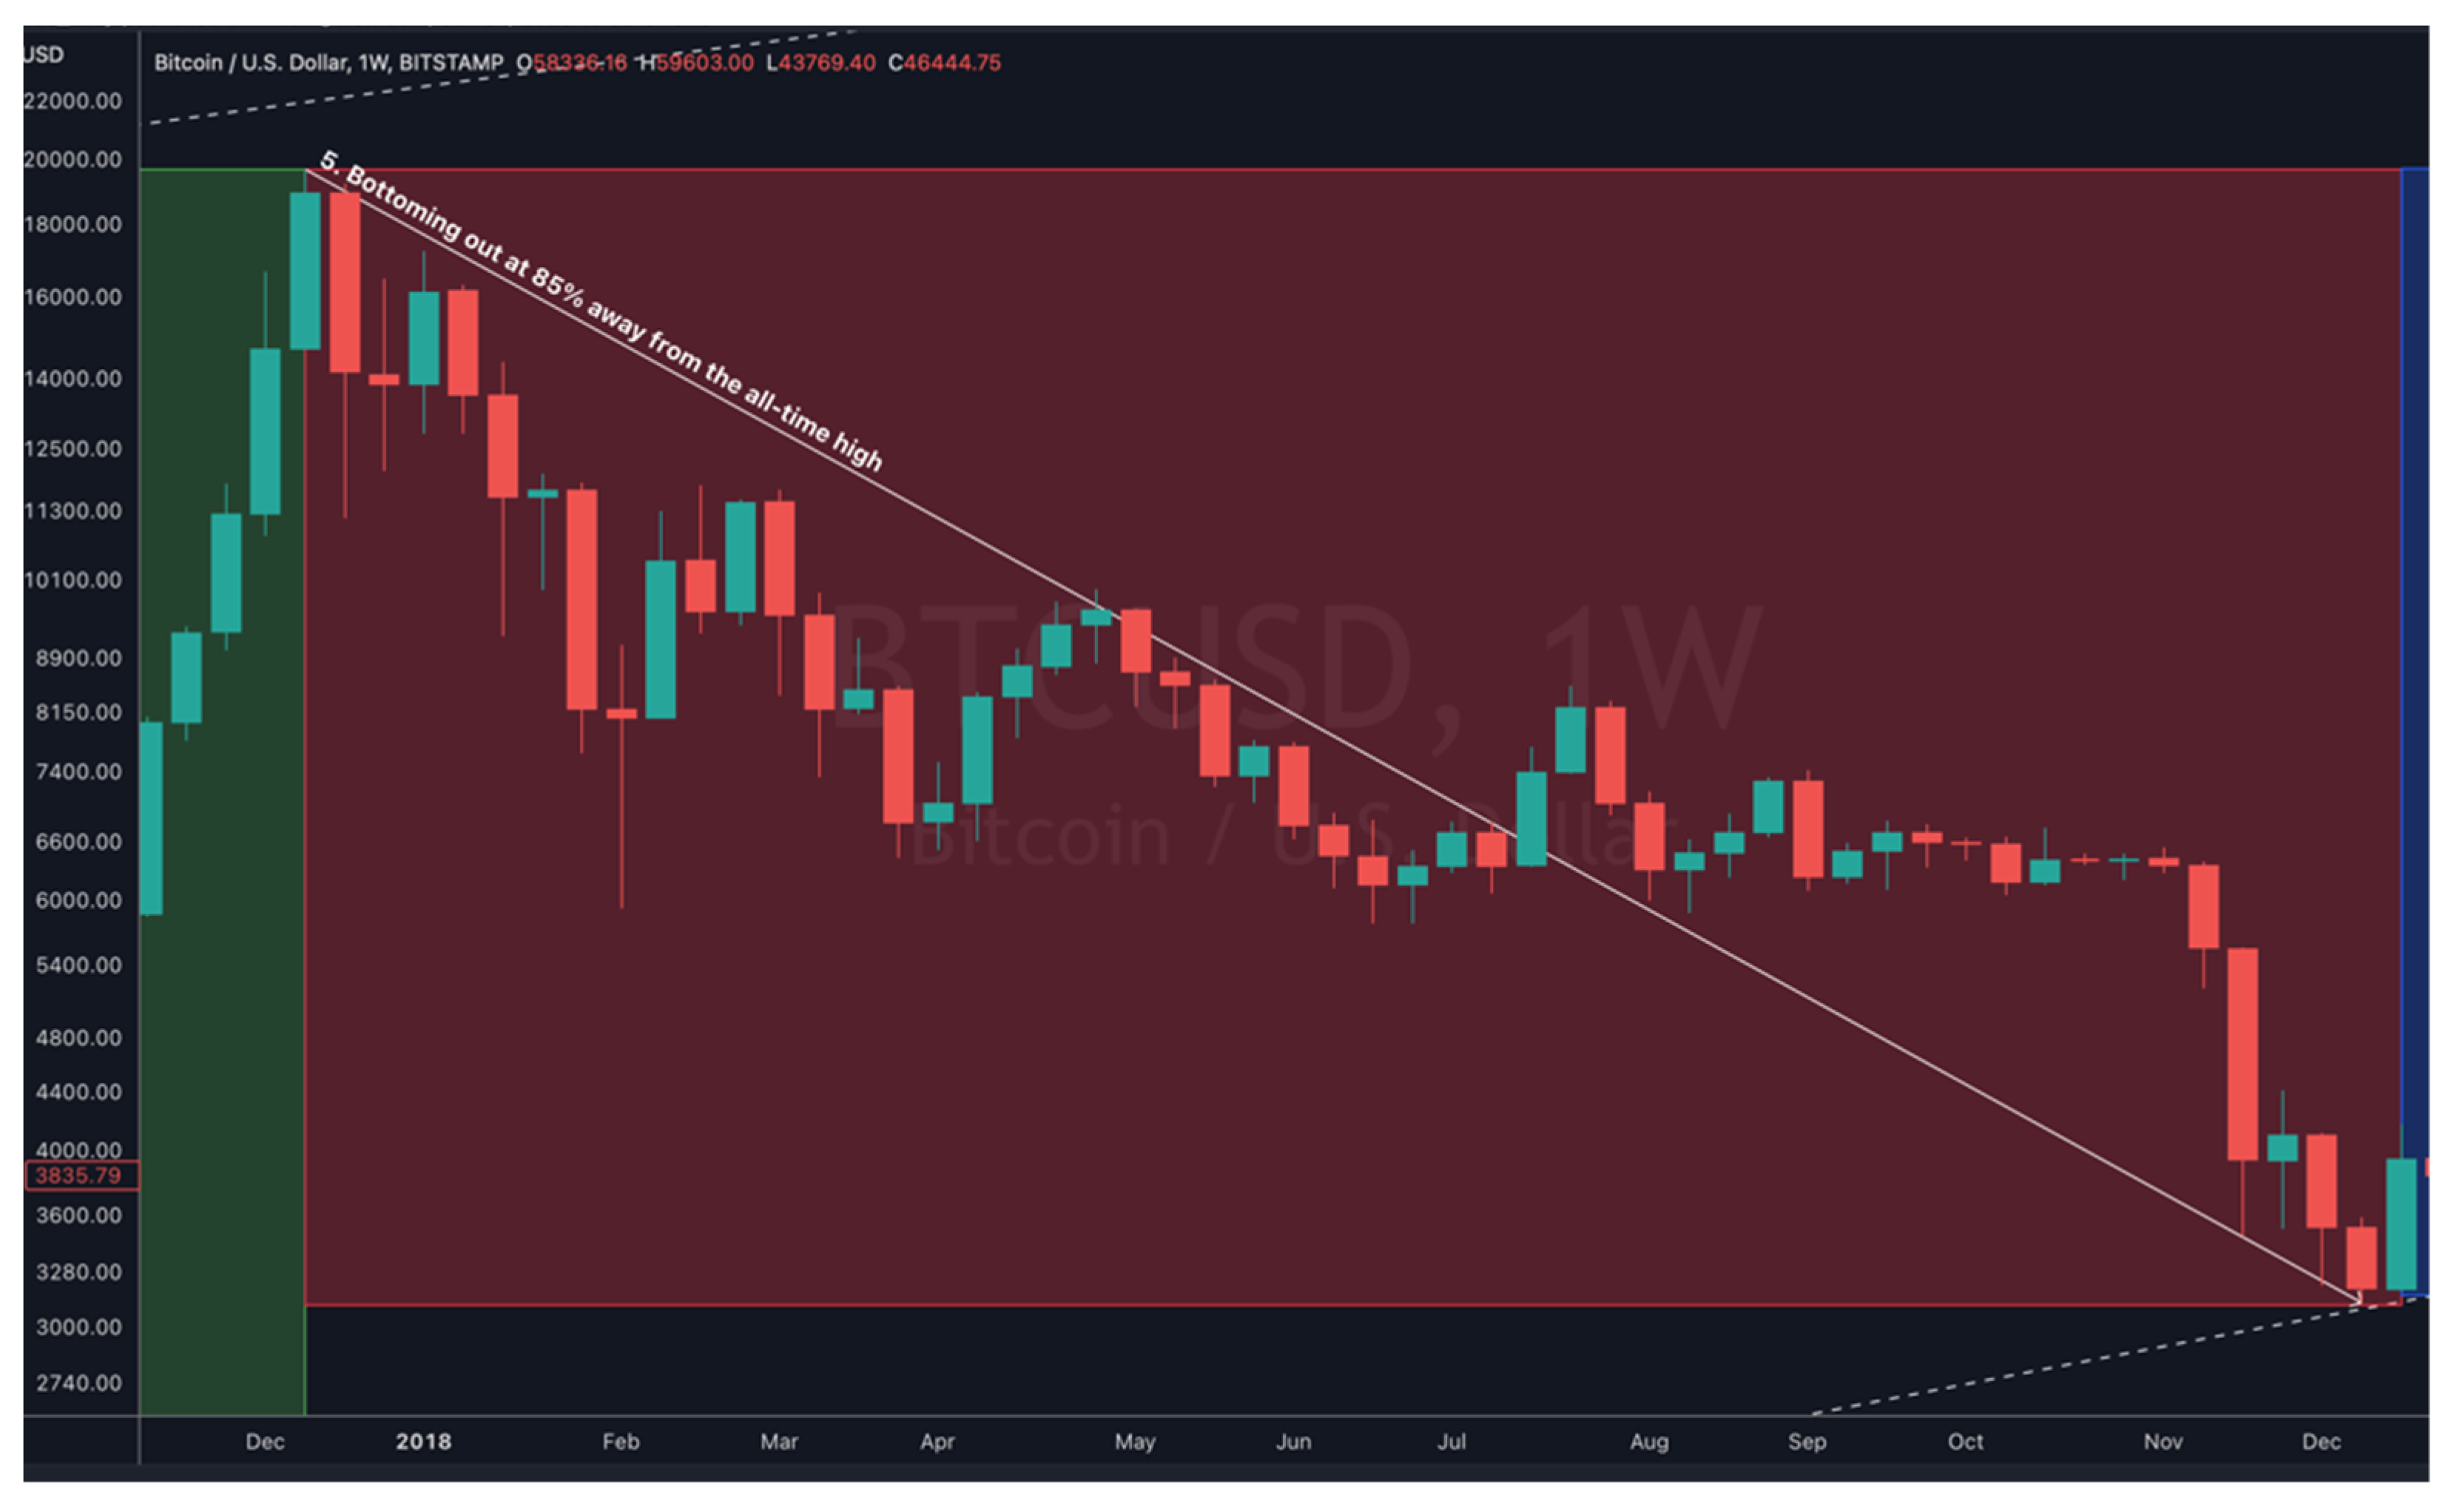
Figure 5 illustrate the five sequences of events consistently taking place during a bear market in Bitcoin’s past two halving cycles. Below are the five sequences of events:
  • Occurrence of reversal pattern at an all-time high;
  • Followed by a 50% crash from the all-time high;
  • Followed by a recovery back to 20% away from the all-time high;
  • Followed by a 70% crash from the all-time high;
  • Eventually bottoming out at 85% from the all-time high.
The Bitcoin halving cycle suggests that Bitcoin price movement follows specific sequences, and is independent of other assets. This has significant implications for Bitcoin properties, encompassing its risk profile, volatility dynamics, safe haven properties, and hedge properties. For instance, Bitcoin should be negatively correlated to the stock market to exhibit safe haven and hedge properties according to the framework proposed by Baur and McDermott [2]. However, Bitcoin halving cycle implies independence (no correlation) of stock market movements. Given the predictability of the Bitcoin price movement, Bitcoin could exhibit time-varying properties that might not be inherent. Furthermore, given the distinctiveness of the three stages within a cycle, there could be certain volatility dynamics that are specific to each stage. While the Bitcoin halving cycle may impact Bitcoin safe haven, hedge properties, and volatility dynamics, these findings may not hold significance without significant industrial and institutional exposures and interests.
Bitcoin is rapidly gaining recognition as an investment vehicle at the retail, institutional, and federal levels. The deputy governor of the People’s Bank of China (PBOC), Li Bo, acknowledged Bitcoin as an investment alternative [3]. The first two Bitcoin Exchange Traded Funds (ETF), were approved in Canada and launched in February 2021. In an interview with CNBC in 2021, Rick Rieder, BlackRock’s chief investment officer of global income, revealed that BlackRock, one of the world’s largest asset managers, has entered the Bitcoin space [4].
Many significant events also occurred in early 2021, suggesting the beginning of the increasing industrial adoption of Bitcoin. These events include big corporations accepting or facilitating payments via Bitcoin, S&P500 companies buying billions of dollars worth in Bitcoin, approval of the first-ever Bitcoin Exchange Traded Funds (ETF), and the world’s largest asset management company entering the Bitcoin space [4]. Additionally, Apple Pay officially announced support of payments via Bitcoin in February 2021, while Google Pay and Samsung Pay have plans to support payments via Bitcoin in Q1 2021. According to SEC Filings, in January 2021, Tesla Inc., an S&P500 company, purchased USD 1.5 billion worth of Bitcoin for diversification and returned maximization of cash not required to maintain operating liquidity. Tesla Inc. also added that it expects to accept Bitcoin for payments soon.
An aspect of industrial adoption is reflected by the rapid expansion in the Bitcoin supply chain. One component of the supply chain is the Bitcoin mining operation. Several well-known Bitcoin mining companies are Bitfarms, Riot Blockchain, and Marathon Digital Holdings. In May 2020, Bitfarms announced the acquisition of 6600 miners, costing an estimated ~USD 43 million. A company’s Bitcoin mining capacity is measured in hast rate per second (H/s), and Bitfarm’s acquisition of 6600 miners will increase its mining capacity to 2.5 EH/s. Bitfarms stated that the company aims to achieve 8 EH/s by the end of 2022, implying that the company would be required to invest an estimated ~USD 80 mil before 2022 to achieve that milestone. Riot Blockchain, Marathon Digital Holdings, and other mining companies are also aggressively expanding their operations.
Another aspect of industrial adoption is the emergence of crypto-asset exchanges and institutional trading volume. For example, Coinbase went public on 14 April 2021, at a valuation of ~USD 65 billion. It is the second world’s largest crypto exchange after Binance. In addition, Coinbase reported that institutional trading volume was double that of retail trading volume in Q1 2021, citing that institutional interest has surpassed retail traders’ [5]. With other major crypto exchanges, such as Gemini, also planning to go public, more capital will be invested into Bitcoin and its supply chain.

1.1. Implications of Bitcoin Rapid Adoption and the Halving Cycle

Firstly, the extensive industrial and institutional adoption suggests that the importance of Bitcoin risk assessment is becoming apparent as more capital is being risked into Bitcoin and its supply chain. According to Ark Invest [6], Bitcoin would be lifted to ~USD 400,000 per coin if institutions allocate 5% of their funds to Bitcoin. Bitcoin’s drastic increase in adoption suggests that its role may go beyond that of the medium of payment or store of value to a hedge against the stock market.
Bitcoin is referred to as digital gold [7], and this comparison is apt as gold can be used as a hedge against many stock markets [8]. The notion of Bitcoin as digital gold is echoed by prolific portfolio manager Cathie Wood of ARK Invest. Two common properties of gold are being a safe haven and a hedge against the stock market and economic turmoil [2,9,10]. However, Bitcoin’s role in this context is highly disputed. Some previous studies regarded Bitcoin as a speculative asset based on transaction data [11,12], while others believe that Bitcoin exhibits safe haven properties and diversification benefits [13,14], implying that the safe haven property of both Bitcoin is dependent on markets, market conditions, time horizon, and other factors such as government intervention and market participant reactions to market events [15,16,17,18]. Moreover, the properties of Bitcoin and gold could begin to interrelate. There may be signs that funds are flowing out of gold to the Bitcoin [19]. A recent contrasting finding suggests that gold did not exhibit safe haven properties against one of the US stock indices (S&P500) during the COVID-19 pandemic [17]. As a result, there might be a possibility that Bitcoin is displacing gold as a safe haven asset amidst the rising momentum of its adoption.
Secondly, the stages and sequences of events in the Bitcoin halving cycle suggest that there may be the existence of regimes in Bitcoin volatility dynamics during each stage or sequence of events. A deeper open problem suggested by past studies [20] is the lack of a fundamental approach to assessing the value and risk of Bitcoin. The potential existence of regimes that are associated with different stages in the Bitcoin halving cycle will only add to the challenges of Bitcoin risk assessment. For instance, Value-at-risk (VaR) is one of the statistical measurements that assess Bitcoin volatility over a specific time frame by determining Bitcoin probability and severity of losses. Since VaR is sensitive toward volatility, regime changes can cause the VaR computed throughout low volatility to understate the actual risk level. Aside from the potential existence of regimes associated with the Bitcoin cycle, black-swan events, such as the COVID-19 pandemic, can also result in the same effect.
The lack of a fundamental approach to Bitcoin risk assessment also has another set of significant implications for Altcoins such as Ethereum (ETH). Agosto and Cafferata [20] examined the co-explosivity in the crypto market and the interdependencies of crypto prices. The authors found high interdependence in the crypto market and that the Bitcoin explosive periods also coincide with the Altcoins’. This finding also aligns with other recent notable studies [21,22,23]. For instance, Bitcoin is found to be negatively related to Ripple (XRP), and this negative relationship is amplified during bubble periods. The interdependence between cryptocurrency prices, such as the Bitcoin–Ripple relationship, is found to be related to the function of the cryptocurrencies.
In short, due to the extent of Bitcoin’s impact on the wider crypto market, it is even more essential to access the Bitcoin risk assessment (VaR) under specific contexts (or regimes). Limited past studies considered the Bitcoin risk assessment (VaR) in the context of the recent COVID-19 pandemic, a spike in the USA’s money supply, and a drastic increase in industrial and institutional participation in Bitcoin and Bitcoin supply chain. Furthermore, Bitcoin completed its second halving cycle in May 2020 and entered its third cycle.
Ardia, Bluteau, and Rüede [24] found that regime changes existed in the Bitcoin GARCH volatility dynamics between 19 August 2011, and 2 March 2018. The authors accounted for regime changes in Bitcoin volatility using regime-switching GARCH models, such as the Markov Switching GARCH (MSGARCH) model. The authors found that regime-switching GARCH models suited Bitcoin volatility better than a single-regime GARCH based on Deviance Information Criterion (DIC) and VaR forecasting. Maciel [25] also reported similar findings during this period and showed that regime-switching GARCH forecasted VaR more accurately than its single-regime counterparts. There is also a similar recent study that analyzed how prices transit between different regimes (“bull”, “stable, and “bear”), but this study examines the Bitcoin price dynamics at a more granular level based on the unique and well-defined decade-old four-year cycle consisting of three phases with distinctive sequences of events illustrated in Figure 1, Figure 2 and Figure 3.

1.2. Objective

Therefore, the goal of this study is twofold: (1) to examine the safe haven and hedge properties of gold and Bitcoin specifically against the US stock indices before and after the market crash in March 2020; (2) to examine Bitcoin volatility dynamics via Markov-Switching (MS) GARCH models under the above-mentioned context. This work primarily extends the two past studies where one study, [26], examined the safe haven and hedge properties of Bitcoin and gold against the G7 stock market indices between 2010–2018, while the other, [24], studied the regime changes existed in Bitcoin GARCH volatility dynamics between 2011–2018. This study extends these two past studies by investigating periods after 2018 (from 2017 to 2021) where the COVID-19 black-swan event and major developments in Bitcoin adoption occurred that could displace gold.

2. The Literature Review

2.1. Is Gold the Undisputed Hedge against Stock Market Risk

Gold is a popular commodity for hedging the market and economic turmoil [2,9]. However, contrary to popular belief, the safe haven and hedge properties of gold are not uniform across markets, market conditions, time horizon, and other factors, such as market participant reaction and government intervention [15,16,17,18].
Chkili [16] studied the safe haven effect of gold against BRICS (Brazil, Russia, India, China, and South Africa) stock market risk during three major geopolitical and economic crises: the 911 terrorist attacks, the global financial crisis in 2008, and the European debt crisis in 2009. Chkili [16] suggested that gold has a safe haven effect during crises, but the effect varies across the three crises and is also dependent on the magnitude of the shock of the stock market participants toward events. Iqbal [15] reported similar findings, where the hedge effectiveness of gold is not uniformly strong across the gold market conditions in the USA, India, and Pakistan. For example, Iqbal [15] reported that gold could only hedge against the US stock market risk during the gold bull market of 1991–2013. However, a more recent study reported that gold failed to exhibit safe haven properties uniformly across four global stock market indices in the US, Europe, Japan, and China after 16 March 2020 [17]. Akhtaruzzaman et al. [17] attributed this to government intervention via relaxed fiscal and monetary policies.
If gold loses its safe haven properties, investors would be expected to search for alternate assets, such as Bitcoin, for a safe haven. According to Blomberg [27], JPMorgan is predicting a significant shift from gold to Bitcoin. JPMorgan reported that gold has been suffering net money outflows, while more money has been pouring into Bitcoin as it observed a net inflow of $2 billion into Grayscale Bitcoin Trust from October to December and a net outflow of $7 billion for ETF backed by gold [19]. Since Bitcoin is referred to as a digital gold [7], this observation suggests that investors consider Bitcoin a gold replacement as a safe haven during stock market distress. However, there are also studies arguing that Bitcoin is unable to replace gold due to regulatory restrictions (such as anti-money laundering and counterterrorism regulations) and asset security issues (such as the risk of hacking and theft) [28,29,30].

2.2. The Safe Haven and Hedge Properties of Gold and Bitcoin against the Stock Market

There is no consensus on the safe haven properties and hedge ability of Bitcoin toward the stock market, as these properties of an asset are not uniform across markets, market conditions, time horizon, and other factors, such as market participant reaction and government intervention [15,16,17,18,31]. Although these studies were conducted before Bitcoin bottomed out in November 2018, these findings can be used to manage stakeholders’ expectations when using Bitcoin to hedge against stock market risks.
Thampanya, Nasir, and Huynh [18] examined Bitcoin and gold asymmetric correlation and hedging effectiveness against the Thai stock market and found that neither is a good hedge against the stock market because the correlation between the two commodities and the Thai stock market were found to be positive in most cases for 2000–2019.
Shahzad et al. [26] also studied the safe haven and hedge properties of both gold and Bitcoin against the G7 stock market indices for 2010–2018 and found that Bitcoin was more effective in hedging against the Canadian stock market index relative to gold. This could be because the safe haven property of gold is undermined by the higher concentration of natural resource companies in the Canadian stock index [32]. In terms of safe haven properties, Shahzad et al. [26] found that gold exhibited safe haven and hedge properties against six out of the seven G7 stock market indices, including the US stock market index. On the other hand, Bitcoin only exhibited safe haven properties for two out of seven of the G7 stock market indices and hedge properties against four out of seven of the G7 stock market indices. These findings agree with previous studies during Bitcoin’s infancy stage [12,33].
Previous studies also suggested that Bitcoin can hedge against the US stock market. For example, Dyhrbeg [34] argued that Bitcoin shares many similarities with gold based on their similar reactions to variables, such as Federal Funds Rates, the USDEUR exchange rate, and the FTSE index. However, Bitcoin reacts faster to market sentiment relative to gold due to the former’s smaller market capitalization.
In summary, disputes related to the safe haven and hedge properties of assets, such as gold and Bitcoin, arise because an asset’s safe haven and hedge properties are not uniform across markets, market conditions, time horizon, and other factors, such as market participant reaction and government intervention. For example, one of the most notable and recent findings suggests that gold did not exhibit safe haven properties after the COVID-19 pandemic [17]. Therefore, this study extends Shahzad et al.’s [26] work by examining the safe haven and hedge properties of Bitcoin and gold against three US Stock indices before the COVID-19 pandemic and after the V-shaped recovery from the bottoming out event caused by the COVID-19 pandemic in March 2020.

2.3. Presence of Regime Changes in Bitcoin GARCH Volatility Dynamics

Researchers and practitioners extensively use the single-regime GARCH-type models to forecast volatility [24]. One popular application of forecasting volatility using GARCH-type models is to measure the hedge effectiveness of an asset [35]. More recent innovative and novel methods address the non-linear and time-varying characteristics of volatility forecasting. One of the approaches uses non-linear machine learning models to compensate for the linearity of the GARCH models [36]. Hu et al. [36] combined the Long Short Term Memory (LSTM) neural networks, Artificial Neural Networks (ANN), and GARCH to address the non-linear and time-varying characteristics of the factors affecting volatility in copper prices, where GARCH was used to model copper price time-varying volatility while the neural networks were used to engineer more presentative non-linear features from the GARCH model’s volatility forecasts along with the other market factors to better forecast copper price volatility. The results showed that GARCH volatility forecasts are meaningful and can significantly improve volatility forecasting when used in conjunction with other market variables and non-linear models.
Recent developments in the field of artificial intelligence also presented new ways to expand Hu et al.’s [36] work. Chan et al. [37,38] developed a novel correlation-embedded attention model that allows the model to learn and associate input variables (also known as ‘features’) by correlation. This method is useful to mitigate an inherent statistical problem known as multicollinearity. Multicollinearity is a problem where models’ features are highly correlated to one another, and the resulting impact is the reduction in generalization ability. Mathematical models, including machine learning models, are prone to the multicollinearity problem [38]. Chan et al. [37,38] found that by introducing a correlation-embedded module, a variation of the attention module, in between the features and the main model, the main model’s predictive ability can improve.
Progress in GARCH volatility modeling has advanced its application in financial risk management. The Value-at-Risk (VaR) is widely accepted as an approach to the risk management [39]. VaR measures the quantile distribution of log returns over a specified time horizon [40]. The distribution can then be used to assess asset allocation strategies and the performance of the risk models via the backtesting [41]. Additionally, GARCH is often used to estimate the volatility component of VaR [42], and VaR is also used to benchmark volatility models, such as GARCH models [25].
However, Krause [43] reported that VaR is prone to significant estimation errors and downside bias via manipulation under certain circumstances. For instance, VaR-modeled low volatility can understate the risk of a black-swan event, such as the COVID-19 pandemic. The occurrence of black swan events and time-varying characteristics of market factors suggest a potential presence in an asset’s volatility dynamic. Although there are innovative and novel applications related to GARCH volatility forecasting, there are limited studies considering the existence of regimes in GARCH’s conditional variance process. Ignoring the potential existence of regimes in GARCH’s conditional variance process can lead to inaccurate and biased volatility forecasts [44].
Ardia, Bluteau, and Rüede [24] found that regime changes existed in Bitcoin’s GARCH volatility dynamics between 19 August 2011 and 2 March 2018. The authors accounted for regime changes in Bitcoin volatility using regime-switching GARCH models such as the Markov Switching GARCH (MSGARCH) model. The authors found that regime-switching GARCH models Bitcoin volatility better than single-regime GARCH based on Deviance Information Criterion (DIC) and VaR forecasting. Maciel [25] also reported similar findings during this period and showed that regime-switching GARCH forecasted VaR more accurately than its single-regime counterparts. However, due to the events occurring beyond 2018 (the COVID-19 black-swan event and major development in Bitcoin adoption), it is crucial to investigate whether these findings could be extrapolated beyond 2018.

3. Methodology

The model used in this study to test the safe haven property of a hedge asset is proposed by Baur and McDermott [2]. The presence of regime changes in Bitcoin volatility dynamics is assessed via regime-switching models.

3.1. The Dataset

The three US stock indices examined in this study are the Dow Jones Industrial Average, Nasdaq 100, and the S&P500. US stock indices were specifically selected out of the G7 countries because only the US (fifth) was ranked among the top 10 in the 2022 Global Crypto Adoption Index [45]. The daily price data was extracted directly from the respective stock exchanges. The daily price data of Bitcoin was extracted from CoinDesk, while the daily price data of spot gold was extracted from Investing.com. Similar to Shahzad et al. [26], the empirical analysis was conducted with the percentage change of the daily data (daily return) from October 2017 to February 2021. The sample period covered a brief period before and after the COVID-19 pandemic to examine the timely properties of gold and Bitcoin right before the pandemic and during the pandemic.
The dataset is split into two subsets. The first subset covers the period before the COVID-19 market crash, from 1 October 2017 to 28 February 2020, while the second subset is identical to the original dataset, covering the period between October 2017 to February 2021.

3.2. Safe Haven and Hedge Properties Testing

According to Baur and McDermott [2], the safe haven and hedge properties are estimated via the following equations:
rhedgeasset,t = a + btrstock,t + et
bt = c0+ c1D(rstock, q10) + c2D(rstock, q5) + c3D(rstock, q1),
where:
  • rt denotes the return of an asset at time t;
  • D(.) denotes dummy variables;
  • Qi denotes the i-th quantile of an asset’s return;
  • et is the error term at time t.
The parameters to estimate in Equations (1) and (2) are a, c0, c1, c2, and c3. The dummy variable D(.) is used to capture extreme stock movements. The respective dummy variables D(.) equals 1 when a stock index return exceeds 10%, 5%, and 1% quantile of the return’s distribution. The haven benchmark for a hedge asset (Bitcoin or gold) is shown in Table 1.
Adekoya, Oliyide, and Oduyemi [46] argued that time-variation and regime changes should also be considered in the estimation process. By taking into account regime changes, the general theoretical exposition can be defined as:
rhedgeasset,t = (β1 + α1rstock market,t) I[qt ≤ γ] + (β2 + α2rstock market,t) I[qt > γ] + errort,
where qt is the threshold variable and y is the threshold value.
The threshold value, y, divides the observations (extracted daily prices of the seven market indices, spot gold, and Bitcoin) into distinct regimes (assuming two regimes). I(.) is the indicator operator, where I(.) equals one if the observation falls into the specified regime [46]. The switching regression model assumes a total of two distinct regression models, one for each regime. Referring to Equation (1), the conditional mean in each regime, n, is assumed to adhere to the following specifications:
ϕt(n) = αn + Z’tδm,
where αn and δm are regime-specific coefficients, while Z’t denotes the vector of regressor (the logarithmic first difference of a stock market index price).
This study adopts Baur and McDermott’s [2] framework to examine the safe haven and hedge properties of gold and Bitcoin due to arbitrariness of the threshold variable, qt, from Adekoya, Oliyide, and Oduyemi’s [46] proposed framework. Therefore, regime changes were examined following the framework proposed by Ardia, Bluteau, and Rüede [24].

3.3. Testing Presence of Regime Changes

The MSGARCH model is defined as follows:
yt|(st = k, It−1) ~ D(0, hk,t, ξk),
where:
  • yt denotes the Bitcoin daily log-return at time t;
  • st denotes the state variable;
  • k denotes the number of states;
  • It−1denotes the information set available up to t−1;
  • ξk is a vector of additional shape parameters;
  • hk,t is a time-varying conditional variance in regime k;
  • D(0, hk,t, ξk) is a continuous distribution with zero mean.
The asymmetric properties of the Bitcoin cycle can be identified by computing the expected duration for each state/regime [31]. The expected duration can be estimated by using the following formula:
E(D) = 1/(1 − pii),
where pii is the transition probability from state/regime i to state/regime i.
Symmetric GARCH(1,1) and asymmetric GJR(1,1) specifications for the conditional variance are considered and defined as Equation. Furthermore, (7) and (8), respectively, are as follows:
hk,t ≡ wk + αky2t−1 + βkhk,t−1
hk,t ≡ wk + (αk + γkΙyt−1 < 0})y2t−1 + βkhk,t−1),
where Ι denotes an indicator function.
Normal distribution was used, and up to two regimes were considered, leading to four models overall. This methodology aligns with Ardia, Bluteau, and Rüede’s [24] findings that the two-regime is preferable because it offers better fitting quality and model complexity than the single-regime counterpart while gains from the three-regime counterpart are attributed to normal distribution variability. The models were optimized using the maximum likelihood estimation (MLE), and the performances of the models were evaluated with Akaike’s Information Criteria (AIC) and Bayesian Information Criteria (BIC).
The prediction performance of MSGARCH and traditional single-regime models were also evaluated against the out-sample one-step-ahead VaR prediction. A total of 2490 daily observations from 18 September 2014 to 19 July 2021 were used, where a rolling window of 1500 log returns was backtested over 990 out-of-sample daily observations from October 27th, 2018, to July 19th, 2021. Bitcoin’s past two halving cycles suggest that each cycle would span four years (or 1460 days). Hence, a rolling window size of 1500 was used. The model parameters were updated every hundredth observation. The accuracy of the 5% VaR prediction was evaluated using conditional coverage (CC) test statistics and the Dynamic Quantile (DQ) test [24,47,48].

4. Results and Discussions

This section reports the findings using the methodology discussed in the previous section. The discussion is divided into two main subsections, Section 4.1 presents the results and discussion for Bitcoin and gold, while Section 4.2 report the findings of MSGARCH, and in-sample and out-of-sample analysis for the changes in Bitcoin price.

4.1. Bitcoin Safe Haven and Hedging Properties

The results and discussions are discussed in the following section. Section 4.1.1 discuss the descriptive statistics and the findings of the stationarity test, and Section 4.1.2 presents the hedge properties results for gold and Bitcoin.

4.1.1. Results for Descriptive Statistics and Stationarity Test

Daily prices for Bitcoin (BTC), gold (XAU), S&P500 (SPY), Nasdaq (NAS), and Dow Jones Index (DJI) from October 2017 to July 2021 were obtained. According to Table 2, all five assets have positive average returns during the designated period. Bitcoin has the highest return and the highest volatility, implying that its high risk (volatility) is met with high returns, consistent with [26]. Sharpe Ratio represents the trade-off between return and risk. Although Bitcoin’s high volatility is compensated with high returns, Bitcoin Sharpe Ratio showed that it does not provide the optimal risk-return trade-off during the designated period. All five assets are negatively skewed, indicating that Bitcoin, gold, and the US stock market are skewed towards positive returns during the period. ADF test shows that all datasets are stationary.

4.1.2. Safe Haven and Hedge Properties Test Findings and Results

The safe haven and hedge properties test results of Bitcoin and gold before and after the COVID-19 market crash are discussed here. By referring to Table 3, before the pandemic (October 2017 to February 2020), gold was a safe haven for the S&P500 and the Nasdaq and a strong hedge against all three stock indices. The estimates also indicated that gold is not a safe haven against the Dow Jones Index because the relationship between the two respective assets is positive during extreme market movements and c1 and c3, though the relationship is generally negative (c0). For a portfolio comprising all three US stock indices equally weighted, gold would be both a safe haven and a hedge toward the portfolio.
However, by referring to Table 4, this study found that gold did not exhibit safe haven and hedge properties against all three stock indices for the period after the COVID-19 market crash in March 2020. This result aligns with Akhtaruzzaman et al. [17] and can be explained by the change in the correlation between gold and the three US stock market indices before and after the COVID-19 market crash in March 2020.
Correlation can be a simple precursor toward a hedge asset’s safe haven and hedge properties (gold or Bitcoin). As per Baur and McDermott’s [2] model, safe haven and hedge properties are determined by the coefficients (relationship) between the asset and the hedged asset during normal and extreme downside market movements, as captured by the parameters c0, c1, c2, and c3. The discrepancy between the correlation and Baur and McDermott’s model [2] is due to measuring the relationship between the asset and hedge asset during extreme market movements. Correlation aggregates all market movements, while Baur and McDermott [2] separate the measurements for regular market movements (c0) and extreme downside market movements (c1,c2, and c3), which means that the relationship between the asset and hedge asset must also be zero or negative even during extreme negative market movements to be regarded as a safe haven and a hedge using Baur and McDermott’s [2] framework, where parameters c0, c1, c2, and c3 would be zero or negative if the hedge assets (gold and Bitcoin) have no or negative correlation to the assets (the three US stock indices) during normal and extreme market movements.
According to Table 5, gold is negatively correlated to the three US stock indices relative to Bitcoin, implying that gold could generally be an excellent safe haven and hedge. When the safe haven properties and hedge properties are scrutinized further using Baur and McDermott’s [2] model, gold is indeed a strong hedge against all three US stock indices and a safe haven against the S&P500 and NASDAQ. Although gold was negatively correlated to the Dow Jones index, gold was not a safe haven for the Dow Jones Index because the relationship between gold and the Dow Jones Index was not zero or negative during extreme movements (c1 and c3), even though it was generally negative (c0).
According to Table 6, gold’s negative correlation to the three US stock indices turned positive, implying that gold was unlikely to retain its safe haven and hedge properties. This implication was confirmed by Baur and McDermott’s [2] model’s test results. Table 5 and Table 6 indicate that Bitcoin was positively correlated to all three stock indices before and after the COVID-19 market crash, suggesting that Bitcoin is unlikely to exhibit safe haven or hedge properties against the US stock indices. This implication can also be confirmed by Baur and McDermott’s [2] model test results, where Bitcoin is neither a safe haven nor a hedge against the US stock market.
It is not surprising that Bitcoin failed to exhibit safe haven and hedge properties. This is because Baur and McDermott’s [2] model suggests that the relationship between the hedge asset (Bitcoin) price and an asset (stock index) should be negative to exhibit safe haven and hedge properties. However, the Bitcoin halving cycle suggests that Bitcoin price movement strictly follows specific sequences of events and not the stock market. Hence, there are instances when Bitcoin is positively or negatively correlated to the stock market as Bitcoin follows through its halving cycles. This explains Bitcoin’s time-varying safe haven and hedge properties reported by previous studies [15,16,17,18].

4.2. Presence of Regime Changes in Bitcoin Volatility

4.2.1. Descriptive Statistics and Stationarity Test for Bitcoin Price

The dataset used to test the regime changes in Bitcoin volatility extends from 18 September 2014 to 19 July 2021, because more data is required to conduct the rolling window one step ahead of VaR forecasting. Table 7 represents the descriptive statistics and stationarity tests for the daily log return of Bitcoin for the period from 18 September 2014 to 19 July 2021. The mean and median values are 0.167% and 0.19742%, respectively. The standard deviation is 3.96% or 75.65%, annually. Thus, similar to the values in Table 1, Bitcoin is moderately skewed towards positive returns during the designated period.

4.2.2. In-Sample and Out-of-Sample Analysis

Based on the Bitcoin halving cycle, this study expects the two-regime Markov-switching models to outperform their single-regime counterparts because each cycle consists of distinct stages, and each stage consists of a specific sequence of events. The distinctiveness between each stage suggests the presence of regime changes.
The in-sample analysis is considered by fitting the four models to Bitcoin’s complete historical data from 18 September 2014 to 19 July 2021. The goodness-of-fit of the models is evaluated using AIC and BIC. Table 8 shows the AIC and BIC of the four models. It can be seen that both the two-regime models offer better fitting quality and model complexity trade-offs than their single-regime counterparts for all specifications. Table 9 shows the parameter estimates of the best in-sample model, which is the two-regime Markov-switching GJR model. For comparison, the parameter estimates for the single-regime GJR model are also reported. The results showed that the positive leverage effect of the single-regime GJR and both regimes of the two-regime Markov-Switching GJR are positive, implying a negative correlation between volatility and Bitcoin returns [49,50].
The results in Table 9 showed the unconditional volatilities of the two-regime Markov-Switching GJR as 8.1% and 250%, suggesting that the regimes are associated with low and high unconditional volatilities, respectively.
However, the high volatility regime is not as persistent as the low volatility regime, with transition probabilities p11 and p22 at 0.8142 and 0.3526, respectively. The resulting expected duration for state/regime one and state/regime two is 5.382 days and 1.545 days, respectively. This implies that the relationship between the Bitcoin high volatility regime and the low volatility regime is asymmetric.
The persistence of the low volatility regime one is illustrated in Figure 6, where the smoothed probabilities P[st = k|It] for the low volatility and high volatility regimes are plotted.
The out-of-sample analysis is considered via the performance of the four models to forecast the one-day VaR. Table 10 reports the one-day ahead VaR results at 5% risk levels.
The results show that the single regime GJR failed the CC test at a 10% confidence level, while the null hypothesis of correct VaR forecasting for the two-regime cannot be rejected.
Overall, the Markov-switching GARCH models have the best in-sample performance and out-of-sample VaR forecasting performance. Furthermore, since the Markov-switching model can account for the structural breaks in GARCH, the Markov-switching GARCH model’s superior in-sample and out-of-sample performance suggest regime changes in Bitcoin volatility [24,25].
Although the results align with the expectations based on the Bitcoin halving cycle, the whole expectation was not realized. Due to the non-persistence of regime two illustrated in Figure 4, this study found that the regime changes are associated with low and high volatility rather than the distinct stages during the Bitcoin halving cycle.

5. Conclusions

This study introduces a unique perspective on the Bitcoin safe haven and hedge properties through Bitcoin’s decade-old halving cycle. This study showed that Bitcoin halving cycle might be able to explain the time-varying safe haven and hedge properties reported by previous studies [15,16,17,18], where time periods with safe haven and hedge properties might coincide with periods of negative correlation (as required by Baur and McDermott’s framework [2]). This might also be the reason Bitcoin failed to exhibit safe haven and hedge properties despite major industrial and institutional Bitcoin adoption and the fund outflow from gold into Bitcoin. Practically, this finding suggests that investors should not invest in Bitcoin for Bitcoin safe haven and hedge properties because time periods with safe haven and hedge properties might coincide with periods of negative correlation. On the other hand, this study provided additional evidence showing that gold also failed to exhibit safe haven and hedge properties after the pandemic; this aligns with the findings of past studies. One possible explanation for gold’s loss of safe haven and hedge properties is the funds’ outflow from gold-related ETFs during the pandemic. Since Bitcoin also failed to exhibit safe haven and hedge properties, Bitcoin has yet to displace gold as the new safe haven commodity.
As shown in this study, Bitcoin halving cycle is well-defined in terms of price volatility and timing and is also independent (not correlated) to the stock market. This violates one of the conditions required, proposed by Baur and McDermott [2], to exhibit safe haven and hedge properties, which are a negative correlation to the stock market. Therefore, in this respect, findings related to the safe haven and hedge properties of Bitcoin and gold may not extrapolate beyond the COVID-19 black-swan event and should be reinvestigated in the future.
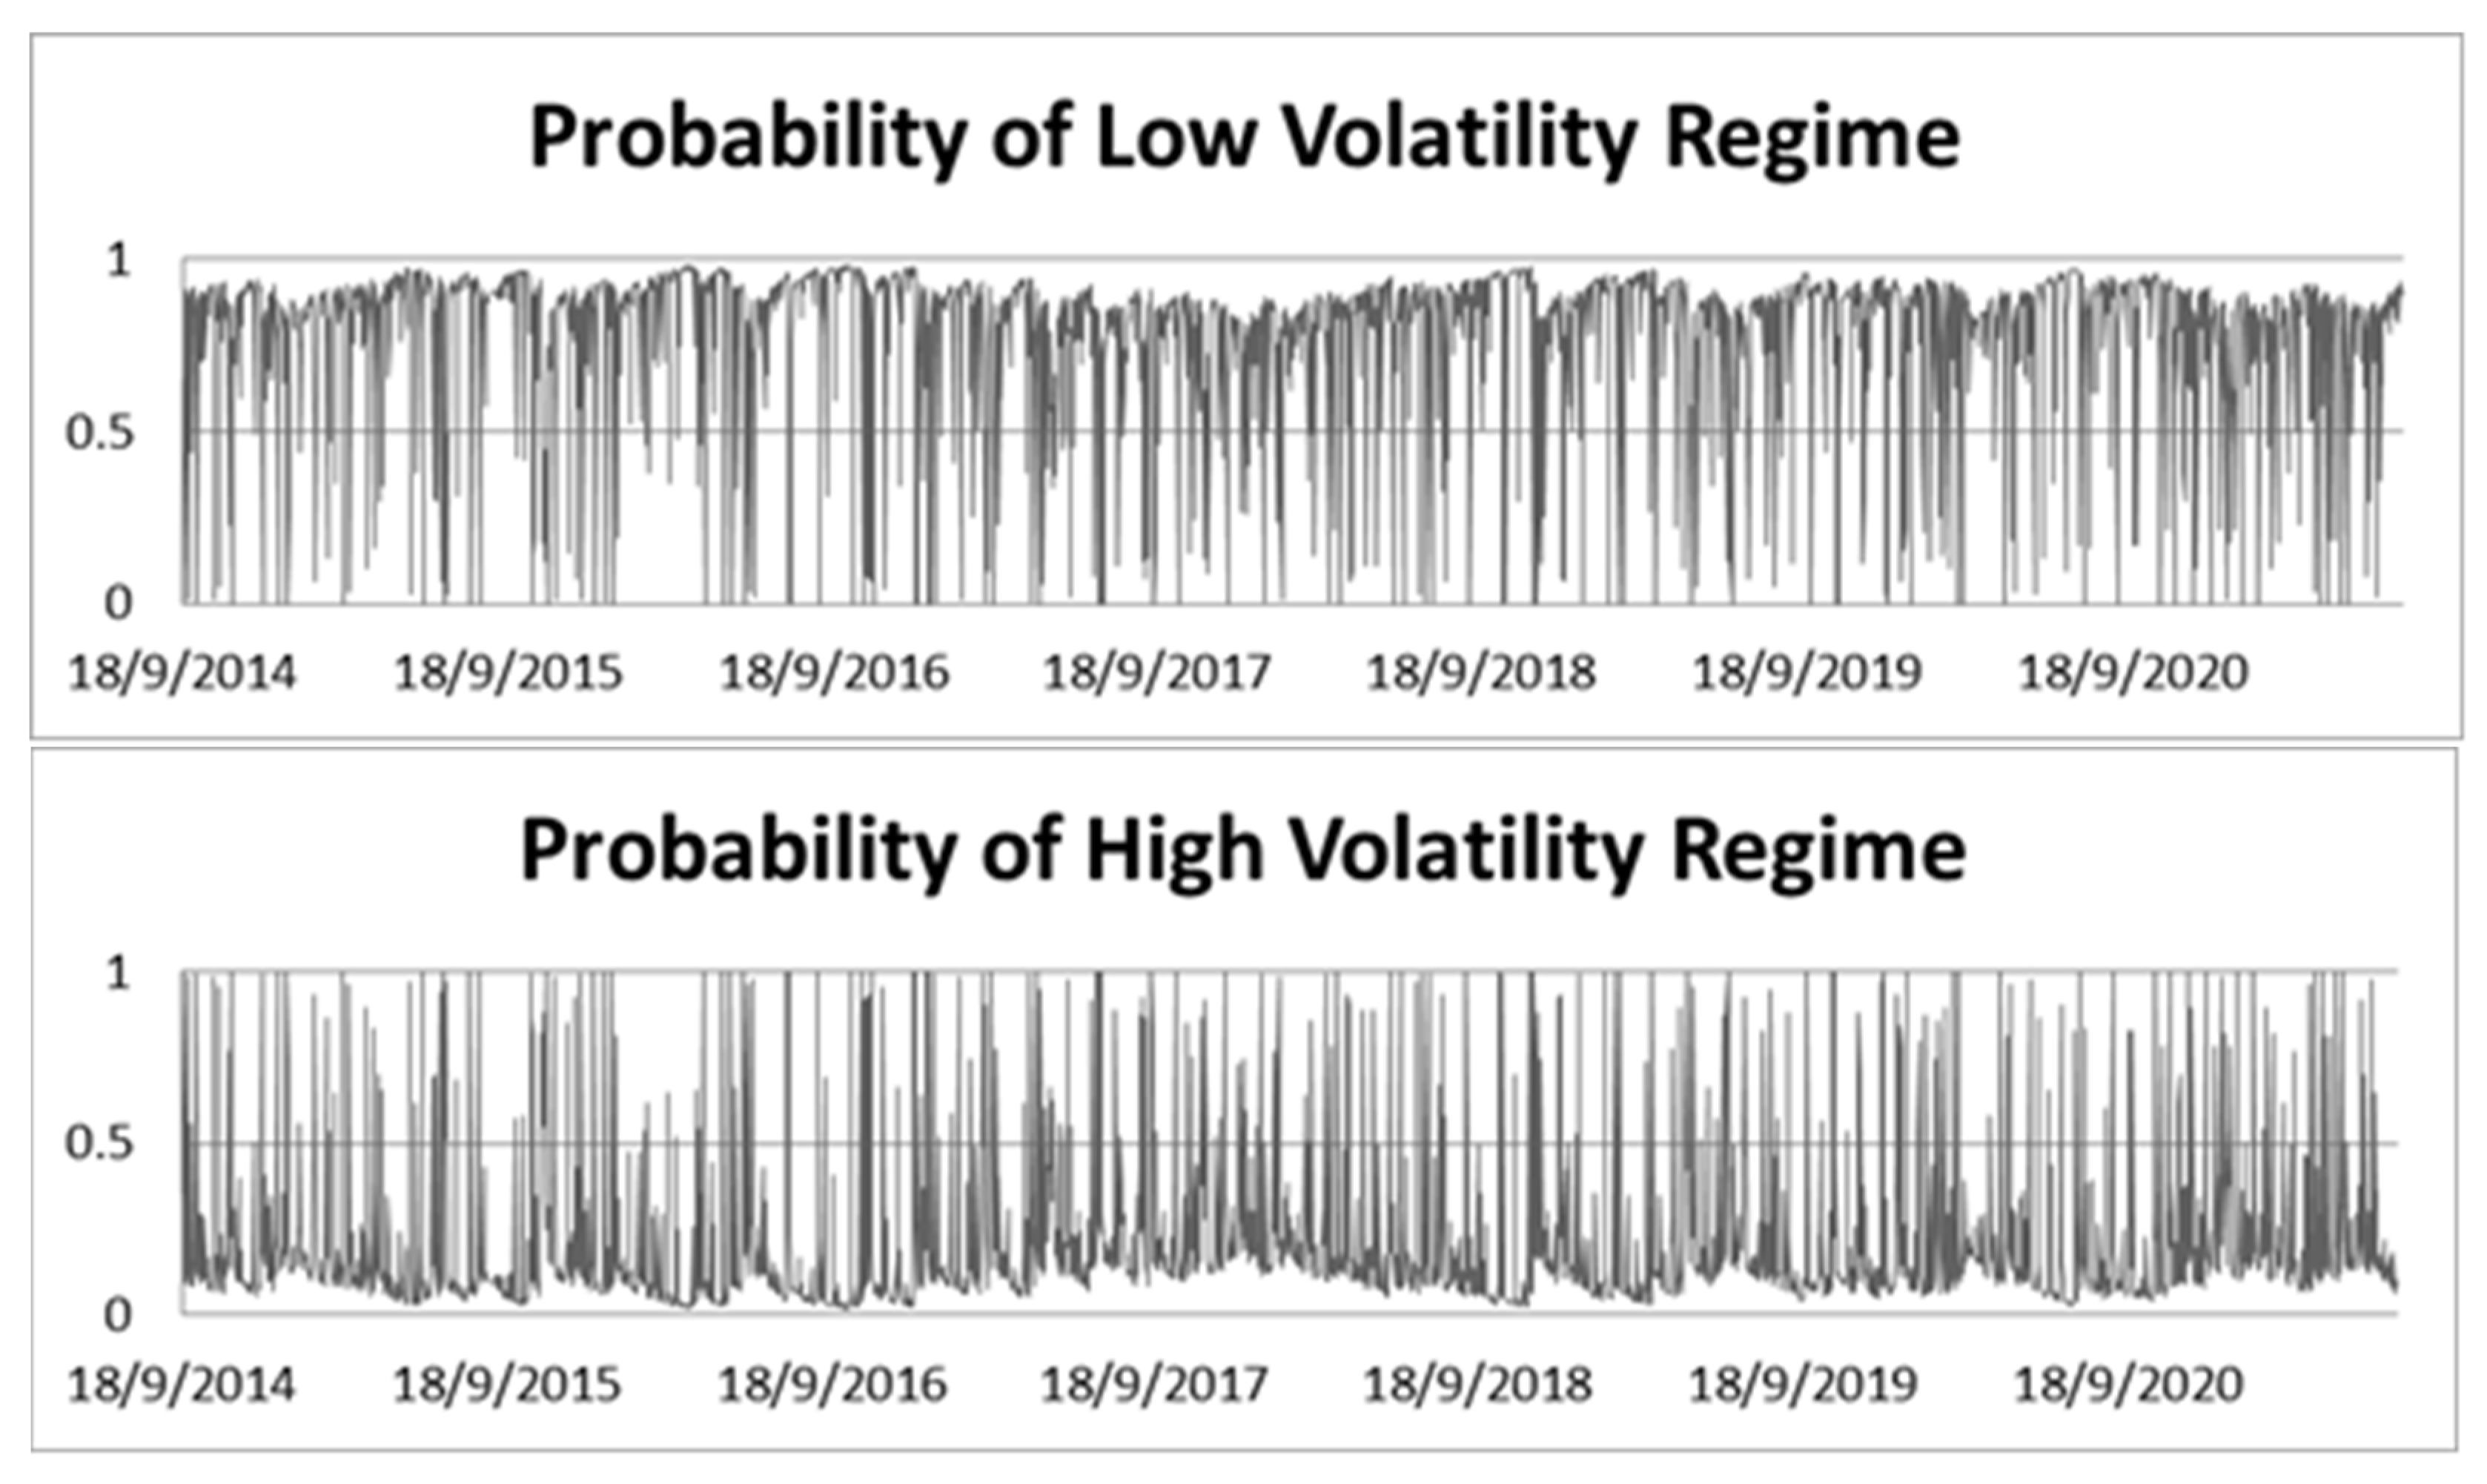
Findings related to regime changes in Bitcoin’s GARCH volatility dynamics could be extrapolated well beyond the COVID-19 black-swan event, as this study is consistent with the findings from past studies before the COVID-19 pandemic. This study found that regimes do exist in Bitcoin’s GARCH volatility dynamics through the pandemic. Therefore, the Markov-switching model remains recommended over its single-regime counterparts with low and high volatility periods rather than the distinct stages of a Bitcoin halving cycle. Moreover, the relationship between low and high volatility regimes are asymmetric. Future studies could consider using more recent techniques to improve the robustness of the safe haven and hedge properties framework [2] and regime change models [24] to better address Bitcoin’s time-varying properties. We also recommend future studies revisit Bitcoin safe haven and hedge properties in the future as continued industrial and institutional adoption may break Bitcoin’s decade-old halving cycle.

Author Contributions

J.Y.-L.C. investigated the ideas, and reviewed the systems and methods; J.Y.-L.C. provided the survey studies and methods; J.Y.-L.C. conceived of the presented ideas and wrote the manuscript with support from S.W.P., S.Y.P., W.K.C. and Y.-L.C.; S.W.P., S.Y.P., W.K.C. and Y.-L.C. provided the suggestions on the experimental setup and the analytical results; J.Y.-L.C. and S.W.P. provided the suggestions on the research ideas, analytical results, and wrote the manuscript; S.W.P. and Y.-L.C. provided funding supports and wrote the manuscript. All authors have read and agreed to the published version of the manuscript.

Funding

The author(s) disclosed receipt of the following financial support for this research, authorship, and/or publication of this article: this research was funded by the Fundamental Research Grant Scheme (FRGS) provided by the Ministry of Higher Education, Malaysia, Grant number FRGS/1/2019/STG06/UM/02/9. This work was also funded by the National Science and Technology Council in Taiwan, under grant numbers MOST-109-2628-E-027-004–MY3, MOST-111-2218-E-027-003, and MOST-110-2622-8-027-006, and also supported by the Ministry of Education of Taiwan under Official Document No. 1112303249 entitled “The study of artificial intelligence and advanced semiconductor manufacturing for female STEM talent education and industry–university value-added cooperation pro-motion”.

Institutional Review Board Statement

Not applicable.

Informed Consent Statement

Not applicable.

Data Availability Statement

There are no data applicable to this study.

Conflicts of Interest

The authors declare no conflict of interest.

References

  1. Meynkhard, A. Fair market value of bitcoin: Halving effect. Invest. Manag. Financ. Innov. 2019, 16, 72–85. [Google Scholar] [CrossRef] [Green Version]
  2. Baur, D.G.; McDermott, T.K. Is gold a safe haven? International evidence. J. Bank. Financ. 2010, 34, 1886–1898. [Google Scholar] [CrossRef]
  3. Kharpal, A. After a Bitcoin Crackdown, China Now Calls It an ‘Investment Alternative’ in a Significant Shift in Tone. Available online: https://www.cnbc.com/2021/04/19/china-calls-bitcoin-an-investment-alternative-marking-shift-in-tone.html (accessed on 30 September 2022).
  4. Stankiewicz, K. BlackRock’s Rick Rieder Says the World’s Largest Asset Manager Has ‘Started to Dabble’ in Bitcoin. Available online: https://www.cnbc.com/2021/02/17/blackrock-has-started-to-dabble-in-bitcoin-says-rick-rieder.html (accessed on 30 September 2022).
  5. CoinBase. Shareholder Letter. Available online: https://www.sec.gov/Archives/edgar/data/1679788/000167978821000005/q121shareholderletter.htm (accessed on 30 September 2022).
  6. Figueras, V. Bitcoin Price Prediction: $400,000 Possible If This Happens, Ark CEO Reveals. Available online: https://www.ibtimes.com/bitcoin-price-prediction-400000-possible-if-happens-ark-ceo-reveals-3143300 (accessed on 2 November 2021).
  7. Su, C.-W.; Qin, M.; Tao, R.; Zhang, X. Is the status of gold threatened by Bitcoin? Econ. Res.-Ekon. Istraživanja 2020, 33, 420–437. [Google Scholar] [CrossRef]
  8. Chang, B.H.; Rajput, S.K.O.; Ahmed, P.; Hayat, Z. Does gold act as a hedge or a safe haven? Evidence from Pakistan. Pak. Dev. Rev. 2020, 59, 69–80. [Google Scholar] [CrossRef]
  9. Lin, F.-L.; Yang, S.-Y.; Marsh, T.; Chen, Y.-F. Stock and bond return relations and stock market uncertainty: Evidence from wavelet analysis. Int. Rev. Econ. Financ. 2018, 55, 285–294. [Google Scholar] [CrossRef]
  10. Phoong, S.W.; Sek, S.K. A Markov switching vector error correction model on oil price and gold price effect on stock market returns. Inf. Manag. Bus. Rev. 2013, 5, 331–336. [Google Scholar] [CrossRef] [Green Version]
  11. Baur, D.G.; Hong, K.; Lee, A.D. Bitcoin: Medium of exchange or speculative assets? J. Int. Financ. Mark. Inst. Money 2018, 54, 177–189. [Google Scholar] [CrossRef]
  12. Klein, T.; Thu, H.P.; Walther, T. Bitcoin is not the New Gold–A comparison of volatility, correlation, and portfolio performance. Int. Rev. Financ. Anal. 2018, 59, 105–116. [Google Scholar] [CrossRef]
  13. Gkillas, K.; Longin, F. Is Bitcoin the new digital gold? Evidence from extreme price movements in financial markets. In Evidence From Extreme Price Movements in Financial Markets; 2018; Available online: https://papers.ssrn.com/sol3/papers.cfm?abstract_id=3245571 (accessed on 30 September 2022).
  14. EBouri, E.; Molnár, P.; Azzi, G.; Roubaud, D.; Hagfors, L.I. On the hedge and safe haven properties of Bitcoin: Is it really more than a diversifier? Financ. Res. Lett. 2017, 20, 192–198. [Google Scholar]
  15. Iqbal, J. Does gold hedge stock market, inflation and exchange rate risks? An econometric investigation. Int. Rev. Econ. Financ. 2017, 48, 1–17. [Google Scholar] [CrossRef]
  16. Chkili, W. Dynamic correlations and hedging effectiveness between gold and stock markets: Evidence for BRICS countries. Res. Int. Bus. Financ. 2016, 38, 22–34. [Google Scholar] [CrossRef]
  17. Akhtaruzzaman, M.; Boubaker, S.; Lucey, B.M.; Sensoy, A. Is gold a hedge or safe haven asset during COVID–19 crisis? Econ. Model. 2020, 102, 105588. [Google Scholar] [CrossRef]
  18. Thampanya, N.; Nasir, M.A.; Huynh, T.L.D. Asymmetric correlation and hedging effectiveness of gold & cryptocurrencies: From pre-industrial to the 4th industrial revolution✰. Technol. Forecast. Soc. Chang. 2020, 159, 120195. [Google Scholar] [PubMed]
  19. Spence, E. JPMorgan Says Gold Will Suffer for Years Because of Bitcoin. Available online: https://www.bloomberg.com/news/articles/2020-12-09/jpmorgan-says-gold-will-suffer-for-years-because-of-bitcoin (accessed on 30 September 2022).
  20. Agosto, A.; Cafferata, A. Financial Bubbles: A Study of Co-Explosivity in the Cryptocurrency Market. Risks 2020, 8, 34. [Google Scholar] [CrossRef] [Green Version]
  21. Corbet, S.; Meegan, A.; Larkin, C.; Lucey, B.; Yarovaya, L. Exploring the dynamic relationships between cryptocurrencies and other financial assets. Econ. Lett. 2018, 165, 28–34. [Google Scholar] [CrossRef] [Green Version]
  22. Yi, S.; Xu, Z.; Wang, G.-J. Volatility connectedness in the cryptocurrency market: Is Bitcoin a dominant cryptocurrency? Int. Rev. Financ. Anal. 2018, 60, 98–114. [Google Scholar] [CrossRef]
  23. Giudici, P.; Abu-Hashish, I. What determines bitcoin exchange prices? A network VAR approach. Financ. Res. Lett. 2019, 28, 309–318. [Google Scholar] [CrossRef]
  24. Ardia, D.; Bluteau, K.; Rüede, M. Regime changes in Bitcoin GARCH volatility dynamics. Financ. Res. Lett. 2019, 29, 266–271. [Google Scholar] [CrossRef]
  25. Maciel, L. Cryptocurrencies value-at-risk and expected shortfall: Do regime-switching volatility models improve forecasting? Int. J. Financ. Econ. 2020, 26, 4840–4855. [Google Scholar] [CrossRef]
  26. Shahzad, S.J.H.; Bouri, E.; Roubaud, D.; Kristoufek, L. Safe haven, hedge and diversification for G7 stock markets: Gold versus bitcoin. Econ. Model. 2020, 87, 212–224. [Google Scholar] [CrossRef]
  27. Spence, E. JPMorgan Says Gold Will Suffer for Years Because of Bitcoin. Available online: https://www.bnnbloomberg.ca/jpmorgan-says-gold-will-suffer-for-years-because-of-bitcoin-1.1533933 (accessed on 30 September 2022).
  28. Bradbury, D. The problem with Bitcoin. Comput. Fraud. Secur. 2013, 2013, 5–8. [Google Scholar] [CrossRef]
  29. Conti, M.; Kumar, E.S.; Lal, C.; Ruj, S. A survey on security and privacy issues of bitcoin. IEEE Commun. Surv. Tutor. 2018, 20, 3416–3452. [Google Scholar] [CrossRef] [Green Version]
  30. Zaghloul, E.; Li, T.; Mutka, M.W.; Ren, J. Bitcoin and blockchain: Security and privacy. IEEE Internet Things J. 2020, 7, 10288–10313. [Google Scholar] [CrossRef]
  31. Phoong, S.W.; Phoong, S.Y.; Phoong, K.H. Analysis of structural changes in financial datasets using the breakpoint test and the Markov switching model. Symmetry 2020, 12, 401. [Google Scholar] [CrossRef] [Green Version]
  32. Beckmann, J.; Berger, T.; Czudaj, R. Does gold act as a hedge or a safe haven for stocks? A smooth transition approach. Econ. Model. 2015, 48, 16–24. [Google Scholar] [CrossRef] [Green Version]
  33. Chowdhury, A. Is Bitcoin the “Paris Hilton” of the currency world? Or are the early investors onto something that will make them rich? J. Invest. 2016, 25, 64–72. [Google Scholar] [CrossRef] [Green Version]
  34. Dyhrberg, A.H. Bitcoin, gold and the dollar—A GARCH volatility analysis. Financ. Res. Lett. 2016, 16, 85–92. [Google Scholar] [CrossRef] [Green Version]
  35. Dai, Z.; Zhu, H.; Zhang, X. Dynamic spillover effects and portfolio strategies between crude oil, gold and Chinese stock markets related to new energy vehicle. Energy Econ. 2022, 109, 105959. [Google Scholar] [CrossRef]
  36. Hu, Y.; Ni, J.; Wen, L. A hybrid deep learning approach by integrating LSTM-ANN networks with GARCH model for copper price volatility prediction. Phys. A Stat. Mech. Its Appl. 2020, 557, 124907. [Google Scholar] [CrossRef]
  37. Chan, J.Y.-L.; Leow, S.M.H.; Bea, K.T.; Cheng, W.K.; Phoong, S.W.; Hong, Z.-W.; Lin, J.-M.; Chen, Y.-L. A Correlation-Embedded Attention Module to Mitigate Multicollinearity: An Algorithmic Trading Application. Mathematics 2022, 10, 1231. [Google Scholar] [CrossRef]
  38. Chan, J.Y.-L.; Leow, S.M.H.; Bea, K.T.; Cheng, W.K.; Phoong, S.W.; Hong, Z.-W.; Chen, Y.-L. Mitigating the Multicollinearity Problem and Its Machine Learning Approach: A Review. Mathematics 2022, 10, 1283. [Google Scholar] [CrossRef]
  39. Liu, W.; Semeyutin, A.; Lau, C.K.M.; Gozgor, G. Forecasting Value-at-Risk of Cryptocurrencies with RiskMetrics type models. Res. Int. Bus. Financ. 2020, 54, 101259. [Google Scholar] [CrossRef]
  40. Philippe, J. Value at Risk: The New Benchmark for Managing Financial Risk; McGraw-Hill: New York, NY, USA, 2001. [Google Scholar]
  41. Ardia, D.; Bluteau, K.; Boudt, K.; Catania, L. Forecasting risk with Markov-switching GARCH models: A large-scale performance study. Int. J. Forecast. 2018, 34, 733–747. [Google Scholar] [CrossRef]
  42. Emenogu, N.G.; Adenomon, M.O.; Nweze, N.O. On the volatility of daily stock returns of Total Nigeria Plc: Evidence from GARCH models, value-at-risk and backtesting. Financ. Innov. 2020, 6, 18. [Google Scholar] [CrossRef]
  43. Krause, A. Exploring the limitations of value at risk: How good is it in practice? J. Risk Financ. 2003, 4, 19–28. [Google Scholar] [CrossRef] [Green Version]
  44. Lamoureux, C.G.; Lastrapes, W.D. Persistence in variance, structural change, and the GARCH model. J. Bus. Econ. Stat. 1990, 8, 225–234. [Google Scholar]
  45. The 2022 Global Crypto Adoption Index: Emerging Markets Lead in Grassroots Adoption, China Remains Active Despite Ban, and Crypto Fundamentals Appear Healthy. Available online: https://blog.chainalysis.com/reports/2022-global-crypto-adoption-index/ (accessed on 30 September 2022).
  46. Adekoya, O.B.; Oliyide, J.A.; Oduyemi, G.O. How COVID-19 upturns the hedging potentials of gold against oil and stock markets risks: Nonlinear evidences through threshold regression and markov-regime switching models. Resour. Policy 2020, 70, 101926. [Google Scholar] [CrossRef]
  47. Christoffersen, P.F. Evaluating interval forecasts. Int. Econ. Rev. 1998, 39, 841–862. [Google Scholar] [CrossRef]
  48. Engle, R.F.; Manganelli, S. CAViaR: Conditional autoregressive value at risk by regression quantiles. J. Bus. Econ. Stat. 2004, 22, 367–381. [Google Scholar] [CrossRef]
  49. Ait-Sahalia, Y.; Fan, J.; Li, Y. The leverage effect puzzle: Disentangling sources of bias at high frequency. J. Financ. Econ. 2013, 109, 224–249. [Google Scholar] [CrossRef] [Green Version]
  50. de Sousa Filho, F.; Silva, J.; Bertella, M.; Brigatti, E. The leverage effect and other stylized facts displayed by Bitcoin returns. Braz. J. Phys. 2021, 51, 576–586. [Google Scholar] [CrossRef]
Figure 1. The Bitcoin Halving Cycle. Figure 1 represents a log-scale weekly candlestick chart of the Bitcoin price and illustrates the consistent occurrence of the 3 distinct phases (bull market, bear market, recovery phase) during each cycle. The green box represents the bull market, the red box represents the bear market, and the blue box represents the recovery phase. The first halving cycle occurred on 28 November 2012. The second halving cycle occurred on 9 July 2016. The third halving cycle occurred on 11 May 2020. The start of each halving cycle is indicated by a vertical line marking the date of the beginning of the respective weeks, as Figure 1 is a weekly chart.
Mathematics 11 00698 g001
Figure 2. The first 4 sequences of the 2014 bear market during the Bitcoin 2012–2016 halving cycle. The Bitcoin price reached a historical all-time high of $1160. A double top reversal pattern first occurred and indicated a potential reversal, followed by a 50% crash to $550. The Bitcoin price recovered back to 20% away from the historical all-time high ($1000) before making a 70% crash away from the historical all-time high ($340).
Mathematics 11 00698 g002
Figure 3. The 5th sequence of the 2014 bear market during the Bitcoin 2012–2016 halving cycle. The Bitcoin price finally bottomed at $200 (85% away from the historical all-time high) before entering the recovery phase.
Mathematics 11 00698 g003
Figure 4. The first 4 sequences of the 2017 bear market during the Bitcoin 2016–2020 halving cycle. During this cycle, the Bitcoin price reached a new all-time high of $20,000 before entering the bear market. Figure 4 highlights 4 out of 5 primary sequences of events that are similar to Figure 2. A reversal pattern was first indicated at the new all-time high of $20,000. Then, Bitcoin suffered an approximately 50% crash to $11,000. The Bitcoin price recovered back to approximately 20% away from the historical all-time high ($17,000) before making a 70% crash away from the historical all-time high down to $6000.
Mathematics 11 00698 g004
Figure 5. The 5th sequence of the 2017 bear market during the Bitcoin 2016–2020 halving cycle. Similar to Figure 3, the Bitcoin price ended the bear market by bottoming at $3100 (approximately 85% away from the historical all-time high) before entering the recovery phase again.
Mathematics 11 00698 g005
Figure 6. Smoothed Probabilities for two-regime GJR model.
Mathematics 11 00698 g006
Table 1. Safe Haven and Hedge Properties Benchmark.
ConditionConclusion
If c1, c2 or c3
is significantly different from 0
There is a non-linear relationship between the hedged asset and the stock index.
If c0, c1, c2 and c3 are less than or equal to 0 The hedge asset is a weak safe haven
If c1, c2 and c3 are less than 0 and is statistically significantThe hedge asset is a strong safe haven
If c0 is zero, and the sum of c1, c2, and c3 is less than 0 and c0The hedge asset is a weak hedge
If c0 is less than zero, and the sum of c1, c2, and c3 is less than 0 and c0The hedge asset is a strong hedge
Table 2. Descriptive Statistics and stationarity test for gold, Bitcoin, and 3 US stock indices. *** represents 99% confidence level.
AssetsNumber of ObservationsMeanStd DevADF
Statistics
SkewnessKurtosisSharpe Ratio
BTC9550.25.064−16.15 ***−0.98110.5680.039
XAU9550.0370.877−16.13 ***−0.6694.7240.042
SPY9550.0561.357−9.07 ***−1.07418.2450.041
NAS9550.0941.577−9.88 ***−0.7549.780.06
DJI9550.0451.427−9.39 ***−1.09820.6090.032
Table 3. Estimated Parameters for Safe Haven and Hedge Testing for gold and Bitcoin from October 2017 to February 2020. ** represents 95% confidence level.
GoldBitcoin
Hedge (c0)0.1 (c1)0.05 (c2)0.01 (c3)Hedge (c0)0.1 (c1)0.05 (c2)0.01 (c3)
S&P500−0.322−0.154−0.185 **−0.078−0.024−0.676−0.00730.7462
NASDAQ−0.0435−0.082−0.0823−0.04710.0478−0.444−0.1330.4
Dow Jones Index−0.06930.064−0.195 **0.025160.01−0.24−0.280.87
US Market Portfolio−0.0501−0.13−0.113−0.0510.121−1.01−0.270.65
Table 4. Estimated Parameters for Safe Haven and Hedge Testing for gold and Bitcoin from October 2017 to February 2021. * Represents 90% confidence level; ** represents 95% confidence level; *** represents 99% confidence level.
GoldBitcoin
Hedge (c0)0.1 (c1)0.05 (c2)0.01 (c3)Hedge (c0)0.1 (c1)0.05 (c2)0.01 (c3)
S&P5000.069 **0.1130.201 ***0.0370.563 ***0.6520.2971.162 ***
NASDAQ0.052 **0.0130.096 *0.0590.473 ***0.4970.1171.244 ***
Dow Jones Index0.0270.0530.192 ***0.0780.418 **0.1240.3151.152 ***
US Market Portfolio0.074 **0.25 ***0.143 **0.0310.581 ***1.056 **0.211.112 ***
Table 5. Correlation Table for the period October 2017 to February 2020.
SPYNASDJI
BTC0.0095890.0082110.016471
XAU−0.14366−0.13702−0.14673
Table 6. Correlation Table for the Period from October 2017 to July 2021.
SPYNASDJI
BTC0.2140.2070.204
XAU0.0580.0850.039
Table 7. Descriptive Statistics and stationarity test for Bitcoin.
StatisticsValue
Observations2490
Mean (%)0.167
Median (%)0.19742
Standard Deviation (%)3.96
ADF p-value0.01
Skewness−0.824
Kurtosis11.624
Sharpe Ratio0.042
VaR (5%) (%)11.35
JB p-value<0.01
Table 8. Goodness-of-fit.
AICBIC
Single-regime
GARCH−9453−9436
GJR−9461−9437
Two-regime
GARCH−10,172−10,126
GJR−10,184−10,126
Table 9. Parameter Estimate.
Single Regime2-Regime
Regime k = 1
w10.00010
a10.11430.459
y10.06050.0001
b10.82430.594
UV193.74%8.10%
Regime k = 2
w2 0.008
a2 0.08
y2 0.2704
b2 0.7388
UV2 250%
Table 10. p-values for the CC test and DQ test for the one-day ahead 5% VaR.
CC-TestDQ-Test
Single-Regime
GJR0.1150.552
GARCH0.05760.42
2-Regime
GJR0.430.94
GARCH0.3130.913
Disclaimer/Publisher’s Note: The statements, opinions and data contained in all publications are solely those of the individual author(s) and contributor(s) and not of MDPI and/or the editor(s). MDPI and/or the editor(s) disclaim responsibility for any injury to people or property resulting from any ideas, methods, instructions or products referred to in the content.

