Abstract
Our study commemorates this event by presenting a retrospective of the publications related to the use of mathematical tools for the analysis of economic, ecological, and environmental phenomena. We analyzed 1257 scientific publications using bibliometric techniques to examine the most productive and influential authors and their contributions in the economic, ecological, and environmental fields. Co-authorship among the top authors and countries, co-occurrence of the keywords, bibliographic coupling of the documents and authors, and author co-citation were analyzed by applying network analysis techniques using VOSviewer software, identifying the intellectual structure of the research and the collaborative networks in the fields. The results show that mathematics has grown impressively in terms of publication and citation. The contributions come from all over the world, but the majority are from the People’s Republic of China and Spain. The results also show themes and trends in the economic, environmental, and ecological fields and a predominant use of mathematical tools in optimization processes in order to rigorously substantiate the decisions of investors and policymakers. Thus, our study offers support for any researcher to understand the current state of the art and develop a comprehensive understanding of journal publications.
MSC:
00A05
1. Introduction
In recent years, bibliometric analysis has become increasingly popular in economic research, as it is considered a convenient approach to identify trends in the performance of journals or articles, the intellectual structure of a field in the existing literature, or patterns of collaboration [1,2]. The popularity of bibliometric analysis is due to the availability of numerous databases (Web of Science, Scopus, Direct Science, etc.) and numerous software that allow the analysis of large volumes of data (VOSviewer, Leximancer, HistCite, etc.). Thus, it has been used in various areas such as corporate social responsibility [3], strategic management [4], the impact of COVID-19 [5], medicine [6,7] and corporate universities [8]. To the best of our knowledge, no article has bibliometrically studied the publications related to the use of mathematical tools for the analysis of economic, ecological, and environmental phenomena. To fill this gap, we chose the mathematics journal (ISSN 2227-7390) among the Web of Science indexed journals. Mathematics is a peer-reviewed, open access journal, that publishes high-quality research in all areas of pure and applied mathematics. Furthermore, this journal has published numerous economic research articles over time, having opened more than 50 special issues in 2022 related to the economic area.
The first issue of the journal was published in March 2013. Since then, it has published more than 10,000 papers from more than 16,800 authors. Over the years, the journal has received high ratings according to various qualitative and quantitative measures. Thus, Mathematics secured its place at 21/332 (Q1) in the mathematics category. This ranking claims that the journal publishes rigorous, high-quality papers. According to Clarivate Analytics, the journal’s impact factor in 2021 was 2592, meaning that the articles published in 2019 and 2020 received an average of 2592 citations in 2021 alone from the sources that Clarivate Analytics indexes. According to Scopus, the journal has a CiteScore of 2.9 and a Source Normalized Impact per Paper (SNIP) of 1.162, which means that the articles published between 2018 and 2021 received an average of 2.9 citations in 2021 alone, which is 1.162 times the average citations articles in its field receive. The journal has an h-index of 43, which means that at least 43 of the journal’s publications have been cited 43 times. These values indicate the journal’s high reputation among researchers.
The year 2022 marks the 10th anniversary of Mathematics. On this occasion, our study aims to provide a bibliographic overview of the journal. Such retrospectives can be found in the literature. For example, [9] provided a comprehensive overview of the forty years of the International Journal of Information Management. [10] presented a synthesis of forty years of the Journal of Futures Markets. [11] summarized the forty-five years of the Journal of Business Research. Our study presents an in-depth analysis of the publication trends and citation structure of articles published in the Mathematics that are related to the analysis of economic, ecological, and environmental phenomena. The most prolific authors on the subject and their affiliated countries are considered. It also traces the major themes/topics discussed in the selected scientific publications, classifies them into clusters, and provides an overview of their content.
Our analysis contributes to the literature by: (1) presenting an overview of the main current research in which mathematical models offer possibilities for the analysis of economic, ecological, and environmental phenomena; (2) highlighting the main articles, authors, countries, and networks in this field by reporting to the journal Mathematics; and (3) identifying the main directions in which mathematical tools can be used appropriately and rigorously for economic, environmental, and ecological research.
The rest of the paper is structured as follows. The paper begins with a description of the methodology and the research context, and then we unveil and discuss the results obtained. Finally, we draw conclusions, highlight limitations, and outline future research directions.
2. Materials and Methods
The source of scientific publications included in the analysis has been the academic platform Web of Science, accessed on 9 November 2022. Regarding the topic, the following keywords have been considered relevant: “mathematics economic*”, “mathematics environment*”, and “mathematics ecologic*”. The total sample consists of 1257 (472, 738, 47) scientific publications, the studies being conducted by 4118 authors.
In the first stage, a descriptive bibliometric analysis has been conducted, highlighting yearly trends in publications, the most relevant papers, article and author productivity levels, the most prolific authors and countries, and the most cited documents.
In the next stage, a bibliometric analysis based on network analysis has been carried out. This technique reveals aspects related to the intellectual and the social structures of the fields [12,13].
To investigate the flow of scientific and technical information and to identify a subject area profile for a given research, the co-word analysis technique was performed. Proposed by [14], “co-word analysis is a content analysis technique based on the assumption that the subject of a paper can be summarized in a number of key terms that reflect its core contents” [15]. The identification of a conceptual structure through co-word analysis [16,17] implies that words co-occur in documents if they are related. Knowledge domain visualizations by building a semantic map through co-word analysis ensure the understanding of cognitive structure [18] and describe the evolution and current state of the literature on the field [15]. In term co-occurrence analysis, the binary counting method was used, considering 10 the minimum number of occurrences of a term in document titles and abstracts. From the total of particular terms, those that met the threshold were selected. For each of these terms, a relevance score was calculated. Based on this score, the most relevant terms were selected. Furthermore, we designed a keywords co-occurrence analysis, determining the total strength of the co-occurrence links with other keywords and selecting those with the greatest total link strength. We built a network of themes and their relationships, considering that keywords are the central description of the research content. The links between occurring keywords reveal the focal interest of the research topic in the field.
Co-author analysis examines the collaborative networks that scholars create on scientific publications [19]. Co-authorship analyses by author and country were conducted in order to evaluate the link between researchers. The minimum number of documents for an author was 1, and for a country, it was 5. For each of the authors/countries, the total strength of the co-authorship links with other authors/countries was calculated. The authors/countries with the greatest total link strength were selected.
Two publications are bibliographically coupled if they both cite a third publication [20]. It is thus investigated if the bibliographic structure contains a set of properties that characterize the paper from which it derives. “Bibliographic coupling uses the number of references shared by two documents as a measure of the similarity between them” [21]. We conducted a bibliographic coupling analysis by documents and authors.
The co-citation is defined as the frequency with which two documents are cited together [22]. The more two items are cited together, the more their content is related. Co-citation analysis is used to evaluate the intellectual structure of different themes [23]. Co-citation analysis can be conducted at the level of authors and references, identifying key authors and articles and visualizing the intellectual structure of the topic. Using the scientific publications as its source, author co-citation analysis focuses on the intellectual links between authors, identifying a certain thematic similarity, and a high probability of the same research front [24]. By how frequently other writers cite their combined work, two authors are connected through author co-citations. A different perspective on a knowledge structure can be built using author co-citation patterns [25]. We performed an author co-citation, considering 20 the minimum number of citations for an author. For each of the authors, the total strength of the co-citation links with other authors was calculated. The authors with the greatest total link strength were selected.
The data were processed with VOSviewer software tool to construct and view Bibliometric maps.
3. Empirical Results and Discussion
3.1. Descriptive Analysis
The analysis of the scientific publications in Mathematics that address the studied topics reveals a preponderance of concerns for environmental (738), followed by economic (472), and then ecological (47) issues. Regarding the type of document, most are articles (1228), noting the existence of a number of 25 review articles and 4 editorial materials. On the structure of the topic, they are presented in Table 1.

Table 1.
Types of documents on the topic.
The most relevant papers concerning economic issues are those of Santos-Jaen et al. (2022), Owolabi et al. (2022), Shu et al. (2022), Shinkevich et al. (2022), Ayuda et al. (2022), Guo et al. (2022), Balash et al. (2021), Kovacs et al. (2021), Huang et al. (2021), and Cai et al. (2021), these addressing various topics (performance, industrial zones, export, business market profitability, economic risk, patent commercialization performance, and finance), in specific contexts (hotel, chemical industries, agriculture, COVID-19, etc.). Papers such as those of Arav et al. (2022), Ramirez-Carrasco et al. (2022), Trivedi et al. (2022), Qian and Cui (2022), Khan et al. (2022), Liu et al. (2022), Shinkevich et al. (2022), Gocheva-Ilieva et al. (2022), Riou et al. (2022), and Ainapure et al. (2022) are relevant in terms of environmental issues. Targeting ecological issues, the most relevant articles are those of Shinkevich et al. (2022), Carletti and Banerjee (2019), Gutierrez et al. (2022), Vakulenko and Grigoriev (2021), Uso-Domenech et al. (2019), Mondal et al. (2022), Oborny (2018), Yilanci et al. (2022), Abbas and Naji (2022), and Dyvak et al. (2020).
Research productivity, estimated through the number of scientific publications in Mathematics, per year per topic, is shown in Table 2. The trend line has been plotted in Figure 1, allowing the referral of the issues of interest and providing useful results for both researchers and decision-makers. It can be observed that there is an upward trend in publications, with most papers published in 2022. While the environmental topic is a growing concern in the authors’ approaches, the economic topic has decreased as a research objective. The ecological topic is kept at a low level in the research priorities.
Table 2.
Scientific publications per year per topic.
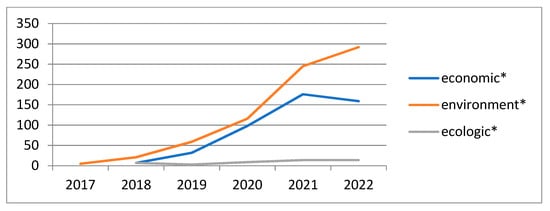
Figure 1.
Scientific publications trend.
Author productivity, calculated as number of articles per author, is relatively similar, with a higher value in the economic concerns: a total of 1467 authors presented a 0.3217 average productivity, contributing 472 scientific publications in the economic field over the period under study; 2495 authors conducted 738 studies concerning environmental topics, presenting an average productivity of 0.2958; 156 authors wrote 47 articles on ecological topics, with an average productivity of 0.3013. The authors with the most scientific publications on these topics in Mathematics, are presented in Table 3. Wang Chia-Nan (n = 20) and Sarkar Biswajit (n = 19) are the most prolific authors, addressing both economic and environmental issues. The authors’ focus is on the use of mathematical tools for solving economic and environmental problems, providing relevant benchmarks for decision-makers in the matter. The development of approaches by publishing several articles in the field ensures a superior quality of the research and a greater pertinence of the results.
Table 3.
Authors with the highest number of articles.
Regarding economic topics, Sarkar’s main concerns have targeted the efficiency of production processes. On this subject, a smart production process where the autonomation policy allows the system to manufacture a defect-free product was developed, determining the maximum profit and the optimal values for buffer inventory, production rate, selling price, and investment for autonomation [26,27]. Furthermore, a single-stage manufacturing method to make a perfect production system without defective items was formulated [28]. With reference to the perishable products with a maximum life span and price-dependent demand and trade credit, in order to maximize the vendor’s net profit, the optimum investment under preservation, sales price, and cycle time were calculated using the classical optimization algorithm [29]. Furthermore, a multi-product production process was introduced, based on the advertising- and price-dependent demands of products, in order to reduce the failure rate of the production system under the optimum energy consumption [30]. An important production factor is human capital. Sarkar identified worker’s cost of stress by developing a link between economic efficiency and working conditions enhancement, using a sequential quadratic programming to optimize the given nonlinear model for production planning [31]. Addressing the issue of credit policies under an imperfect quality environment, Sarkar and co-authors proposed a supply chain with customer-based two-level credit policies, demonstrating the benefit of shorter contracts, particularly with new retailers, over the expected total profit per unit time [32].
Correlating the economic issue with that of environmental protection, Sarkar analyzed the effects of preservation technology investment on waste generation in a two-echelon supply chain model. A model is proposed to optimize the preservation investment, the number of shipments, and the shipment quantity so that the total cost per unit time of the supply chain is minimized. At the same time, by increasing the lot size, the order cost is also reduced. Complementary to economic benefits, preservation leads to a reduction of solid waste from damaged products, with effects on environmental protection [33]. Furthermore, to address the negative environmental effects of corporate activities, joint inventory and pricing decisions were studied in a multi-echelon CLSC model that considered online to offline (O2O) business strategy. For an imperfect production process, the highest profit is generated when the defect rate follows a uniform distribution [34]. Furthermore, an imperfect manufacturing process produces defective products at an uncertain rate and is reworked to transform them into perfect quality products and reduce losses. Using the interactive Weighted Fuzzy Goal Programming (WFGP) approach can determine a sustainable lot size, reducing the conflict between economic performance and environmental protection [35].
The studies carried out by Wang Chia-Nan focus on economic and environmental issues. Using DEA Malmquist model, an analysis of the organizational performance measurement of the automakers was conducted, considering the relevant technical efficiency, technological progress, total factor productivity of global automobile manufacturers, and financial indicators (total assets, shareholder’s equity, cost of revenue, operating expenses, revenue, and net income) [36]. He assessed the operational efficiency of airport runway configurations considering specific input factors (number of runways, dimension of runways, and airport area) and output factors (annual number of flights and annual number of passengers), using the data envelopment analysis models Charnes, Cooper, and Rhodes (CCR), Banker, Charnes, and Cooper (BCC), Slacks-Based Measure (SBM), and Epsilon-Based Measure (EBM) [37]. Furthermore, he developed a two-stage data envelopment analysis model for measuring the performance efficiency, forecasting, and improving future performance for port industry, indicating that the determinants of growing productivity are the technical efficiency change indexes [38]. The performance of the bank sector was analyzed by a dynamic Slacks-Based Measure model in data envelopment analysis, considering assets, capitalization, and liabilities as inputs, revenue as output, and net interest income as a good link [39]. Regarding the supply chain network design problem, he developed a multi-objective mathematical model to design four-echelon intermodal multi-product perishable supply chain configuration, defining the optimization objective functions as minimizing costs, delivery time, emissions, and the supply-demand mismatch in time. The decisions are approached from a strategic perspective (the location, size of facilities, product flows, and workforce level), and from a tactical perspective (harvest time, delivery time, the delivery route, and mode of transport) [40]. Exploiting a hybrid multi-criteria method, which is fuzzy analytic hierarchy process (FAHP) and fuzzy vlsekriterijumska optimizacija i kompromisno resenje (FVIKOR), he proposed a model for evaluating and selecting the most efficient third-party logistics [41].
In the context of the industrial and manufacturing sector development, which involves high energy consumption, Wang Chia-Nan presented a multi-criterion decision-making model (MCDM) that implemented the grey analytic hierarchy process (G-AHP) method and the weighted aggregates sum product assessment (WASPAS) method for the selection of optimal renewable energy sources for the energy sector in Vietnam [42]. Considering the geographical conditions and that wind energy is a viable option, the author studying the selection of wind turbine suppliers as a complex and multi-criteria decision-making process in uncertain environmental conditions with incidents on the cost reduction of equipment safety and delivery to term, is proposing a fuzzy MCDM model [43]. Under the constraints imposed by sustainable development, companies must focus on issues related to the reduction of CO2 and toxic emissions, energy use and efficiency, waste generation, and worker health and safety. In this context, Wang Chia-Nan proposed a supplier selection model based on a hybrid multi-criterion decision-making model (MCDM) using a fuzzy analytic hierarchy process (FAHP) and green data envelopment analysis (GDEA) [44]. Furthermore, a stochastic multi-objective optimization model is proposed that aims both at production efficiency under uncertain conditions through the objective function that optimizes the amount of pending orders, machine operation time, and customer satisfaction, as well as ensuring sustainable development, through the correlation of three functions related to optimizing profits, emissions, and changing jobs [45].
The main concern of Tarasov VE is memory in economics, using fractional calculus, which is a theory of integrals, derivatives, sums, and differences of non-integer orders, to cure amnesia in economics [46]. Reviewing the problems and difficulties arising in the construction of fractional-dynamic analogs of standard models by using fractional calculus, Tarasov analyzed the effects of memory and non-locality, distributed lag, and scaling, and formulating rules (principles) for constructing fractional generalizations of standard models, which were described by differential equations of integer order, highlighting the importance of the derivability principle, the multiplicity principle, the solvability and correspondence principles, and the interpretability principle [47]. Generalizing the standard continuous-time model of Solow and Lucas, he proposed two non-linear models to study the influence of memory effects on the rate of economic growth when other parameters of the model are unchanged [48]. Furthermore, by a generalization of the standard Keynesian macroeconomic model, a mathematical model of economic growth with fading memory and continuous distribution of delay time was proposed [49]. In another study, he analyzed depreciation of a non-exponential type and simultaneously considered memory effects in economics by using the Prabhakar fractional derivatives and integrals [50].
Ref. [51] performed an analytical study of a system with multiple time scales to reveal a sequence of bifurcations that are responsible for the change in the system dynamics from a simple steady state and/or a limit cycle to canards and relaxation oscillations, considering it a more realistic description of ecological dynamics. Furthermore, given that demographic noise is simply the biological or ecological counterpart of intrinsic noise in genetic regulation, [52] proposed a technique to model and simulate demographic noise going backward from a deterministic continuous differential system to its underlying discrete stochastic process, based on the framework of chemical kinetics. Petrovskii Sergei and co-authors studied the movement pattern in the context of trapping, based on the Brownian motion and Levy walks, showing that this controversy can be more superficial than real if the problem is considered in the context of traps and that the whole “Levy or diffusion” debate is rather meaningless unless placed in a specific ecological context [53].
The first ten meso-topics with the most citations are presented in Table 4. The artificial intelligence and machine learning topic is the most cited meso-topic, highlighting its relevance in the study of economic, environmental, and ecological phenomena to identify real-world problems, measure and improve predictive performance, devise innovative solutions, and refine strategies through algorithmic decision-making. Furthermore, considering the approach to multidimensional problems, the numerical methods topic is one of the most cited meso-topics in this research context. Understanding the general trends and patterns requires the use of statistical methods. Regarding the content of the issue, the most cited meso-topics are economics, supply chain logistics, management, power systems electric vehicles and security systems.
Table 4.
Citation topics meso by topic.
The countries that have devoted most effort to publish in Mathematics are the People’s Republic of China, followed by Spain, Taiwan, Russia and South Korea (Table 5). China’s leading position in scientific production is not surprising. Previous studies have already shown that scientific production in China is growing impressively, and in 2018 the country was the largest producer of SCI-indexed original research articles [54]. However, what is particularly notable is the great effort made by Spain in this area.
Table 5.
The most productive countries.
The first five most cited articles in Mathematics, are presented by topic in Table 6, Table 7 and Table 8.
Table 6.
The first five most cited articles in Mathematics, on the topic economics*.
Table 7.
The first five most cited articles in Mathematics, on the topic environment*.
Table 8.
The first five most cited articles in Mathematics, on the topic ecologic*.
3.2. Term Co-occurrence
In order to identify the frequently used and highly connected terms in Mathematics related to these three fields of research, we carried out a term co-occurrence analysis.
Economic*
Of the 12540 terms, 236 meet the threshold, and the first 10 most relevant are presented in Table 9.
Table 9.
The first ten most relevant terms on the topic economic*.
It was found that the predominant use of mathematical tools in optimization processes was in areas with increased volatility, such as the stock market, in order to rigorously substantiate the decisions of investors and policymakers. Data envelopment analysis (DEA) represents the most relevant method in operations research and economics, allowing the identification of the best-practice frontier.
We used co-occurrence networks to extract and visualize the relationships between terms in Mathematics scientific publications (Figure 2).
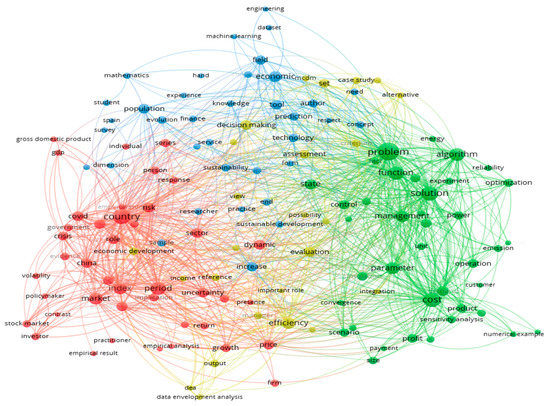
Figure 2.
Terms co-occurrence analysis through cartography analysis using VOSviewer (topic economic*).
Four clusters were identified: red (country, market, period, index, dynamic, sector, risk, uncertainty, gdp, investor, volatility, and stock market), green (problem, solution, algorithm, cost, function, parameter, management, state, optimization, control, and energy), blue (economic, population, tool, prediction, technology, and sustainability), and yellow (efficiency, evaluation, assessment, decision making, case study, and alternative).
Environment*
Of the 19,717 terms, 344 meet the threshold, and the first 10 most relevant are presented in Table 10.
Table 10.
The first ten most relevant terms on the topic environment*.
The terms with the highest co-occurrence reveal the importance of mathematics, technology, and education in solving environmental problems. The convolutional neural network (CNN) is the learning algorithm used in the environmental issues’ recognition, classification, segmentation, and identification of specific patterns.
In the co-occurrence network (Figure 3), four clusters were identified: red (algorithm, network, accuracy, field, state, feature, and limitation), green (decision, evaluation, set, criterium, property, case study, and decision making), blue (impact, cost, product, management, industry, emission, and supply chain), and yellow (learning, knowledge, student, and education).
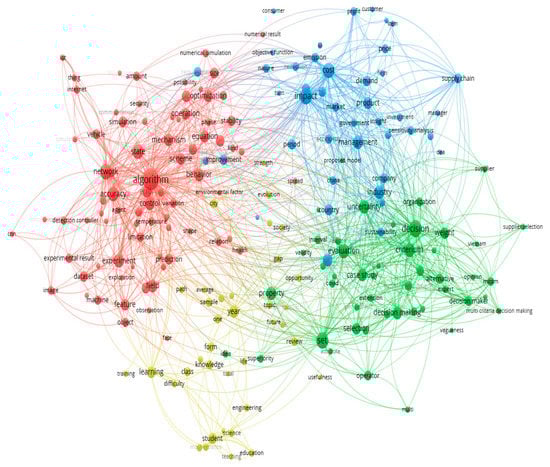
Figure 3.
Terms co-occurrence analysis through cartography analysis using VOSviewer (the topic environment*).
Ecologic*
Of the 1643 terms, 3 meet the threshold (Table 11).
Table 11.
The most relevant terms on the topic ecologic*.
With the exception of economic, the first terms according to relevance are not specific to the topic, which reveals the existence of a diversity of addressed issues without explicitly identifying a focus on specific themes.
3.3. Keywords Co-occurrence
To assess the presence, frequency of occurrence, and proximity of keywords across the papers in the fields of economy, environment, and ecology, in Mathematics, a co-occurrence analysis was conducted. Understanding the knowledge structure of these scientific fields required the achievement of a keyword co-occurrence network, which ensured the examination of the links between keywords, the mapping of the dynamics of the subject, and the identification of the core research topics.
Economic*
Considering the minimum number of occurrences for a keyword 5 among the 3302 keywords, 109 met the threshold, and the first 10 keywords with the greatest total link strength of the co-occurrence are presented in Table 12.
Table 12.
The keywords with the greatest total link strength of the co-occurrence (economic*).
Based on the pattern of co-occurrence of pairs of keywords, six clusters were identified, the most relevant keywords being (Figure 4) red (optimization, system, impact, dynamics, stability, prediction, innovation, economic-growth, regression, algorithm, and entropy), green (policy, quality, demand, supply chain, eoq model, and time), blue (machine learning, design, economics, finance, big data, data science, hybrid, network), yellow (performance, efficiency, growth, models, models, forecasting, data envelopment analysis, behavior, and dea), lilac (risk, cointegration, volatility, investment, economic policy uncertainty, sustainable development, CO2 emissions, return, and liquidity), and turquoise (model, management, selection, sustainability, framework, decision making, ahp, mcdm, performance evaluation).
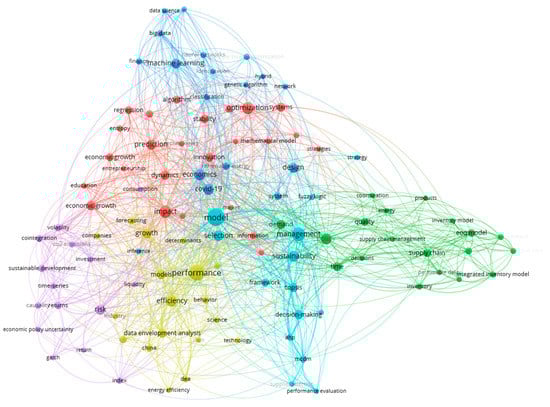
Figure 4.
Keywords analysis through cartography analysis using VOSviewer (topic economic*).
Environment*
Of the 4920 keywords, 135 met the threshold for a minimum number of occurrences for a keyword 5. The first ten keywords with the greatest total strength of the co-occurrence links with other keywords are presented in Table 13.
Table 13.
The keywords with the greatest total link strength of the co-occurrence (environment*).
The most relevant keywords in the network, structured in seven clusters (Figure 5), are optimization, uncertainty, system, machine learning, prediction, neural network, classification, regression, convergence, and decomposition (red); system, performance, model, efficiency, risk, and network (green); decision making, selection, aggregation-operators, framework, topsis, and entropy (blue); dynamics, design, stability, environment, and simulation (yellow); model, management, impact, behavior, innovation, competitiveness, and determinants (lilac); quality, strategies, supply chain, indicators, eoq model, logistics, and internet (turquoise); and education, students, higher-education, augmented reality, and mathematics (orange). Model, performance, and management represent the common keywords in the economic and environmental topics.
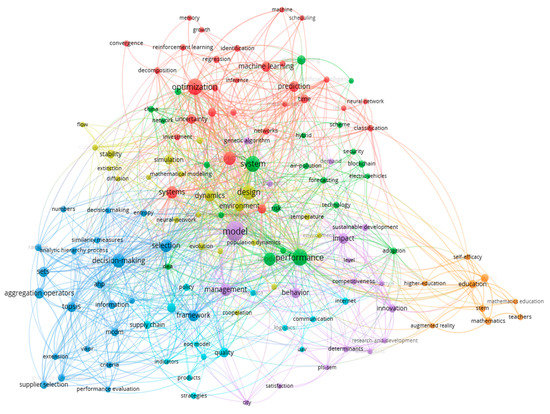
Figure 5.
Keywords analysis through cartography analysis using VOSviewer (topic environment*).
Ecologic*
Of the 431 keywords, 5 recorded a minimum of 3 occurrences (Table 14). Selection and optimization are the common keywords for environmental and ecological issues. Three clusters were delimited in the network: bifurcation and stability; multicriteria decision making and selection; and optimization.
Table 14.
The keywords with the greatest total link strength of the co-occurrence (ecologic*).
3.4. Co-Authorship
To evaluate the link between researchers, a co-authorship by author and country was conducted.
3.4.1. Co-Authorship—Author
Economic*
Of the 1467 authors, the first 10 with the greatest total link strength are presented in Table 15.
Table 15.
The authors with the greatest total link strength (Economic*).
The largest set of connected items in the network consists of 27 authors, delimiting six clusters: red (Duc-Thinh Nguyen, Hong-Cham Le, Huong-Thuy Phung, Phi-Hung Nguyen, Thi-Giang Nguyen, Thi-Hoai Tran, and Thi-Ly Nguyen), green (Husain Syed Tam, Kao Jui-Chung, Van Thanh Nguyen, Viet Tinh Nguyen, and Wang Yen-Hui), blue (Dang Thanh-Tuan, Huang Ching-Chien, Kristofer Neal, Lu Chen-Ming, and Nguyen Ngoc-Ai-Thy), yellow (Anh Luyen Le, Minh Nhat Nguyen, Tibo Hector, and Wang Chian-Nan), lilac (Chung Yu-Chi, Nhieu Nhat-Luong, and Pham Huynh-Tram) and turquoise (Day Jen-Der, Quoc-Chien Luu, and Thi-Kim-Lien Nguyen). The key collaborative networks among authors are depicted in Figure 6.
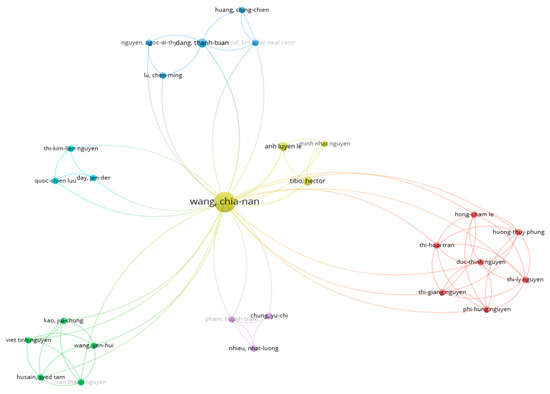
Figure 6.
The key collaborative networks among authors (economic*).
Environment*
Of the 2495 authors, the first 10 with the greatest total link strength were selected (Table 16).
Table 16.
The authors with the greatest total link strength (environment*).
Five clusters were identified in the network, and the largest set of connected items in the network consisted of 35 authors (Figure 7): red (Husain Syed Tam, Kao Jui-Chung, Ngoc Nguyen Tran, Nguyen Van Thanh, Nhieu Nhat-Luong, Thi Lan Anh Tran, Van Thanh Nguyen, Viet Tinh Nguyen, Wang Chia-Nan, and Wang Yen-Hui) green (Diue Houng Nguyen, Hong-Anh Pham, Hsu-Hao Lin, Huong Le Thi, Phi-Hung Nguyen, Quynh Mai Do, and Thu-Ha Nguyen), blue (Duc-Thinh Nguyen, Hong-Cham Le, Huong-Thuy Phung, Thi-Giang Nguyen, Thi-Hoai Tran, and Thi-Ly Nguyen), yellow (Le Hong-Cham, Nguyen Duc-Thinh, Nguyen Thi-Giang, Nguyen Thi-Ly, Phung Huong-Thuy, and Tran Thi-Hoai), and lilac (Dang Thanh-Tuan, Lin Ming-Hua, Nguyen Kim-Anh, Nguyen Phi-Hung, Pham Hong-Anh, and Tsai Jung-Fa).
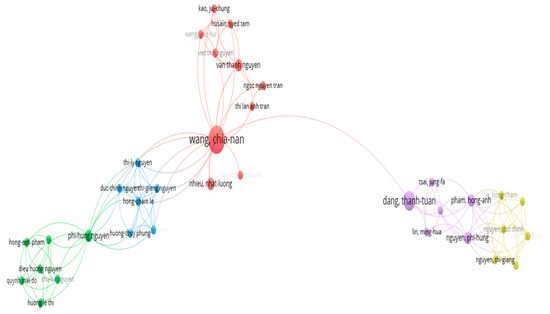
Figure 7.
The key collaborative networks among authors (environment*).
Ecologic*
Of the 156 authors, the first 10 with the greatest total link strength are presented in Table 17.
Table 17.
The authors with the greatest total link strength (ecologic*).
The network analysis highlights a single cluster (Figure 8).
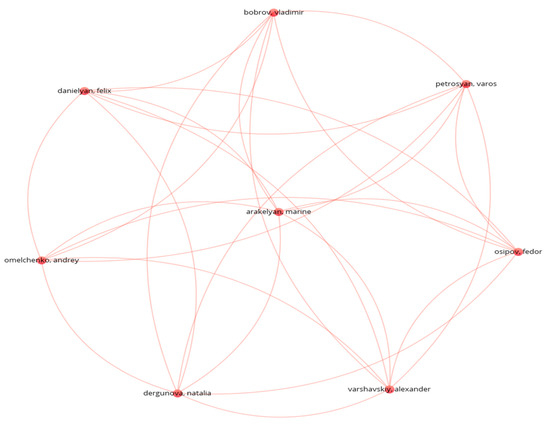
Figure 8.
The key collaborative networks among authors (ecologic*).
3.4.2. Co-Authorship—Country
Economic*
Of the 73 countries, the countries with the greatest co-authorship total link strength are presented in Table 18.
Table 18.
The countries with the greatest co-authorship link strength (economic*).
The largest set of connected items in the network consists of 35 items, with six delimited clusters (Figure 9): red (Australia, the Czech Republic, England, Germany, Hungary, the People’s Republic of China, Portugal, Slovakia, and Vietnam), green (Canada, Iran, Italy, Malaysia, Romania, Taiwan, Thailand, Turkey, and the USA), blue (Brazil, Egypt, Poland, Russia, Saudi Arabia, Serbia, and South Africa), yellow (Chile, Colombia, Ecuador, Mexico, Spain), lilac (India, Pakistan, and South Korea), and turquoise (France and Greece).
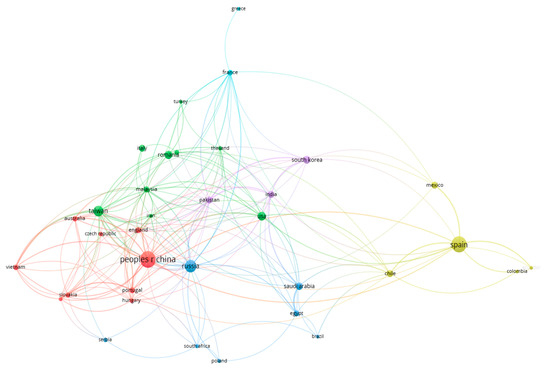
Figure 9.
Collaborative network of countries (economic*).
Environment*
Of the 78 countries, the first 10 with the greatest total link strength were selected (Table 19).
Table 19.
The countries with the greatest co-authorship link strength (environment*).
The network analysis identifies five clusters. The largest set of connected items consists of 38 countries (Figure 10): red (Chile, Colombia, Germany, Greece, Israel, Italy, Malaysia, Mexico, Nigeria, Portugal, Russia, and Spain), green (Canada, the Czech Republic, France, Iran, Lithuania, Poland, Romania, Serbia, Slovakia, Thailand, Turkey, and Ukraine), blue (Morocco, Pakistan, the People’s Republic of China, South Korea, and the USA), yellow (Australia, England, Hungary, Taiwan, and Vietnam), and lilac (Egypt, India, Oman, and Saudi Arabia).
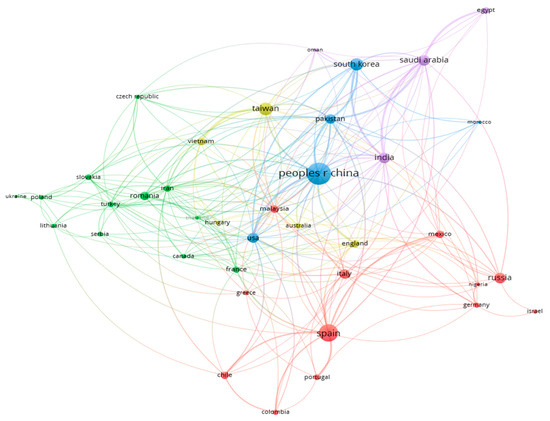
Figure 10.
Collaborative network of countries (environmental*).
Ecologic*
Of the 30 countries, 6 meet the threshold (Table 20). The connected countries in the network form three clusters (Figure 11): red (India, Italy, and Spain), green (England and the People’s Republic of China), and blue (Russia).
Table 20.
The countries with the greatest co-authorship link strength (ecologic*).
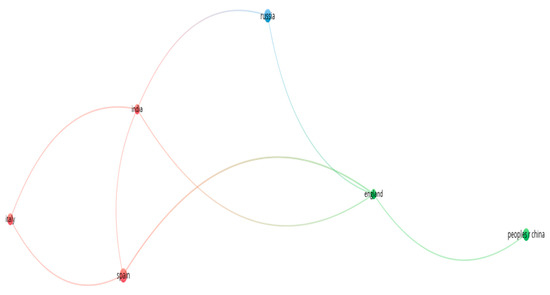
Figure 11.
Collaborative network of countries (ecologic*).
3.5. Bibliographic Coupling
The bibliographic coupling reveals the overlap in the reference lists of the scientific publications, constituting a reference to the probability that two papers aimed at a related subject matter. The analysis concerned both the documents and the authors included in the reference lists.
3.5.1. Bibliographic Coupling—Documents
Economic*
The first 10 documents with the greatest total strength links of bibliographic coupling of the 472 are presented in Table 21.
Table 21.
The documents with the greatest total strength links of bibliographic coupling (economic*).
The largest set of connected items in the network consists of 376 documents, identifying 17 clusters (Figure 12).
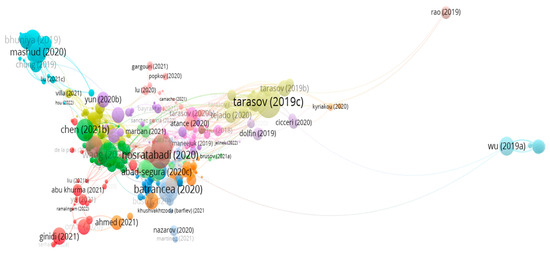
Figure 12.
Papers’ clustering by coupling (economic*).
Environment*
Of the 738 documents, the first 10 with the greatest total strength links of bibliographic coupling are presented in Table 22.
Table 22.
The documents with the greatest total strength links of bibliographic coupling (environmental*).
The largest set of connected items in the network consists of 563 documents, identifying 20 clusters.
The large number of clusters highlights the existence of a multitude of addressed issues (Figure 13).
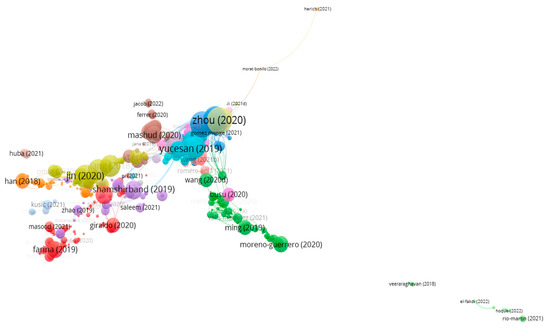
Figure 13.
Papers’ clustering by coupling (environment*).
Ecologic*
Of the 47 documents, the first 10 with the greatest total strength links of bibliographic coupling are presented in Table 23.
Table 23.
The documents with the greatest total strength links of bibliographic coupling (ecologic*).
The largest set of connected items in the network consists of four documents, identifying two clusters: Sukhinov (2021), Zhang (2020), Ahmed (2018), and Diele (2020).
3.5.2. Bibliographic Coupling—Authors
Economic*
For each of the 1467 authors, the total strength of the bibliographic coupling links with other authors was calculated, and the first 10 authors with the greatest total strength links were selected (Table 24).
Table 24.
The authors with the greatest total strength of bibliographic coupling (economic*).
The largest set of connected items in the network consists of 847 items, identifying 52 clusters (Figure 14).
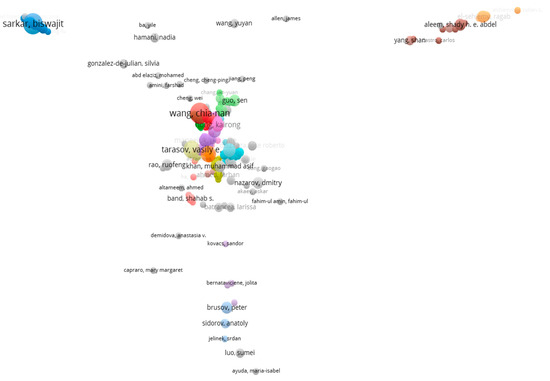
Figure 14.
Authors’ clustering by coupling (economic*).
Environment*
For each of the 2495 authors, the total strength of the bibliographic coupling links with other authors was calculated, and the first 10 authors with the greatest total link strength were selected (Table 25).
Table 25.
The authors with the greatest total strength of bibliographic coupling (environment*).
The largest set of connected items in the network consists of 838 items, identifying 39 clusters (Figure 15).
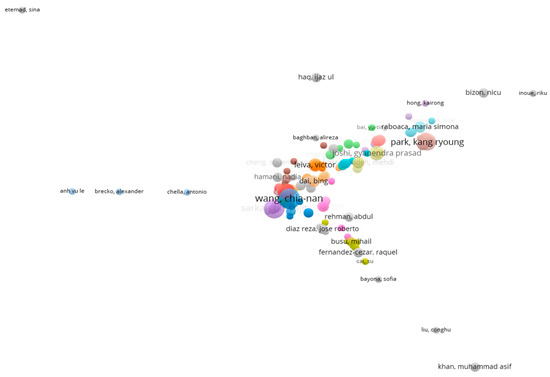
Figure 15.
Papers’ clustering by coupling (environment*).
Ecologic*
The total strength of the bibliographic coupling links with other authors for each of the 156 authors was calculated. The first ten authors with the greatest total link strength were selected (Table 26).
Table 26.
The authors with the greatest total strength of bibliographic coupling (ecologic*).
The largest set of connected items in the network consists of 13 items, identifying 4 clusters: Belova Yulia, Beskopylny Alexey, Chistyakov Alexander, Meskhi Besarion, and Sukhinov Alexander I.; Hu Wen-Si, Liu Quan-Xing, Zhang Kang; Ahmed Danish A., Petrovskii Sergei V., and Tilles Psaulo F.C.; and Diele Fasma and Marangi Carmela.
3.6. Co-citation
The structure of scientific knowledge is investigated using a co-citation analysis. The co-citation network explored the links between citations in order to detect the relationships between authors and construct a knowledge structure.
Economic*
Of the 17424 authors, 21 met the threshold for a minimum number of 20 citations, and the first 10 authors with the greatest total strength of the co-citation links with other authors were selected (Table 27).
Table 27.
The authors with the greatest total strength of the co-citation links with other authors (economic*).
The visualization of the scientific publications based on the authors’ co-citation patterns, considering the largest set of connected items in the network, highlighted three clusters (Figure 16): Charnes A, Diebold FX., Fama EF. Hair JF., Saaty TL., Shaheen AM., Wang CN., Wang Y., Zadeh LA., and Zavadskas E.; Granger CWJ., Machado JAT., Tarasov VE., Tarasova VE., and Tejado I.; Cardenas-Barron LE., Chung KJ., Sarkar B., and Taleizadeh AA., with relevant nodes. An intellectual structure of specific disciplines is created.
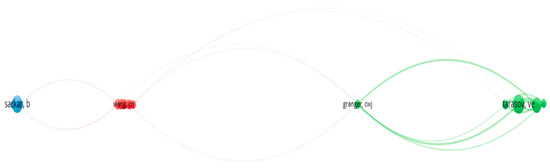
Figure 16.
Co-citation analysis on authors (economic*).
Environment*
Of the 24,507 authors, 40 meet the threshold for a minimum number of 20 citations. The first ten authors with the greatest total strength of the co-citation links with other authors are presented in Table 28.
Table 28.
The authors with the greatest total strength of the co-citation links with other authors (environment*).
The largest set of connected items in the network consists of 38 items, in 5 clusters (Figure 17): red (Hair JF., Li J., Li X., Liu Y., Mirjalili S., Sarkar B., Taleizadeh AA., Wang J., Wang L., Wang Y., Yang XS., Zhang J., and Zhang Y.), green (Buyukozkan G., Govindan K., Keshavaz Ghorabaee M., Liu HC., Rezaei J., Saaty TL., Salabun W., Wang CN., and Zavadskas EK.), blue (Garg H., Li L., Liu PD., Peng XD., Wei GW., Xu ZS., and Yager RR.), yellow (Akram M., Atanassov KT., Zadeh LA., and Zimmermann HJ.) and lilac (Pramanik S., Smarandache F., Wang H., and Ye J.).
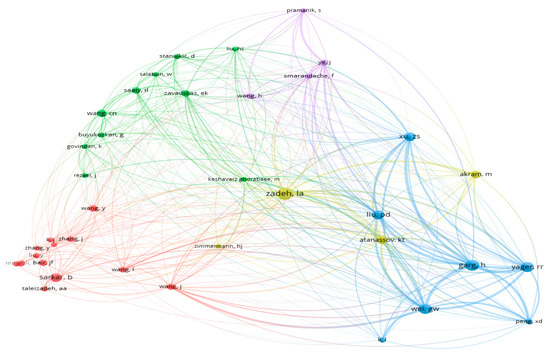
Figure 17.
Co-citation analysis on authors (environment*).
Ecologic*
There is no co-citation between the authors of the articles on ecological issues.
4. Conclusions
This paper gives a general overview of the studies published in Mathematics (ISSN 2227-7390) by using bibliometric indicators and the Web of Science database (WoS). Only scientific publications related to the use of mathematical tools for the analysis of economic, ecological, and environmental phenomena are considered. The results show that there has been a high increase in the number of research papers published in the mathematics journal during recent years, especially in the economic and environmental fields, and that most of the documents are indexed as articles. The contributions come from all over the world, but the majority are from the People’s Republic of China and Spain. All these publications have received the widest attention from the scientific community and contributed to the high rating of the journal.
Wang Chia-Nan (n = 20) and Sarkar Biswajit (n = 19) are the most prolific authors, addressing both economic and environmental issues. They focus on the use of mathematical tools in solving economic and environmental problems, providing relevant benchmarks for decision-makers. The development of approaches by publishing several articles in the field ensures a superior quality of the research and a greater pertinence of the results.
Regarding the meso-topics with the most citations, the results show that the artificial intelligence and machine learning, numerical methods, and statistical methods stand out. In terms of the types of models, data envelopment analysis (DEA) models, Bayesian networks (BNs), decision trees, and dynamic stochastic general equilibrium (DSGE) models were the most used in the selected articles. DEA is a data-oriented approach that converts multiple inputs into multiple outputs. The DEA models were used to evaluate the eco-efficiency of different economies [55,56], to help managers make decisions [57] and to empirically analyze the performance of efficiency in different industries [36,39]. Bayesian networks (BNs), also known as Bayes(ian) models or probabilistic directed acyclic graphical models, enjoy applications to numerous fields, but the focus of the current paper is on fields related to economics, ecology, and environmental applications, such as the optimization of customs fraud control [58], the number of factors that have nowcasting power on GDP [59], and stock price volatility [60]. Applications of BNs can also be found in the behavior of air pollution [61] and the simulation of portfolio decisions under uncertainty [62]. The decision tree is a simple model used to predict the affiliation with a class or an estimate of a numerical target value. It was used to estimate soil temperature [63], to measure and monitor atmospheric ozone concentration levels [64], to develop some decision support systems that can predict natural event propagation [65], and to typologize innovative meso-systems in industry in the context of sustainable development [66]. The dynamic stochastic general equilibrium (DSGE) model adopts the combination of theoretical modeling and stochastic simulation in order to effectively observe the dynamic relationship change among economic variables and accurately measure the expected trend. This model has become the mainstream research method in the field of economic research [67]. Besides the four models, there are other ad-hoc modeling approaches that are designed and used by researchers to conduct economic evaluations in particular circumstances that do not fit in the mainstream modeling paradigms. The application of mathematical models in economic, ecological, and environmental research can help us better understand and use the knowledge in these fields, thus providing strong support for solving practical problems. However, for this, it is important to evaluate how predictions associated with a specific model and data set are expected to be accurate. For selected papers, the most widely used performance evaluation methods were the bootstrap method [68,69,70]) and the cross-validation method [71,72,73]. The choice of one method or another depended on the underlying dataset.
The term co-occurrence analysis found a predominant use of mathematical tools in optimization processes in areas with increased volatility, such as the stock market, in order to rigorously substantiate the decisions of investors and policymakers. Furthermore, it revealed the importance of mathematics, technology, and education in solving environmental problems. The relationships between the citations of the publications have allowed us to establish clusters by key words based on the level of citation. In the communities in which the main keywords were collected, a predominance of terms related to economic, ecological, and environmental issues applied to the different clusters was again observed.
The bibliographic coupling revealed that the documents (Tarasov, 2019c; Tarasov, 2019a; Tang, 2019, etc.) and the authors (Sarkar Biswajit; Wei Guiwu; Garg Harish etc.) had the greatest total strength links of bibliographic coupling. The co-citation network explored the links between citations and detected the authors with the greatest total strength of the co-citation links with other authors (Tarasova V.; Tarasov Ve.; Garg H. etc.).
With reference to the contributions of our research, first of all, this study presents an overview of the main current research in which mathematical models offer possibilities for the analysis of economic, ecological, and environmental phenomena. Secondly, the study highlights the main articles, authors, countries, and networks in this field by reporting to the journal Mathematics. Thirdly, the main directions in which mathematical tools can be used appropriately and rigorously for economic, environmental, and ecological research were identified. In this way, our study can effectively contribute to the discovery of new knowledge and the management and use of existing knowledge resources [74].
The span of opportunity for future research is wide. Thus, based on the same data, other kinds of interesting analysis are possible to identify which institutions are supporting and furthering the use of mathematical tools for the analyses of economic, ecological, and environmental phenomena. In this sense, some characteristics of the authors can be taken into account, such as their doctoral granting and employer institutions. This may reveal collaborations across disciplines. Future research could also analyze the editorial position of the mathematics journal over time and identify how journal output matches those editorial positions.
Author Contributions
Conceptualization, M.A.P., L.I.-F. and B.-Ș.I.; methodology, B.-Ș.I. and D.-F.M.; formal analysis, M.A.P. and L.I.-F.; data curation, B.-Ș.I. and D.-F.M.; writing, M.A.P., B.-Ș.I., L.I.-F. and D.-F.M.; supervision, M.A.P. and L.I.-F. All authors have read and agreed to the published version of the manuscript.
Funding
This research received no external funding.
Data Availability Statement
The data used in this article were collected from the Web of Science.
Conflicts of Interest
The authors declare no conflict of interest.
References
- Donthu, N.; Kumar, S.; Pattnaik, D.; Lim, W.M. A bibliometric retrospection of marketing from the lens of psychology: Insights from Psychology & Marketing. Psychol. Mark. 2021, 38, 834–865. [Google Scholar] [CrossRef]
- Verma, S.; Gustafsson, A. Investigating the emerging COVID-19 research trends in the field of business and management: A bibliometric analysis approach. J. Bus. Res. 2020, 118, 253–261. [Google Scholar] [CrossRef] [PubMed]
- Bhattacharyya, S.S.; Verma, S. The intellectual contours of corporate social responsibility literature: Co-citation analysis study. Int. J. Sociol. Soc. Policy 2020, 40, 1551–1583. [Google Scholar] [CrossRef]
- Ferreira, J.J.M.; Fernandes, C.I.; Ratten, V. A co-citation bibliometric analysis of strategic management research. Scientometrics 2016, 109, 1–32. [Google Scholar] [CrossRef]
- Chahrour, M.; Assi, S.; Bejjani, M.; Nasrallah, A.A.; Salhab, H.; Fares, M.Y.; Khachfe, H.H. A Bibliometric Analysis of COVID-19 Research Activity: A Call for Increased Output. Cureus 2020, 12, e7357. [Google Scholar] [CrossRef]
- Cascajares, M.; Alcayde, A.; Salmerón-Manzano, E.; Manzano-Agugliaro, F. The Bibliometric Literature on Scopus and WoS: The Medicine and Environmental Sciences Categories as Case of Study. Int. J. Environ. Res. Public Health 2021, 18, 5851. [Google Scholar] [CrossRef]
- Liao, H.; Tang, M.; Luo, L.; Li, C.; Chiclana, F.; Zeng, X.-J. A Bibliometric Analysis and Visualization of Medical Big Data Research. Sustainability 2018, 10, 166. [Google Scholar] [CrossRef]
- Singh, V.; Verma, S.; Chaurasia, S.S. Mapping the themes and intellectual structure of corporate university: Co-citation and cluster analyses. Scientometrics 2019, 122, 1275–1302. [Google Scholar] [CrossRef]
- Donthu, N.; Kumar, S.; Pandey, N.; Gupta, P. Forty years of the International Journal of Information Management: A bibliometric analysis. Int. J. Inf. Manag. 2021, 57, 102307. [Google Scholar] [CrossRef]
- Baker, H.K.; Kumar, S.; Pandey, N. Forty years of the Journal of Futures Markets: A bibliometric overview. J. Futur. Mark. 2021, 41, 1027–1054. [Google Scholar] [CrossRef]
- Donthu, N.; Kumar, S.; Pattnaik, D. Forty-five years of Journal of Business Research: A bibliometric analysis. J. Bus. Res. 2020, 109, 1–14. [Google Scholar] [CrossRef]
- Pilkington, A.; Lawton, T.C. Divided by a Common Language? Transnational Insights into Epistemological and Methodological Approaches to Strategic Management Research in English-Speaking Countries. Long Range Plan. 2014, 47, 299–311. [Google Scholar] [CrossRef]
- Zhao, D.; Strotmann, A. Author bibliographic coupling: Another approach to citation-based author knowledge network analysis. Proc. Am. Soc. Inf. Sci. Technol. 2008, 45, 1–10. [Google Scholar] [CrossRef]
- Callon, M.; Courtial, J.-P.; Turner, W.A.; Bauin, S. From translations to problematic networks: An introduction to co-word analysis. Soc. Sci. Inf. 1983, 22, 191–235. [Google Scholar] [CrossRef]
- Dehdarirad, T.; Villarroya, A.; Barrios, M. Research trends in gender differences in higher education and science: A co-word analysis. Scientometrics 2014, 101, 273–290. [Google Scholar] [CrossRef]
- Fernandes, C.; Pires, R. Exploring the Conceptual Structure of the Research on Innovation in Hotels through Co-Word Analysis. Adm. Sci. 2021, 11, 78. [Google Scholar] [CrossRef]
- Aparicio, G.; Iturralde, T.; Maseda, A. Conceptual structure and perspectives on entrepreneurship education research: A bibliometric review. Eur. Res. Manag. Bus. Econ. 2019, 25, 105–113. [Google Scholar] [CrossRef]
- Börner, K.; Chen, C.; Boyack, K.W. Visualizing knowledge domains. Annu. Rev. Inf. Sci. Technol. 2003, 37, 179–255. [Google Scholar] [CrossRef]
- Benckendorff, P. Themes and Trends in Australian and New Zealand Tourism Research: A Social Network Analysis of Citations in Two Leading Journals (1994–2007). J. Hosp. Tour. Manag. 2009, 16, 1–15. [Google Scholar] [CrossRef]
- Kessler, M.M. Bibliographic coupling between scientific papers. Am. Doc. 1963, 14, 10–25. [Google Scholar] [CrossRef]
- Zupic, I.; Čater, T. Bibliometric methods in management and organization. Organ. Res. Methods 2015, 18, 429–472. [Google Scholar] [CrossRef]
- Small, H. Co-citation in the scientific literature: A new measure of the relationship between two documents. J. Am. Soc. Inf. Sci. 1973, 24, 265–269. [Google Scholar] [CrossRef]
- Nerur, S.P.; Rasheed, A.A.; Natarajan, V. The intellectual structure of the strategic management field: An author co-citation analysis. Strat. Manag. J. 2008, 29, 319–336. [Google Scholar] [CrossRef]
- De Solla Price, D.J. Networks of scientific papers. Science 1965, 149, 510–515. [Google Scholar] [CrossRef]
- Chen, C.; Paul, R. Visualizing a knowledge domain’s intellectual structure. Computer 2001, 34, 65–71. [Google Scholar] [CrossRef]
- Sarkar, M.; Pan, L.; Dey, B.K.; Sarkar, B. Does the Autonomation Policy Really Help in a Smart Production System for Controlling Defective Production? Mathematics 2020, 8, 1142. [Google Scholar] [CrossRef]
- Sett, B.K.; Dey, B.K.; Sarkar, B. Autonomated Inspection Policy for Smart Factory—An Improved Approach. Mathematics 2020, 8, 1815. [Google Scholar] [CrossRef]
- Kang, C.W.; Ullah, M.; Sarkar, M.; Omair, M.; Sarkar, B. A Single-Stage Manufacturing Model with Imperfect Items, Inspections, Rework, and Planned Backorders. Mathematics 2019, 7, 446. [Google Scholar] [CrossRef]
- Jani, M.; Betheja, M.; Chaudhari, U.; Sarkar, B. Optimal Investment in Preservation Technology for Variable Demand under Trade-Credit and Shortages. Mathematics 2021, 9, 1301. [Google Scholar] [CrossRef]
- Bhuniya, S.; Sarkar, B.; Pareek, S. Multi-Product Production System with the Reduced Failure Rate and the Optimum Energy Consumption under Variable Demand. Mathematics 2019, 7, 465. [Google Scholar] [CrossRef]
- Omair, M.; Ullah, M.; Ganguly, B.; Noor, S.; Maqsood, S.; Sarkar, B. The Quantitative Analysis of Workers’ Stress Due to Working Environment in the Production System of the Automobile Part Manufacturing Industry. Mathematics 2019, 7, 627. [Google Scholar] [CrossRef]
- Khanna, A.; Kishore, A.; Sarkar, B.; Jaggi, C.K. Supply Chain with Customer-Based Two-Level Credit Policies under an Imperfect Quality Environment. Mathematics 2018, 6, 299. [Google Scholar] [CrossRef]
- Ullah, M.; Sarkar, B.; Asghar, I. Effects of Preservation Technology Investment on Waste Generation in a Two-Echelon Supply Chain Model. Mathematics 2019, 7, 189. [Google Scholar] [CrossRef]
- Sarkar, B.; Ullah, M.; Choi, S.-B. Joint Inventory and Pricing Policy for an Online to Offline Closed-Loop Supply Chain Model with Random Defective Rate and Returnable Transport Items. Mathematics 2019, 7, 497. [Google Scholar] [CrossRef]
- Tayyab, M.; Sarkar, B.; Ullah, M. Sustainable Lot Size in a Multistage Lean-Green Manufacturing Process under Uncertainty. Mathematics 2019, 7, 20. [Google Scholar] [CrossRef]
- Wang, C.N.; Tibo, H.; Nguyen, H.A. Malmquist Productivity Analysis of Top Global Automobile Manufacturers. Mathematics 2020, 8, 580. [Google Scholar] [CrossRef]
- Wang, C.N.; Imperial, K.N.C.; Huang, C.C.; Dang, T.T. Output Targeting and Runway Utilization of Major International Airports: A Comparative Analysis Using DEA. Mathematics 2022, 10, 551. [Google Scholar] [CrossRef]
- Wang, C.N.; Nguyen, P.H.; Nguyen, T.L.; Nguyen, T.G.; Nguyen, D.T.; Tran, T.H.; Le, H.C.; Phung, H.T. A Two-Stage DEA Approach to Measure Operational Efficiency in Vietnam’s Port Industry. Mathematics 2022, 10, 1385. [Google Scholar] [CrossRef]
- Wang, C.-N.; Luu, Q.-C.; Nguyen, T.-K.-L.; Day, J.-D. Assessing Bank Performance Using Dynamic SBM Model. Mathematics 2019, 7, 73. [Google Scholar] [CrossRef]
- Wang, C.N.; Nguyen, N.A.T.; Dang, T.T.; Lu, C.M. A Compromised Decision-Making Approach to Third-Party Logistics Selection in Sustainable Supply Chain Using Fuzzy AHP and Fuzzy VIKOR Methods. Mathematics 2021, 9, 886. [Google Scholar] [CrossRef]
- Wang, C.N.; Nhieu, N.L.; Tran, T.T.T. Stochastic Chebyshev Goal Programming Mixed Integer Linear Model for Sustainable Global Production Planning. Mathematics 2021, 9, 483. [Google Scholar] [CrossRef]
- Wang, C.N.; Nhieu, N.L.; Chung, Y.C.; Pham, H.T. Multi-Objective Optimization Models for Sustainable Perishable Intermodal Multi-Product Networks with Delivery Time Window. Mathematics 2021, 9, 379. [Google Scholar] [CrossRef]
- Wang, C.N.; Yang, C.Y.; Cheng, H.C. Fuzzy Multi-Criteria Decision-Making Model for Supplier Evaluation and Selection in a Wind Power Plant Project. Mathematics 2019, 7, 417. [Google Scholar] [CrossRef]
- Wang, C.N.; Nguyen, V.T.; Thai, H.T.N.; Tran, N.N.; Tran, T.L.A. Sustainable Supplier Selection Process in Edible Oil Production by a Hybrid Fuzzy Analytical Hierarchy Process and Green Data Envelopment Analysis for the SMEs Food Processing Industry. Mathematics 2018, 6, 302. [Google Scholar] [CrossRef]
- Wang, C.N.; Nguyen, H.P.; Chang, C.W. Environmental Efficiency Evaluation in the Top Asian Economies: An Application of DEA. Mathematics 2021, 9, 889. [Google Scholar] [CrossRef]
- Tarasov, V.E. Rules for Fractional-Dynamic Generalizations: Difficulties of Constructing Fractional Dynamic Models. Mathematics 2019, 7, 554. [Google Scholar] [CrossRef]
- Tarasov, V.E. On History of Mathematical Economics: Application of Fractional Calculus. Mathematics 2019, 7, 509. [Google Scholar] [CrossRef]
- Tarasov, V.E. Non-Linear Macroeconomic Models of Growth with Memory. Mathematics 2020, 8, 2078. [Google Scholar] [CrossRef]
- Tarasov, V.E.; Tarasova, V.V. Dynamic Keynesian Model of Economic Growth with Memory and Lag. Mathematics 2019, 7, 178. [Google Scholar] [CrossRef]
- Tarasov, V.E. Fractional Dynamics with Depreciation and Obsolescence: Equations with Prabhakar Fractional Derivatives. Mathematics 2022, 10, 1540. [Google Scholar] [CrossRef]
- Chowdhury, P.R.; Petrovskii, S.; Banerjee, M. Effect of Slow–Fast Time Scale on Transient Dynamics in a Realistic Prey-Predator System. Mathematics 2022, 10, 699. [Google Scholar] [CrossRef]
- Carletti, M.; Banerjee, M. A Backward Technique for Demographic Noise in Biological Ordinary Differential Equation Models. Mathematics 2019, 7, 1204. [Google Scholar] [CrossRef]
- Ahmed, D.A.; Petrovskii, S.V.; Tilles, P.F.C. The “Lévy or Diffusion” Controversy: How Important Is the Movement Pattern in the Context of Trapping? Mathematics 2018, 6, 77. [Google Scholar] [CrossRef]
- Zhu, J.; Liu, W. Comparing like with like: China ranks first in SCI-indexed research articles since 2018. Scientometrics 2020, 124, 1691–1700. [Google Scholar] [CrossRef]
- Wang, C.N.; Kao, J.C.; Wang, Y.H.; Nguyen, V.T.; Nguyen, V.T.; Husain, S.T. A Multicriteria Decision-Making Model for the Selection of Suitable Renewable Energy Sources. Mathematics 2021, 9, 1318. [Google Scholar] [CrossRef]
- Ratner, S.; Lychev, A.; Rozhnov, A.; Lobanov, I. Efficiency Evaluation of Regional Environmental Management Systems in Russia Using Data Envelopment Analysis. Mathematics 2021, 9, 2210. [Google Scholar] [CrossRef]
- Gutiérrez, L.R.; Oliva, M.A.D.V.; Romero-Ania, A. Economic, Ecological and Social Analysis Based on DEA and MCDA for the Management of the Madrid Urban Public Transportation System. Mathematics 2022, 10, 172. [Google Scholar] [CrossRef]
- González García, I.; Mateos Caballero, A. A Multi-Objective Bayesian Approach with Dynamic Optimization (MOBADO). A Hybrid of Decision Theory and Machine Learning Applied to Customs Fraud Control in Spain. Mathematics 2021, 9, 1529. [Google Scholar] [CrossRef]
- Tsagris, M. The FEDHC Bayesian Network Learning Algorithm. Mathematics 2022, 10, 2604. [Google Scholar] [CrossRef]
- Naik, N.; Mohan, B.R. Stock Price Volatility Estimation Using Regime Switching Technique-Empirical Study on the Indian Stock Market. Mathematics 2021, 9, 1595. [Google Scholar] [CrossRef]
- Alyousifi, Y.; Ibrahim, K.; Othamn, M.; Zin, W.Z.W.; Vergne, N.; Al-Yaari, A. Bayesian Information Criterion for Fitting the Optimum Order of Markov Chain Models: Methodology and Application to Air Pollution Data. Mathematics 2022, 10, 2280. [Google Scholar] [CrossRef]
- Vallejo-Jimenez, B.; Venegas-Martinez, F.; De la Torre-Torres, O.V.; Alvarez-Garcia, J. Simulating Portfolio Decisions under Uncertainty When the Risky Asset and Short Rate Are Modulated by an Inhomogeneous and Asset-Dependent Markov Chain. Mathematics 2022, 10, 2926. [Google Scholar] [CrossRef]
- Sattari, M.; Avram, A.; Apaydin, H.; Matei, O. Soil Temperature Estimation with Meteorological Parameters by Using Tree-Based Hybrid Data Mining Models. Mathematics 2020, 8, 1407. [Google Scholar] [CrossRef]
- Bhuiyan, A.M.; Sahi, R.K.; Islam, R.; Mahmud, S. Machine Learning Techniques Applied to Predict Tropospheric Ozone in a Semi-Arid Climate Region. Mathematics 2021, 9, 2901. [Google Scholar] [CrossRef]
- Pereira, J.; Mendes, J.; Júnior, J.S.S.; Viegas, C.; Paulo, J.R. A Review of Genetic Algorithm Approaches for Wildfire Spread Prediction Calibration. Mathematics 2022, 10, 300. [Google Scholar] [CrossRef]
- Shinkevich, A.I.; Ershova, I.G.; Galimulina, F.F.; Yarlychenko, A.A. Innovative Mesosystems Algorithm for Sustainable Development Priority Areas Identification in Industry Based on Decision Trees Construction. Mathematics 2021, 9, 3055. [Google Scholar] [CrossRef]
- Luo, S.; Zhou, G.; Zhou, J. The Impact of Electronic Money on Monetary Policy: Based on DSGE Model Simulations. Mathematics 2021, 9, 2614. [Google Scholar] [CrossRef]
- Méndez-Suárez, M. Marketing Mix Modeling Using PLS-SEM, Bootstrapping the Model Coefficients. Mathematics 2021, 9, 1832. [Google Scholar] [CrossRef]
- Zhao, H.; Guo, S. Uncertain Interval Forecasting for Combined Electricity-Heat-Cooling-Gas Loads in the Integrated Energy System Based on Multi-Task Learning and Multi-Kernel Extreme Learning Machine. Mathematics 2021, 9, 1645. [Google Scholar] [CrossRef]
- Yılancı, V.; Çütcü, I.; Araci, S. The Causality Relationship between Trade and Environment in G7 Countries: Evidence from Dynamic Symmetric and Asymmetric Bootstrap Panel Causality Tests. Mathematics 2022, 10, 2553. [Google Scholar] [CrossRef]
- Wu, Z.; Christofides, P.D. Economic Machine-Learning-Based Predictive Control of Nonlinear Systems. Mathematics 2019, 7, 494. [Google Scholar] [CrossRef]
- Kyriakou, I.; Mousavi, P.; Nielsen, J.P.; Scholz, M. Longer-Term Forecasting of Excess Stock Returns—The Five-Year Case. Mathematics 2020, 8, 927. [Google Scholar] [CrossRef]
- Mousavi, P. Debt-by-Price Ratio, End-of-Year Economic Growth, and Long-Term Prediction of Stock Returns. Mathematics 2021, 9, 1550. [Google Scholar] [CrossRef]
- White, H.D.; Buzydlowski, J.; Lin, X. Co-Cited Author Maps as Interfaces to Digital Libraries: Designing Pathfinder Networks in the Humanities. In Proceedings of the IEEE International Conference on Information Visualization, London, UK, 18–22 July 2000; pp. 25–30. [Google Scholar] [CrossRef]
Disclaimer/Publisher’s Note: The statements, opinions and data contained in all publications are solely those of the individual author(s) and contributor(s) and not of MDPI and/or the editor(s). MDPI and/or the editor(s) disclaim responsibility for any injury to people or property resulting from any ideas, methods, instructions or products referred to in the content. |
© 2023 by the authors. Licensee MDPI, Basel, Switzerland. This article is an open access article distributed under the terms and conditions of the Creative Commons Attribution (CC BY) license (https://creativecommons.org/licenses/by/4.0/).