

Price, Complexity, and Mathematical Model


Abstract
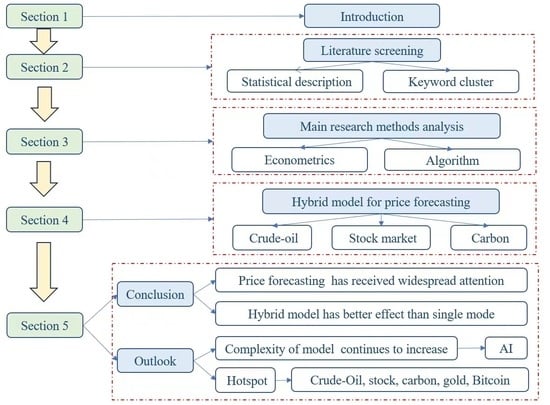
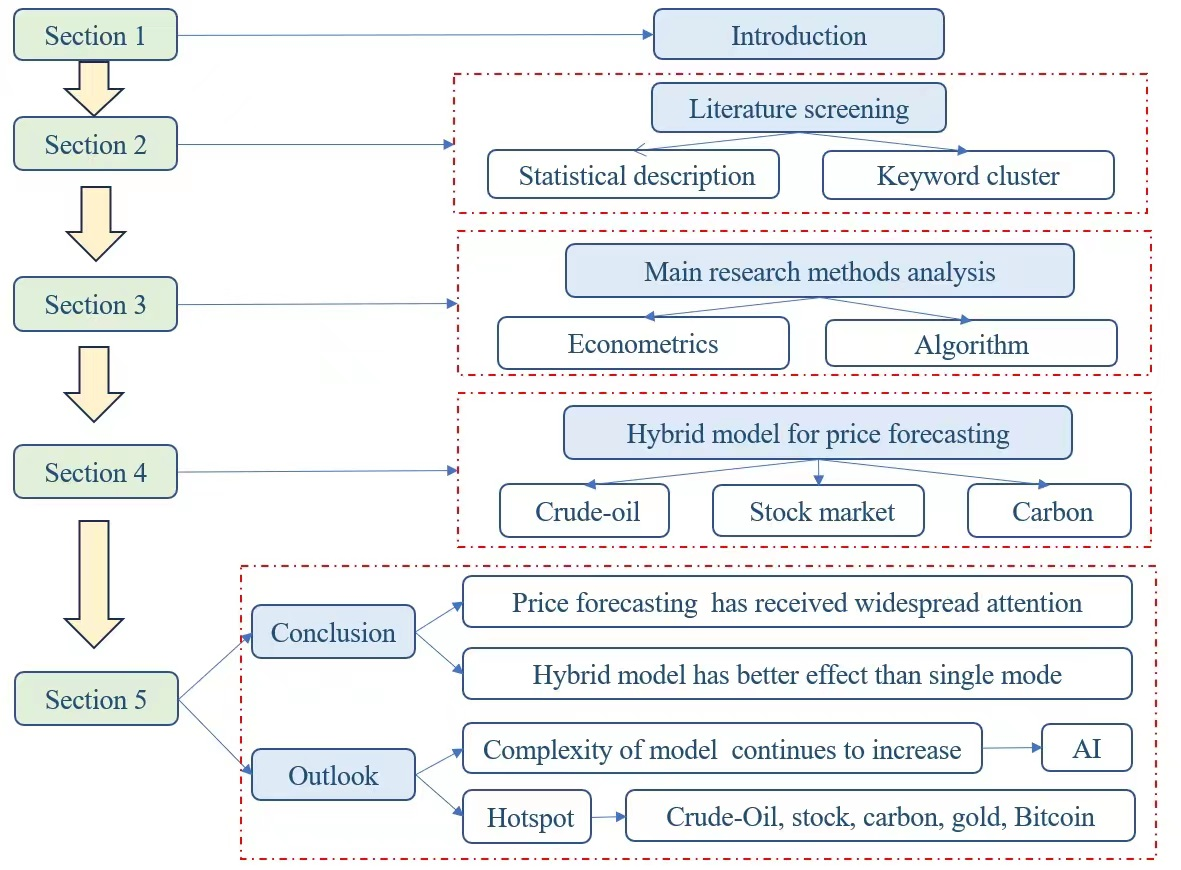
1. Introduction
2. Literature Screening, Statistical Description, and Keyword Analysis
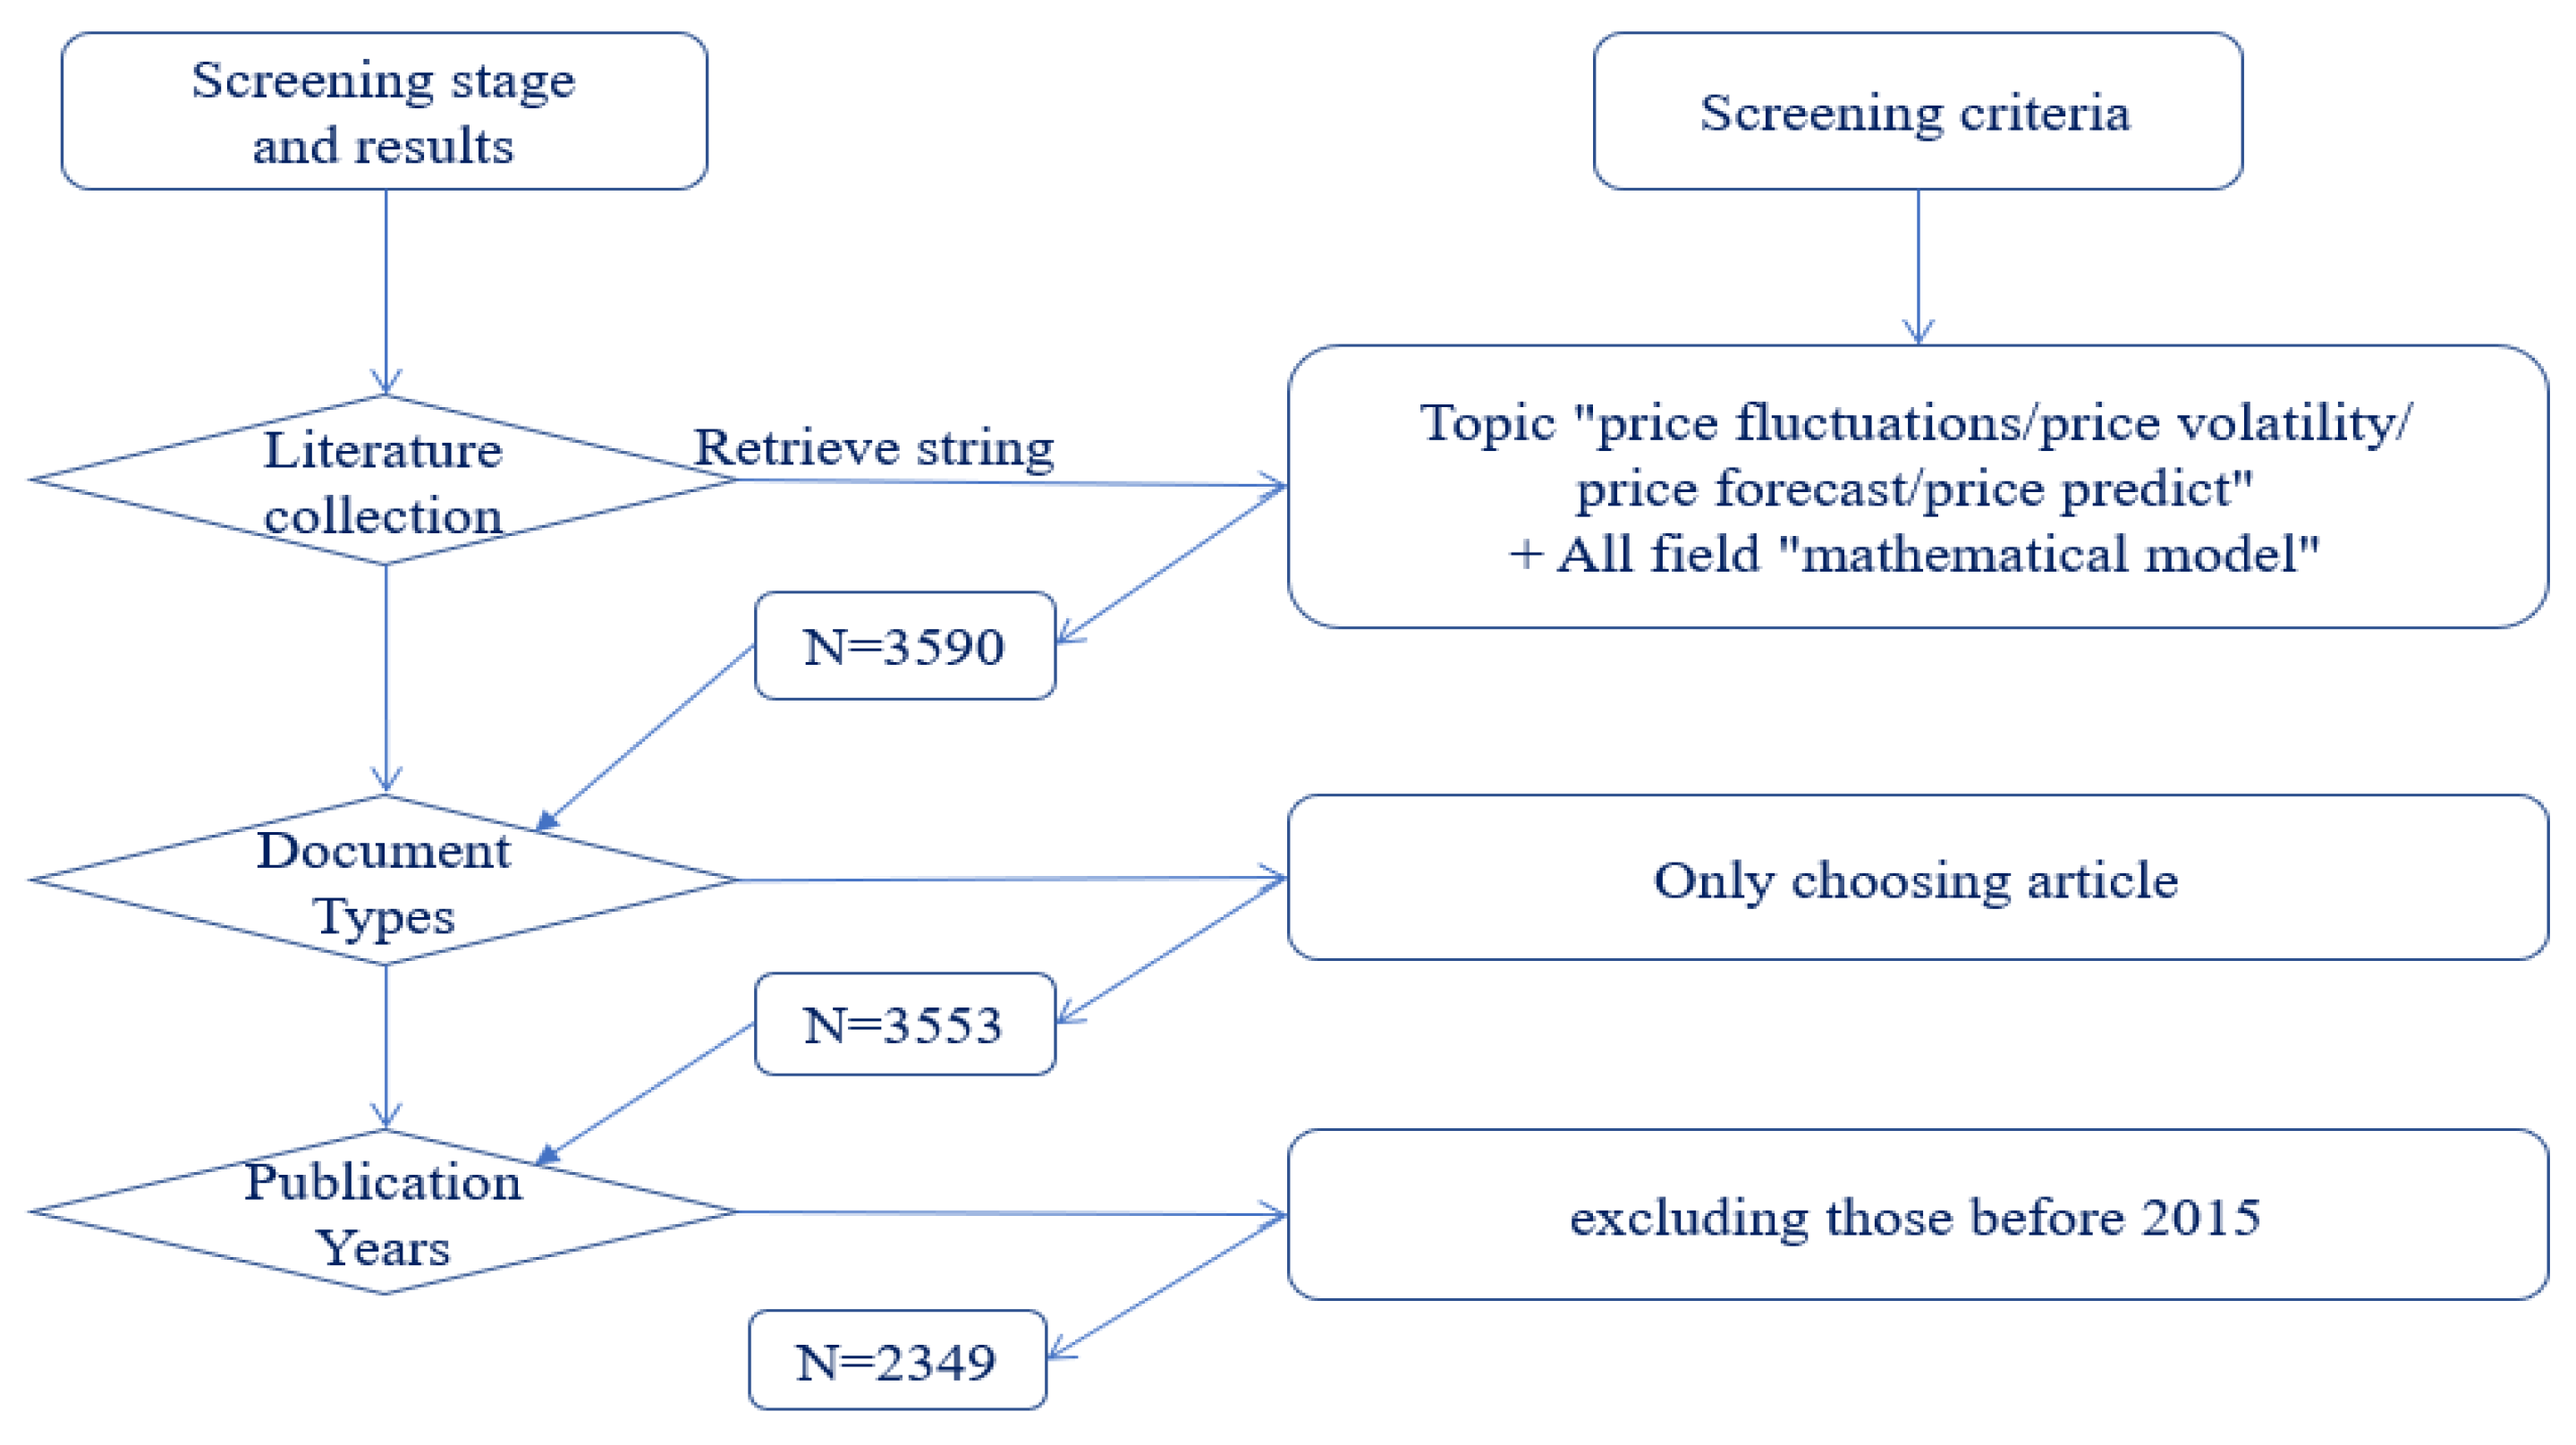
2.1. Literature Screening
2.2. Statistical Descriptive Analysis
2.2.1. The Number of Publications and Citations Basically Increased Year by Year
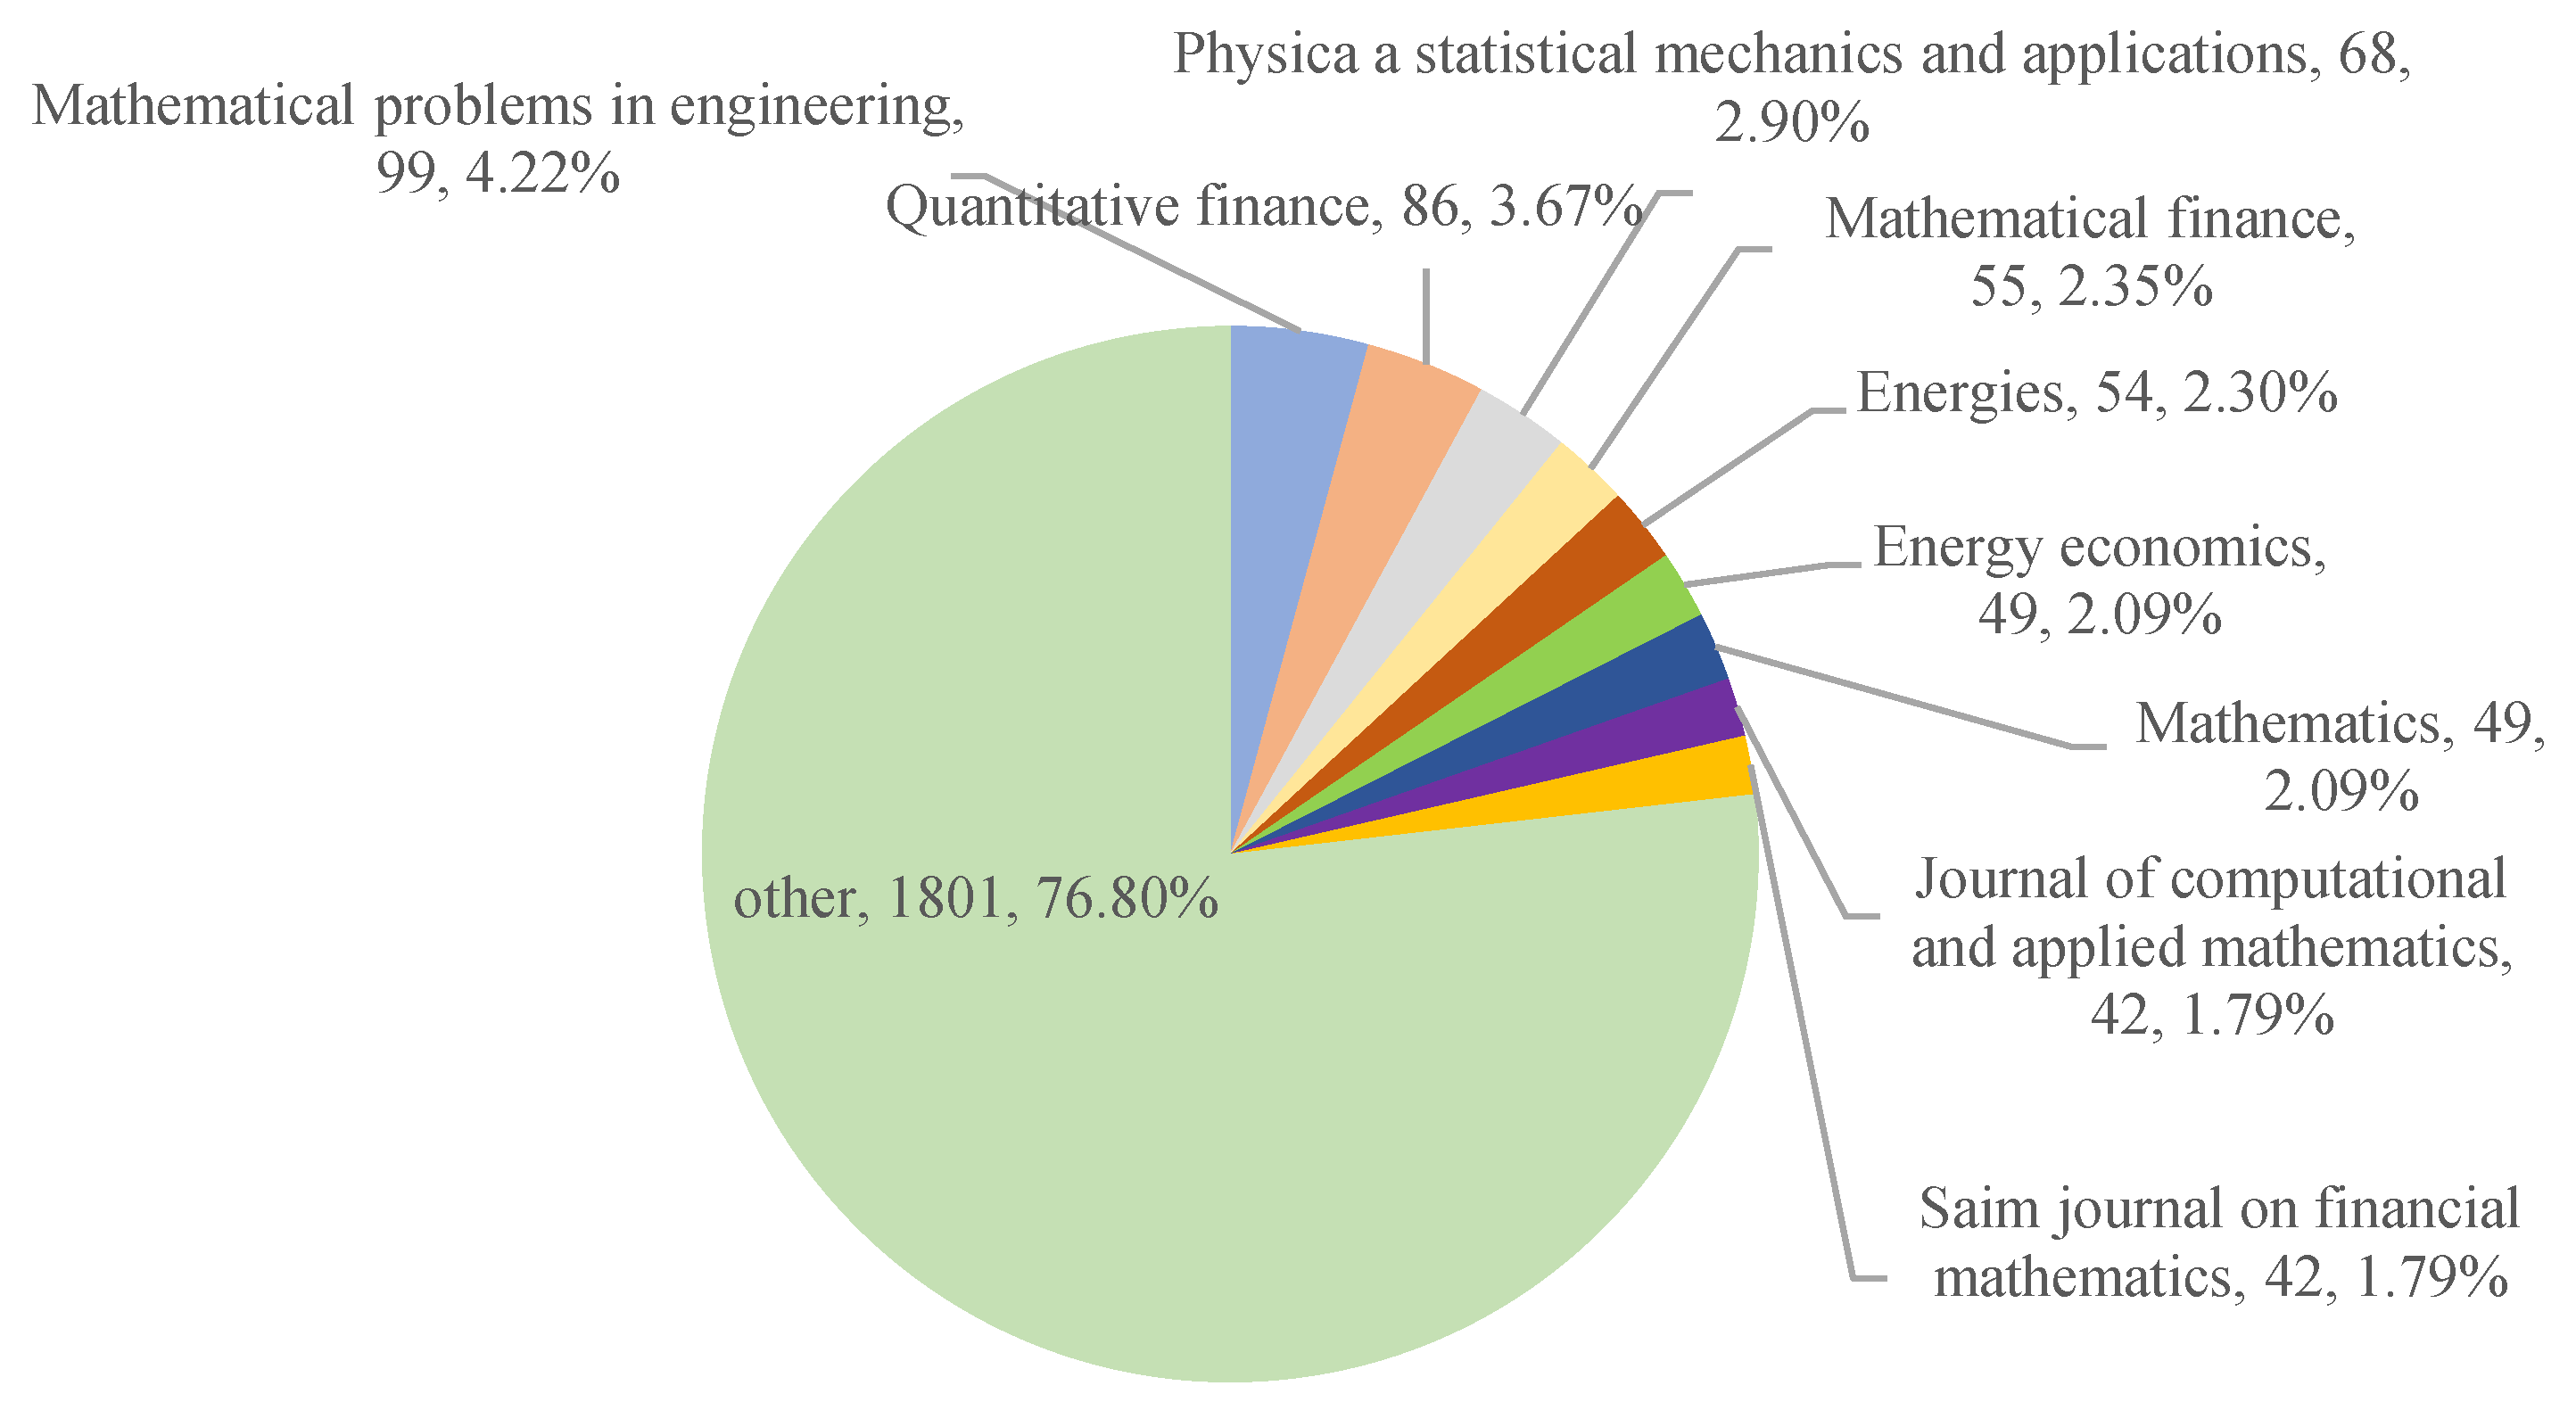
2.2.2. Recognized by the Chief Editors of Many Publications
2.2.3. Wide Geographical Distribution
2.3. Keywords Cluster Analysis
2.3.1. Density Analysis
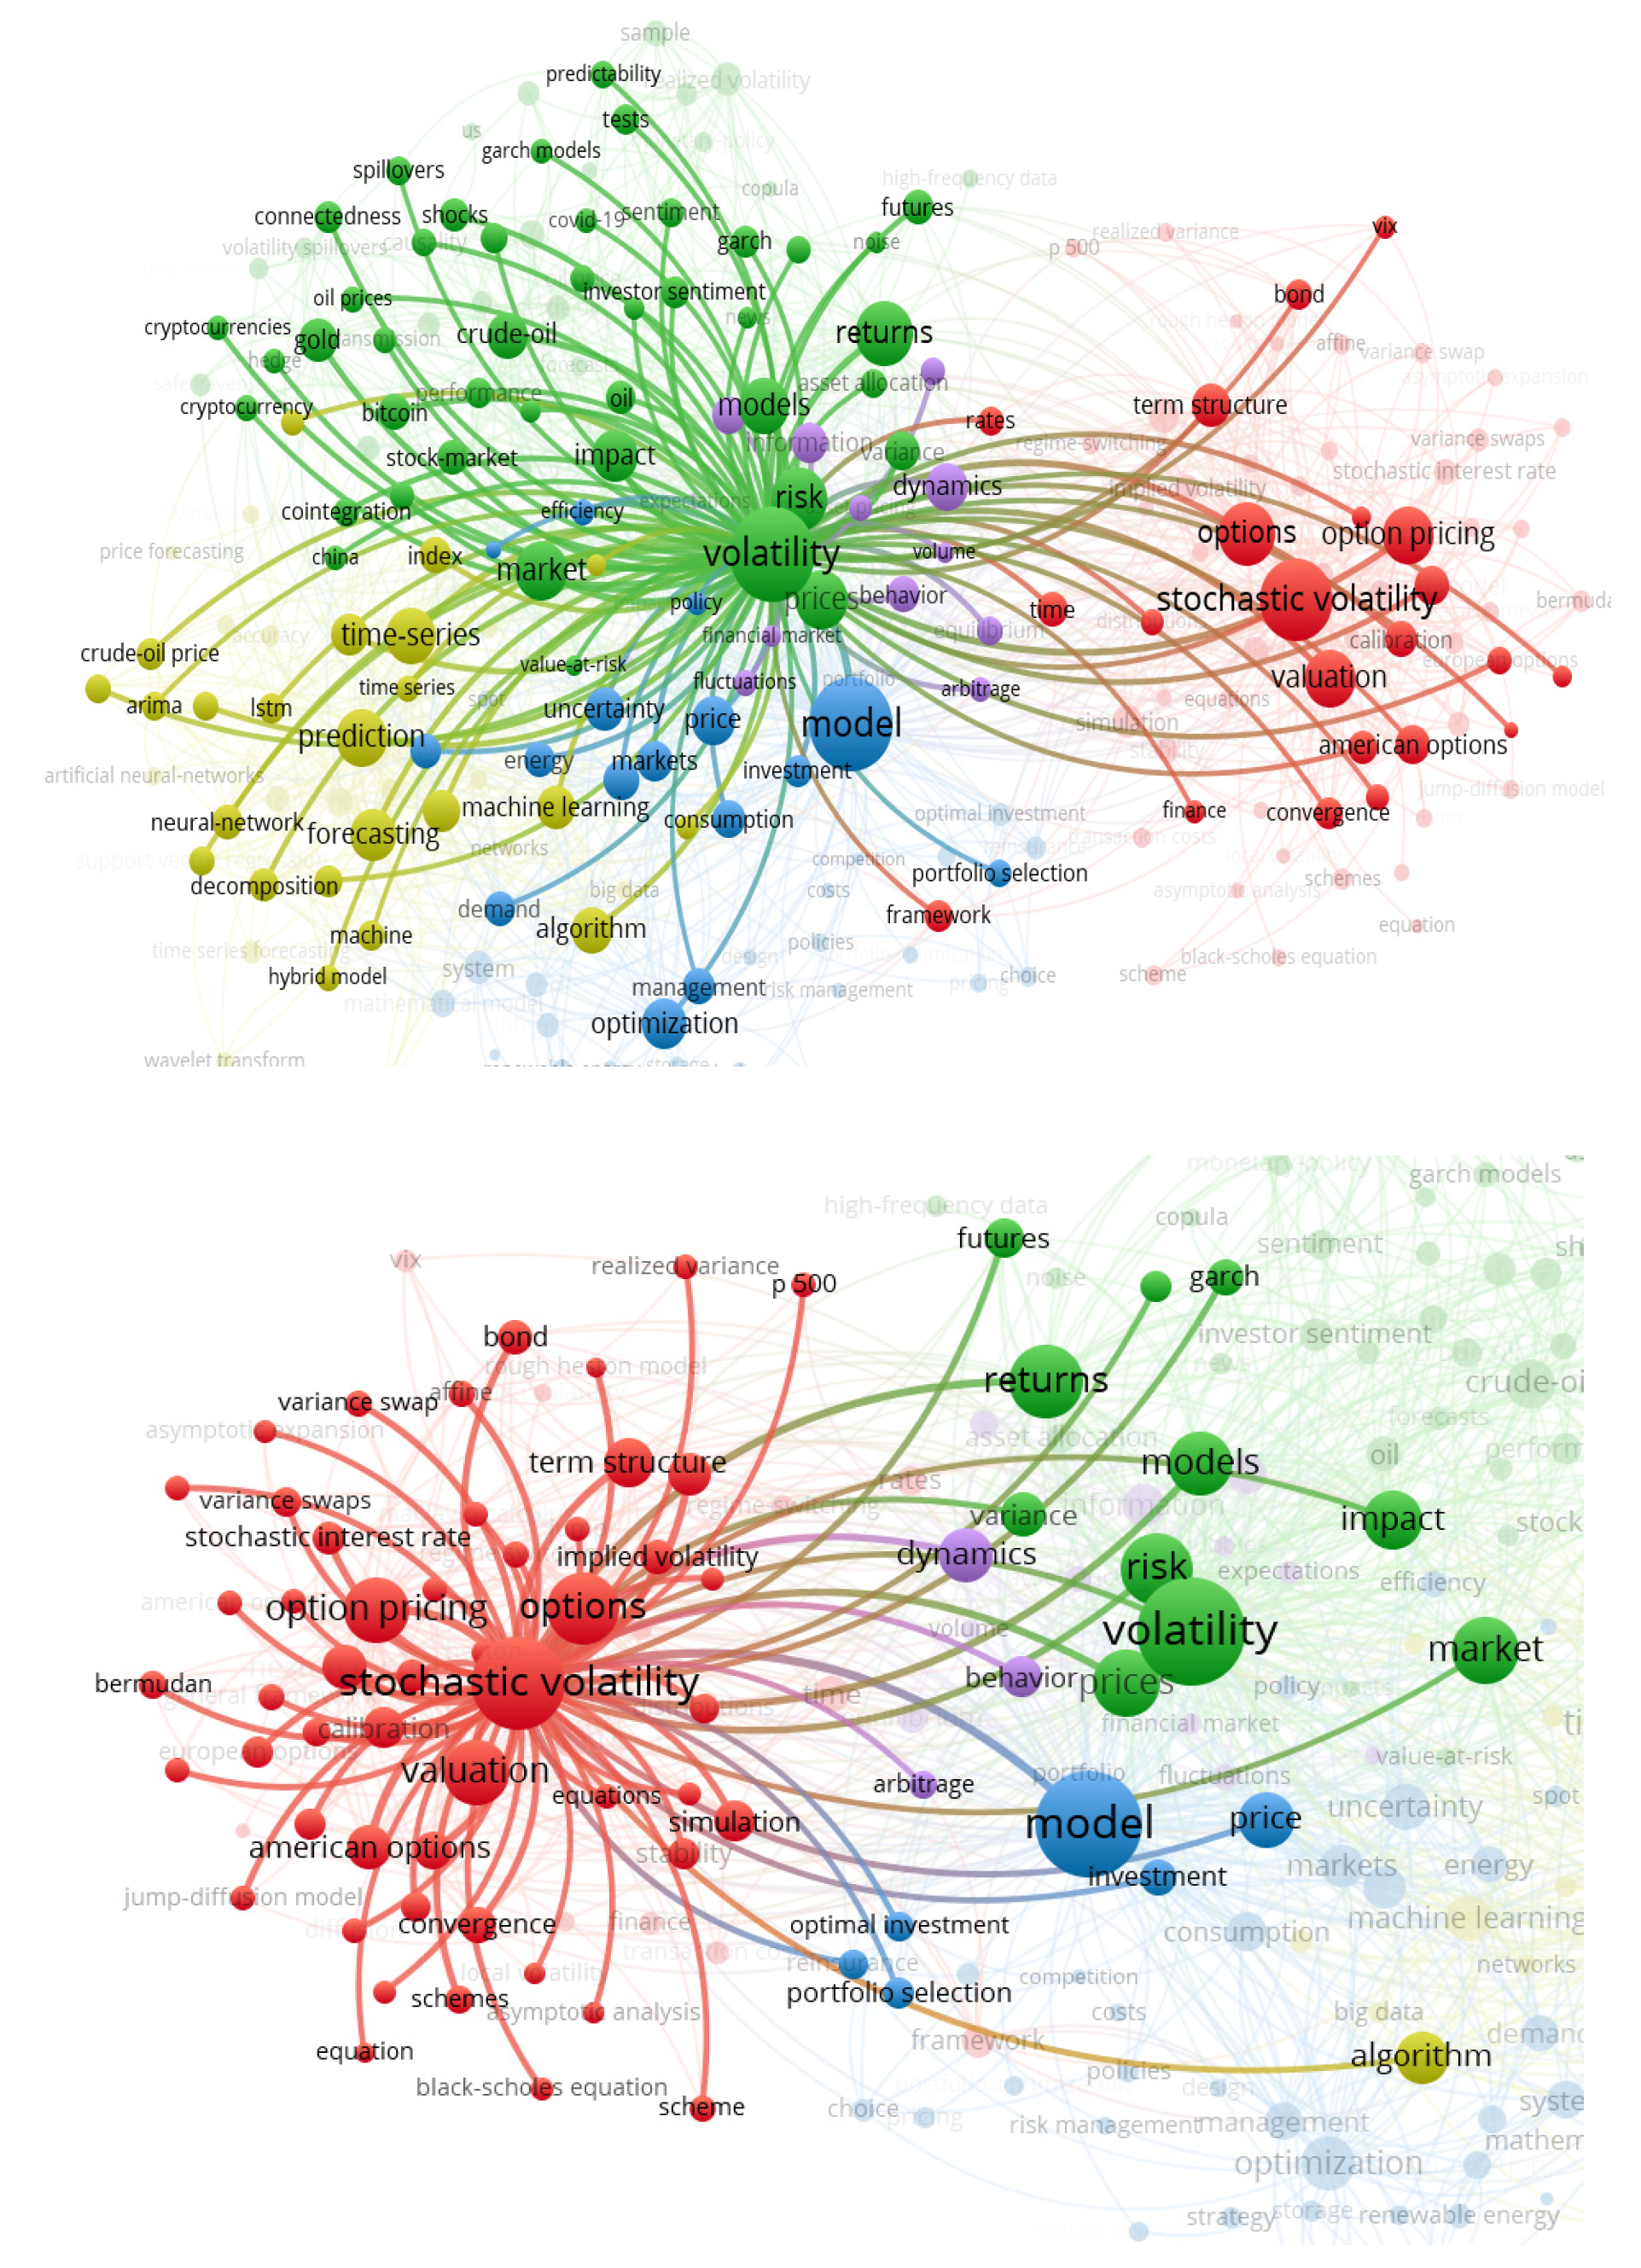
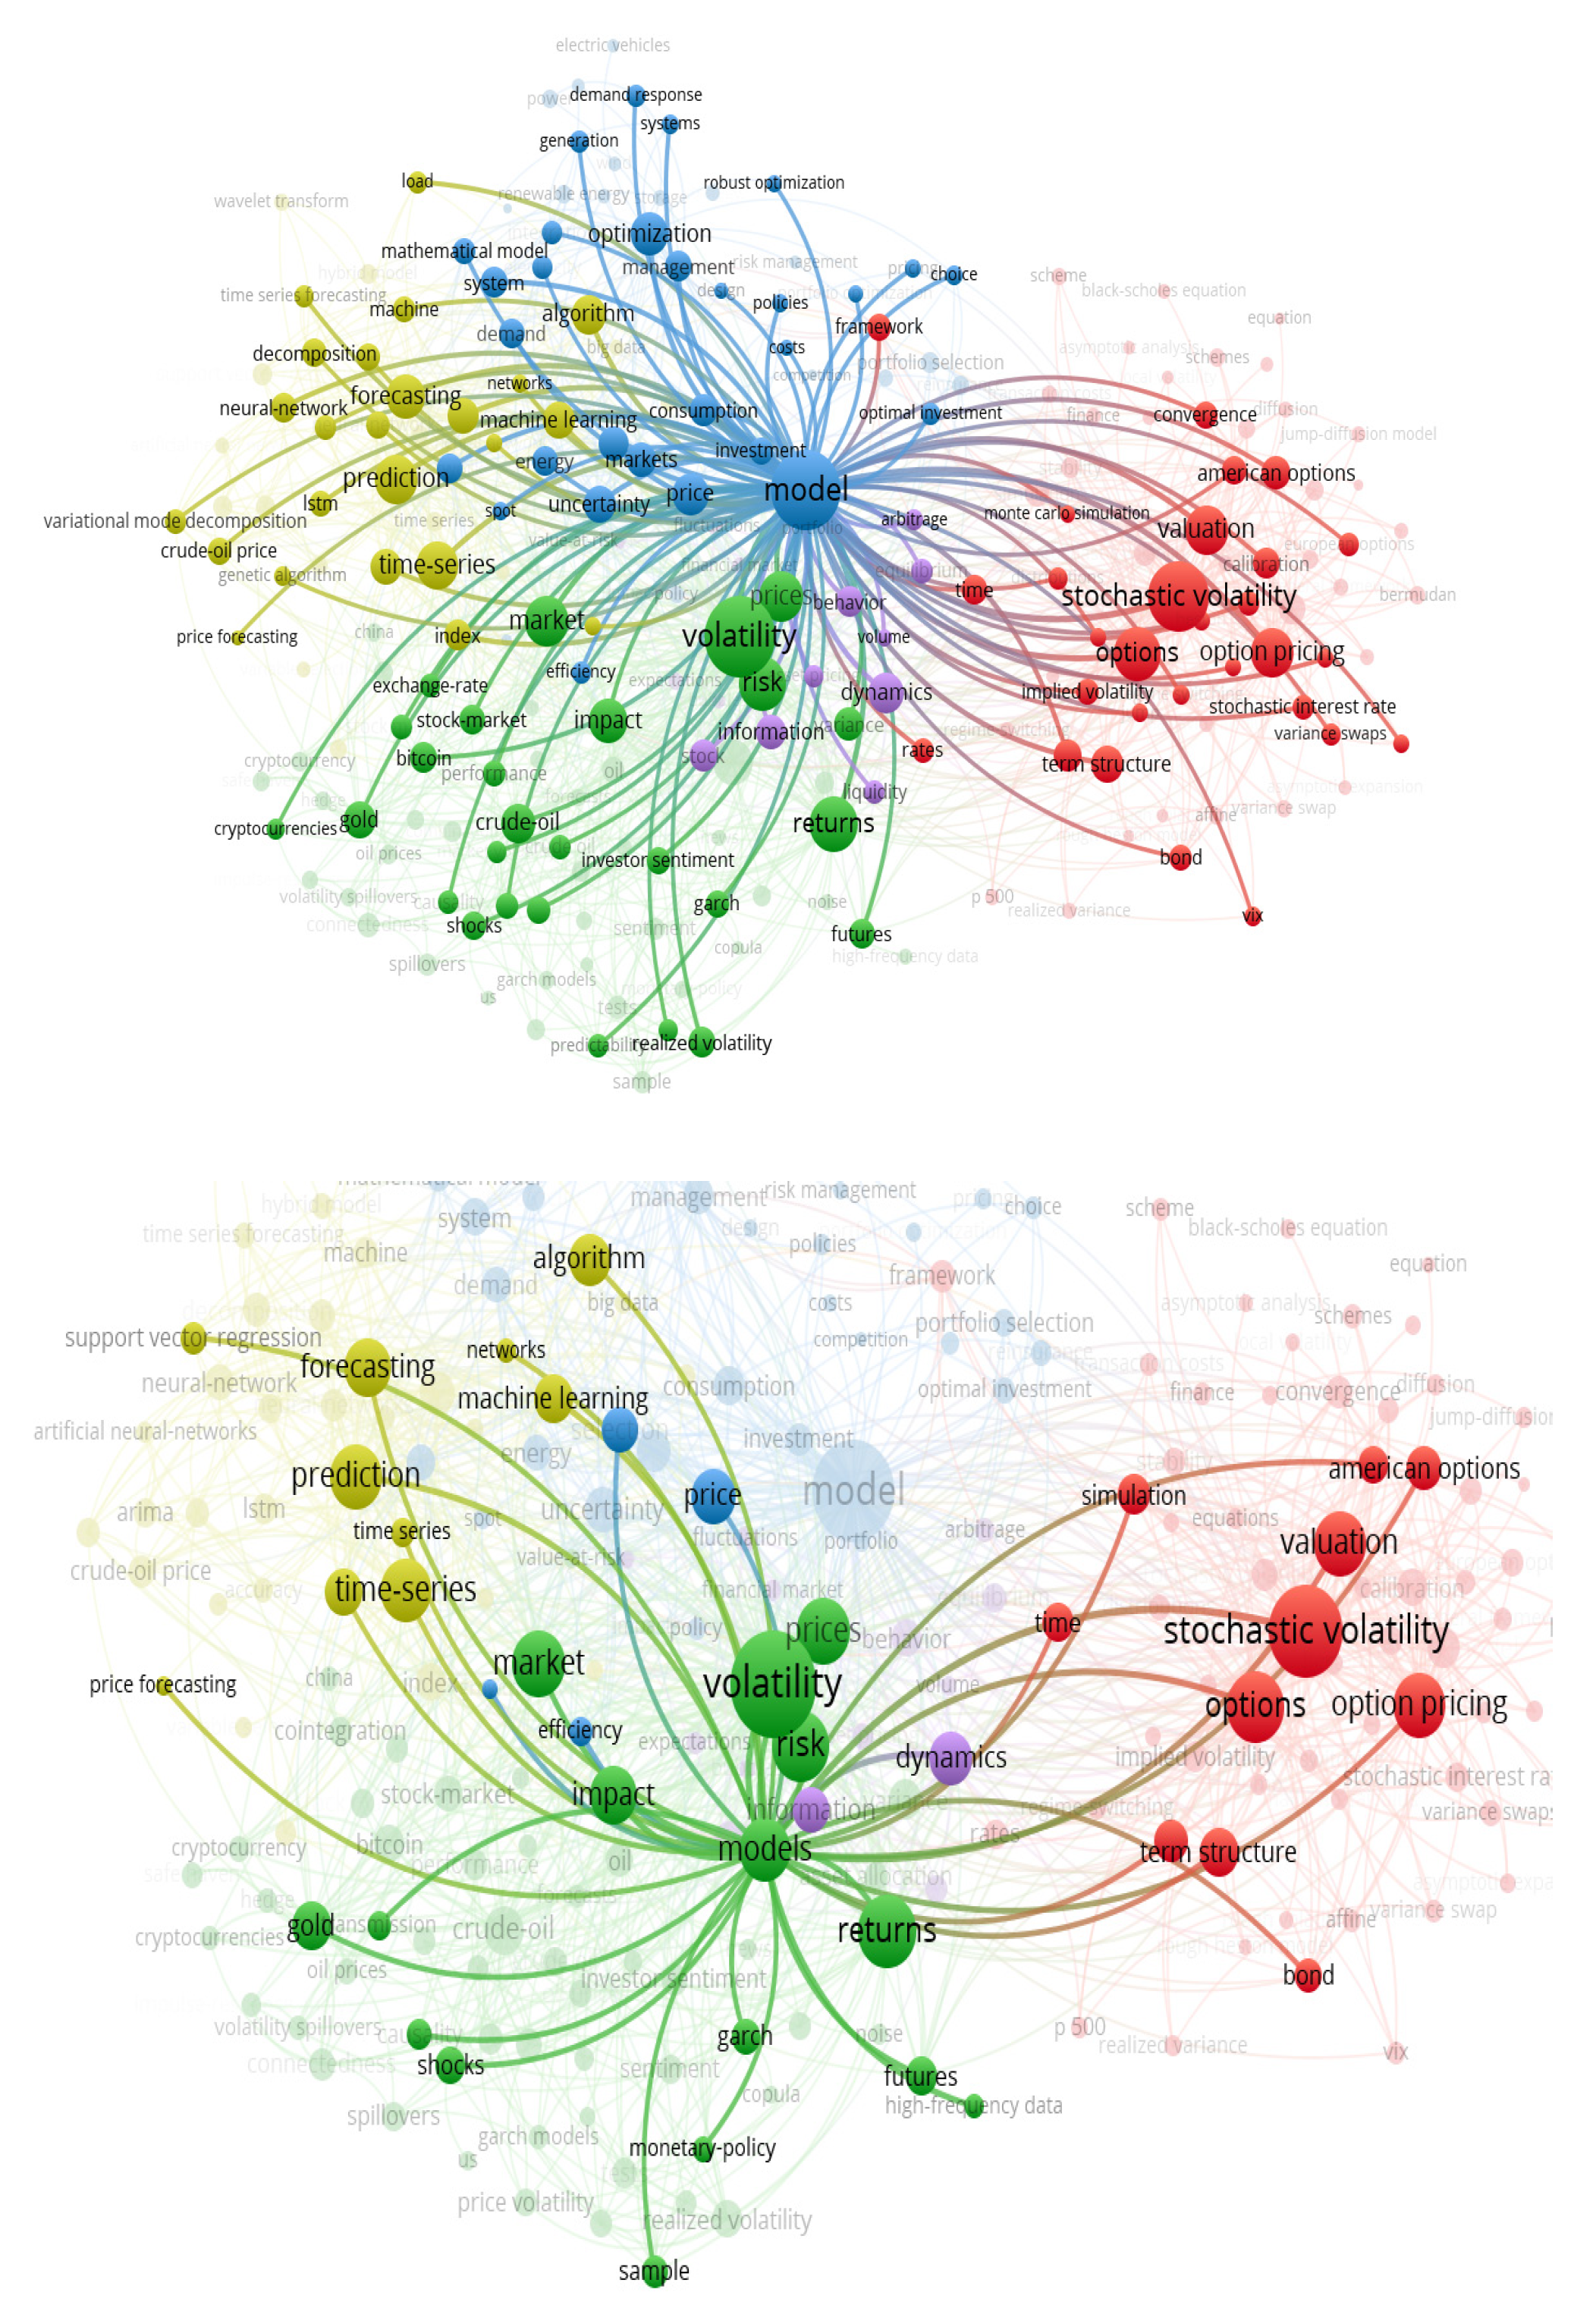
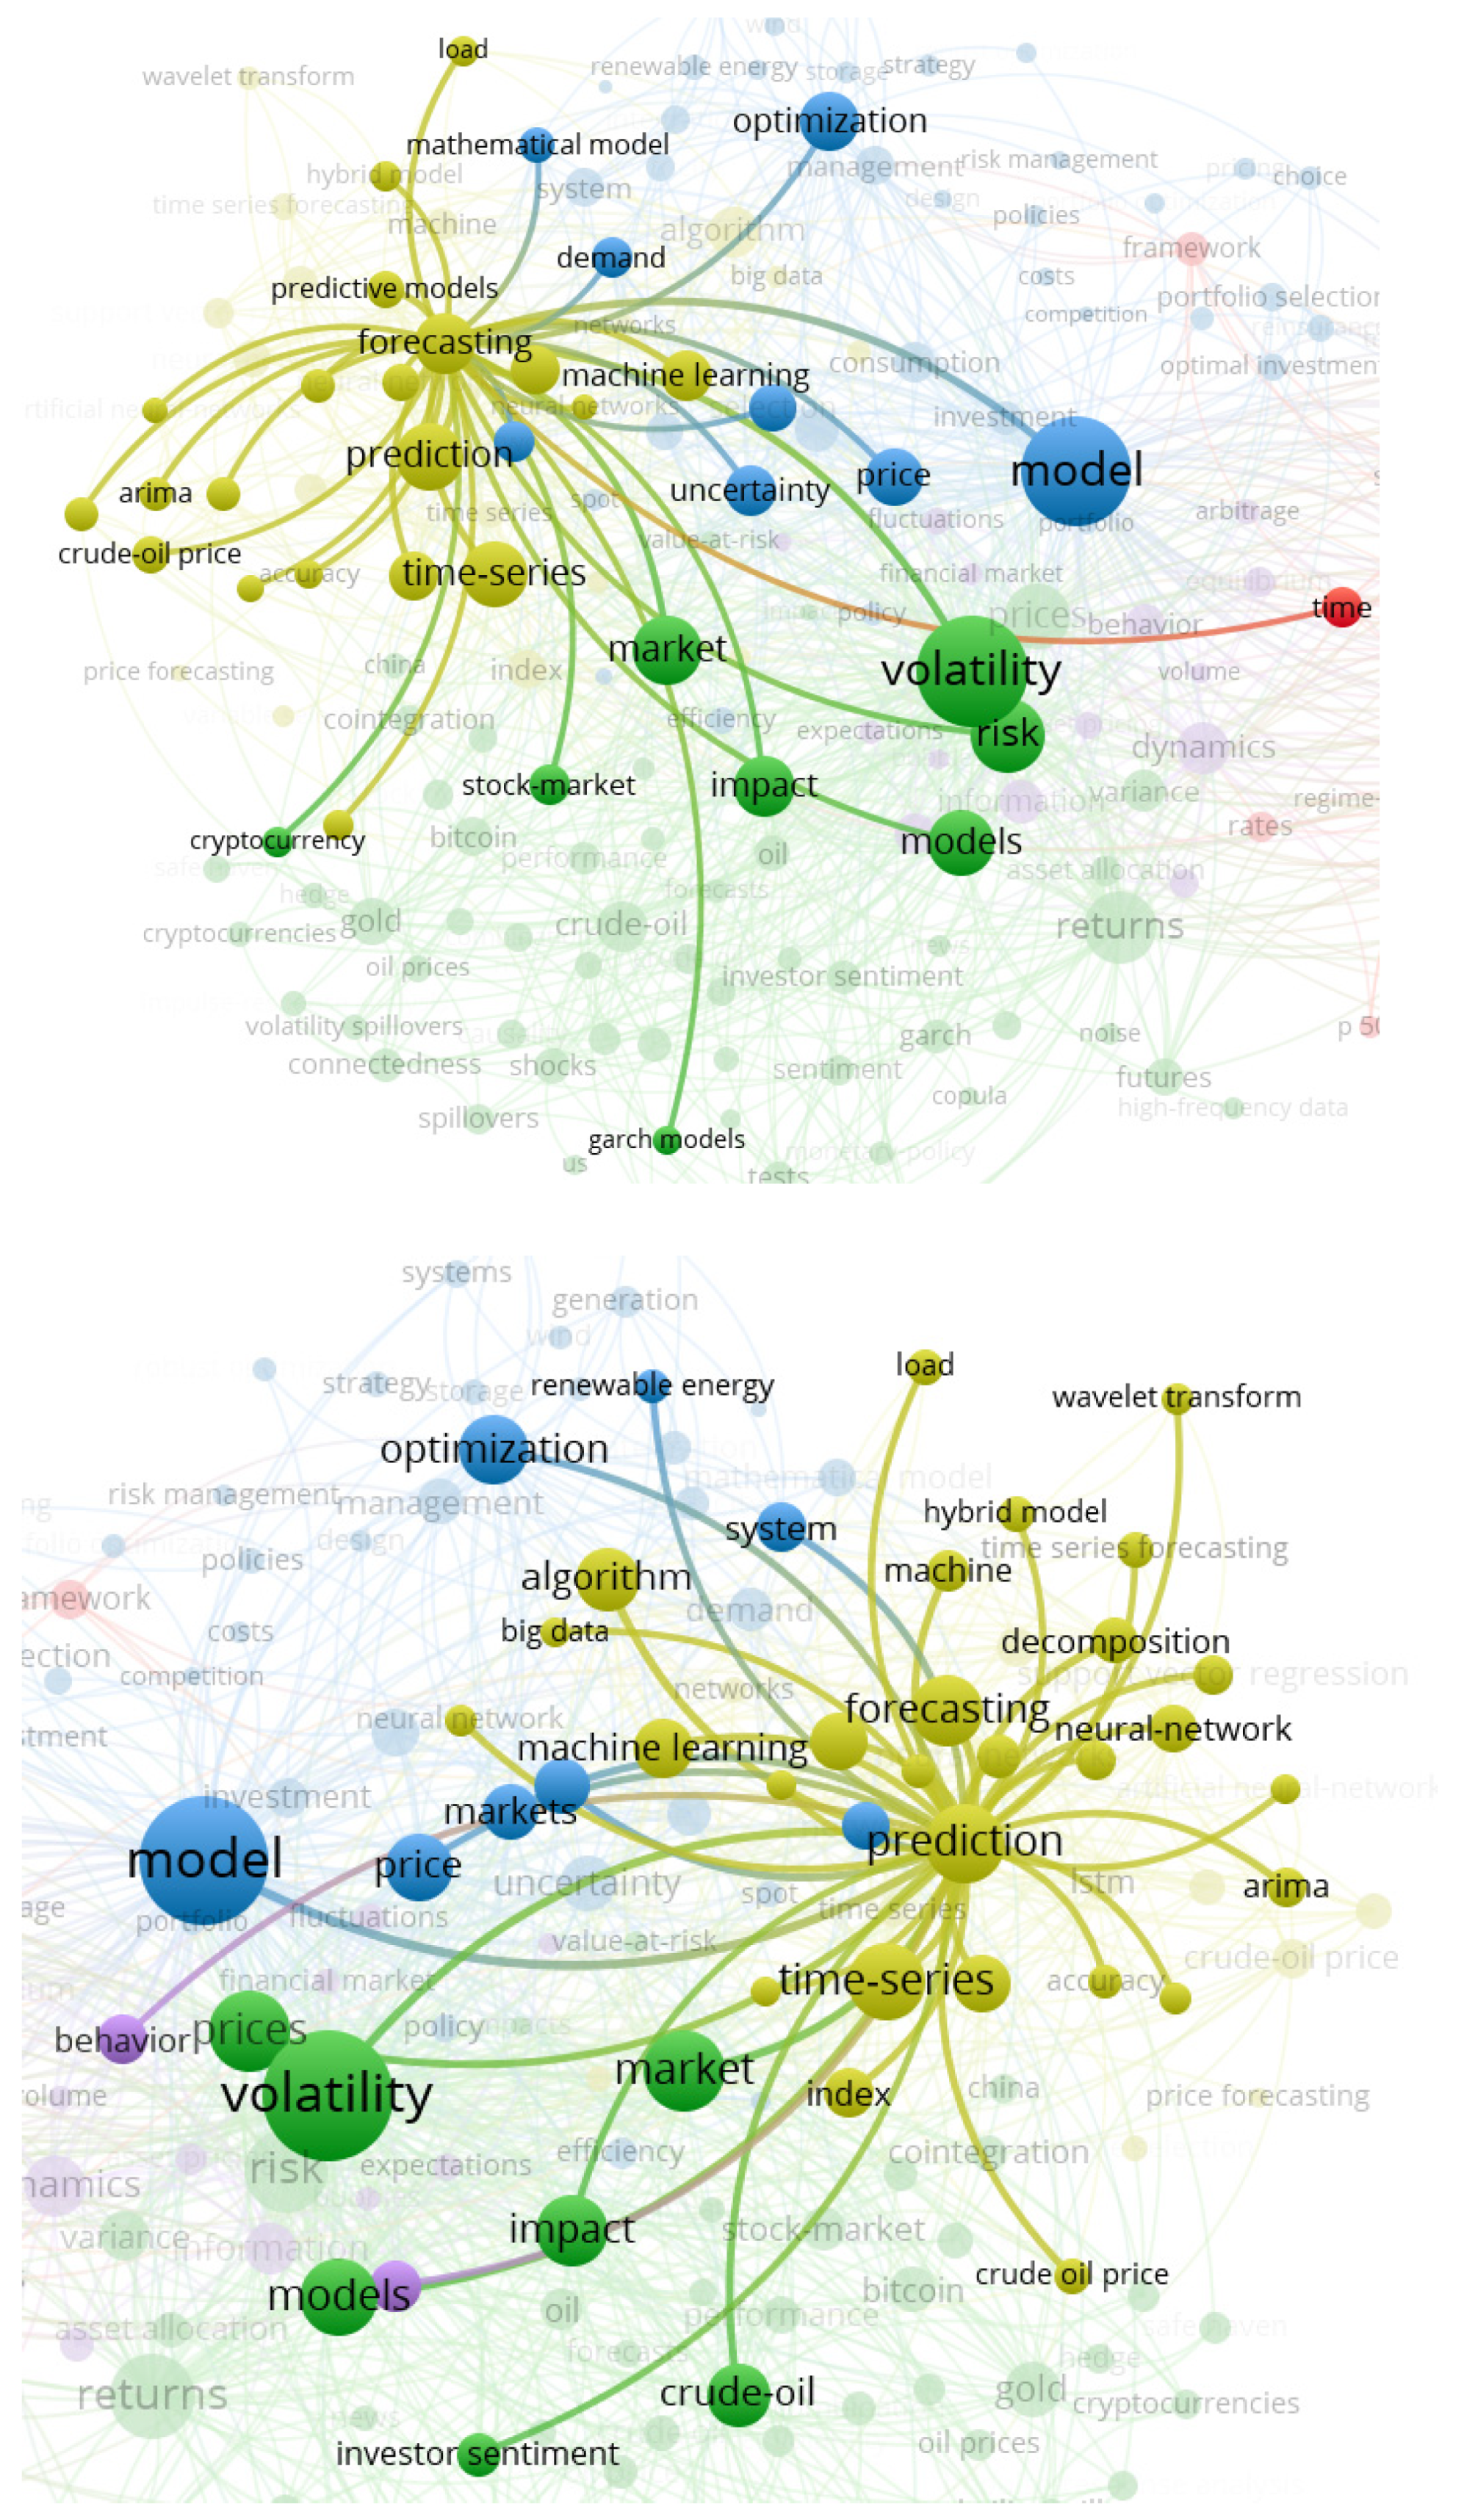
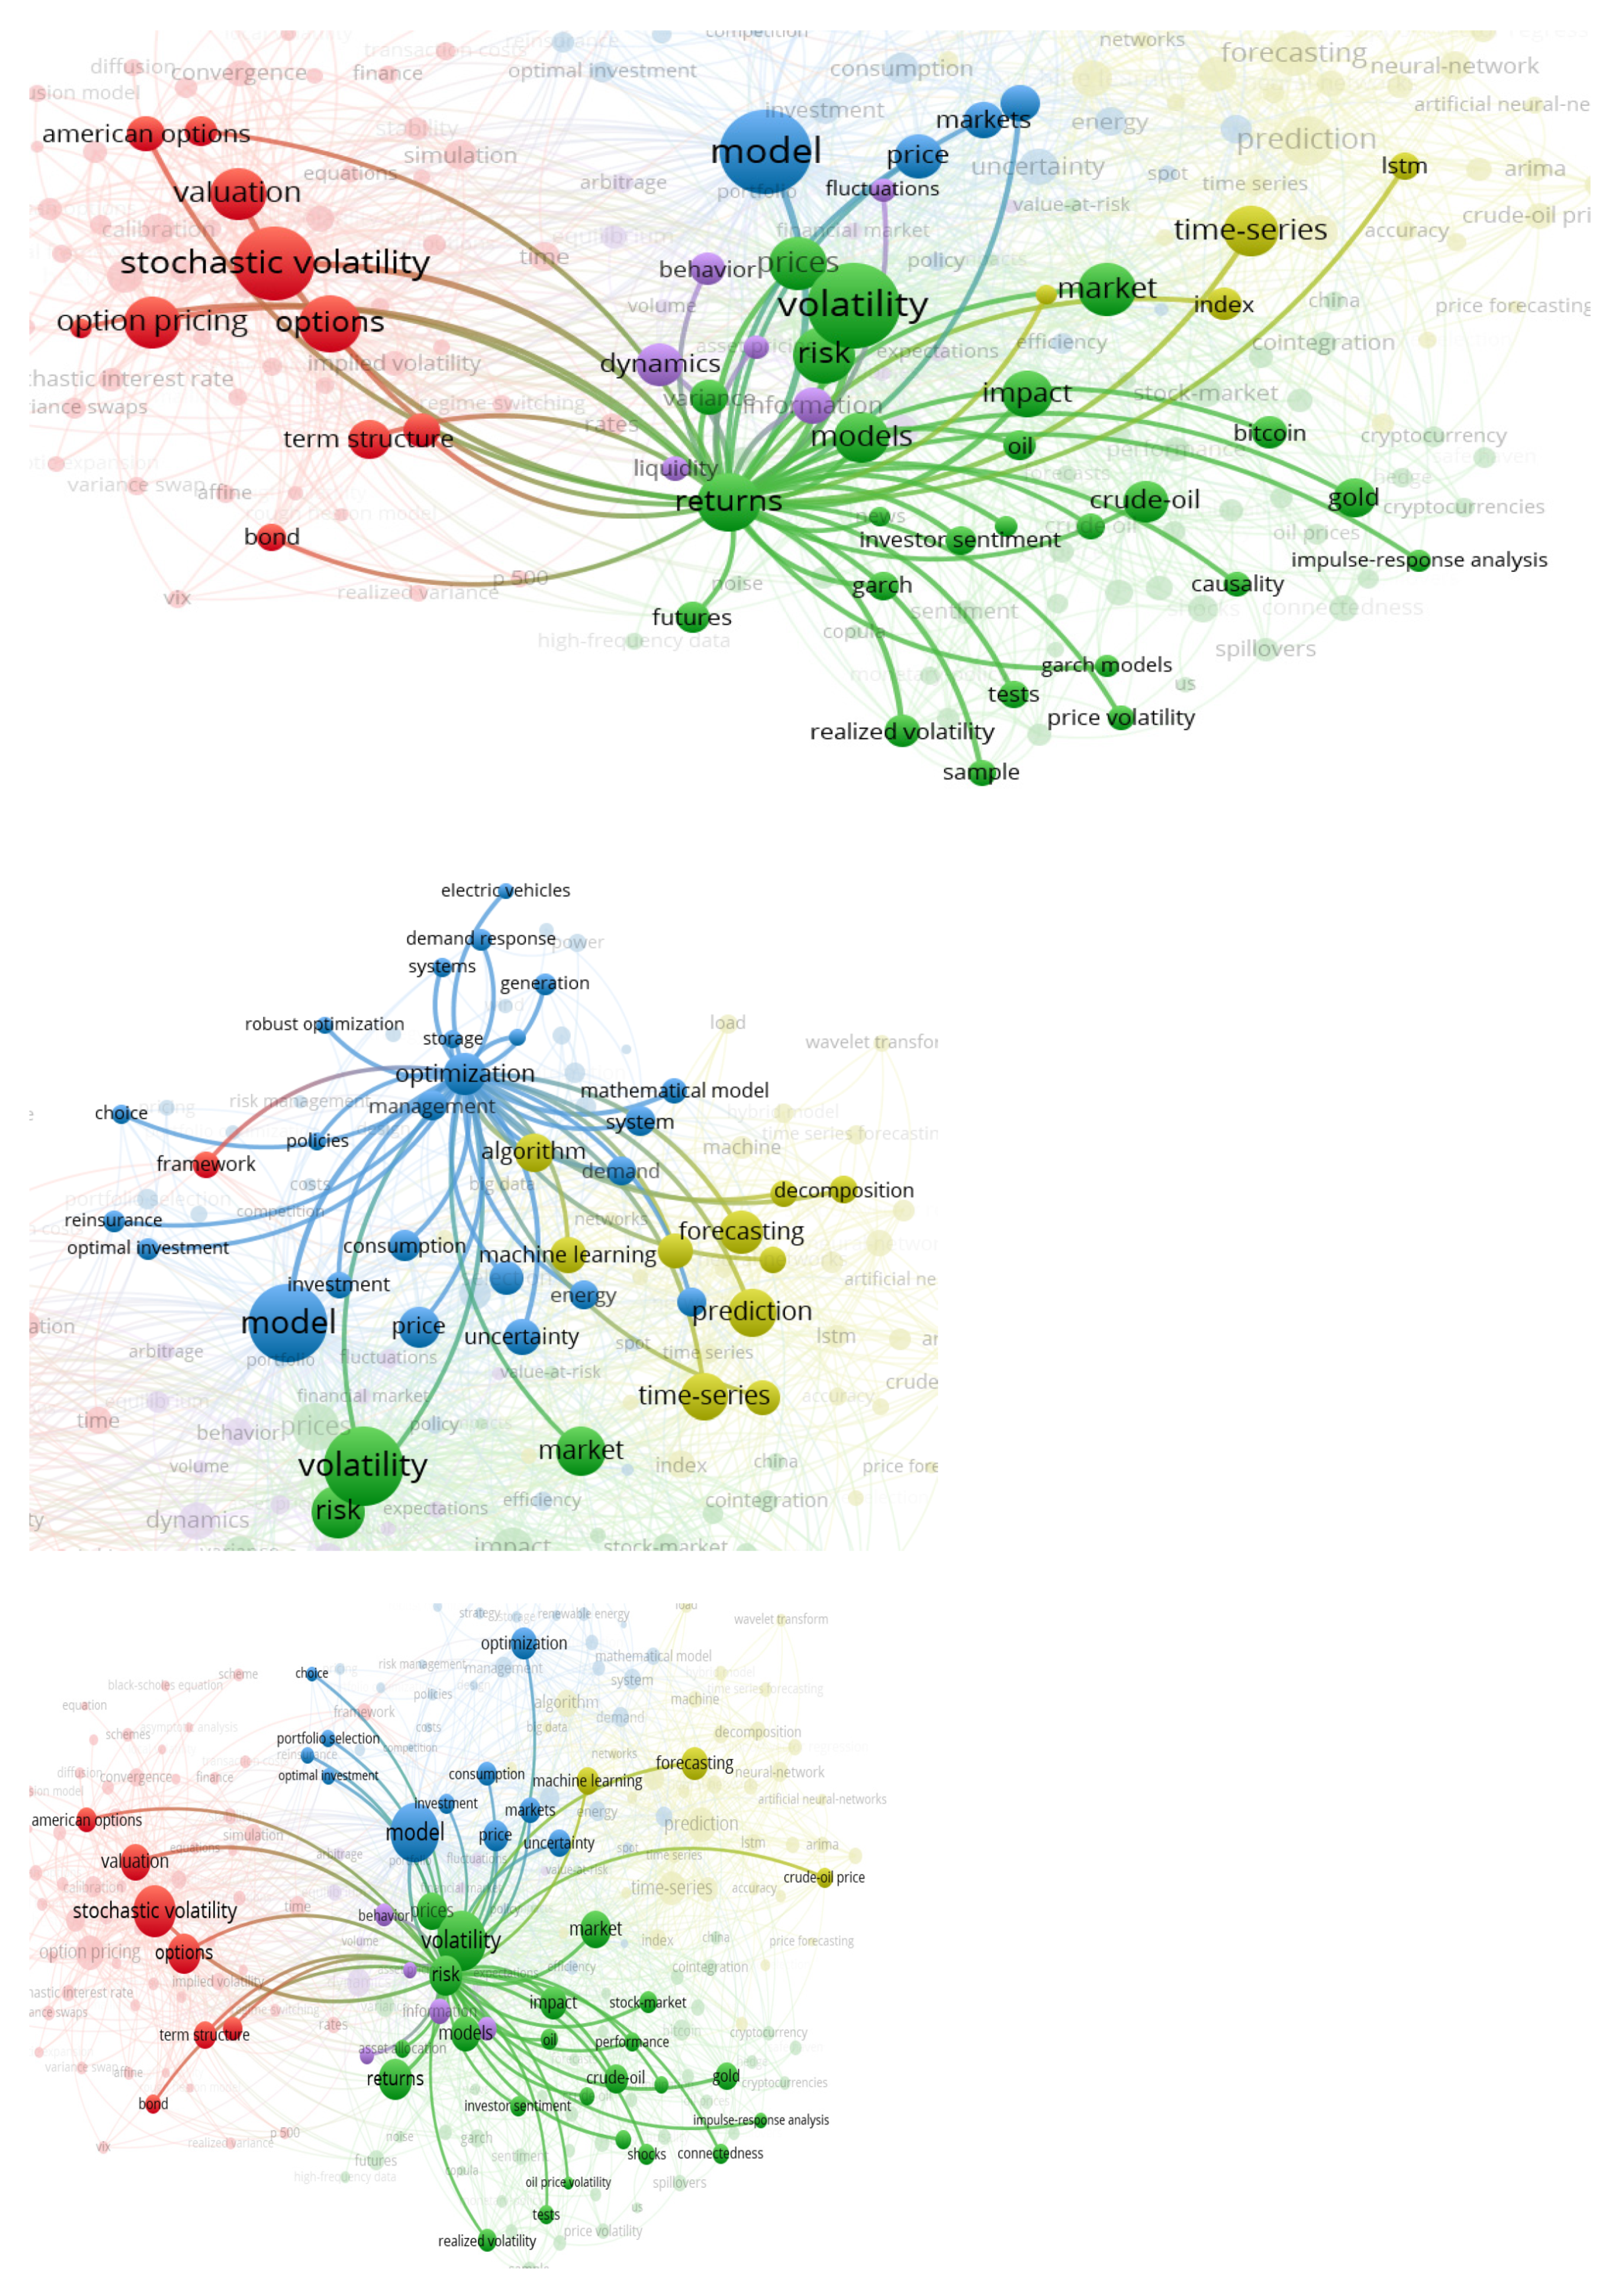
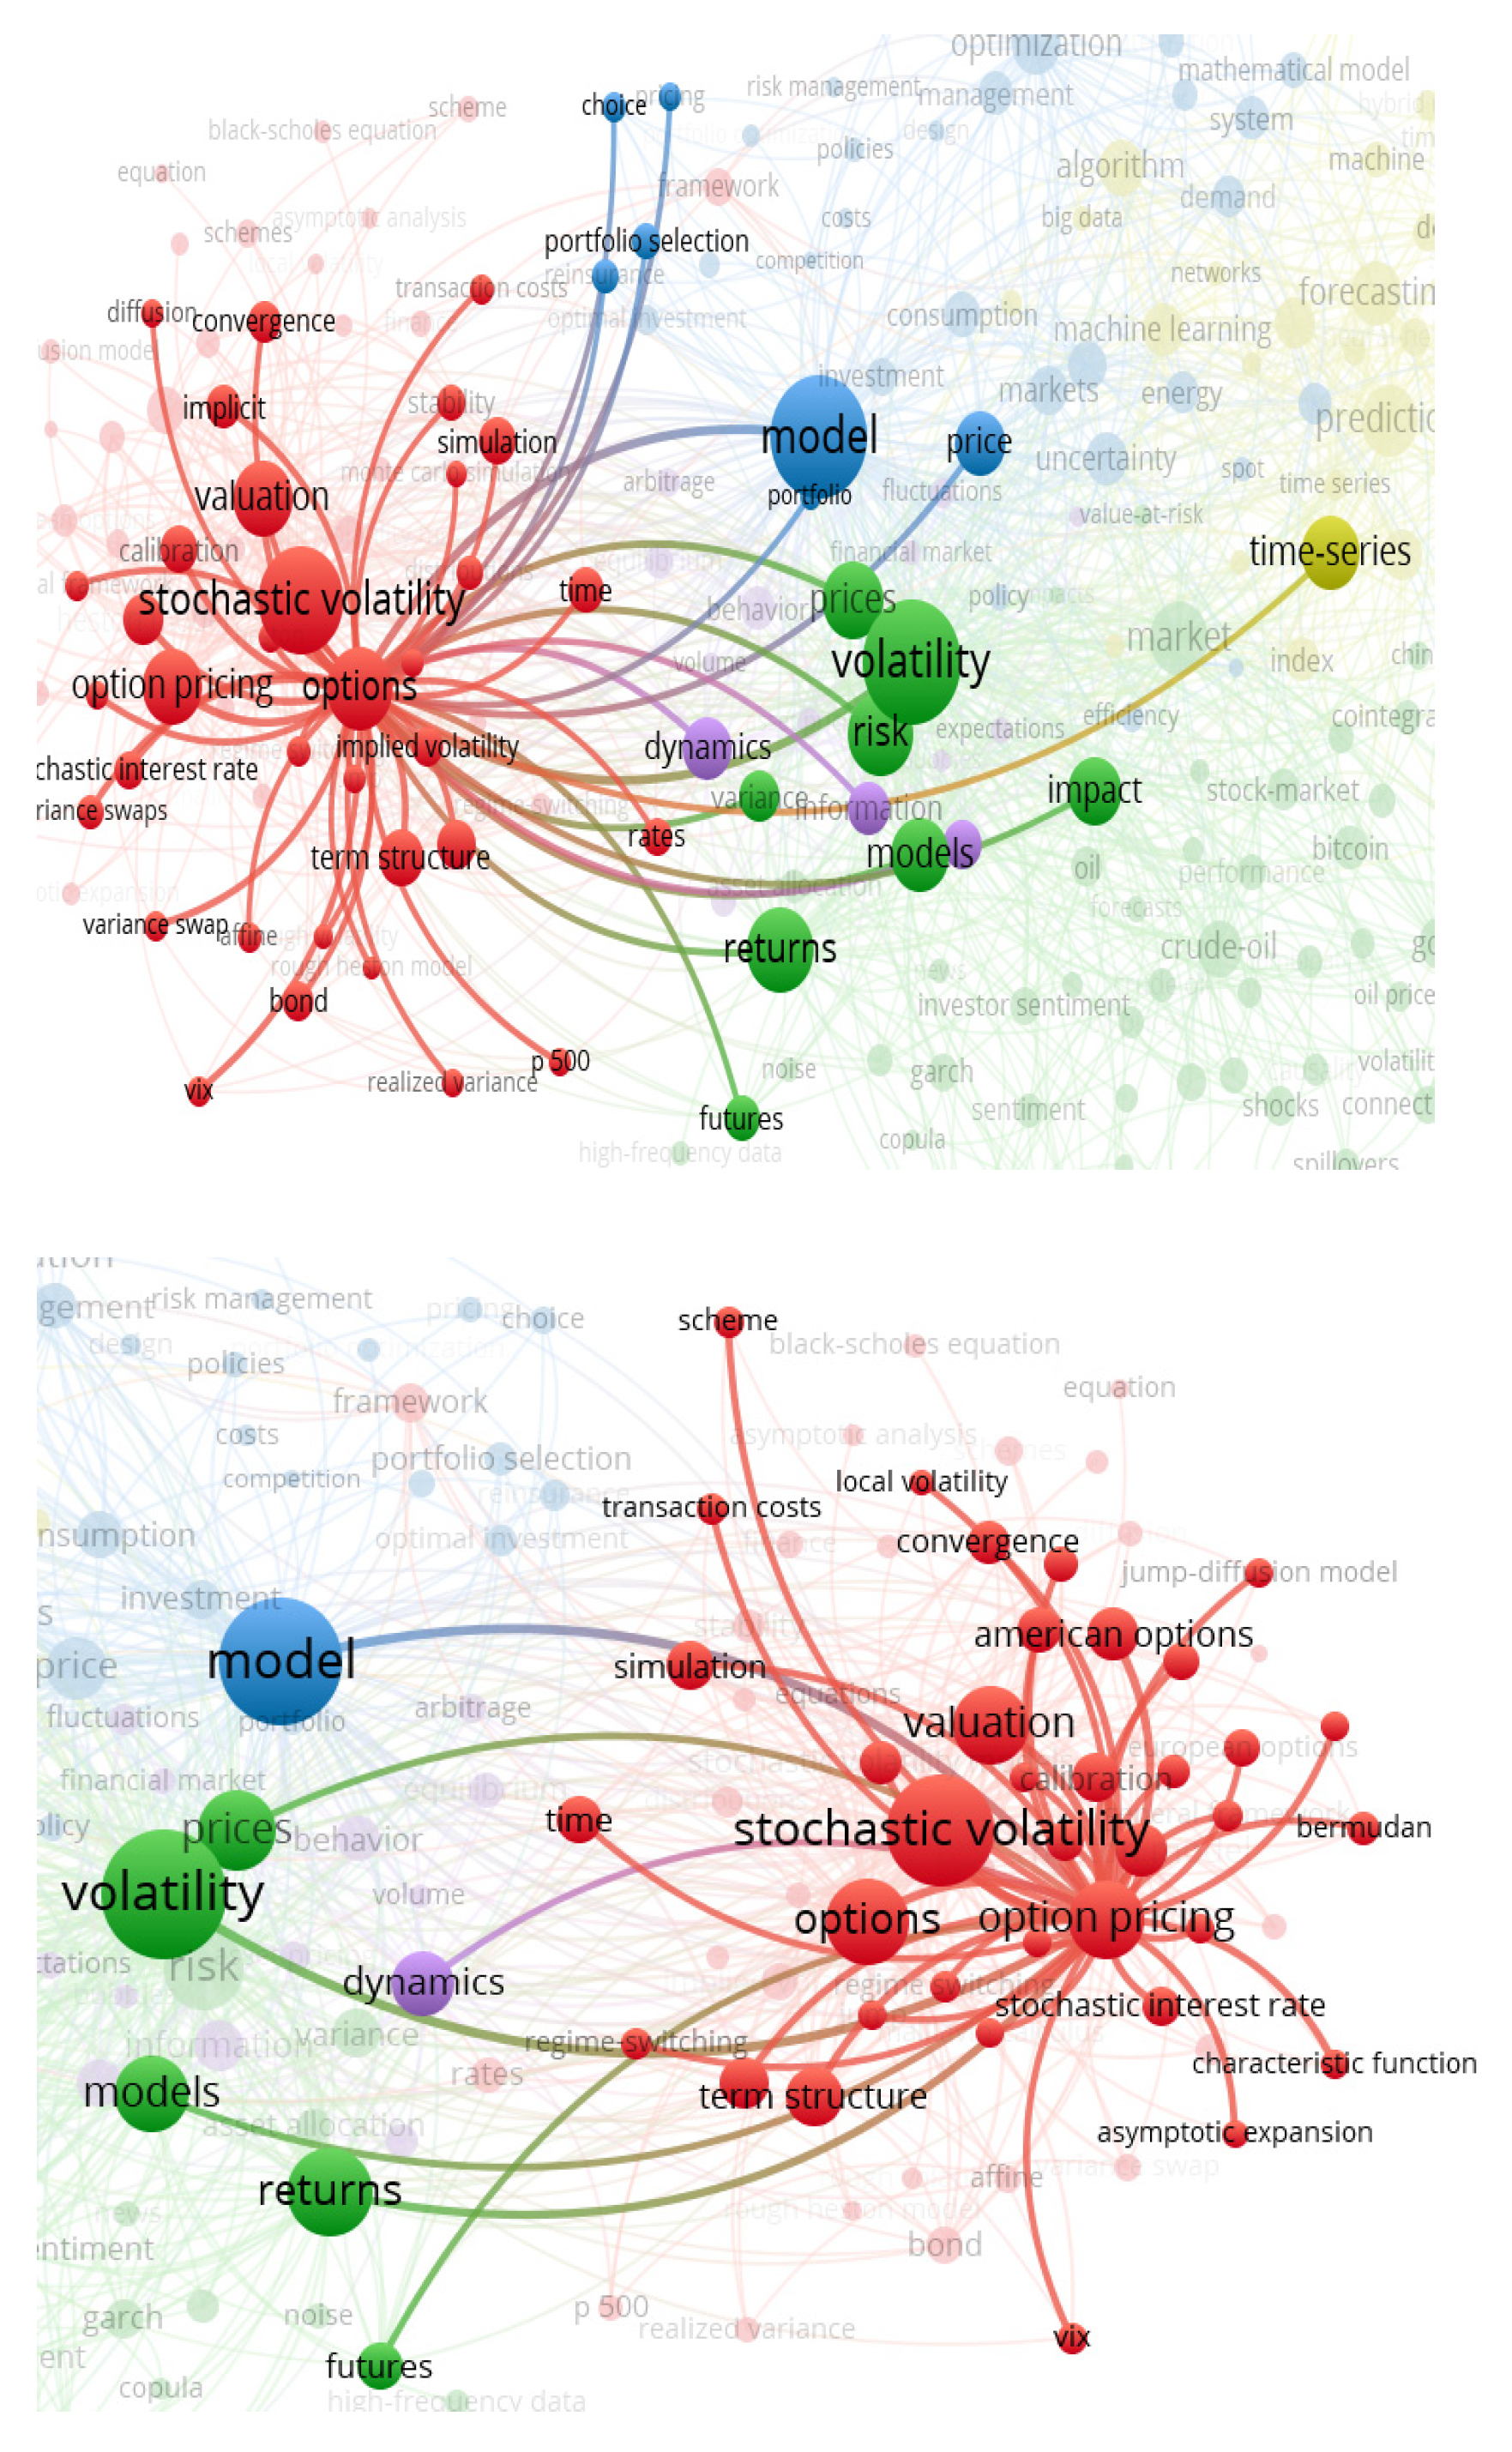
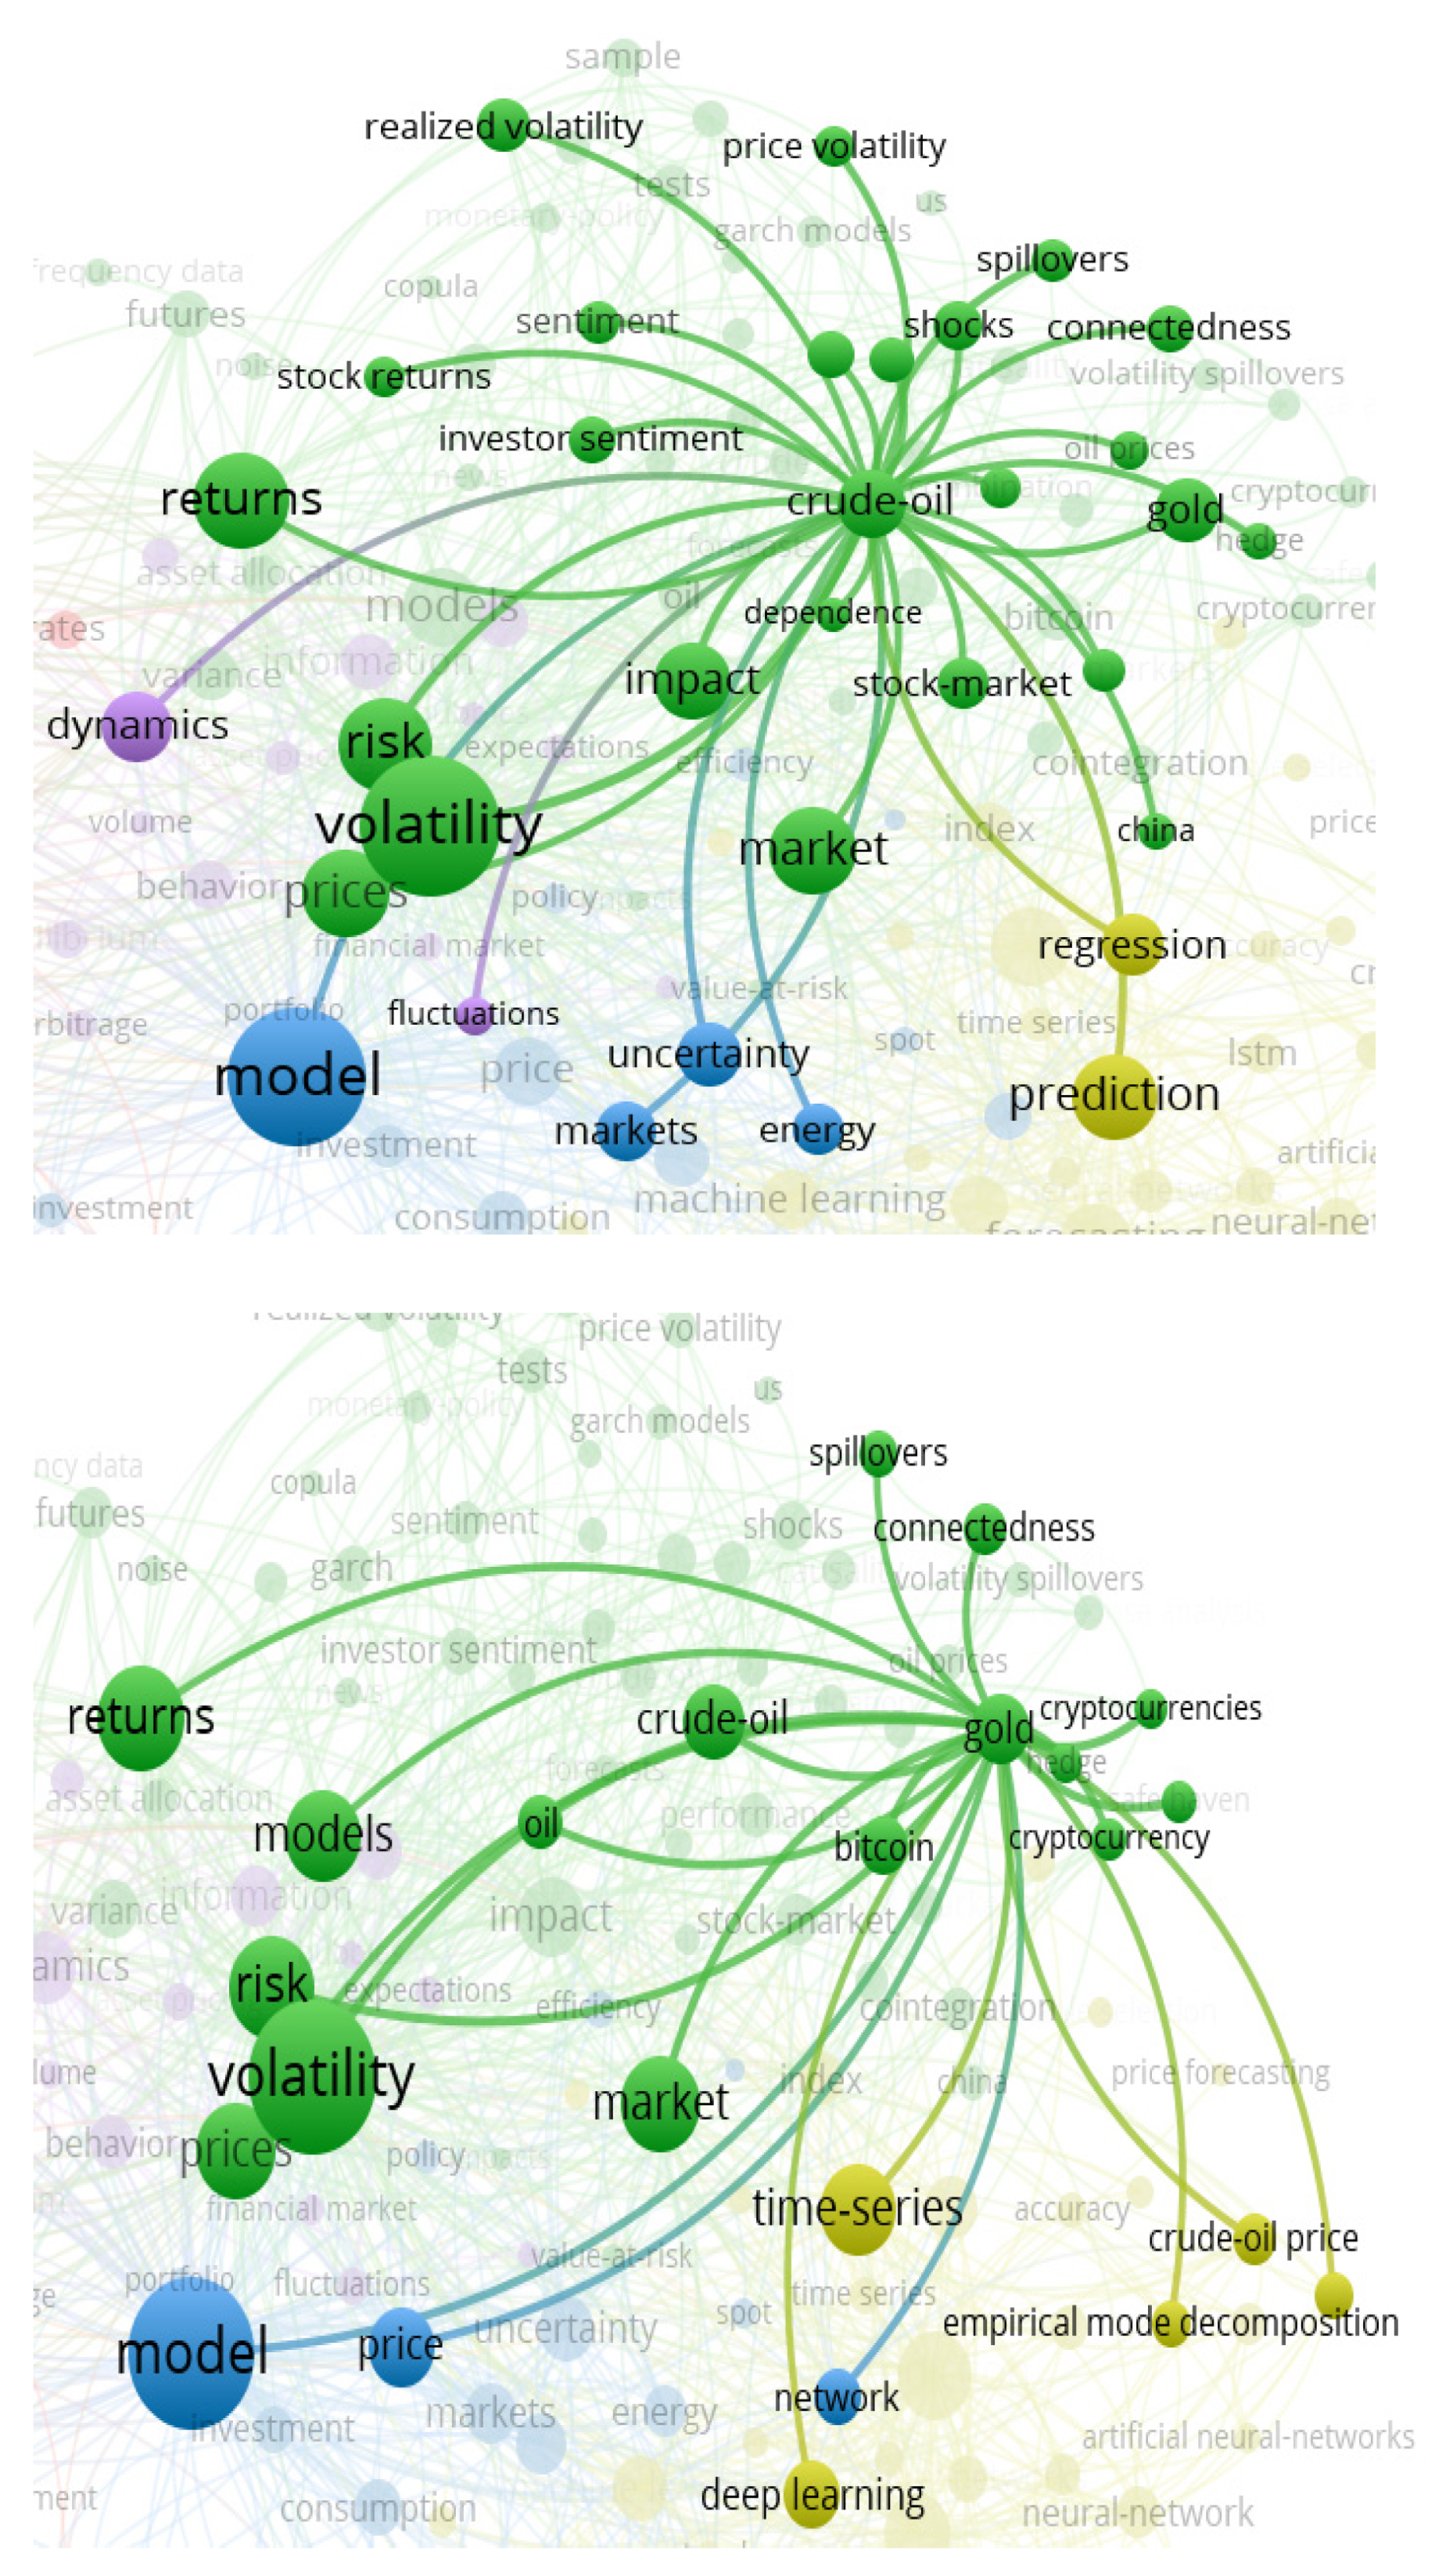
2.3.2. Network Analysis
- 1.
- Volatility and Stochastic Volatility
- 2.
- Model, time-series, and algorithm
- 3.
- Forecasting and Predication
- 4.
- Return, optimization, and risk
- 5.
- Options and option-pricing
- 6.
- Stock, gold, and Crude oil
- 7.
- Research method
3. Main Research Methods and Analysis
3.1. The Prediction Models Based on Econometrics
3.2. Prediction Models Based on Algorithms
3.2.1. Decomposition-Integration Method
3.2.2. Machine Learning Model
3.2.3. Animal Algorithm
- FFO
- 2.
- WOA
4. Analysis of Hybrid Models for Price Forecasting
4.1. Crude Oil Price
4.2. Stock-Market Price
4.3. Cardon Price
4.4. Summary of Modeling Ideas
4.4.1. Decomposition + Machine Learning
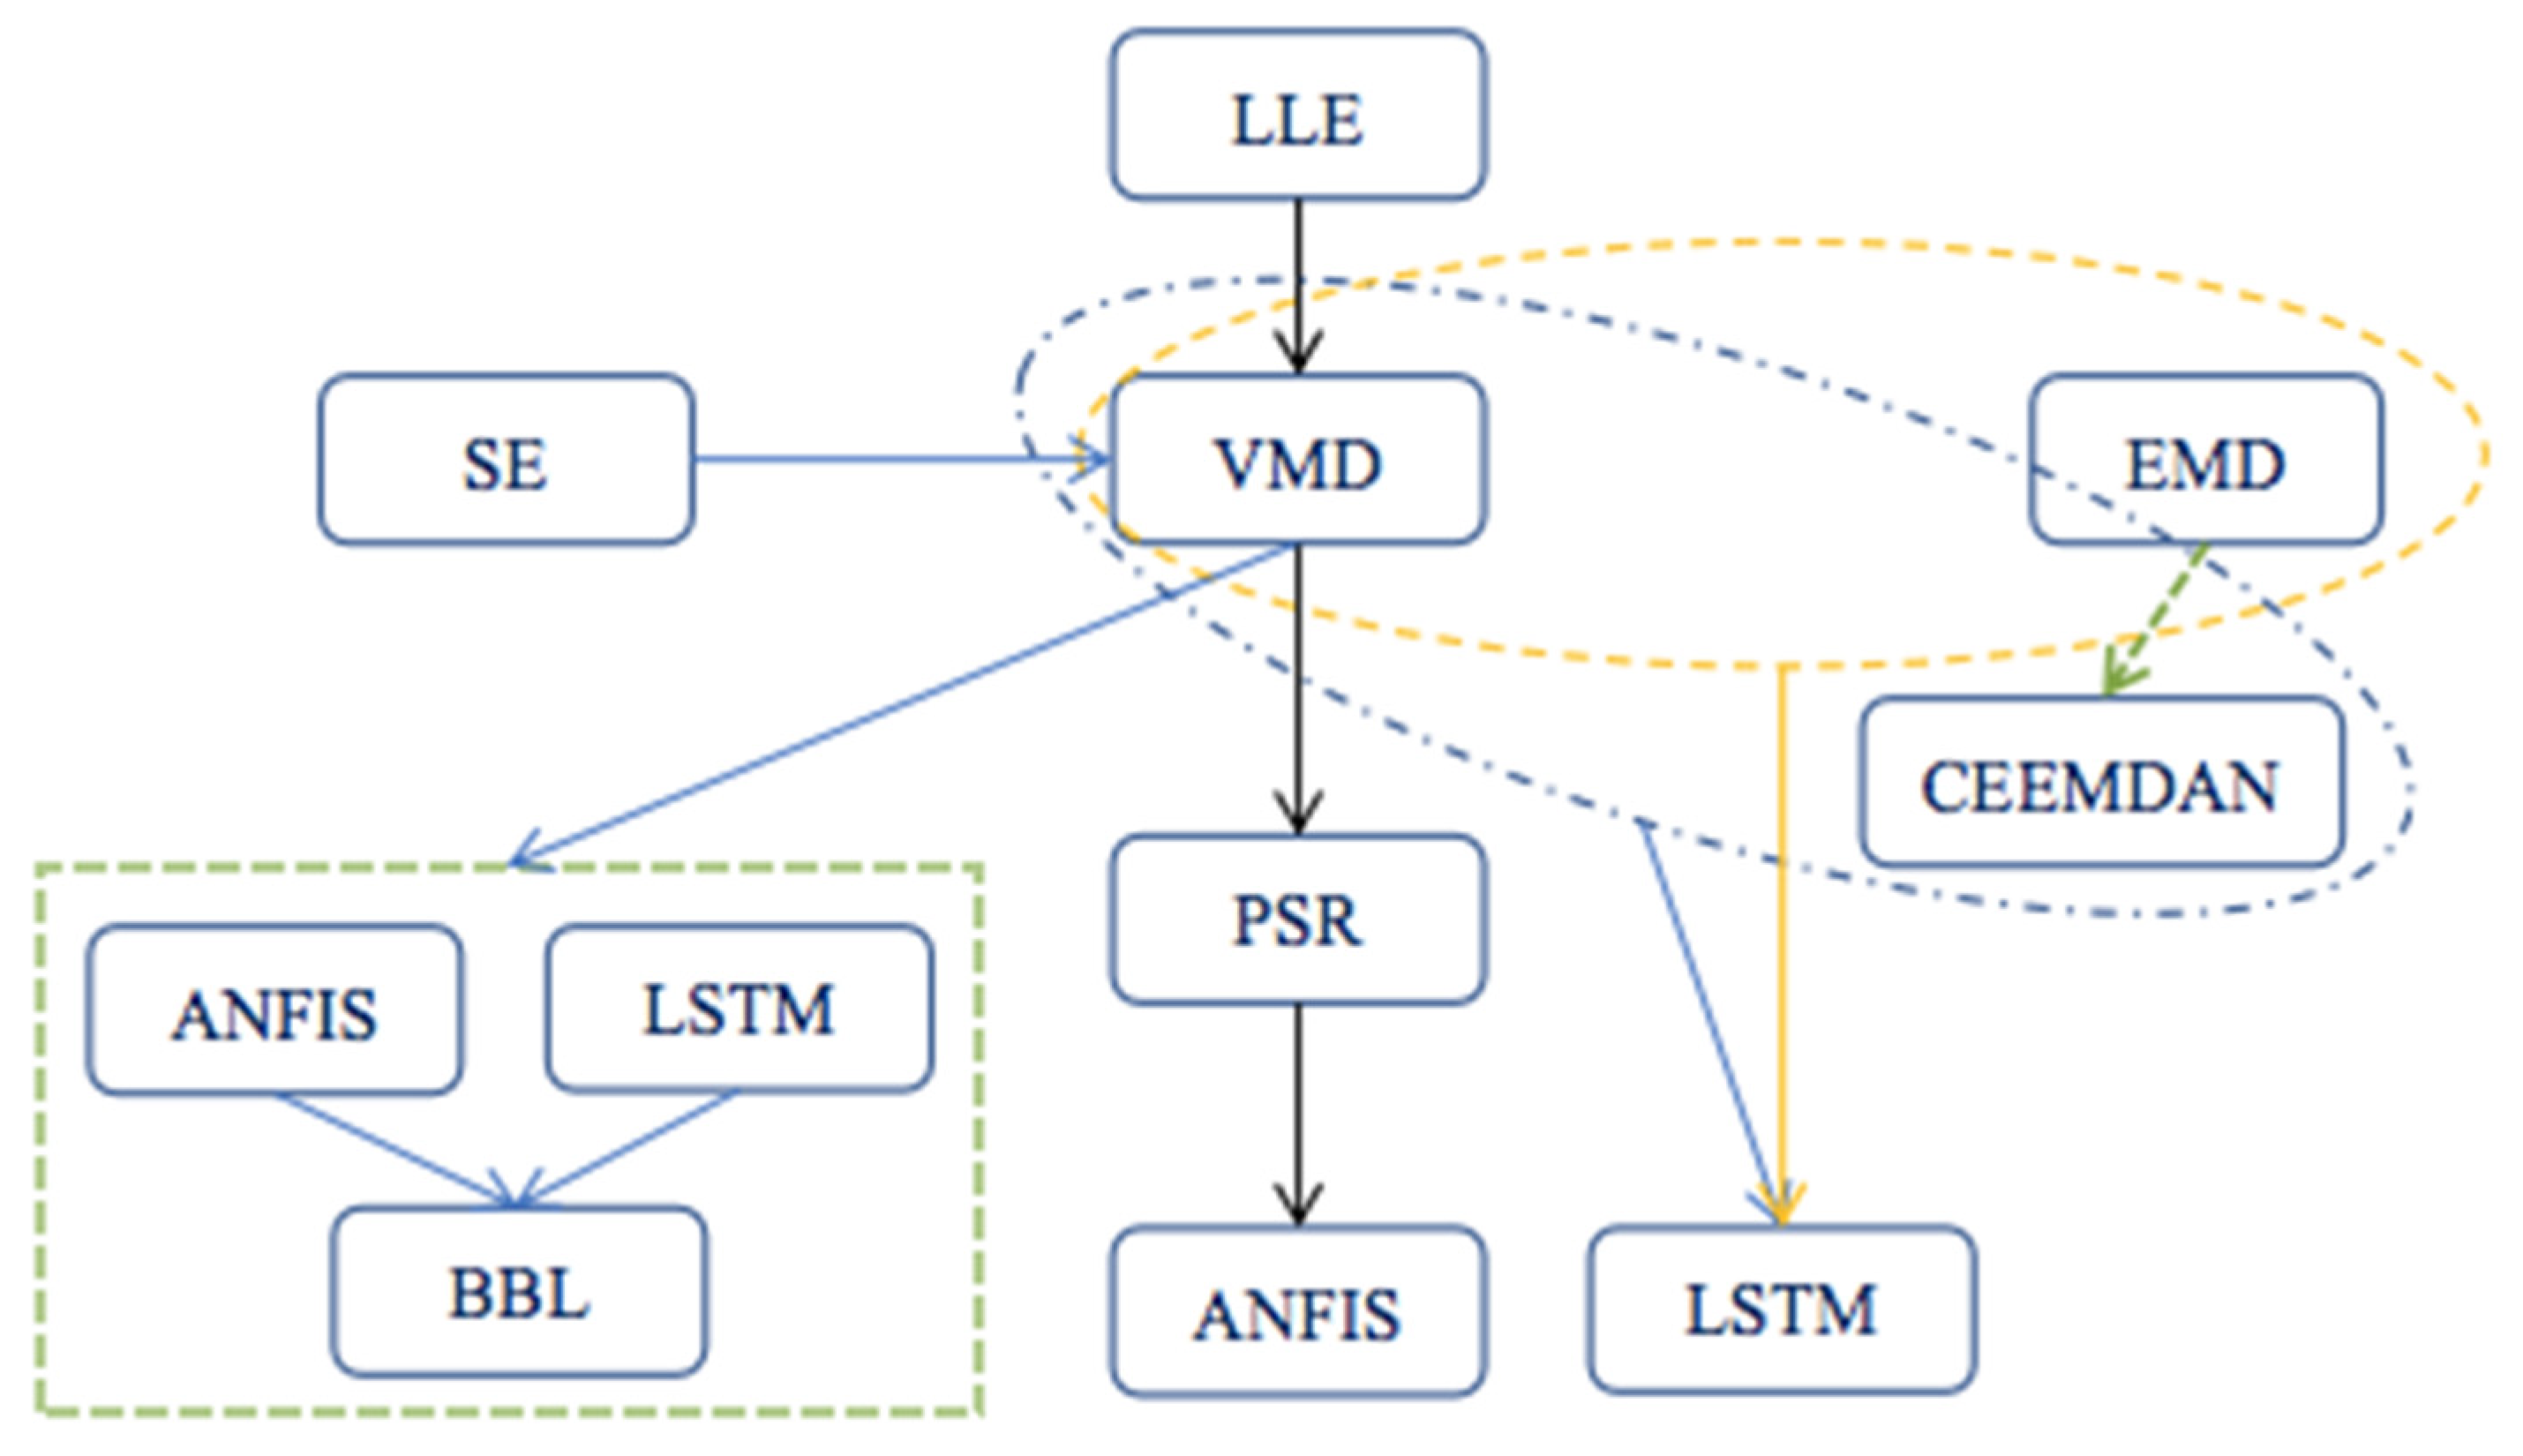
4.4.2. Decomposition + Regression + Machine Learning
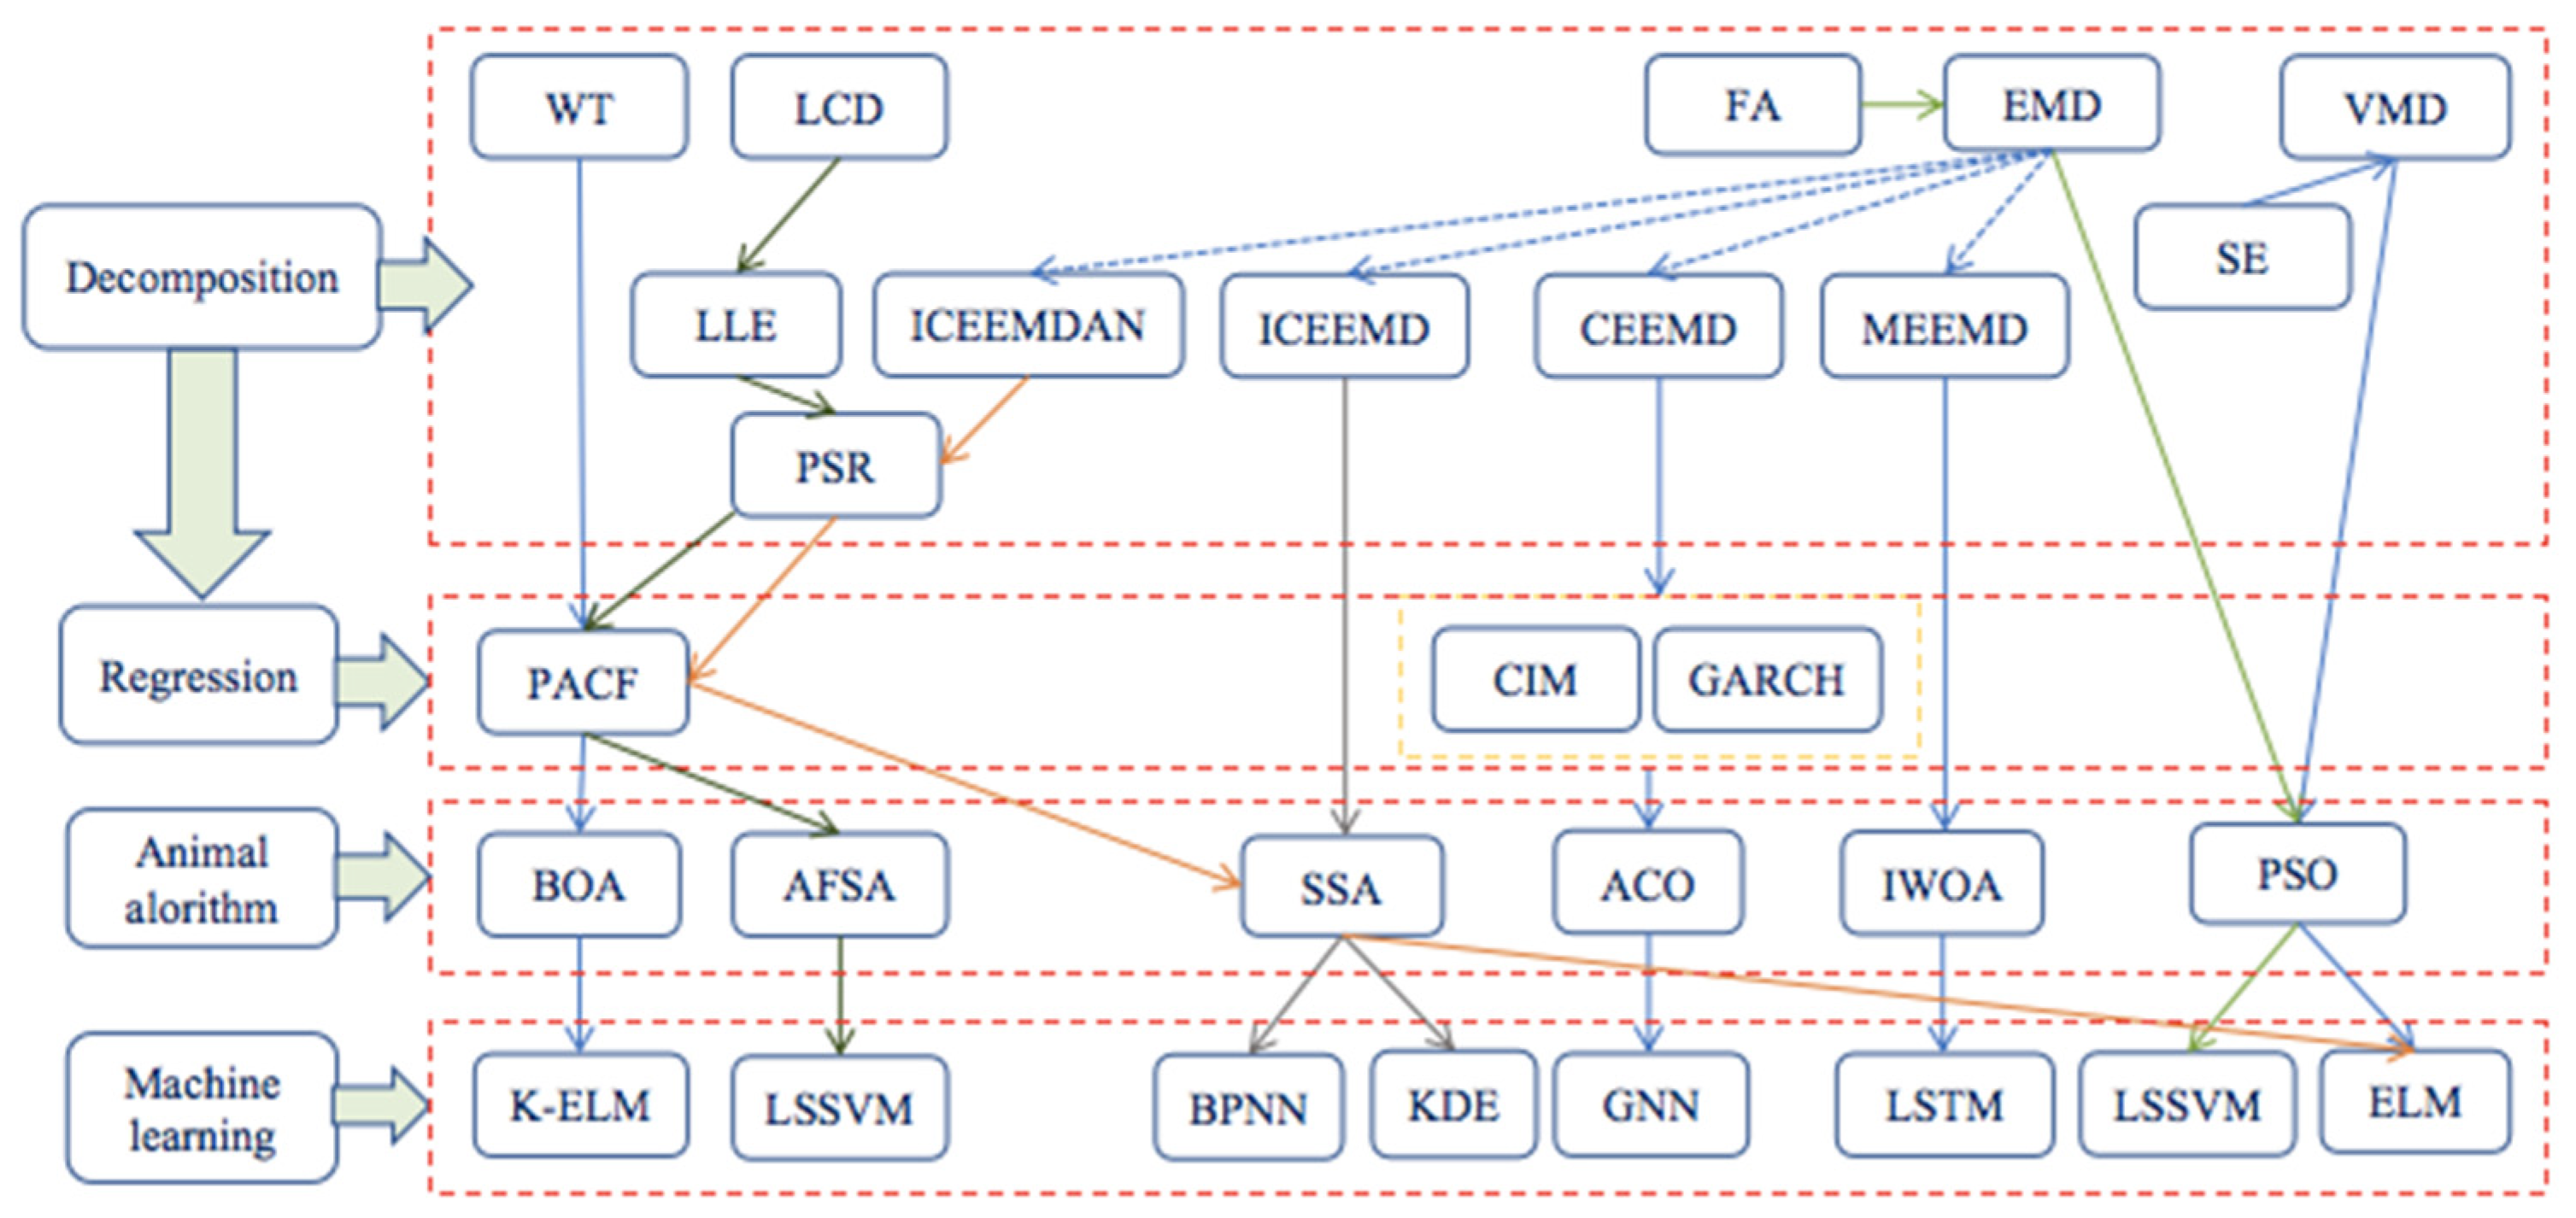
4.4.3. Decomposition + Regression + Animal Algorithm + Machine Learning
5. Research Conclusions and Outlook
Author Contributions
Funding
Institutional Review Board Statement
Informed Consent Statement
Data Availability Statement
Conflicts of Interest
References
- Wu, F.; Ma, J. The equilibrium, complexity analysis and control in epiphytic supply chain with product horizontal diversification. Nonlinear Dyn. 2018, 93, 2145–2158. [Google Scholar] [CrossRef]
- Ma, J.H.; Hou, Y.M.; Yang, W.H.; Tian, Y. A time-based pricing game in a competitive vehicle market regarding the intervention of carbon emission reduction. Energy Policy 2020, 142, 111440. [Google Scholar] [CrossRef]
- Wu, F.; Liu, B.; Fu, N. The complex evolution of information quality improvement in competitive market. RAIRO-Oper. Res. 2023, 57, 351–369. [Google Scholar] [CrossRef]
- Ma, J.; Ren, W. Complexity and Hopf bifurcation analysis on a kind of fractional-order IS-LM macroeconomic system. Int. J. Bifurc. Chaos 2016, 26, 1650181. [Google Scholar] [CrossRef]
- Wu, F.; Ma, J. Research trend, logical structure and outlook on complex economic game. Mathematics 2023, 11, 1179. [Google Scholar] [CrossRef]
- Ma, J.; Zhang, F.; Jiang, H. Dynamic pricing game under different channel power structures in a closed-loop supply chain. Int. J. Bifurc. Chaos 2020, 30, 2050052. [Google Scholar] [CrossRef]
- Ma, J.; Lou, W.; Tian, Y. Bullwhip effect and complexity analysis in a multi-channel supply chain considering price game with discount sensitivity. Int. J. Prod. Res. 2019, 57, 5432–5452. [Google Scholar] [CrossRef]
- Ma, J.; Tian, Y.; Liu, C. Studying the complexity of multichannel supply chain with different power structures under carbon subsidy policy. Int. J. Bifurc. Chaos 2021, 31, 2150166. [Google Scholar] [CrossRef]
- Ma, J.; Hou, Y.; Wang, Z.; Yang, W. Pricing strategy and coordination of automobile manufacturers based on government intervention and carbon emission reduction. Energy Policy 2021, 148, 111919. [Google Scholar] [CrossRef]
- Fan, X.; Li, S.; Tian, L. Chaotic characteristic identification for carbon price and an multi-layer perceptron network prediction model. Expert Syst. Appl. 2015, 42, 3945–3952. [Google Scholar] [CrossRef]
- Wang, M.; Zhao, L.; Du, R.; Wang, C.; Chen, L.; Tian, L.; Stanley, H.E. A novel hybrid method of forecasting crude oil prices using complex network science and artificial intelligence algorithms. Appl. Energy 2018, 220, 480–495. [Google Scholar] [CrossRef]
- Wu, F.; Ma, J.; Li, Y. Complex fluctuation of power price in dual-channel and multienergy supply chain based on sticky expectation. Int. J. Bifurc. Chaos Appl. Sci. Eng. 2021, 14, 2150206. [Google Scholar] [CrossRef]
- Rehman, S.U.; Tu, S.; Waqas, M.; Huang, Y.; Rehman, O.U.; Ahmad, B.; Ahmad, S. unsupervised pre-trained filter learning approach for efficient convolution neural network. Neurocomputing 2019, 365, 171–191. [Google Scholar] [CrossRef]
- Chen, P.; Vivian, A.; Ye, C. Forecasting carbon futures price: A hybrid method incorporating fuzzy entropy and extreme learning machine. Ann. Oper. Res. 2022, 313, 559–601. [Google Scholar] [CrossRef]
- Liu, J.; Wang, P.; Chen, H.; Zhu, J. A combination forecasting model based on hybrid interval multi-scale decomposition: Application to interval-valued carbon price forecasting. Expert Syst. Appl. 2022, 191, 116267. [Google Scholar] [CrossRef]
- Mahmoodi, A.; Hashemi, L.; Jasemi, M.; Mehraban, S.; Laliberté, J.; Millar, R.C. A developed stock price forecasting model using support vector machine combined with metaheuristic algorithms. OPSEARCH 2022, 60, 59–86. [Google Scholar] [CrossRef]
- Khalfaoui, R.; Sarwar, S.; Tiwari, A.K. Analysing volatility spillover between the oil market and the stock market in oil-importing and oil-exporting countries: Implications on portfolio management. Resour. Policy 2019, 62, 22–32. [Google Scholar] [CrossRef]
- Wen, X.; Cheng, H. Which is the safe haven for emerging stock markets, gold or the US dollar? Emerg. Mark. Rev. 2018, 35, 69–90. [Google Scholar] [CrossRef]
- Choudhry, T.; Hassan, S.S.; Shabi, S. Relationship between gold and stock markets during the global financial crisis: Evidence from nonlinear causality tests. Int. Rev. Financ. Anal. 2015, 41, 247–256. [Google Scholar] [CrossRef]
- Shahzad, S.; Raza, N.; Shahbaz, M.; Ali, A. Dependence of stock markets with gold and bonds under bullish and bearish market states. Resour. Policy 2017, 52, 308–319. [Google Scholar] [CrossRef]
- Iqbal, J. Does gold hedge stock market, inflation and exchange rate risks? an econometric investigation. Int. Rev. Econ. Financ. 2017, 48, 1–17. [Google Scholar] [CrossRef]
- Wen, F.; Xiao, J.; Huang, C.; Xia, X. Interaction between oil and US dollar exchange rate: Nonlinear causality, time-varying influence and structural breaks in volatility. Appl. Econ. 2017, 50, 1–16. [Google Scholar] [CrossRef]
- Baek, E. Bitcoins as an investment or speculative vehicle? a first look. Appl. Econ. Lett. 2015, 22, 30–34. [Google Scholar] [CrossRef]
- Al-Yahyaee, K.H.; Mensi, W.; Yoon, S.M. Efficiency, multifractality, and the long-memory property of the bitcoin market: A comparative analysis with stock, currency, and gold markets. Financ. Res. Lett. 2018, 27, 228–234. [Google Scholar] [CrossRef]
- Alvarez-Ramirez, J.; Rodriguez, E.; Ibarra-Valdez, C. Long-range correlations and asymmetry in the bitcoin market. Phys. A: Stat. Mech. Its Appl. 2018, 492, 948–955. [Google Scholar] [CrossRef]
- Wu, L.; Chen, S. Long memory and efficiency of bitcoin under heavy tails. Appl. Econ. 2022, 52, 5298–5309. [Google Scholar] [CrossRef]
- Demir, E.; Simonyan, S.; García-Gómez, C.-D.; Lau, C.K.M. The asymmetric effect of bitcoin on altcoins: Evidence from the nonlinear autoregressive distributed lag (nardl) model. Financ. Res. Lett. 2021, 40, 101754. [Google Scholar] [CrossRef]
- Kim, J.; Kim, S.; Kim, S. On the Relationship of cryptocurrency price with US stock and gold price using copula models. Mathematics 2020, 8, 1859. [Google Scholar] [CrossRef]
- Zhang, J.; He, Q. Dynamic Cross-market volatility spillover based on MSV model: Evidence from Bitcoin, Gold, Crude Oil, and Stock Markets. Complexity 2021, 2021, 1–8. [Google Scholar] [CrossRef]
- Bildirici, M.; Salman, M.; Ersin, Ö.Ö. Nonlinear contagion and causality nexus between Oil, Gold, VIX Investor Sentiment, Exchange Rate and Stock Market Returns: The MS-GARCH copula causality method. Mathematics 2022, 10, 4035. [Google Scholar] [CrossRef]
- Bukhari, A.H.; Raja, M.A.Z.; Sulaiman, M.; Islam, S.; Shoaib, M.; Kumam, P. Fractional neuro-sequential ARFIMA-LSTM for financial market forecasting. IEEE Access 2020, 8, 99–101. [Google Scholar] [CrossRef]
- Qureshi, S.; Qureshi, F.; Soomro, A.B.; Chandio, F.H.; Shah, S.S.; Rehman, I.U. Exchange rate risk and sectoral returns: A wavelet based MRA-EDCC GARCH analysis. Commun. Stat.-Theory Methods 2020, 51, 2154–2182. [Google Scholar] [CrossRef]
- Kristjanpoller, W.; Minutolo, M. A hybrid volatility forecasting framework integrating GARCH, artifcial neural network, technical analysis and principal components analysis. Expert Syst. Appl. 2018, 109, 1–11. [Google Scholar] [CrossRef]
- Segnon, M.; Lux, T.; Gupta, R. Modeling and forecasting the volatility of carbon dioxide emission allowance prices: A review and comparison of modern volatility models. Renew. Sustain. Energy Rev. 2017, 69, 692–704. [Google Scholar] [CrossRef]
- Huang, Y.; Dai, X.; Wang, Q.; Zhou, D. A hybrid model for carbon price forecasting using GARCH and long short-term memory network. Appl. Energy 2021, 285, 116485. [Google Scholar] [CrossRef]
- Hammoudeh, S.; Nguyen, D.K.; Sousa, R.M. What explain the short-term dynamics of the prices of CO2 emissions? Energy Econ. 2014, 46, 122–135. [Google Scholar] [CrossRef]
- Sun, W.; Zhang, C.; Sun, C. Carbon pricing prediction based on wavelet transform and K-ELM optimized by bat optimization algorithm in China ETS: The case of Shanghai and Hubei carbon markets. Carbon Manag. 2018, 9, 605–617. [Google Scholar] [CrossRef]
- Sun, W.; Zhang, J. A novel carbon price prediction model based on optimized least square support vector machine combining characteristic-scale decomposition and phase space reconstruction. Energy 2022, 253, 124167. [Google Scholar] [CrossRef]
- Yang, S.; Chen, D.; Li, S.; Wang, W. Carbon price forecasting based on modified ensemble empirical mode decomposition and long short-term memory optimized by improved whale optimization algorithm. Sci. Total Environ. 2020, 716, 137117. [Google Scholar] [CrossRef]
- Ji, Z.; Niu, D.; Li, M.; Li, W.; Sun, L.; Zhu, Y. A three-stage framework for vertical carbon price interval forecast based on decomposition–integration method. Appl. Soft Comput. 2022, 116, 108204. [Google Scholar] [CrossRef]
- Zhang, Z.; Zhao, Y.; Zhao, H. A Novel Hybrid Price Prediction Model for Multimodal Carbon Emission Trading Market Based on CEEMDAN Algorithm and Window-Based XGBoost Approach. Mathematics 2022, 10, 4072. [Google Scholar] [CrossRef]
- Zhu, B.; Ye, S.; Han, D.; Wang, P.; He, K.; Wei, Y.-M.; Xie, R. A multiscale analysis for carbon price drivers. Energy Econ. 2019, 78, 202–216. [Google Scholar] [CrossRef]
- Chai, S.; Zhang, Z.; Zhang, Z. Carbon price prediction for China ETS pilots using variational mode decomposition and optimized extreme learning machine. Ann. Oper. Res. 2021, 18, 1–22. [Google Scholar] [CrossRef]
- Göçken, M.; Özçalıcı, M.; Boru, A.; Dosdoğru, A.T. Integrating metaheuristics and artificial neural networks for improved stock price prediction. Expert Syst. Appl. 2016, 44, 320–331. [Google Scholar] [CrossRef]
- Montri, I.; Veera, B.; Sarun, I. Artifcial neural network and genetic algorithm hybrid intelligence for predicting Thai stock price index trend. Comput. Intell. Neurosci. 2016, 15, 1–8. [Google Scholar] [CrossRef]
- Reza, H.; Shahrabi, J.; Hadavandi, E. A bat-neural network multi-agent system (BNNMAS) for stock price prediction: Case study of DAX stock price. Appl. Soft Comput. 2015, 29, 196–210. [Google Scholar] [CrossRef]
- Li, Z.-P.; Yang, L.; Zhou, Y.-N.; Zhao, K.; Yuan, X.-L. Scenario simulation of the EU carbon price and its enlightenment to China. Sci. Total Environ. 2020, 25, 137982. [Google Scholar] [CrossRef]
- Atsalakis; George, S. Using computational intelligence to forecast carbon prices. Appl. Soft Comput. 2016, 43, 107–116. [Google Scholar] [CrossRef]
- Zhang, P.; Ci, B. Deep belief network for gold price forecasting. Resour. Policy 2020, 69, 101806. [Google Scholar] [CrossRef]
- Weng, F.; Chen, Y.; Wang, Z.; Hou, M.; Luo, J.; Tian, Z. Gold price forecasting research based on an improved online extreme learning machine algorithm. J. Ambient Intell. Humaniz. Comput. 2020, 11, 4101–4111. [Google Scholar] [CrossRef]
- Kumar, K.; Haider, M.T.U. Enhanced Prediction of Intra-day Stock Market Using Metaheuristic Optimization on RNN–LSTM Network. New Gener. Comput. 2020, 39, 231–272. [Google Scholar] [CrossRef]
- Zhou, F.; Huang, Z.; Zhang, C. Carbon price forecasting based on CEEMDAN and LSTM. Appl. Energy 2022, 311, 118601. [Google Scholar] [CrossRef]
- Vidal, A.; Kristjanpoller, W. Gold volatility prediction using a CNN-LSTM approach. Expert Syst. Appl. 2020, 5, 113481. [Google Scholar] [CrossRef]
- Zhou, J.; Chen, D.F. Carbon Price Forecasting Based on Improved CEEMDAN and Extreme Learning Machine Optimized by Sparrow Search Algorithm. Sustainability 2021, 13, 4896. [Google Scholar] [CrossRef]
- Sahoo, S.; Mohanty, M.N. Stock market price prediction employing artificial neural network optimized by Gray Wolf optimization. New Paradig. Decis. Sci. Manag. 2020, 1005, 77–87. [Google Scholar] [CrossRef]
- Pan, W.T. A new fruit fly optimization algorithm: Taking the financial distress model as an example. Knowl.-Based Syst. 2012, 26, 69–74. [Google Scholar] [CrossRef]
- Gowthul, A.; Baulkani, S.; Alam, G. Local and global characteristics-based kernel hybridization to increase optimal support vector machine performance for stock market prediction. Knowl. Inf. Syst. 2019, 60, 971–1000. [Google Scholar] [CrossRef]
- Mirjalili, S.; Andrew. The whale optimization algorithm. Adv. Eng. Softw. 2016, 95, 51–67. [Google Scholar] [CrossRef]
- Zakaria, A.; Mohamed, A.; Ahmed, A.; Ye, H.; Jianhua, Z. Forecasting gold price fluctuations using improved multilayer perceptron neural network and whale optimization algorithm. Resour. Policy 2019, 61, 250–260. [Google Scholar] [CrossRef]
- Zhang, J.; Zhang, Y.; Zhang, L. Novel hybrid method for crude oil price forecasting. Energy Econ. 2015, 49, 649–659. [Google Scholar] [CrossRef]
- Chiroma, H.; Abdulkareem, S.; Herawan, T. Evolutionary Neural Network model for West Texas Intermediate crude oil price prediction. Appl. Energy 2015, 142, 266–273. [Google Scholar] [CrossRef]
- Li, X.; Shang, W.; Wang, S. Text-based crude oil price forecasting: A deep learning approach. Int. J. Forecast. 2018, 35, 1548–1560. [Google Scholar] [CrossRef]
- Yu, L.; Zhao, Y.; Tang, L. A compressed sensing based AI learning paradigm for crude oil price forecasting. Energy Econ. 2015, 46, 236–245. [Google Scholar] [CrossRef]
- Yu, L.; Zhang, X.; Wang, S. Assessing Potentiality of Support Vector Machine Method in Crude Oil Price Forecasting. EURASIA J. Math. Sci. Technol. Educ. 2017, 13, 7893–7904. [Google Scholar] [CrossRef]
- Elaziz, M.; Ewees, A.; Alameer, Z. Improving Adaptive Neuro-Fuzzy Inference System Based on a Modified Salp Swarm Algorithm Using Genetic Algorithm to Forecast Crude Oil Price. Nat. Resour. Res. 2019, 29, 2671–2686. [Google Scholar] [CrossRef]
- Vanguri, N.; Pazhanirajan, S.; Kumar, T.A. Competitive feedback particle swarm optimization enabled deep recurrent neural network with technical indicators for forecasting stock trends. Int. J. Intell. Robot. Appl. 2022, 7, 1–21. [Google Scholar] [CrossRef]
- Kumar, G.; Singh, U.P.; Jain, S. Swarm Intelligence Based Hybrid Neural Network Approach for Stock Price Forecasting. Comput. Econ. 2022, 60, 991–1039. [Google Scholar] [CrossRef]
- Wang, J.; Qiu, S. Improved Multi-Scale Deep Integration Paradigm for Point and Interval Carbon Trading Price Forecasting. Mathematics 2021, 9, 2595. [Google Scholar] [CrossRef]
- Ma, J.; Wang, X. Optimal pricing and complex analysis for low-carbon apparel supply chains. Appl. Math. Model. 2022, 111, 610–629. [Google Scholar] [CrossRef]
- Cao, Z.; Liu, H. A novel carbon price forecasting method based on model matching, adaptive decomposition, and reinforcement learning ensemble strategy. Environ. Sci. Pollut. Res. 2023, 30, 36044–36067. [Google Scholar] [CrossRef]
- Qin, Q.; Huang, Z.; Zhou, Z.; Chen, Y.; Zhao, W. Hodrick–Prescott filter-based hybrid ARIMA–SLFNs model with residual decomposition scheme for carbon price forecasting. Appl. Soft Comput. 2022, 119, 108560. [Google Scholar] [CrossRef]
- Li, Z.P.; Yang, L.; Li, S.R. The long-term trend analysis and scenario simulation of the carbon price based on the energy-economic regulation. Int. J. Clim. Change Strateg. Manag. 2020, 12, 653–668. [Google Scholar] [CrossRef]
- Ren, X.; Duan, K.; Tao, L.; Shi, Y.; Yan, C. Carbon prices forecasting in quantiles. Energy Econ. 2022, 108, 105862. [Google Scholar] [CrossRef]
- Cui, S.; Wang, D.; Yin, Y.; Fan, X.; Dhamotharan, L.; Kumar, A. Carbon trading price prediction based on a two-stage heterogeneous ensemble method. Ann. Oper. Res. 2022, 9, 1–25. [Google Scholar] [CrossRef]
- Yang, P.; Wang, Y.; Zhao, S.; Chen, Z.; Li, Y. A carbon price hybrid forecasting model based on data multi-scale decomposition and machine learning. Environ. Sci. Pollut. Res. 2023, 30, 3252–3269. [Google Scholar] [CrossRef]
- Wang, J.; Cui, Q.; He, M. Hybrid intelligent framework for carbon price prediction using improved variational mode decomposition and optimal extreme learning machine. Chaos Solitons Fractals 2022, 156, 11783. [Google Scholar] [CrossRef]
- Sun, W.; Huang, C. A novel carbon price prediction model combines the secondary decomposition algorithm and the long short-term memory network. Energy 2020, 207, 118294. [Google Scholar] [CrossRef]
- Tian, C.; Hao, Y. Point and interval forecasting for carbon price based on an improved analysis-forecast system. Appl. Math. Model. 2020, 79, 126–144. [Google Scholar] [CrossRef]
- Zhu, J.; Wu, P.; Chen, H.; Liu, J.; Zhou, L. Carbon price forecasting with variational mode decomposition and optimal combined model. Phys. A. Stat. Mech. Its Appl. 2019, 519, 140–158. [Google Scholar] [CrossRef]
- Wang, J.; Cheng, Q.; Sun, X. Carbon price forecasting using multiscale nonlinear integration model coupled optimal feature reconstruction with biphasic deep learning. Environ. Sci. Pollut. Res. 2021, 29, 85988–86004. [Google Scholar] [CrossRef]
- Zhang, J.; Li, D.; Hao, Y.; Tan, Z. A hybrid model using signal processing technology, econometric models and neural network for carbon spot price forecasting. J. Clean. Prod. 2018, 204, 958–964. [Google Scholar] [CrossRef]
- Ma, J. Nonlinear Analysis Methods for Complex Economic and Financial Systems; Beijing Science Press: Beijing, China, 2021; Volume 6. [Google Scholar]
- Ma, J.; Xu, T. Optimal strategy of investing in solar energy for meeting the renewable portfolio standard requirement in America. J. Oper. Res. Soc. 2023, 74, 181–194. [Google Scholar] [CrossRef]


| Citing Articles | Times Cited | H-Index | |
|---|---|---|---|
| total | 16,125 | 21,613 | 59 |
| Without self-citations | 15,173 | 19,455 | |
| Average per item | 9.2 |
| Articles Information | Citations Information | ||||
|---|---|---|---|---|---|
| Previous Year | Per Year | Total | |||
| 2023 | 2022 | 2021 | |||
| Deep learning for finance: deep portfolios Heaton, J.B.; Polson, N.G; Witte, J.H. Jan-feb 2017 | 33 (1), pp.3–12 APPLIED STOCHASTIC MODELS IN BUSINESS AND INDUSTRY | 11 | 45 | 44 | 30 | 210 |
| A CNN-LSTM model for gold price time-series forecasting Livieris, I.E; Pintelas, E; Pintelas, P. Dec 2020|32 (23), pp.351–360 NEURAL COMPUTING & APPLICATIONS | 18 | 104 | 54 | 46.25 | 185 |
| Investor Attention and Stock Market Volatility Andrei, D.; Hasler, M. Jan 2015|28 (1), pp.33–72 REVIEW OF FINANCIAL STUDIES | 30 | 41 | 47 | 19.89 | 179 |
| Ensemble approach based on bagging, boosting and stacking for short-term prediction in agribusiness time series Ribeiro, M.H.D.; Coelho, L.D. Jan 2020|86 APPLIED SOFT COMPUTING | 22 | 68 | 57 | 43.5 | 174 |
| Interaction between oil and US dollar exchange rate: nonlinear causality, time-varying influence and structural breaks in volatility Wen, F.H.; Xiao, J.H.; et al. 2018|50(3), pp.319–334 APPLIED ECONOMICS | 5 | 24 | 32 | 25 | 150 |
| Research Methods | Meaning |
|---|---|
| Local Characteristic Scale decomposition, LCD | Adaptively decompose a complex signal into the sum of several Intrinsic scale component (ISC) with physical significance |
| Multi-Scale, MS | Provide a bridge for data at different lengths and time scales, enabling models suitable for different scales to communicate with each other. |
| Phase Space reconstruction, PSR | A method for recovering and characterizing a prime mover system from a known time series. |
| Hodrick–Prescott, HP | Determine long-term trends of time series by discounting the importance of short-term price fluctuations. |
| Wavelet transform, WT | By transforming, fully highlighting the characteristics of some aspects of the problem, locally analyze the time (space) frequency. The signal (function) can be gradually refined at multiple scales through scaling and translation operations, ultimately achieving time subdivision at high-frequencies and frequency subdivision at low-frequencies, which can automatically adapt to the requirements of time-frequency signal analysis, thus focusing on any details of the signal. |
| Empirical Mode Decomposition, EMD | The signal is decomposed according to the time scale characteristics of the data itself, without setting any basis function in advance. The essence is to identify all vibration modes contained in the signal through the characteristic time scale. |
| Variational mode decomposition, VMD | An adaptive and completely non recursive method for modal change and signal processing. By iteratively searching for the optimal solution of the variational problem, determining the frequency and bandwidth of each decomposed component, realize the effective separation of the natural mode components, and ultimately obtaining the optimal solution of the variational problem. |
| Research Methods | Meaning |
|---|---|
| Support Vector Machine, SVM | A kind of generalized linear classifier that classifies data binary according to supervised learning. |
| Support Vector Machine, SVR | SVR is an important branch of SVM. By SVR, a regression plane can be found and the distance between all data in a set and the plane can be minimized. |
| Least square support vector machine, LSSVM | A kernel function learning machine following the principle of structural risk minimization (SRM). |
| Random Forest, RF | Refers to a classifier that uses multiple trees to train and predict samples. |
| A convolutional neural network, CNN | Imitate human vision and can effectively reduce the dimensionality of a large amount of data into a small amount of data without affecting the result. |
| Artificial Neural Network, ANNs | Intelligent and nonparametric mathematical models inspired by the biological nervous system, realizing the purpose of processing information by adjusting the interconnection between a large number of internal nodes. |
| Feedforward neural network, FNN | The simplest kind of neural network in which neurons are arranged in layers, and each neuron is only connected to the neurons in the previous layer. |
| Extreme Learning Machine, ELM | A kind of machine learning system or method based on FNN. |
| Back propagation neural network, BPNN | Add the backward propagation algorithm to the structure of feedforward network. |
| The adaptive neuro-fuzzy inference system, ANFIS | A type of fuzzy reasoning system structure that organically combines fuzzy logic and neural network and adopts the mixed algorithm of back propagation algorithm and least square method to adjust the premise parameters and conclusion parameters. |
| Deep belief network, DBN | A probabilistic generative model composed of multiple simple learning modules |
| Recursive neural network, RNN | Which takes sequence data as input, recursion in sequence evolution direction, and all nodes (cyclic units) are connected by chain |
| Long Short-Term memory, LSTM | By improving the gradient propagation process of the RNN model, it can alleviate the phenomenon of gradient disappearance of words far away from the end of the sentence is easy to occur in the reverse propagation process. |
| Gated Recurrent Units, GRU | The gating mechanism of the introduced recurrent neural network, which belongs to the variant of LSTM. |
| Particle Swarm Optimization, PSO | Simulate the swarm behavior of animals, such as insects, birds, and fish. These animals swarm and seek food in a cooperative manner. In order to achieve optimal results, each member of the swarm constantly changes search mode by learning experiences of itself and other members. |
Disclaimer/Publisher’s Note: The statements, opinions and data contained in all publications are solely those of the individual author(s) and contributor(s) and not of MDPI and/or the editor(s). MDPI and/or the editor(s) disclaim responsibility for any injury to people or property resulting from any ideas, methods, instructions or products referred to in the content. |
© 2023 by the authors. Licensee MDPI, Basel, Switzerland. This article is an open access article distributed under the terms and conditions of the Creative Commons Attribution (CC BY) license (https://creativecommons.org/licenses/by/4.0/).
Share and Cite
Fu, N.; Geng, L.; Ma, J.; Ding, X. Price, Complexity, and Mathematical Model. Mathematics 2023, 11, 2883. https://doi.org/10.3390/math11132883
Fu N, Geng L, Ma J, Ding X. Price, Complexity, and Mathematical Model. Mathematics. 2023; 11(13):2883. https://doi.org/10.3390/math11132883
Chicago/Turabian StyleFu, Na, Liyan Geng, Junhai Ma, and Xue Ding. 2023. "Price, Complexity, and Mathematical Model" Mathematics 11, no. 13: 2883. https://doi.org/10.3390/math11132883
APA StyleFu, N., Geng, L., Ma, J., & Ding, X. (2023). Price, Complexity, and Mathematical Model. Mathematics, 11(13), 2883. https://doi.org/10.3390/math11132883