1. Introduction
One of the main issues facing not only the majority of schools, colleges, and institutions but also the academic industry in general is predicting students’ performance. Educational institutions aim to assess students’ performance, pinpoint their strengths and shortcomings, and assist them in improving during exams. In order to manage the learning materials they supply, as well as to control the activities and track the behaviors of their students, institutions are increasingly using learning management systems.
In addition to providing feedback about the caliber of the learning materials offered to students, analyzing their behavior in LMSs can help institutions forecast students’ performance based on their prior grades and actions taken within the system.
With the dramatic development of intelligent systems, machine learning schemes have been involved in predicting student performance, which could affect the analysis of the overall outcome of students in their study field. Moreover, the early performance evaluation of students can assist in identifying their strengths and weaknesses and improve their exam results [
1].
Sandra [
2] produced a systematic literature review study to evaluate the performance of machine learning algorithms, and modeling was used to evaluate early student performance for the academic years 2019–2021. In their study, several research publications presented in their research were based on the inclusion and exclusion criteria. The main objective was to locate, gather, and extract information based on previously specified research questions.
The systematic review by [
3] examined the pertinent Educational Data Mining (EDM) literature from 2009 to 2021 that relate to detecting at-risk pupils and dropouts among students. The review’s findings showed that a variety of Machine Learning (ML) approaches are utilized to comprehend and address the underlying problems, including forecasting at-risk pupils and student dropouts. Additionally, the majority of research incorporates data from online learning platforms and student databases from schools and universities. It was demonstrated that ML techniques were crucial for identifying at-risk kids and dropout rates and for raising student achievement.
On the other hand, Alamri and Alharbi [
4] examined explainable models of student performance prediction from 2015 to 2020 in their systematic study. They organized primary research based on nine dimensions once they had analyzed and synthesized them.
In this paper, a comprehensive evaluation is performed in terms of the Convolutional Neural Network (CNN) approach and traditional approach represented by seven different types of classifiers, namely, Gaussian Naïve Bayes (GNB), SVM, Decision Tree (DT), Multi-Layer Perceptron (MLP), Random Forest (RF), Linear Discriminant Analysis (LDA), and Quadratic Discriminant Analysis (QDA). The proposed system is conducted by five main datasets and they are the House, WOU, XAPI, UCI, and AV. The UCI dataset was further divided into UCI-Math, UCI-Por, and UCI-Fused. All datasets were divided into 80% for the training task and 20% for the testing task. The motivation of this paper is to implement a powerful scheme to predict the student performance in different educational environments and provide comprehensive evaluations via different traditional and CNN classifiers for seven datasets in order to give a benchmark for other researchers’ works in the same field. We have summarized the main contributions of this paper as follows:
Thorough evaluations of student performance are accomplished by using the House database in terms of Traditional Machine Learning Classifiers (TMLCs), which are GNB, SVM, DT, MLP, RF, LDA, QDA, as well as a fusion of these classifiers.
Over a wide range of data division, the proposed system (TMLCs methods) was evaluated with 10%, 20%, 30%, 40%, and 50% of the test phase, and the best result was obtained in the division of 80% of the dataset for training and 20% of the dataset for testing.
Thorough evaluations and comparisons were conducted based on the CNN approach before and after augmentation for seven datasets, namely, House, WOU, XAPI, UCI-Math, UCI-Por, and UCI-Fused, and the new 2023 AV dataset (which has three targets AV-Math, AV-Reading, and AV-Writing). Augmentation was performed in order to increase the size of the training set, thereby enhancing the performance accuracy of the proposed CNN method. This is because the CNN approach gives a powerful performance using sufficient data. In addition, we evaluated seven augmented datasets (newly modified) which nobody else has evaluated before. Furthermore, we evaluated for the first time the original and augmented forms of a new 2023 AV dataset.
The Fusion-based strategy was applied on the UCI dataset to evaluate both the Math course dataset and the Portuguese language course to increase the accuracy by using the CNN approach. Hence, the accuracy by fusion was improved to 99.67%, where the accuracy for the Math course was 99.28% and for the Portuguese was 99.40%.
The proposed system was compared with other state-of-the-art methods, which showed that the proposed CNN approach outperforms other works. The proposed CNN method was custom-designed and, to our knowledge, nobody has used exactly the same structure and has obtained better reported results.
The best accuracy results achieved by using the CNN approach in this work were 97.5%, 99.55%, 98.57%, 99.28%, 99.40%, 99.67%, 92.93%, 96.99%, and 96.84% for the House, WOU, XAPI, UCI-Math, UCI-Por, UCI-Fused, AV-Math, AV-Reading, and AV-Writing datasets, respectively.
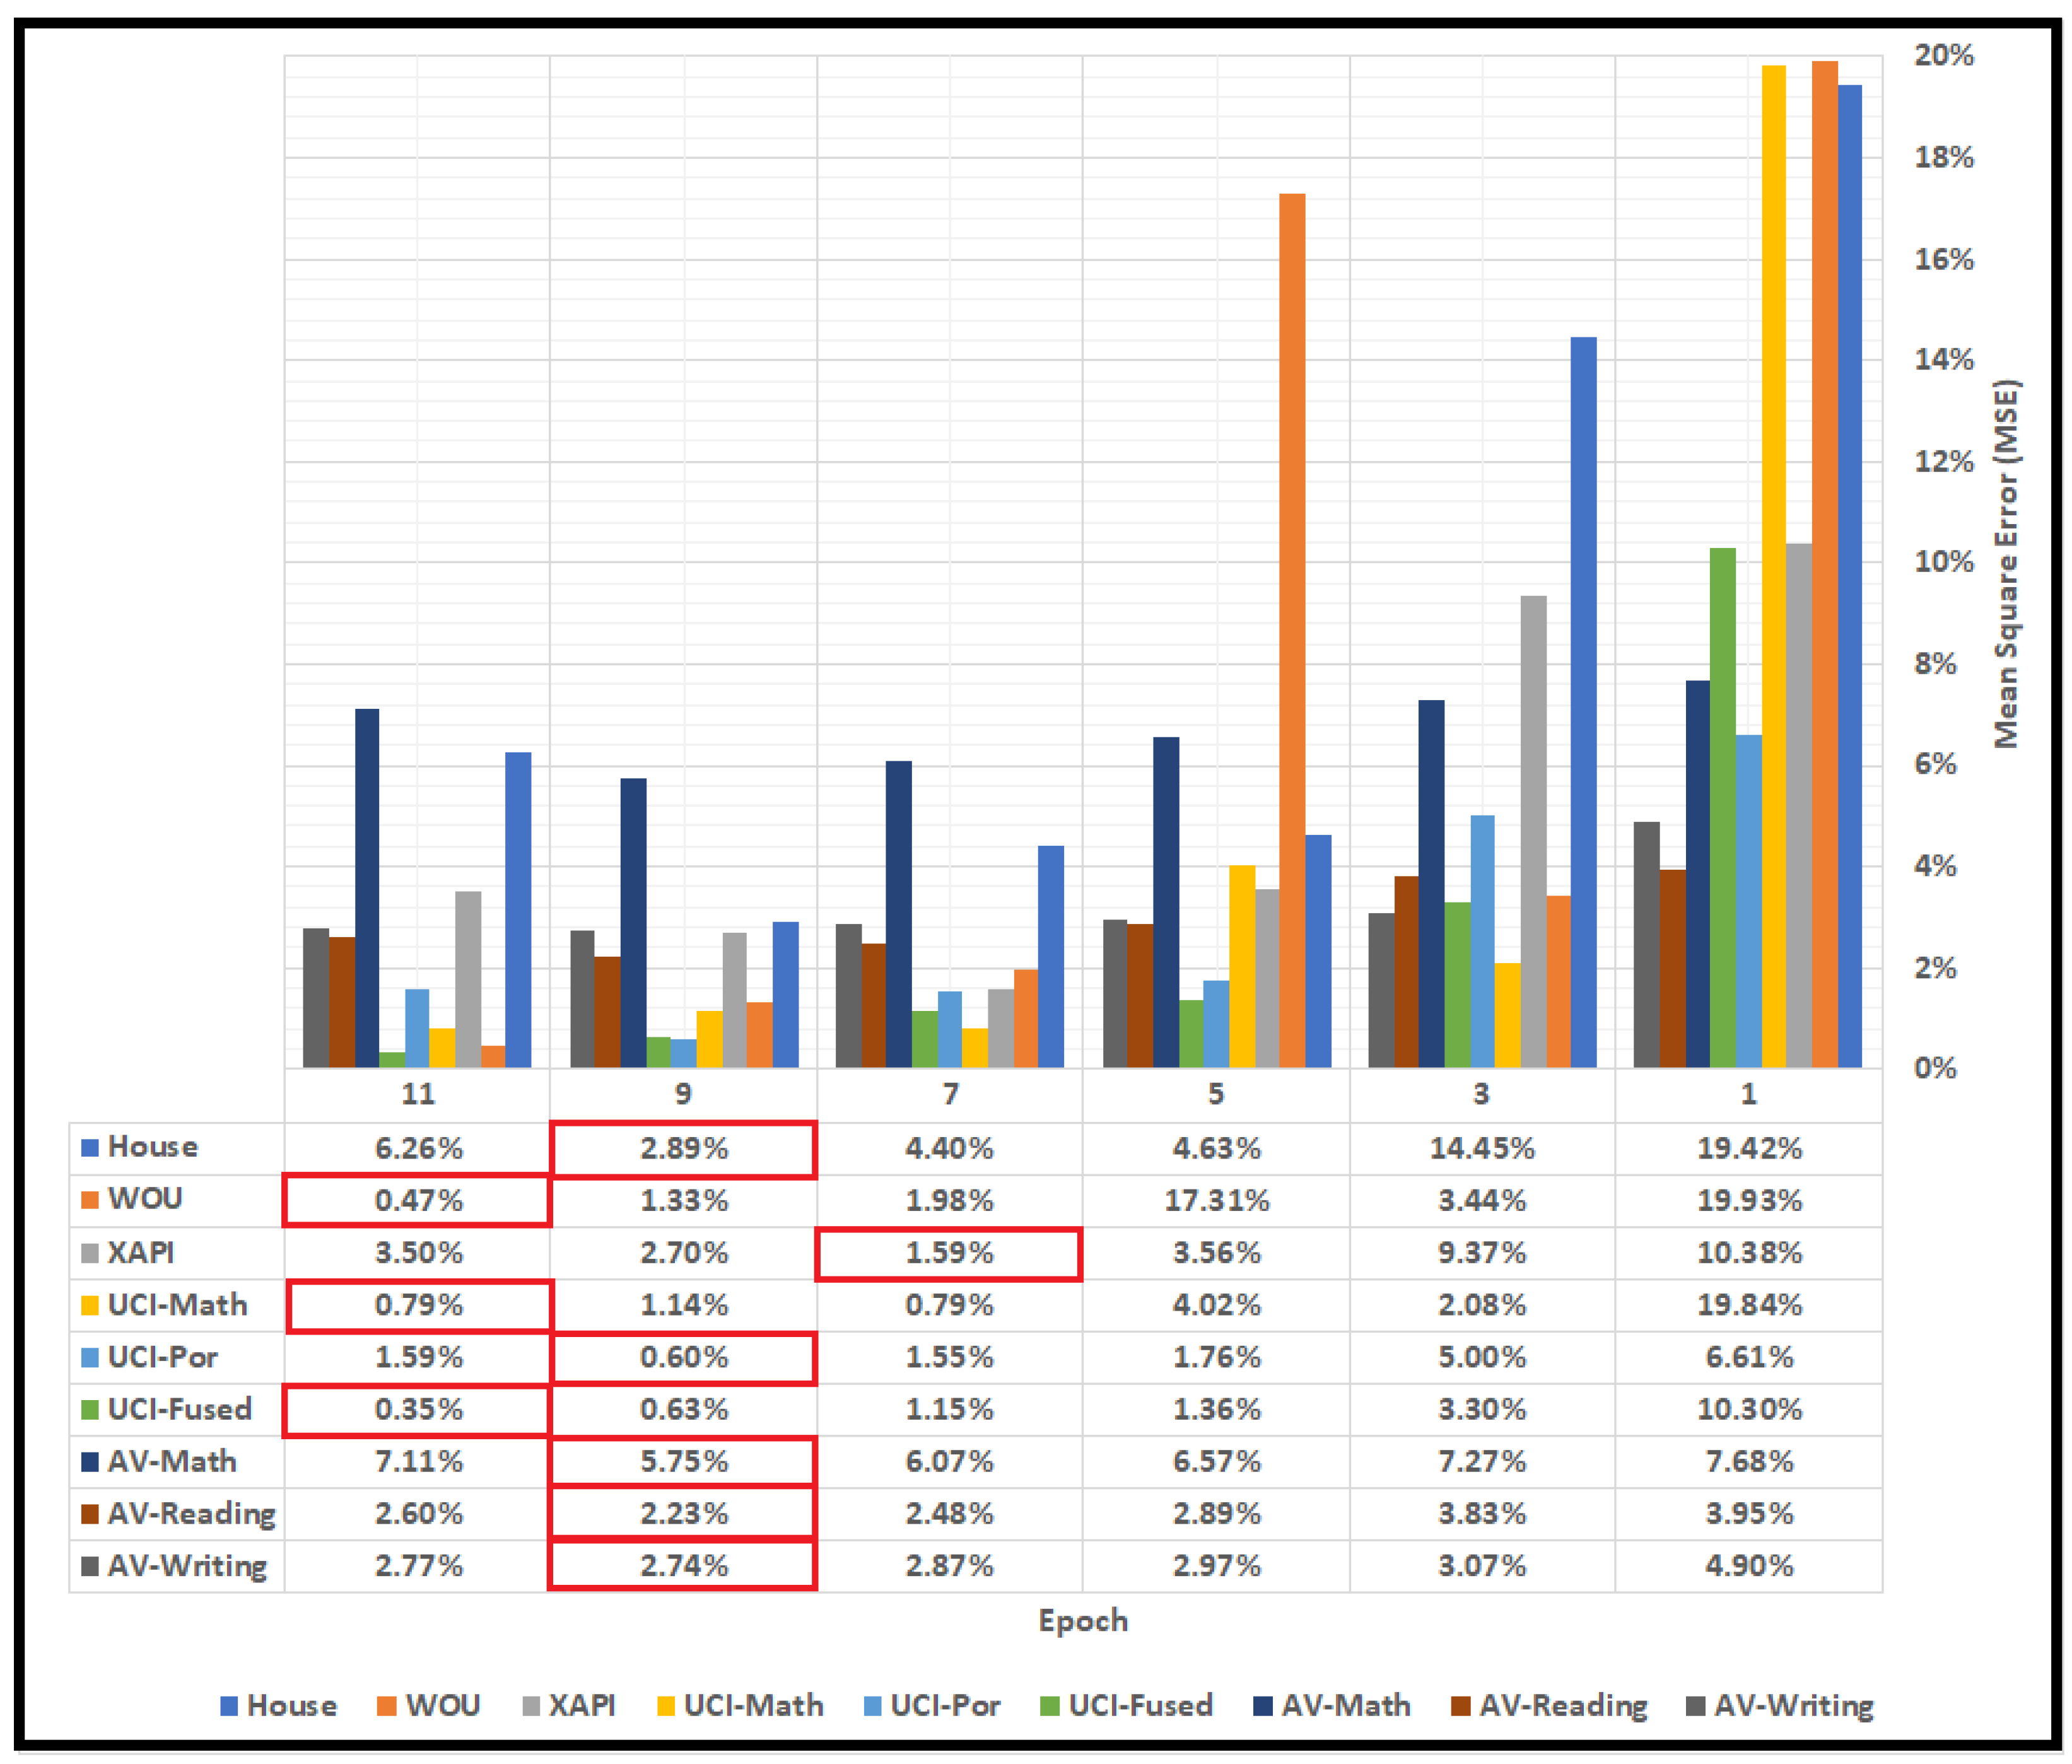
The least Mean Square Error (MSE) attained in this work were 2.89%, 0.47%, 1.59%, 0.79%, 0.60%, 0.35%, 5.75%, 2.23%, and 2.74% for the House, WOU, XAPI, UCI-Math, UCI-Por., Fused UCI, AV-Math, AV-Reading, and AV-Writing datasets, respectively.
The paper is organized as follows:
Section 2 shows the related work. The proposed method is presented in
Section 3, the datasets descriptions in
Section 4, and the results and discussion in
Section 5. Lastly,
Section 6 presents the conclusions.
2. Related Work
Dhilipan et al. [
5] studied students’ academic development using machine learning techniques. In their article, binomial logical regression, a decision tree, entropy, and a KNN classifier were all employed in the investigation. The proposed approach makes it possible for the instructor to assess student performance and plan more effective academic improvement strategies.
In the research by Altabrawee et al. [
6], four categorization models were developed to predict students’ performance to identify the students who struggle academically in the computer science course. This study was conducted by the College of Humanities at Al-Muthanna University. The authors implemented fully connected feed-forward Artificial Neural Networks (ANNs), naive Bayes, decision trees, and logistic regression. The classification accuracy and the Receiver Operating Characteristics (ROC) index performance metric were used for model evaluation. The ANN model had an ROC index of 0.807 and an accuracy of 77.04%, which is the highest performance.
Aziz [
7] presented a method for pre-evaluating student performance, which was utilized in the timely development and proper maintenance of student performance. For the purpose of data mining educational institutions, the performances of several machine learning algorithms were compared in this study. It was demonstrated that these algorithms are promising in the area of predicting student performance, and deep learning is the best algorithm for this kind of dataset.
Bhusal [
8] suggested that the performance of a student might be predicted using machine learning with the use of student data gathered from Learning Management Systems (LMS). Data gathered from LMSs can offer insight on the behavior of students, which will produce the degree of performance on exams. This will then be researched and utilized to aid students with low scores on exams to perform better. Baashar published a study [
9] which sought to analyze the most recent machine learning techniques used to forecast student performance between 2015 and 2019. Thirty data-driven studies were chosen and the results showed that: (i) the research in this area has significantly increased recently; (ii) the academic (Cumulative Grade Point Average (CGPA); attendance), demographic (Gender), internal assessment (Quiz; assignment), and family/personal attributes play an important role in the prediction; and (iii) the ANN produced the highest level of accuracy of 98.30%.
Kim et al. [
10] introduced the GritNet, a new deep-learning-based system which utilizes the Bidirectional Long Short-Term Memory (BLSTM). It recast the problem of predicting student performance as one of sequential event prediction. The findings from graduation predictions created for datasets of Udacity students showed that the GritNet routinely outperformed the traditional logistic-regression-based technique. The first few weeks showed the most progress due to the making of precise forecasts being the most challenging within this duration.
A model suggested by [
11] produced better performance among three semesters of student performance. The training and validation set provided the best outcomes and event accuracy. The K-nearest neighbors and decision tree classifier model achieved an accuracy of 89.74% and 94.44%, respectively. The results showed better performance in precision.
Additionally, the investigation in the article of Salih and Khalaf [
12] sought to offer managers of study programs and educators a forecast that might help them develop superior educational programs at their academy. Consequently, estimating students’ performance was shown utilizing grades and attendance in classes without using socioeconomic data. The dataset contained 44 individuals and 13 characteristics, which were gathered from three academic years at Mustansiriyah University in Iraq. Five courses were included in the datasets. The authors suggested a model that describes the relationship between two fundamental topics: first- and second-year mathematics, and third-year control systems. Their reported work was based on examining the academic components of mathematics courses, and their study sought to enhance student performance and prevent failure in the control systems course.
The main objective of Kabakchieva’s paper [
13] was to reveal the high potential of data mining applications for university management and to contribute to more effective university recruitment campaigns to attract the most desirable students. The goal of the study was to create data mining models that can predict student achievement based on personal, pre-university, and collegiate performance traits. In addition, students’ data were admitted to the university during a three-year period and utilized for the research. Furthermore, the dataset was subjected to the application of a number of well-known data mining classification techniques, including a rule learner, a decision tree classifier, a neural network, and a nearest neighbor classifier.
Two prediction models for the assessment of students’ performance on the first test were provided in the paper by [
14]. The work used a well-known dataset made available by the University of Minho in Portugal, which relates to math performance and contains 395 data samples. The ability to predict student performance can be helpful when choosing a student who is qualified for a certain activity, taking immediate action, or adopting early preventative measures. Additionally, it is necessary to investigate improved models in order to improve performance. The K-nearest neighbor approach was mostly utilized but it had lower performance in prior work on the same dataset. In contrast, the Support Vector Machine (SVM) algorithm is a very popular and effective prediction tool.
Sekeroglu et al. [
15] focused on the prediction and categorization of various types of educational data using machine learning algorithms.
More research on explainable student performance prediction models is required, where both accuracy and the ability to explain are adequately measured and assessed.
The authors of the research [
16] considered the challenge of predicting student performance as a short-term sequential behavior modeling assignment. It was suggested to use a two-stage classifier Sequence-based Performance Classifier (SPC) for learner behaviors that combines the attention-based Hybrid Recurrent Neural Network (HRNN) and conventional Support Vector Machine (SVM) algorithm. The entire student sequential behavior data could be adaptively merged, and the primary behavior intention could be recorded, in contrast to prior statistical analysis approaches where behavior characteristics were manually removed.
The strategy in [
17] for predicting student performance makes use of a number of deep learning techniques before bringing data into well-known deep learning models like Long Short-Term Memory (LSTM) and Convolutional Neural Networks (CNNs) to perform prediction tasks. Moreover, a number of strategies for data pre-processing were studied and described (e.g., Quantile Transforms and Min/Max Scaler). A Vietnamese interdisciplinary university’s student information system was used to acquire four million samples for the experiments, which were constructed on 16 datasets connected to a wide range of various disciplines. The results indicate that the suggested strategy, particularly when employing data modification, produces accurate prediction results. The conclusions are applicable to real-world situations.
3. Proposed Method
The proposed methods are shown in
Figure 1 and
Figure 2. In
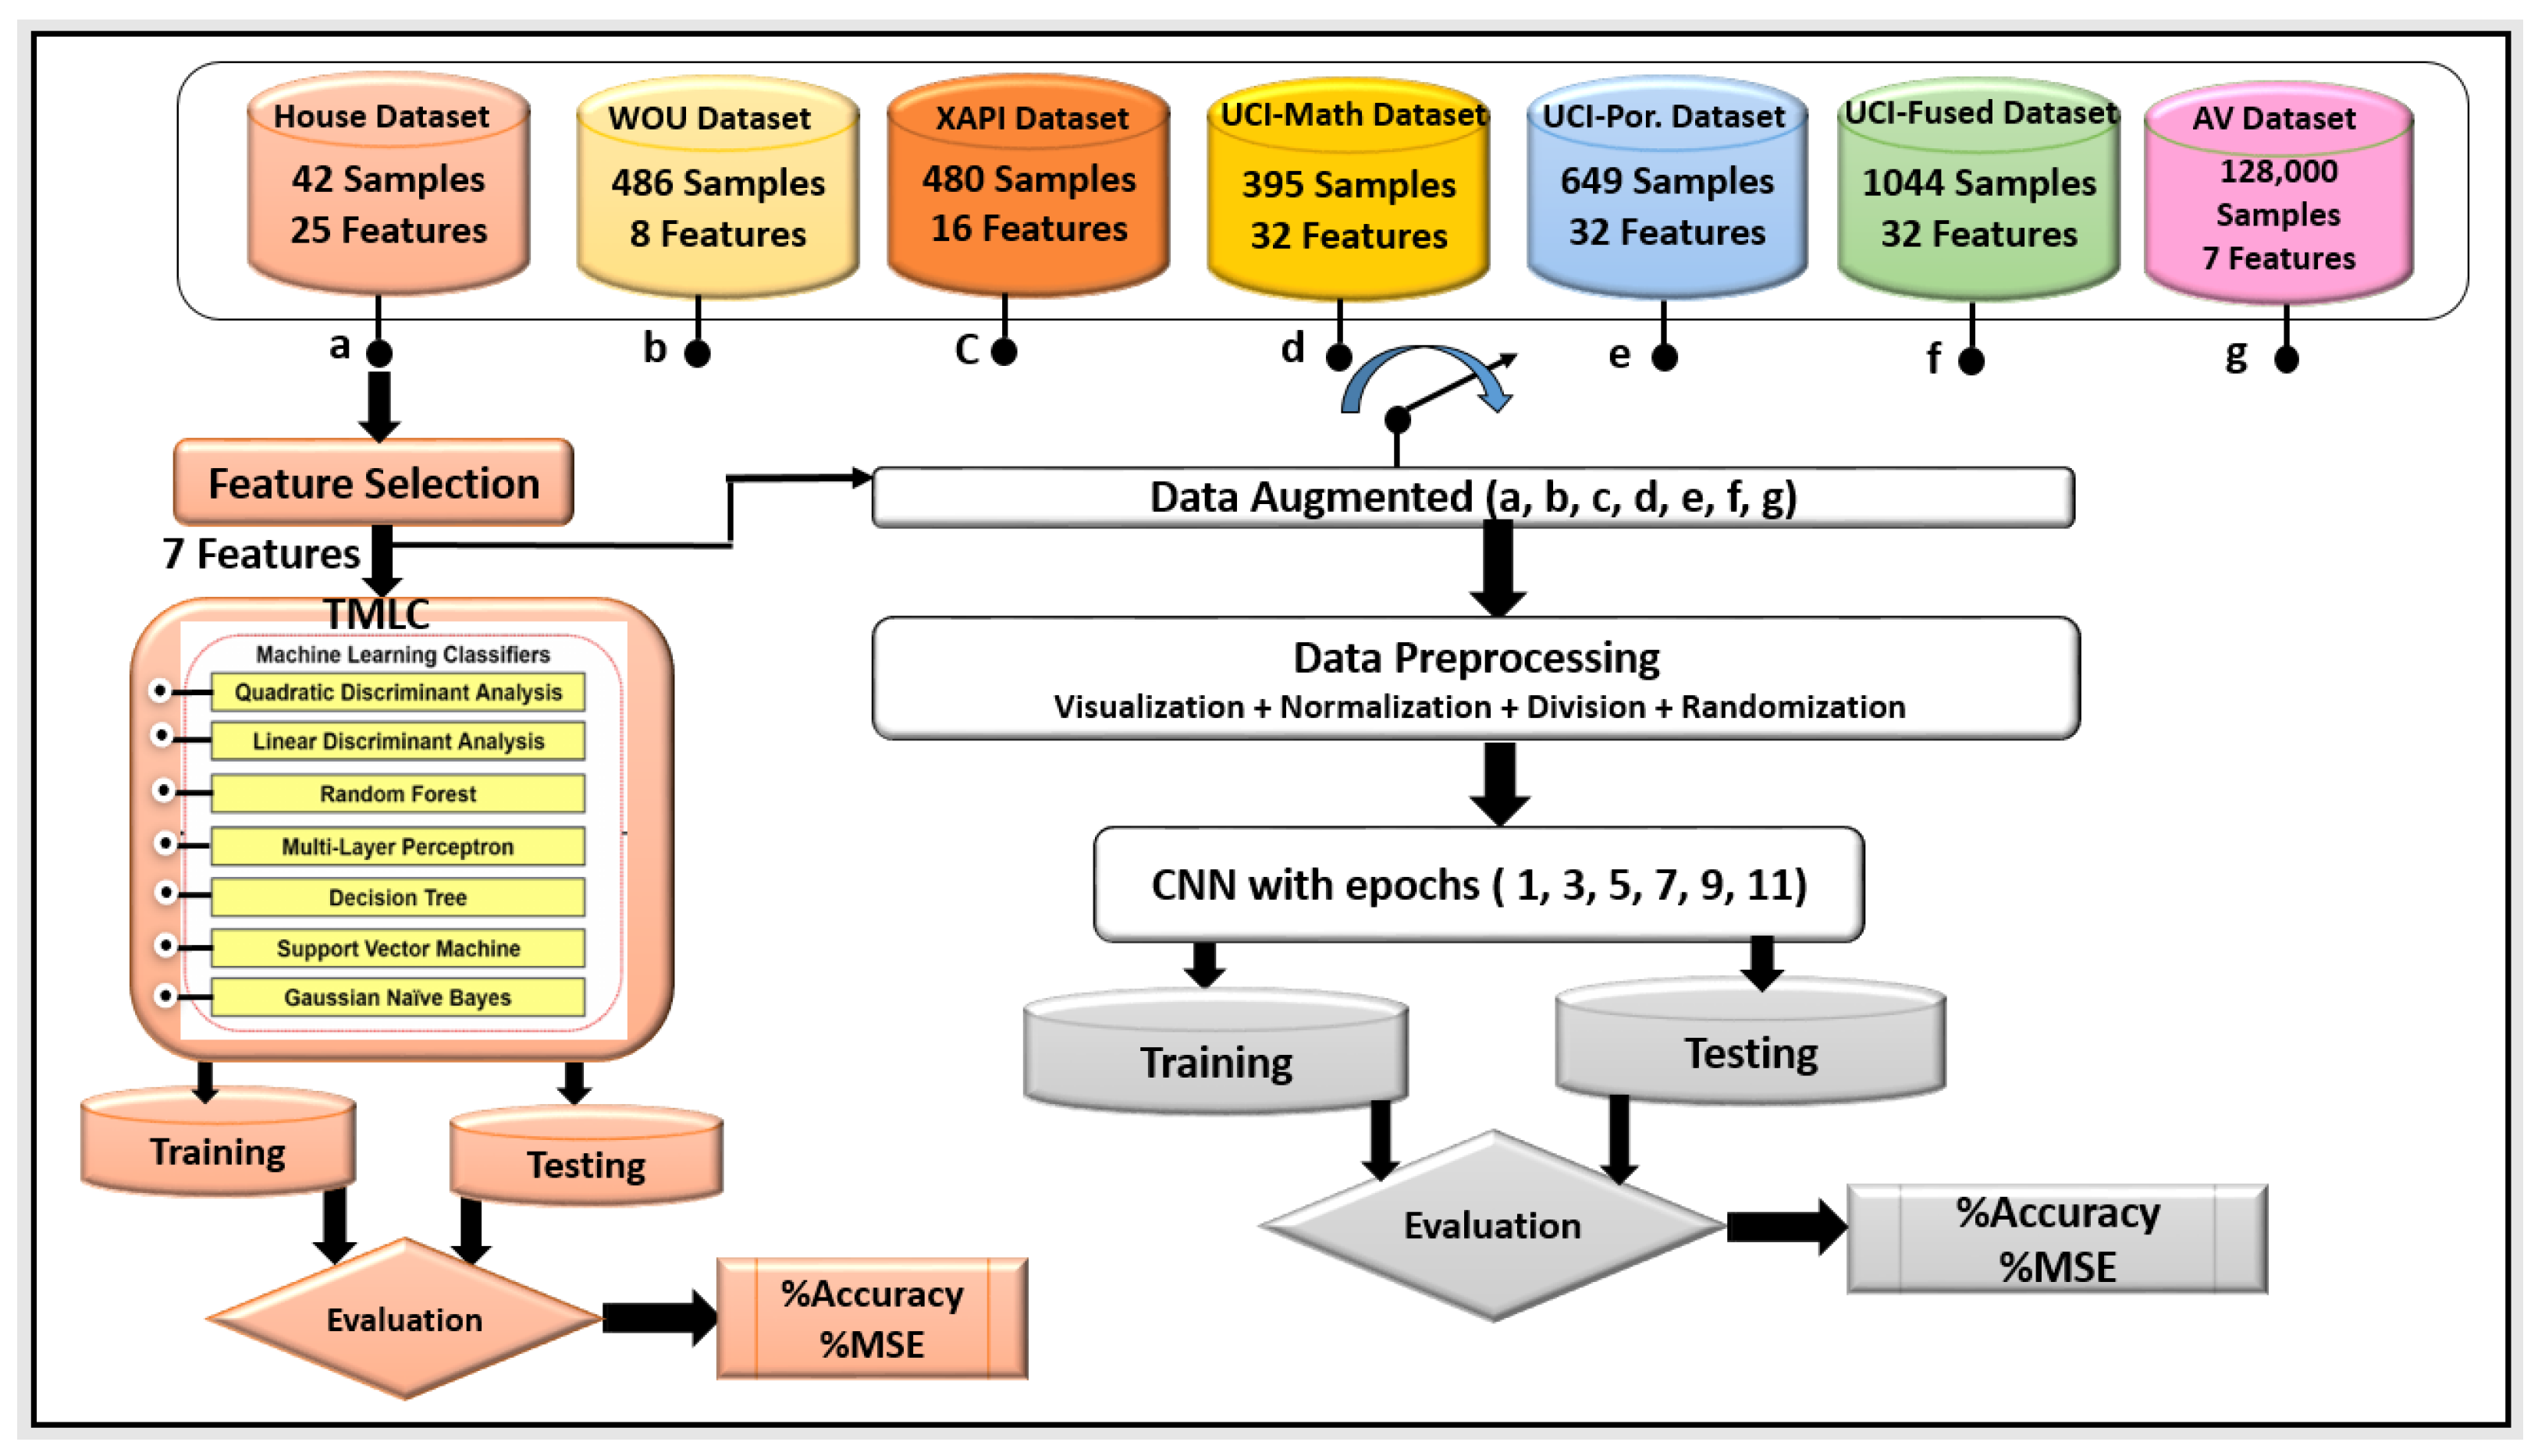
Figure 1, a House dataset of 25 features was used, then only the most important of seven features were selected, visualized, and normalized. In addition, the normalized selected features were trained and the proposed TMLCs scheme was applied on the data to evaluate the system. The TMLCs which were used in this paper are GNB, SVM, DT, MLP, RF, LDA, and QDA. Furthermore, the fused TMLCs were also applied on the same data, which might improve the overall performance.
As shown in
Figure 2, the CNN was applied to five main datasets—namely, the House, WOU, XAPI, UCI, and AV datasets—since the best-reported results were obtained using the CNN proposed method. The description of the proposed CNN is explained in
Section 3.2.
Figure 2 shows the input of 7, 8, 16, 32, 32, 32, and 7 features for House, WOU, XAPI, UCI-Math, UCI-Por, UCI-Fused, and AV datasets, respectively.
3.1. Tradition Machine Learning Classifiers
The TMLCs include seven machine learning classifiers (GNB, SVM, DT, MLP, RF, LDA, and QDA) which were applied only on the original House dataset, which has a small number of samples and cannot be applied to the CNN approach. Therefore, we augmented this dataset to increase the training subset to be applicable to the CNN approach. Thus, the fusion of the TMLCs was applied to the House dataset only, as shown in
Figure 1.
The GNB classifier is dependent on Bayes’ theorem, which is obtained by the calculation of the probability of a given hypothesis of prior knowledge. To calculate the stability, a smoothing factor (
), which is the the portion of the largest variance of all features, is added to variances [
18,
19,
20].
The SVM is a supervised classifier that is used in classification and regression problems. The SVM uses a kernel to classify the data, and this kernel could be linear (Linear SVM) or non-linear (Non-Linear SVM). The proposed SVM uses a radial base function [
21,
22,
23].
The DT is considered a non-parametric supervised method. This classifier is organized as a tree structure and hierarchy, which contains a root node, branches, internal nodes, and leaf nodes [
24,
25,
26,
27].
The MLP classifier is a neural network scheme that has three main layers, an input layer, a hidden layer, and an output layer. Three hidden layer dimensions were used in this work of sizes 6, 16, and 6, respectively. The maximum iteration was 1100, the learning rate was 0.001, and the activation function was the tangent function, tolerance of
[
28,
29,
30,
31].
The RF classifier is considered as a supervised scheme that could be applied by building a decision tree on different samples of the data to obtain the majority votes of these trees. The proposed scheme in this work used a maximum depth of 2 for the decision tree [
32,
33,
34,
35].
The LDA classifier is used to reduce the dimension of data by projecting these data into a high-dimension space. It is also used to separate the data into different classes using two paths. This classifier uses the Singular Value Decomposition (SVD) [
36,
37,
38,
39].
The QDA classifier is similar to LDA in that the observations are normally distributed; however, for each class, there is a certain covariance matrix and this scheme is called quadratic since its equation comes from the quadratic function [
40,
41,
42,
43].
3.2. Convolutional Neural Network
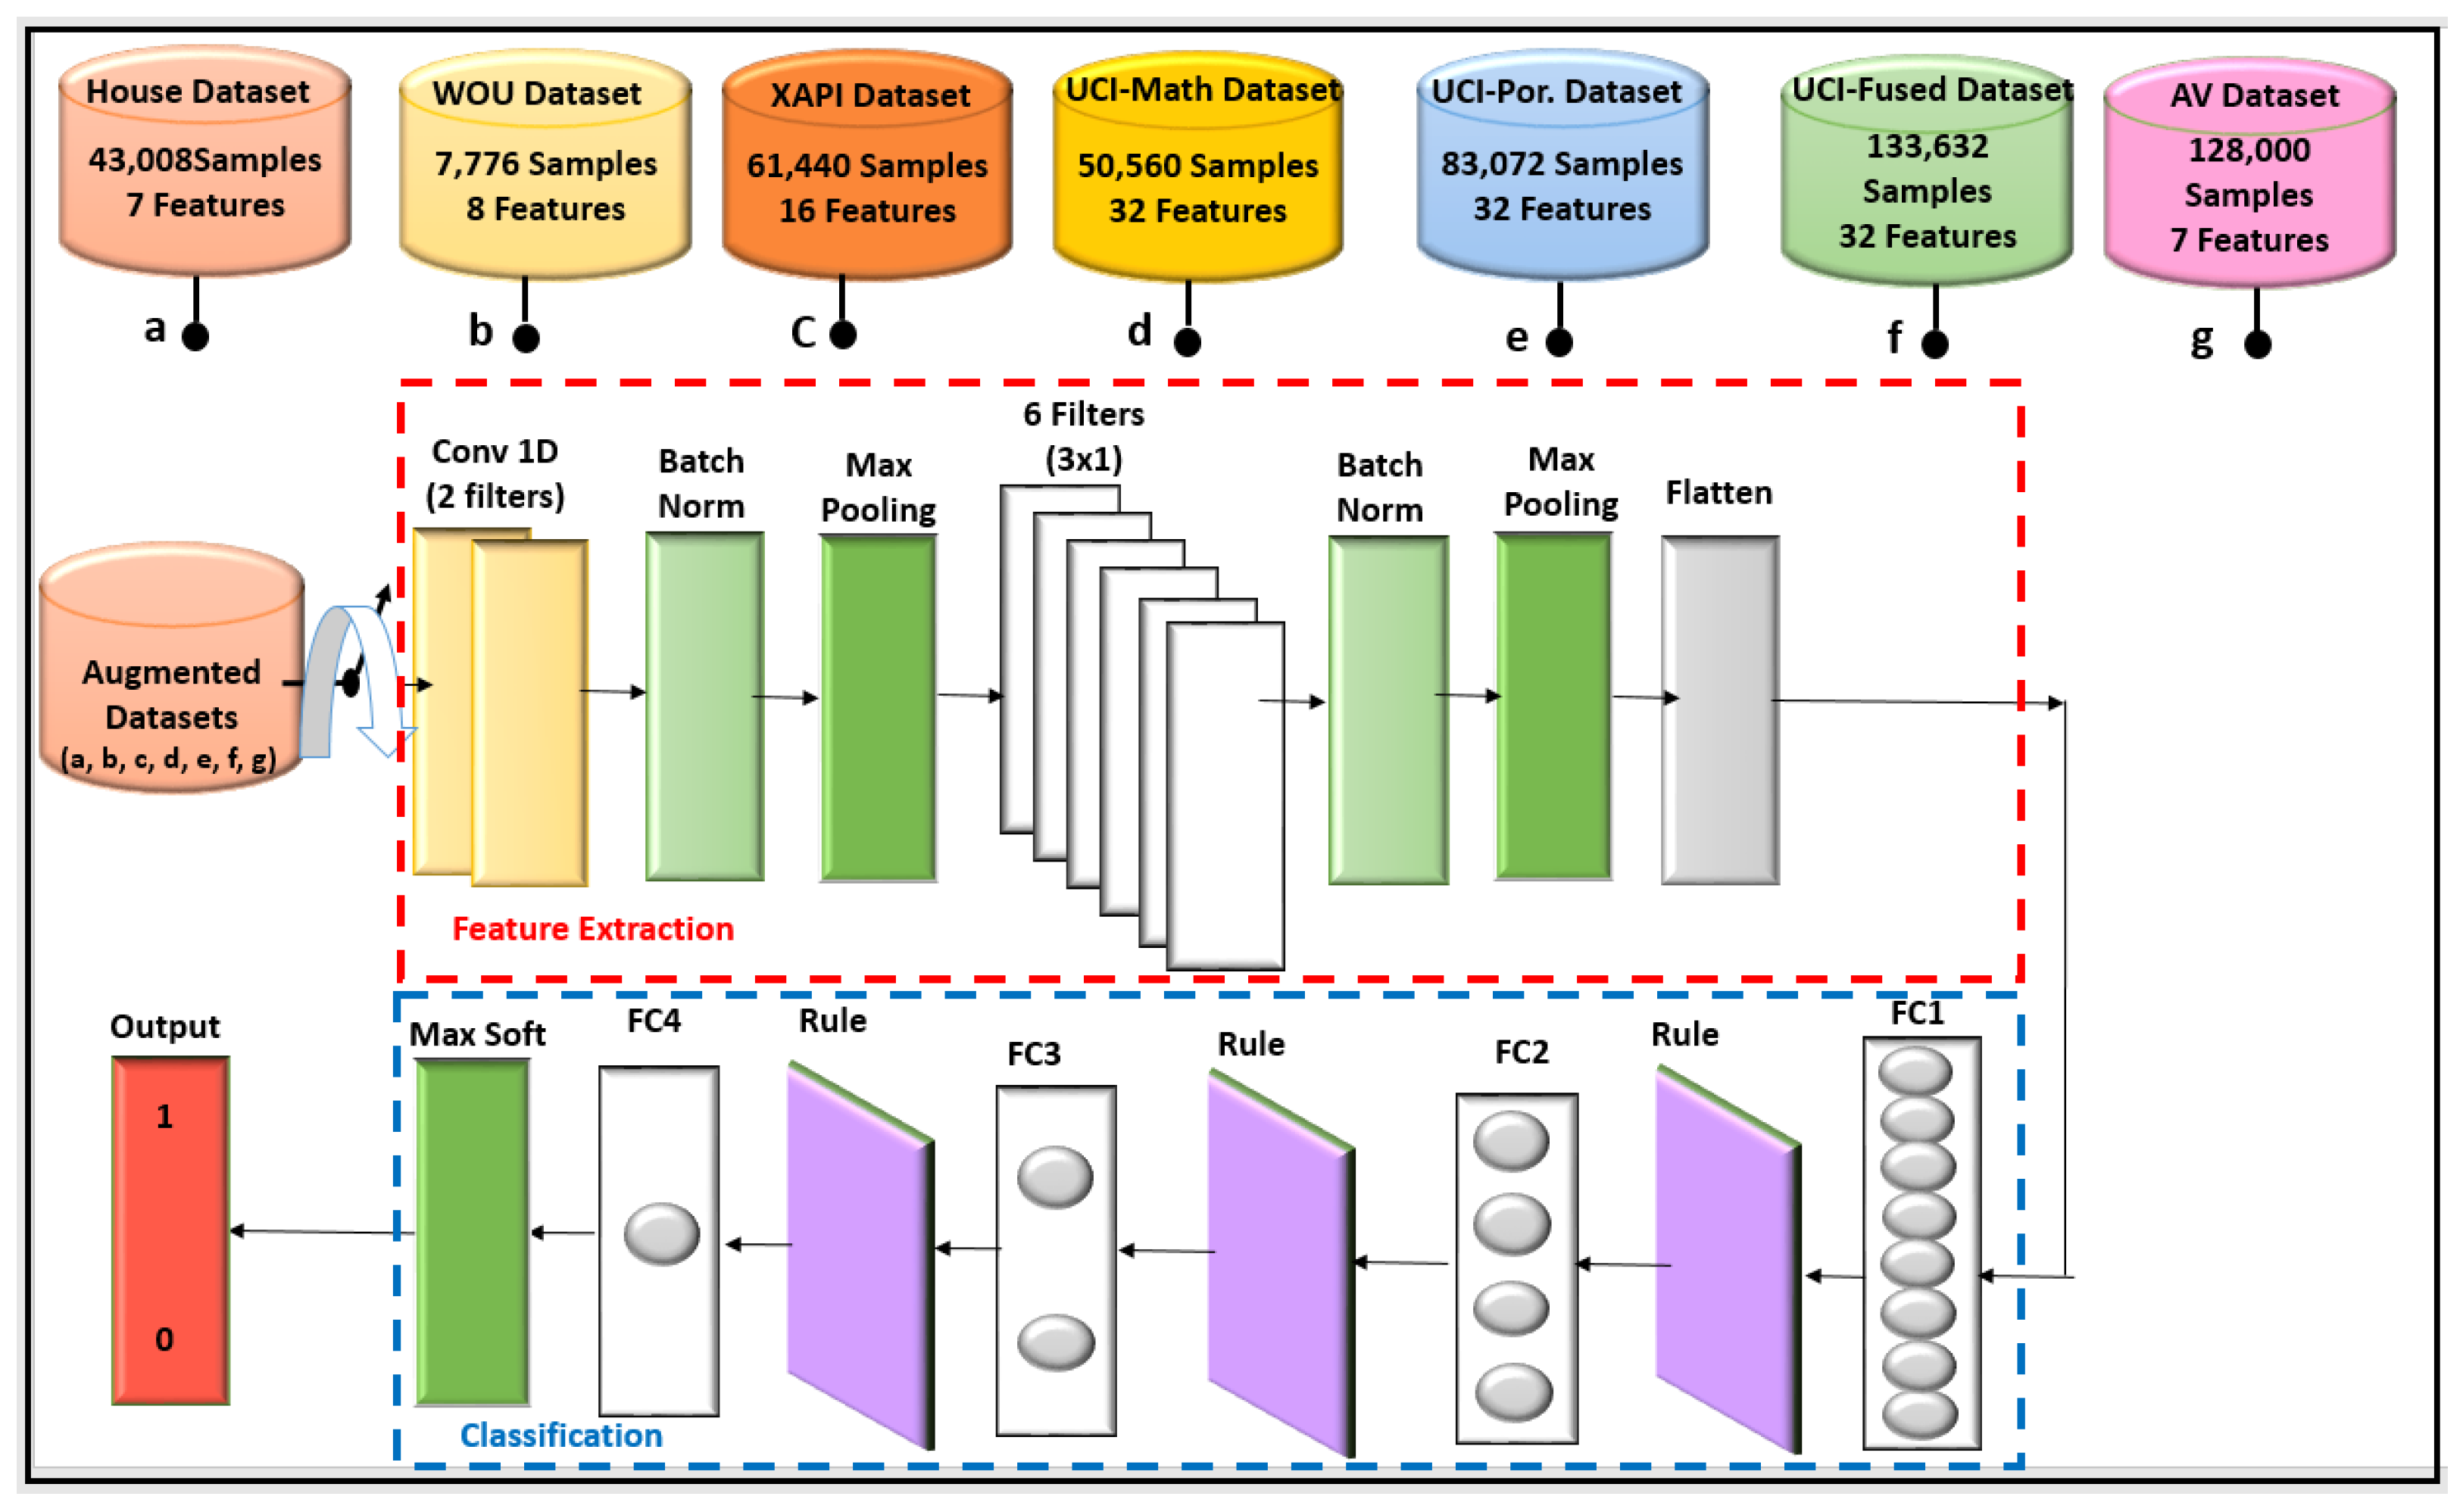
The framework structure for the CNN which is used in this paper is illustrated in
Figure 2. According to
Figure 2, the CNN approach can be divided into two main parts, namely, feature extraction and classification.
In the first part, the convolutional layer (Conv1D) is used to extract features from raw data and has two filter banks with a 3 × 1 size. The batch normalization layer is utilized to speed up the training process and make it easy. The maximum pooling layer is used to reduce the dimension of the extracted features by the Conv1D. The Rectified Linear Unit (Rule) layer represents the activation function f(x) = max(0, x). The batch normalization layer is used to speed up the training process, since after data augmentation, the number of samples is increased. The max pooling layer reduces the dimension of the extracted features by the Conv1D. The second Conv1D has 6 filter banks with a 3 × 3 filter size. In the same manner, batch normalization and maximum pooling followed the second Conv1D. Then, the flatten layer is used to flatten the feature as one vector of n-values.
In the second part, the first Fully Connected layer (FC1) contains 8 neurons, which are followed by the Rule layer. Then, the second FC2, which contains 4 neurons, is followed by another rule layer. Subsequently, the third FC3 of 2 neurons is followed by a further rule layer. Finally, an FC4 of one neuron is followed by a soft-max activation layer which is used to produce the final decisions. The soft-max function, also called the normalized exponential function, converts an integer real number into probability [
44,
45,
46,
47,
48,
49,
50,
51].
4. Datasets
In this paper, five main datasets are used, namely, the House, WOU, XAPI, UCI, and AV student performance datasets. However, the UCI dataset was divided into three subsets, which are UCI-Math, UCI-Portuguese, and UCI-Fused, as shown in
Table 1. In addition, the AV dataset has three targets (Math, Reading, and Writing) for the same observations. The description of each dataset is explained below.
4.1. Mustansiriyah University Dataset (House)
In this dataset, 25 features are employed according to the students’ degrees, which are related to the control class for fourth year students in the College of Computer Engineering at Mustansiriyah University. In this paper, only seven features are selected based on the most important features out of twenty-five features according to the Gradient Boosting Machine (GBM) [
52]. Ultimately, we eliminate unimportant, low-importance, and missing features, while the important features should be saved for classification [
53,
54,
55,
56]. The total number of samples used is 43,008. The system trains 80% of the overall number of samples, which equals 34,406 samples (34,084 samples for training set and 10,322 for validation set), while the rest of the dataset is used for testing with 20% of the data (8602 samples), as shown in
Table 1. It should be noted that the House database was augmented, which is a technique of artificially increasing the training set by creating modified copies of a dataset using existing data. It includes making minor changes to the dataset or using deep learning to generate new data points. The augmented database (modified database) is presented in the following link (
https://drive.google.com/drive/folders/1reIb5ejl1udV_L92W28s30CEHC26j4zO, accessed on 5 June 2023) in order to be a benchmark for other researchers wanting to compare their related work.
4.2. Western Ontario University (WOU) Dataset
The data were gathered from an undergraduate science course delivered to second year students at the University of Western Ontario [
57]. The 486 enrolled students’ marks for the various assignments, tests, and examinations comprise the dataset. There are nine features in the dataset altogether. In this study, only eight features are employed, with the ninth feature serving as the target. The final grade was divided into two categories (classes): Good (representing the students who will pass the course with a good mark, between 60 and 100) and Weak (representing the students who will pass the course with a poor grade, less than or equal to 59). The datasets are processed according to the same protocol of evaluation for the first dataset (House dataset). In addition, in this work, the division of the WOU dataset based on the training and testing phase is 80%, and 20%, respectively. The training process used an overall 388 samples, including 271 training samples and the validation set of 117 samples. Furthermore, the testing phase included 98 samples. In the same manner, this dataset was augmented to 7776 samples, which were divided into 4354, 1866, and 1556 samples for training, validation (which both represented the 80% of data for the training phase), and testing set, respectively, as shown in
Table 1.
4.3. Experience Application Programming Interface (XAPI) Dataset
This database was collected by utilizing the experience from the Kalboard 360 E-learning system [
58,
59]. The dataset has 16 features for 480 students’ records through two semesters. The first semester contains 245 students’ records, while the rest of the students’ records were left for the second semester. The features were divided into three categories: demographic (such as nationality and gender), academic background (such as semester and grade), and behavioral attitudes (such as raised hand in class and discussion groups). The aim of this data was to estimate the student behavior through the academic semester. In addition,
Table 1 illustrates the number of samples used in this dataset, which was 61,440 overall samples, which were divided into 34,406 samples for the training set as well as 14,746 samples for the validation set (both were used during the training process). The remaining data were left for the testing phase, specifically, 12,288 samples. The data were augmented as for the previous datasets with similar training and testing divisions (80% were employed during the training phase, while 20% were employed for testing evaluation).
4.4. The University of California, Irvine (UCI) Dataset
This data approached student achievement in secondary education for two Portuguese schools. The data attributes include student grades, demographic, social, and school-related features and were collected by using school reports and questionnaires at the University of Minho in Portugal [
60]. However, this dataset was published in The University of California, Irvine (UCI). Two datasets were provided regarding the performance of the two distinct subjects: Mathematics (mat) and Portuguese language (por). In [
60], the two datasets were modeled under binary/five-level classification and regression tasks. The evaluation was applied to three data sets: a math course, a Portuguese language course, and a fusion of the Math course and Portuguese language course. In this dataset, 32 features were applied by using the CNN classifier. The UCI dataset contains two datasets in the database based on two courses, and they are the Math course dataset with 395 samples and the Portuguese language course dataset with 649 samples, combined to obtain the overall samples of 1044 samples by fusing the Math and Portuguese language datasets [
60]. In addition, the data were divided into 80% for the training phase and 20% for the testing phase. The training set included 221 samples, the validation set contained 95 samples, and the testing phase included 79 samples for the Math course, as shown in
Table 1. In addition, for the Portuguese course (
Table 1), the training set contained 363 samples, the validation set 156 samples, and the testing set 130 samples. These datasets (UCI-Math and UCI-Por) were augmented similarly to the previous three datasets to increase the number of samples, as depicted in
Table 1. Furthermore, the augmented data for UCI-Math contains 50,560 overall samples, in which 28,313 and 12,135 were used in the training process as a training set and validation set, respectively. As for the remaining data 10,112 samples were applied in the testing process. On the other hand, the augmented UCI-Por set included 83,072 overall samples, including 64,519 samples for training and 19,938 samples for the validation set which where employed in the training phase, while 16,615 samples were utilized in the test phase.
Moreover, in this work, the division was used for the fusion between the Math course and the Portuguese language course. Consequently, for the fusion dataset, the training set included 584 samples, the validation had 251 samples, and the test had 209 samples. The augmented fused UCI dataset contained 133,623 samples, which were subdivided into 74,833, 32,072, and 26,726 samples for the training, validation, and testing set, respectively. The training set and validation set were used in the training process, while the testing set was using in the evaluation, as shown in the
Table 1.
4.5. Analytics Vidhya (AV) Dataset
This dataset can be categorized into five main features, namely, gender, race/ethnicity, parental level of education, lunch, and test preparation course. In addition, gender can be subdivided into male and female, according to the sex of the students. The ethnicity of students can be sub-classified into five groups (A, B, C, D, E). Depending on the parents’ final education, the parental level of education includes a bachelor’s degree, some college, master’s degree, and associate’s degree. Moreover, the fourth feature is lunch, which can be sub-categorized into standard or free and reduced, which was provided before the test. Finally, the last feature is a test preparation course, which was divided into complete or not complete before the test.
In this dataset, there are three types of scores, namely, math, reading, and writing. In this paper, we applied a multi-target approach. The first target is math while the remaining scores (reading and writing) are treated as features to bring the total number of features to seven by adding these to the main five features. Similarly, for the reading target, we math and writing as a feature and these are added to the main five features to be seven features in total. Likewise, in the third stage, the target is writing while both math and reading are considered as features and added to the main five features to equal a total of seven features. To our knowledge, nobody else has evaluated this new 2023 database. The original number of samples is 1000 and this dataset was augmented similarly to the previous datasets to be 128,000 samples. The original AV dataset was found through this link (
https://www.analyticsvidhya.com/blog/2023/04/student-performance-analysis-and-prediction/, accessed on 5 June 2023). The same data division (80% and 20% for training and testing, respectively) was applied to this dataset, as shown in
Table 1.
5. Results and Discussions
5.1. Simulation 1
In Simulation 1, the proposed system employed the TMLCs methods by applying the seven classifiers mentioned in
Section 3, and the proposed system was evaluated by using only the House dataset. The features were renamed from F1 to F25 with the same sequence as the original file of the highly correlated data before normalization. However, the analyses used normalized features. One feature has a single unique value, and the highly correlated features as shown in
Table 2 below show seven features with a correlated magnitude greater than 0.65.
The zero-importance features are the features which were removed by the gradient boosting model; these 18 features with zero importance after applying the one-hot encoding method are F1, F2, F3, F4, F6, F7, F8, F9, F10, F12, F13, F14, F15, F17, F20, F21, F23, and F24. However, seven features are required for 0.99 of cumulative importance, while the low significance of seven features is required for cumulative importance of 0.99 after one-hot encoding. In addition, eighteen features did not contribute to the cumulative significance of 0.99. Therefore, the eighteen features were removed, and the seven features were selected (F5, F11, F16, F18, F19, F22, and F25) and then applied to two proposed schemes, namely, TMLCs and CNN.
As mentioned in the previous section, the training phase was 80% of the data while the testing phase was 20%.
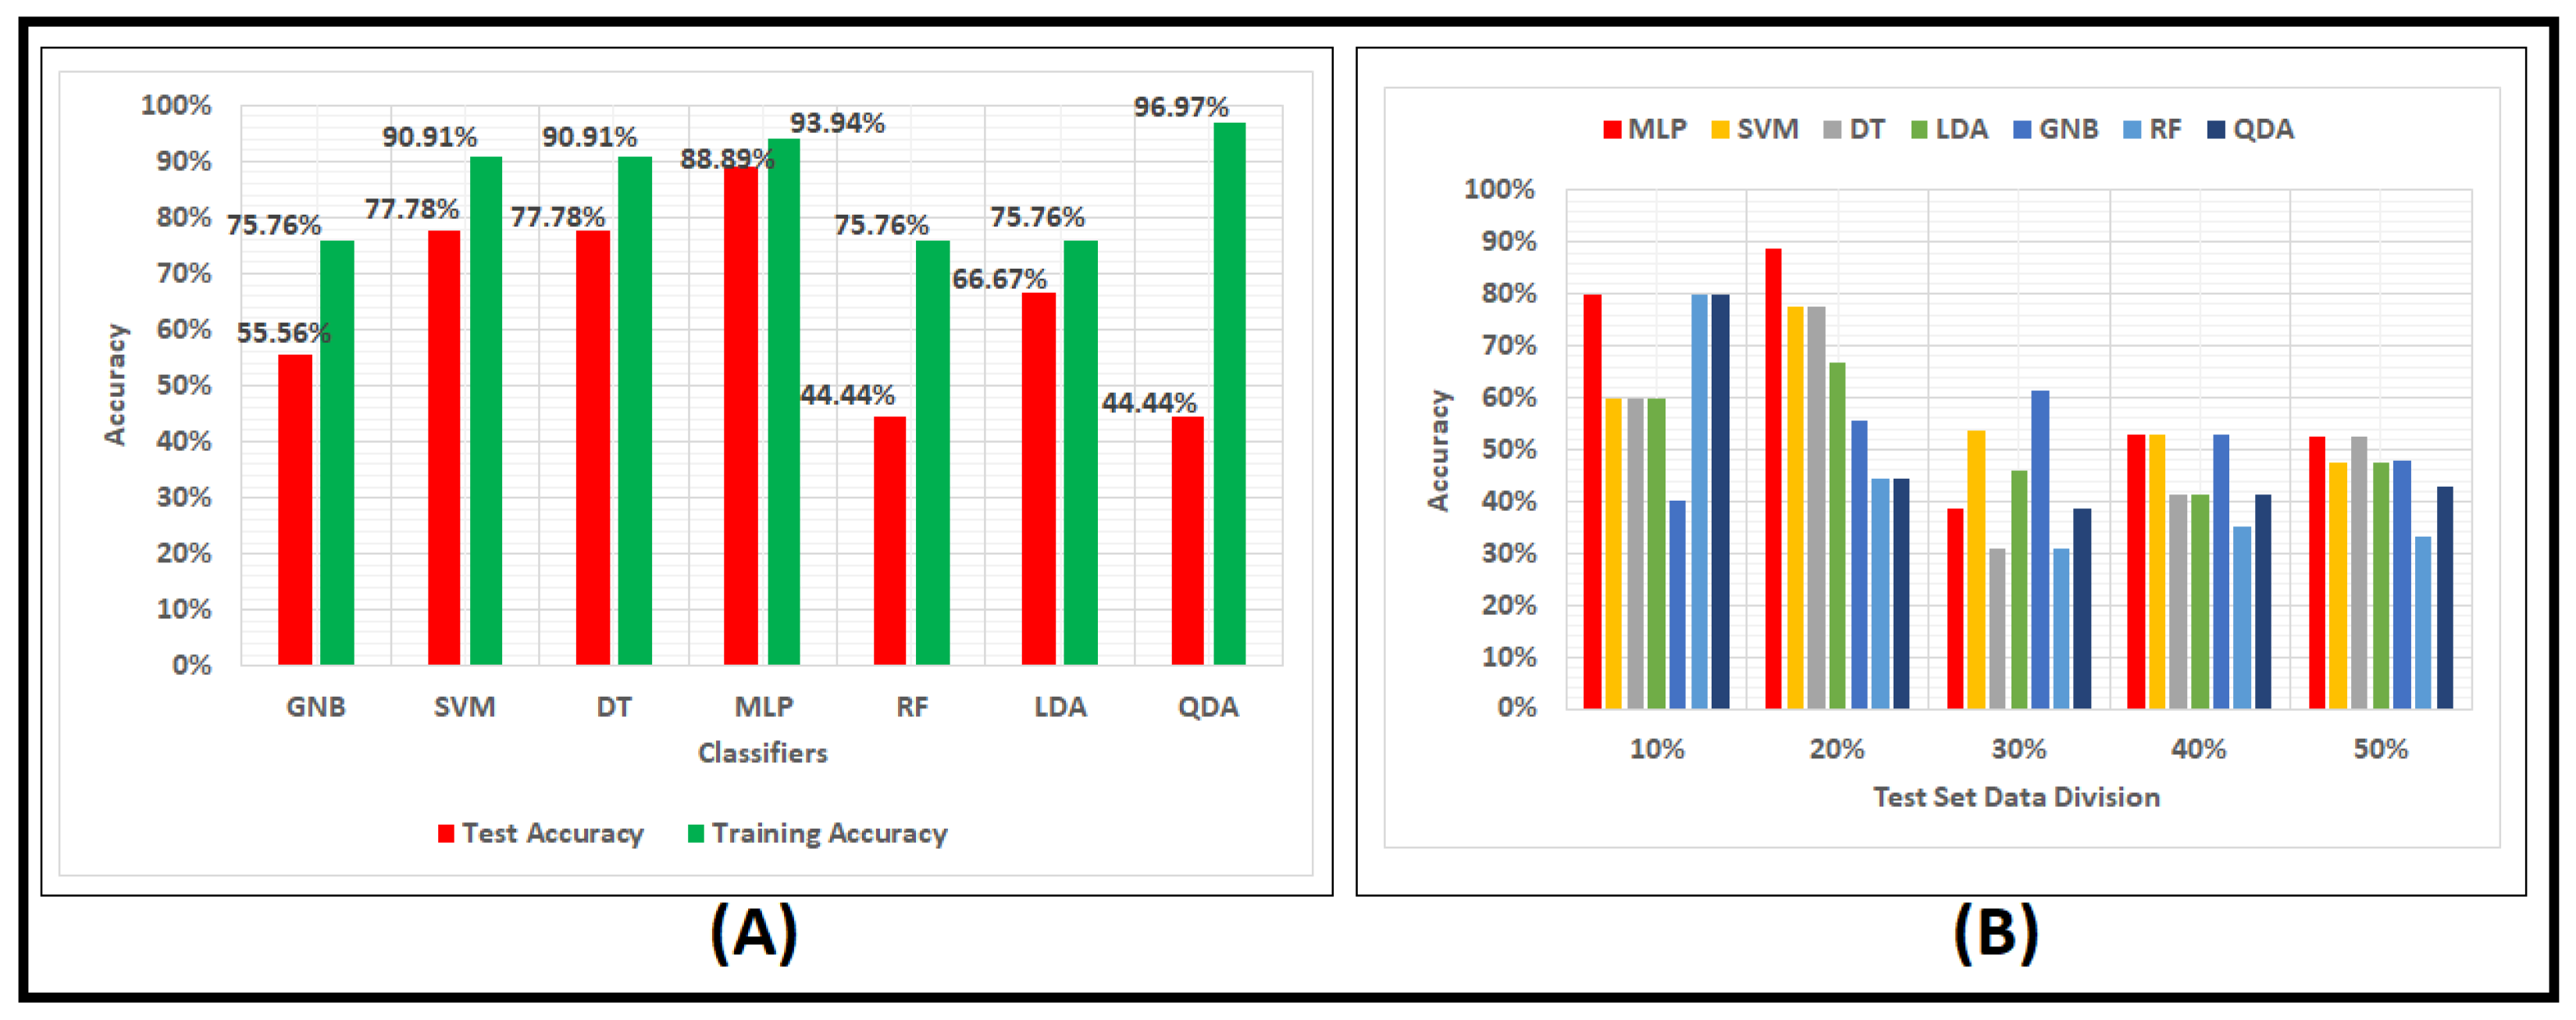
Figure 3A shows a comparison among the seven classifiers applied for seven features for the data division of training set 80% and testing set 20%. In the bar chart, the red color bars explain the accuracies obtained from the testing phase. In contrast, the green color bars show the training accuracies. The results achieved for test accuracy were 88.89%, 77.78%, 77.78%, 66.67%, 55.5%6, 44.44%, and 44.44% for MLP, SVM, DT, LDA, GNB, RF, and QDA, respectively. The best result was the MLP accuracy and the worst were the RF and the QDA for the data division with a training set of 80% and the test set with 20% of the data.
As presented in
Figure 3B, the best classifier out of the seven classifiers is the one that achieved the highest accuracy through five different data divisions between the training set and the testing set. The bar chart in
Figure 3B denotes the red color bars for the MLP classifier, orange color bars for SVM, gray color bars for DT, green color bars for LDA, dark blue color bars for GNB, light blue color bars for RF, and black color bars for QDA. These bars show the test accuracy among the five data divisions for the best classifier. These divisions are 10%, 20%, 30%, 40%, and 50% of the testing data. The outcomes from the figure show that the MLP classifier is the best classifier (at the testing division 20%) with approximately 89% accuracy when tested among five different divisions.
5.2. Simulation 2
In this simulation, five main experiments were performed by applying the proposed CNN approach on the five main datasets: the House, WOU, XAPI, UCI, and AV datasets. The proposed CNN approach was applied to the House, WOU, XAPI, UCI, and AV datasets in Experiment 1, Experiment 2, Experiment 3, Experiment 4, and Experiment 5, respectively. The evaluation protocol of simulation 2 had 54 evaluations based on the proposed CNN for the six different iterations (1, 3, 5, 7, 9, and 11) that were applied to the seven mentioned datasets, in which one of them (AV) has three targets. It was noted that, when increasing the number of iterations by more than 11, the performance saturated. Moreover, the proposed CNN model could extract powerful features using adaptive filters in the convolutional layer by adjusting filter weights according to the observation in each dataset, which could be classified by just four fully connected layers. Therefore, the CNN approach produces a higher accuracy compared with other traditional classifiers.
Table 3 shows the evaluation accuracies for the proposed CNN approach to the House, WOU, XAPI, UCI-Math, UCI-Por, Fused UCI, AV-Math, AV-Reading, and AV-Writing datasets. The bold font for the accuracies in this table highlights the highest accuracy attained for each dataset.
The bar chart in
Figure 4 shows the comparisons of the MSE for all the datasets under 80% training and 20% testing divisions. The red color of the bars denotes the lowest MSE accomplished for each dataset. The lowest MSE was achieved by the UCI-Fused dataset with 0.35%.
5.3. Comparative Evaluation
In this section, comparative evaluations are employed based on two tables (
Table 4 and
Table 5) in order to compare the proposed work with related work which used the same datasets and different datasets, respectively.
In
Table 4, “Proposed 1” refers to the original number of samples for all datasets. “Proposed 2” refers to the augmented number of samples in all datasets.
Table 5 shows the comparison between the proposed techniques with other state-of-the-art works ([
5,
6,
7,
9,
10,
11,
13,
16,
17]) where different datasets were used. It is clear from the results of the performance accuracy that the proposed work outperforms other state-of-the-art work. The best accuracy in the proposed method was obtained by the CNN, which attained a performance accuracy of 99.67% by using a UCI-Fused dataset. It was noted that all the evaluations in terms the seven augmented datasets are new and nobody else has evaluated these modified datasets. In addition, the evaluation of a new 2023 AV dataset is novel to this research.
Then, we compare the proposed work with other state-of-the-art work which employed different datasets, as shown in
Table 5. The results for both tables show that the performance accuracy achieved by the proposed work outperforms other performance accuracies obtained by other works.
6. Conclusions
Several machine learning algorithms were used in this research to estimate student performance. Thorough evaluations in terms of five main datasets, namely, House, WOU, XAPI, UCI, and AV datasets, were undertaken. The UCI dataset is subdivided into three subset datasets: UCI-Math, UCI-Por, and UCI fused. Furthermore, the AV dataset has three targets (Math, Reading, and Writing). Two main simulations were proposed. The first one is in terms of TMLCs (MLP, SVM, DT, LDA, GNB, RF, and QDA) as well as the fusion of TMLCs. The TMLCs approaches with their fusion were applied to the House dataset only. The main conclusion of this simulation is as follows: Firstly, higher accuracy was achieved by the MLP approach, which is similar to the fusion of TMLCs; secondly, the best samples division was 80% for training and 20% for testing, which was applied to all the later evaluations.
The second simulation included five experiments by applying the CNN approach to the five main datasets. In addition, the augmentation process was used to increase the data size to be suitable for the CNN approach. Two important conclusions were drawn from this simulation. The first is that the CNN approach gives higher accuracy than all other TMLCs as well as their fusions. Secondly, the augmented datasets significantly improve performance accuracy. In addition, the proposed CNN technique outperforms all other state-of-the-art works.
This comprehensive evaluation can be used as a benchmark for other researchers related to the student performance task. The most important point in this work is that we evaluated seven augmented datasets (modified datasets) as well as a new 2023 AV dataset, whereby nobody else has previously evaluated these datasets.
The main contribution of our paper is that we evaluated seven augmented datasets (newly modified), which, to our knowledge, have not been evaluated before. In addition, we evaluated for the first time the original and augmented forms of a new 2023 AV dataset. These comprehensive evaluations will be a benchmark for other researchers working in the student performance field. In addition, this study will be extended for future work by squeezing the CNN model to reduce the amount of the proposed CNN structures and their trained weight in order to be applied to mobile environments. The proposed CNN method was custom-designed and, to our knowledge, no previous research has used the same structure and has obtained better reported results.
Author Contributions
Conceptualization, A.S.M., M.T.S.A.-K., J.A.A.-A. and J.A.C.; methodology, A.S.M.; software, A.S.M.; validation, A.S.M., M.T.S.A.-K. and J.A.A.-A.; formal analysis, A.S.M., M.T.S.A.-K., J.A.A.-A. and J.A.C.; investigation, A.S.M.; resources, A.S.M., M.T.S.A.-K., J.A.A.-A. and J.A.C.; data curation, A.S.M., M.T.S.A.-K., J.A.A.-A. and J.A.C.; writing—original draft preparation, A.S.M. and M.T.S.A.-K.; writing—review and editing, A.S.M., M.T.S.A.-K., J.A.A.-A. and J.A.C.; visualization, A.S.M.; supervision, J.A.C. and A.S.M.; project administration, A.S.M.; funding acquisition, A.S.M., M.T.S.A.-K. and J.A.A.-A. All authors have read and agreed to the published version of the manuscript.
Funding
This research received no external funding.
Data Availability Statement
Our house data information and the link for it are exist in
Section 4.1 and the ethical and privacy restrictions were taken into consideration.
Acknowledgments
The authors would like to thank the department of Computer Engineering, and the department of Electrical Engineering at Mustansiriyah University, College of Engineering, Baghdad, Iraq, for their constant support and encouragement, and for House data collection.
Conflicts of Interest
The authors declare no conflict of interest.
Abbreviations
The following abbreviations are used in this manuscript:
| DNN | Deep Neural Network |
| KNN | K-Nearest Neighbors |
| ANN | Artificial Neural Network |
| LR | Linear Regression |
| GBT | Gradient Boosting Tree |
| GBC | Gradient Boosting Classifier |
| ORRL | One R Rule Learner |
| SPC | Statistical Process Control |
| LSTM | Long Short Term Memory |
| SPD | Student Performance Dataset |
| SPAD | Student Performance Academic Dataset |
References
- Double, K.S.; McGrane, J.A.; Hopfenbeck, T.N. The impact of peer assessment on academic performance: A meta-analysis of control group studies. Educ. Psychol. Rev. 2020, 32, 481–509. [Google Scholar] [CrossRef]
- Sandra, L.; Lumbangaol, F.; Matsuo, T. Machine learning algorithm to predict student’s performance: A systematic literature review. TEM J. 2021, 10, 1919–1927. [Google Scholar] [CrossRef]
- Albreiki, B.; Zaki, N.; Alashwal, H. A systematic literature review of student’performance prediction using machine learning techniques. Educ. Sci. 2021, 11, 552. [Google Scholar] [CrossRef]
- Alamri, R.; Alharbi, B. Explainable student performance prediction models: A systematic review. IEEE Access 2021, 9, 33132–33143. [Google Scholar] [CrossRef]
- Dhilipan, J.; Vijayalakshmi, N.; Suriya, S.; Christopher, A. Prediction of students performance using machine learning. In Proceedings of the IOP Conference Series: Materials Science and Engineering, Sanya, China, 12–14 November 2021; IOP Publishing: Bristol, UK, 2021; Volume 1055, p. 012122. [Google Scholar]
- Altabrawee, H.; Ali, O.A.J.; Ajmi, S.Q. Predicting students’ performance using machine learning techniques. J. Univ. Babylon Pure Appl. Sci. 2019, 27, 194–205. [Google Scholar] [CrossRef]
- Aziz, S.F.A. Students’ Performance Evaluation Using Machine Learning Algorithms. Coll. Basic Educ. Res. J. 2020, 16, 977–986. [Google Scholar] [CrossRef]
- Bhusal, A. Predicting Student’s Performance Through Data Mining. arXiv 2021, arXiv:2112.01247. [Google Scholar]
- Baashar, Y.; Alkawsi, G.; Ali, N.; Alhussian, H.; Bahbouh, H.T. Predicting student’s performance using machine learning methods: A systematic literature review. In Proceedings of the 2021 International Conference on Computer & Information Sciences (ICCOINS), Kuching, Malaysia, 13–15 July 2021; IEEE: New York, NY, USA, 2021; pp. 357–362. [Google Scholar]
- Kim, B.H.; Vizitei, E.; Ganapathi, V. GritNet: Student performance prediction with deep learning. arXiv 2018, arXiv:1804.07405. [Google Scholar]
- Hasan, H.R.; Rabby, A.S.A.; Islam, M.T.; Hossain, S.A. Machine learning algorithm for student’s performance prediction. In Proceedings of the 2019 10th International Conference on Computing, Communication and Networking Technologies (ICCCNT), Kanpur, India, 6–8 July 2019; IEEE: New York, NY, USA, 2019; pp. 1–7. [Google Scholar]
- Salih, N.Z.; Khalaf, W. Prediction of student’s performance through educational data mining techniques. Indones. J. Electr. Eng. Comput. Sci. 2021, 22, 1708–1715. [Google Scholar] [CrossRef]
- Kabakchieva, D. Student performance prediction by using data mining classification algorithms. Int. J. Comput. Sci. Manag. Res. 2012, 1, 686–690. [Google Scholar]
- Al-Shehri, H.; Al-Qarni, A.; Al-Saati, L.; Batoaq, A.; Badukhen, H.; Alrashed, S.; Alhiyafi, J.; Olatunji, S.O. Student performance prediction using support vector machine and k-nearest neighbor. In Proceedings of the 2017 IEEE 30th Canadian Conference on Electrical and Computer Engineering (CCECE), Windsor, ON, Canada, 30 April–3 May 2017; IEEE: New York, NY, USA, 2017; pp. 1–4. [Google Scholar]
- Sekeroglu, B.; Dimililer, K.; Tuncal, K. Student performance prediction and classification using machine learning algorithms. In Proceedings of the 2019 8th International Conference on Educational and Information Technology, Cambridge, UK, 2–4 March 2019; pp. 7–11. [Google Scholar]
- Wang, X.; Yu, X.; Guo, L.; Liu, F.; Xu, L. Student performance prediction with short-term sequential campus behaviors. Information 2020, 11, 201. [Google Scholar] [CrossRef]
- Dien, T.T.; Luu, S.H.; Thanh-Hai, N.; Thai-Nghe, N. Deep learning with data transformation and factor analysis for student performance prediction. Int. J. Adv. Comput. Sci. Appl. 2020, 11, 711–721. [Google Scholar] [CrossRef]
- Ontivero-Ortega, M.; Lage-Castellanos, A.; Valente, G.; Goebel, R.; Valdes-Sosa, M. Fast Gaussian Naïve Bayes for searchlight classification analysis. Neuroimage 2017, 163, 471–479. [Google Scholar] [CrossRef]
- Raizada, R.D.; Lee, Y.S. Smoothness without smoothing: Why Gaussian naive Bayes is not naive for multi-subject searchlight studies. PLoS ONE 2013, 8, e69566. [Google Scholar] [CrossRef]
- Ali, L.; Khan, S.U.; Golilarz, N.A.; Yakubu, I.; Qasim, I.; Noor, A.; Nour, R. A feature-driven decision support system for heart failure prediction based on statistical model and Gaussian naive bayes. Comput. Math. Methods Med. 2019, 2019, 6314328. [Google Scholar] [CrossRef]
- Noble, W.S. What is a support vector machine? Nat. Biotechnol. 2006, 24, 1565–1567. [Google Scholar] [CrossRef] [PubMed]
- Hearst, M.A.; Dumais, S.T.; Osuna, E.; Platt, J.; Scholkopf, B. Support vector machines. IEEE Intell. Syst. Their Appl. 1998, 13, 18–28. [Google Scholar] [CrossRef]
- Meyer, D.; Wien, F. Support vector machines. Interface Libsvm Package e1071 2015, 28, 20. [Google Scholar]
- Myles, A.J.; Feudale, R.N.; Liu, Y.; Woody, N.A.; Brown, S.D. An introduction to decision tree modeling. J. Chemom. J. Chemom. Soc. 2004, 18, 275–285. [Google Scholar] [CrossRef]
- Song, Y.Y.; Ying, L. Decision tree methods: Applications for classification and prediction. Shanghai Arch. Psychiatry 2015, 27, 130. [Google Scholar] [PubMed]
- Nowozin, S.; Rother, C.; Bagon, S.; Sharp, T.; Yao, B.; Kohli, P. Decision tree fields. In Proceedings of the 2011 International Conference on Computer Vision, Barcelona, Spain, 6–13 November 2011; IEEE: New York, NY, USA, 2011; pp. 1668–1675. [Google Scholar]
- Priyam, A.; Abhijeeta, G.; Rathee, A.; Srivastava, S. Comparative analysis of decision tree classification algorithms. Int. J. Curr. Eng. Technol. 2013, 3, 334–337. [Google Scholar]
- Heidari, A.A.; Faris, H.; Mirjalili, S.; Aljarah, I.; Mafarja, M. Ant lion optimizer: Theory, literature review, and application in multi-layer perceptron neural networks. Nat.-Inspired Optim. Theor. Lit. Rev. Appl. 2020, 811, 23–46. [Google Scholar]
- Zhao, Z.; Xu, S.; Kang, B.H.; Kabir, M.M.J.; Liu, Y.; Wasinger, R. Investigation and improvement of multi-layer perceptron neural networks for credit scoring. Expert Syst. Appl. 2015, 42, 3508–3516. [Google Scholar] [CrossRef]
- Mohammad, A.S. Weather temperature forecasting using artificial neural network. J. Eng. Sustain. Dev. 2011, 15, 130–139. [Google Scholar]
- Mitra, S.; Pal, S.K. Fuzzy multi-layer perceptron, inferencing and rule generation. IEEE Trans. Neural Netw. 1995, 6, 51–63. [Google Scholar] [CrossRef]
- Biau, G.; Scornet, E. A random forest guided tour. Test 2016, 25, 197–227. [Google Scholar] [CrossRef]
- Belgiu, M.; Drăguţ, L. Random forest in remote sensing: A review of applications and future directions. ISPRS J. Photogramm. Remote Sens. 2016, 114, 24–31. [Google Scholar] [CrossRef]
- Breiman, L. Random forests. Mach. Learn. 2001, 45, 5–32. [Google Scholar] [CrossRef]
- Oshiro, T.M.; Perez, P.S.; Baranauskas, J.A. How many trees in a random forest? In Machine Learning and Data Mining in Pattern Recognition, Proceedings of the 8th International Conference, MLDM 2012, Berlin, Germany, 13–20 July 2012; Proceedings 8; Springer: Berlin/Heidelberg, Germany, 2012; pp. 154–168. [Google Scholar]
- Hoecker, A.; Kartvelishvili, V. SVD approach to data unfolding. Nucl. Instruments Methods Phys. Res. Sect. Accel. Spectrometers, Detect. Assoc. Equip. 1996, 372, 469–481. [Google Scholar] [CrossRef]
- Aharon, M.; Elad, M.; Bruckstein, A. K-SVD: An algorithm for designing overcomplete dictionaries for sparse representation. IEEE Trans. Signal Process. 2006, 54, 4311–4322. [Google Scholar] [CrossRef]
- Holmes, M.; Gray, A.; Isbell, C. Fast SVD for large-scale matrices. In Proceedings of the Workshop on Efficient Machine Learning at NIPS, Whistler, BC, Canada, 7 December 2007; Volume 58, pp. 249–252. [Google Scholar]
- Sadek, R.A. SVD based image processing applications: State of the art, contributions and research challenges. arXiv 2012, arXiv:1211.7102. [Google Scholar]
- Tharwat, A. Linear vs. quadratic discriminant analysis classifier: A tutorial. Int. J. Appl. Pattern Recognit. 2016, 3, 145–180. [Google Scholar] [CrossRef]
- Srivastava, S.; Gupta, M.R.; Frigyik, B.A. Bayesian quadratic discriminant analysis. J. Mach. Learn. Res. 2007, 8, 1277–1305. [Google Scholar]
- Bose, S.; Pal, A.; SahaRay, R.; Nayak, J. Generalized quadratic discriminant analysis. Pattern Recognit. 2015, 48, 2676–2684. [Google Scholar] [CrossRef]
- Li, Q.; Shao, J. Sparse quadratic discriminant analysis for high dimensional data. Stat. Sin. 2015, 457–473. [Google Scholar] [CrossRef]
- Gu, J.; Wang, Z.; Kuen, J.; Ma, L.; Shahroudy, A.; Shuai, B.; Liu, T.; Wang, X.; Wang, G.; Cai, J.; et al. Recent advances in convolutional neural networks. Pattern Recognit. 2018, 77, 354–377. [Google Scholar] [CrossRef]
- Albawi, S.; Mohammed, T.A.; Al-Zawi, S. Understanding of a convolutional neural network. In Proceedings of the 2017 International Conference on Engineering and Technology (ICET), Antalya, Turkey, 21–23 August 2017; IEEE: New York, NY, USA, 2017; pp. 1–6. [Google Scholar]
- Mohammad, A.S.; Nguyen, D.H.H.; Rattani, A.; Puttagunta, R.S.; Li, Z.; Derakhshani, R.R. Authentication Verification Using Soft Biometric Traits. US Patent 10,922,399, 16 February 2021. [Google Scholar]
- Mohammad, A.S. Multi-Modal Ocular Recognition in Presence of Occlusion in Mobile Devices; University of Missouri-Kansas City: Kansas, MO, USA, 2018. [Google Scholar]
- Yamashita, R.; Nishio, M.; Do, R.K.G.; Togashi, K. Convolutional neural networks: An overview and application in radiology. Insights Into Imaging 2018, 9, 611–629. [Google Scholar] [CrossRef]
- Al-Kaltakchi, M.; Al-Nima, R.R.O.; Abdullah, M.A.; Abdullah, H.N. Thorough evaluation of TIMIT database speaker identification performance under noise with and without the G. 712 type handset. Int. J. Speech Technol. 2019, 22, 851–863. [Google Scholar] [CrossRef]
- Al-Kaltakchi, M.; Al-Nima, R.R.O.; Abdullah, M.A. Comparisons of extreme learning machine and backpropagation-based i-vectorapproach for speaker identification. Turk. J. Electr. Eng. Comput. Sci. 2020, 28, 1236–1245. [Google Scholar] [CrossRef]
- O’Shea, K.; Nash, R. An introduction to convolutional neural networks. arXiv 2015, arXiv:1511.08458. [Google Scholar]
- Wang, C.; Chang, L.; Liu, T. Predicting student performance in online learning using a highly efficient gradient boosting decision tree. In Proceedings of the Intelligent Information Processing XI: 12th IFIP TC 12 International Conference, IIP 2022, Qingdao, China, 27–30 May 2022; Springer: Berlin/Heidelberg, Germany, 2022; pp. 508–521. [Google Scholar]
- Tang, J.; Alelyani, S.; Liu, H. Feature selection for classification: A review. Data Classif. Algorithms Appl. 2014, 37. [Google Scholar] [CrossRef]
- Dash, M.; Liu, H. Feature selection for classification. Intell. Data Anal. 1997, 1, 131–156. [Google Scholar] [CrossRef]
- Janecek, A.; Gansterer, W.; Demel, M.; Ecker, G. On the relationship between feature selection and classification accuracy. In Proceedings of the New Challenges for Feature Selection in Data Mining and Knowledge Discovery, PMLR, Antwerp, Belgium, 15 September 2008; pp. 90–105. [Google Scholar]
- Xue, B.; Zhang, M.; Browne, W.N. Particle swarm optimization for feature selection in classification: A multi-objective approach. IEEE Trans. Cybern. 2012, 43, 1656–1671. [Google Scholar] [CrossRef]
- Injadat, M.; Moubayed, A.; Nassif, A.B.; Shami, A. Systematic ensemble model selection approach for educational data mining. Knowl.-Based Syst. 2020, 200, 105992. [Google Scholar] [CrossRef]
- Amrieh, E.A.; Hamtini, T.; Aljarah, I. Preprocessing and analyzing educational data set using X-API for improving student’s performance. In Proceedings of the 2015 IEEE Jordan Conference on Applied Electrical Engineering and Computing Technologies (AEECT), Amman, Jordan, 3–5 November 2015; IEEE: New York, NY, USA, 2015; pp. 1–5. [Google Scholar]
- Amrieh, E.A.; Hamtini, T.; Aljarah, I. Mining educational data to predict student’s academic performance using ensemble methods. Int. J. Database Theory Appl. 2016, 9, 119–136. [Google Scholar] [CrossRef]
- Cortez, P.; Silva, A.M.G. Using Data Mining to Predict Secondary School Student Performance. In Proceedings of the 5th Annual Future Business Technology Conference, Porto, Portugal, 5–12 April 2008; Brito, A., Teixeira, J., Eds.; EUROSIS-ETI: Oostende, Belgium, 2008. ISBN 978-9077381-39-7. [Google Scholar]
| Disclaimer/Publisher’s Note: The statements, opinions and data contained in all publications are solely those of the individual author(s) and contributor(s) and not of MDPI and/or the editor(s). MDPI and/or the editor(s) disclaim responsibility for any injury to people or property resulting from any ideas, methods, instructions or products referred to in the content. |
© 2023 by the authors. Licensee MDPI, Basel, Switzerland. This article is an open access article distributed under the terms and conditions of the Creative Commons Attribution (CC BY) license (https://creativecommons.org/licenses/by/4.0/).


 ,
, _Al-Kaltakchi.jpg)


