Article

Enhanced Genetic Method for Optimizing Multiple Sequence Alignment

by
Mohammed K. Ibrahim
1,*,
Umi Kalsom Yusof
1,
Taiseer Abdalla Elfadil Eisa
2 and
Maged Nasser
3
1
School of Computer Sciences, Universiti Sains Malaysia, Gelugor 11800, Penang, Malaysia
2
Department of Information Systems-Girls Section, King Khalid University, Mahayil 62529, Saudi Arabia
3
Computer & Information Sciences Department, Universiti Teknologi PETRONAS, Seri Iskandar 32610, Perak, Malaysia
*
Author to whom correspondence should be addressed.
Mathematics 2023, 11(22), 4578; https://doi.org/10.3390/math11224578
Submission received: 11 October 2023 / Revised: 1 November 2023 / Accepted: 6 November 2023 / Published: 8 November 2023
(This article belongs to the Special Issue Analysis and Application of Optimization Algorithms)

Abstract

:
In the realm of bioinformatics, Multiple Sequence Alignment (MSA) is a pivotal technique used to optimize the alignment of multiple biological sequences, guided by specific scoring criteria. Existing approaches addressing the MSA challenge tend to specialize in distinct biological features, leading to variability in alignment outcomes for the same set of sequences. Consequently, this paper proposes an enhanced evolutionary-based approach that simplifies the sequence alignment problem without considering the sequences in the non-dominated solution. Our method employs a multi-objective optimization technique that uniquely excludes non-dominated solution sets, effectively mitigating computational complexities. Utilizing the Sum of Pairs and the Total Conserved Column as primary objective functions, our approach offers a novel perspective. We adopt an integer coding approach to enhance the computational efficiency, representing chromosomes with sets of integers during the alignment process. Using the SABmark and BAliBASE datasets, extensive experimentation is conducted to compare our method with existing ones. The results affirm the superior solution quality achieved by our approach compared to its predecessors. Furthermore, via the Wilcoxon signed-rank test, a statistical analysis underscores the statistical significance of our model’s improvement (p < 0.05). This comprehensive approach holds promise for advancing Multiple Sequence Alignment in bioinformatics.

1. Introduction

Sequence alignment (SA) is one of the popular approaches in bioinformatics that is used to arrange the primary sequences of DNA/RNA to identify regions of similarity that may have evolutionary or structural relationships among the sequences [1]. It helps to locate portions with a common evolutionary history by arranging multiple sequences such that a maximum number of similar or identical residues are aligned or matched in a column [2]. This can be achieved by aligning the unknown sequences with known sequences from a database [3,4]. SA can broadly be divided into Multiple Sequence Alignment (MSA), where multiple sequences are aligned simultaneously, and pairwise sequence alignment (PSA), where only two sequences are involved in the alignment process. Generally, MSA is the most commonly used tool that is capable of precisely identifying a sequence’s functional and structural information, as it can deal with several sequences of a family at a time [5,6].
MSA can be achieved globally [7], where the similarity over the entire sequence length is generally considered, or locally [8], in which the local best-scoring parts of similar characters are considered. An alignment generally considers scoring functions to measure the alignment quality [9,10]. However, in MSA, it is a challenging task to identify an optimum scoring function since the statistically optimized functions are not biologically optimal [11]. Moreover, in MSA, computational complexity requires many resources [12]. Recently, to improve the MSA optimization process, a dynamic programming approach was applied [13]. However, the dynamic programming-based approaches in MSA generally experience high dimensionality due to the increasing number of sequences, which results in exponential growth of the time requirement [14]. Essentially, the MSA process is NP-complete [15], and thus, all real-world MSA techniques consider heuristic methods that are approximate in real-world situations.
Two different heuristic methods are popularly used for MSA solutions, namely, the iterative and progressive approaches. In the progressive alignment [16], the PSA method addresses an MSA process in which all of the possible sequence pairs are first aligned, and a guide tree based on the pairwise distance values is then developed. Then, eventually, the MSA is generated stepwise via the gradual arrangement of all of the sequences based on the guide tree, in which, mainly, the best alignment pair is considered [17]. A major shortcoming of the progressive approach is that the initial sequence pair alignment usually affects the resultant alignments. Thus, changing the position of the gap in the later stages is practically impossible [18]. To mitigate these issues, among others, iterative approaches are used in the literature [19,20,21,22,23] for the MSA problem. Iterative methods are used to iteratively change the building of the guide tree by adjusting the alignment pairs. One of the popular iterative approaches is the Genetic Algorithm (GA) [24], which is inspired by natural genetics [25,26,27,28].
Several approaches have been introduced to utilize GA to solve MSA problems [27]. For example, SAGA, introduced in [25], uses 22 various GA operators for the MSA. Naznin et al. [26] used a GA-based approach to improve an MSA solution by vertically demarcating the sequences into several sub-sequences. In reference [27], the GA was also applied to identify the best guide tree by iteratively altering the guide trees. In similar methods, GA was integrated with other optimization methods like ant colony optimization (ACO) [29] and the rubber band technique (RBT) to optimize sequence alignment. Currently, the MSA problem is considered a multi-objective process, where each condition can represent a distinct objective function. However, in multi-objective functions, there is a tendency for the accuracy of one objective function to be affected by the optimization of one or more objective functions. Thus, in a real-world situation, a set of non-dominated solutions is generally considered, known as Pareto optimal solutions [30]. Apart from the non-dominated set, no other means is feasible to improve any one of the objective functions without affecting the others [31].
For better MSA optimization, recently, some multi-objective GA-based methods were proposed [12]. One method was introduced in [32], which considered three objective functions: Totally Conserved Columns (TCCs), STRIKE score, and non-gaps percentage. One shortcoming of this method is the inadequate availability of structures. In a similar method [33], three objectives were introduced to derive the non-dominated Pareto alignment solutions: similarity maximization, affine gap penalty minimization, and support maximization. In references [34,35], a shuffled frog-leaping optimization method [36] and an artificial bee colony method [37] were applied, respectively. Both approaches applied two commonly used fitness functions, the sum of pairs (SOP) and TCC, to obtain a Pareto optimal set. These methods utilized another effective Kalign [38] as a local search strategy to improve the solutions’ quality. However, in the multi-objective Pareto optimal method, one needs to specify the dominant and non-dominant solutions to obtain the set of non-dominated solutions. This is hard to conduct in real-world situations [39].
This paper proposes an Enhanced Genetic Method for Optimizing Multiple Sequence Alignment (EGMSA) to address the issues as mentioned earlier. The suggested approach essentially uses a multi-objective optimization technique to achieve a better-quality solution. To mitigate the computational complexity, we ignore any non-dominated set of solutions. In this case, the two popularly applied objective functions, SOP and TCC, are used for the optimization process. More specifically, the entire population of solutions is divided into two different portions, and the population section is achieved based on the two objective functions.
The major contribution of the proposed work is that, different from the existing approaches, an integer-based codification strategy is used, in which chromosomes are coded according to their locations within the corresponding sequence, and gaps are coded according to the final chromosomes’ positions within the corresponding sequence, albeit with a negative value. Moreover, modified crossover and mutation methods are suggested. Lastly, using the sum of pairs and total columns as the fitness functions for population selection is suggested. To demonstrate the efficacy of the suggested approach, a series of experiments was conducted using real-world datasets. The experimental outcomes indicate the power of the suggested approach compared to the baseline methods in terms of both the SOP and TCC.

2. Related Work

This section reviews previous works related to MSA that use multi-objective and metaheuristic methods. Handl et al. introduced one of the earlier approaches to study the multi-objective method in MSA [40]. Since then, several other approaches have been introduced [1]. Seluangsawat et al. [41] introduced an evolutionary method to solve the MSA problem based on outputs obtained from the Clustal X method by utilizing multiple objective functions, which include the gap penalty and the sum of pairs. This method uses three mutation operators and a two-point crossover. Ortuño et al. [32] proposed a multi-objective optimization-based approach that uses the classical metaheuristic NSGA based on structural evaluations to solve MSA problems. The proposed approach optimizes multiple objective functions: non-gap percentage, structural information, and TCC. This method applies the hyper-volume [30] as the quality evaluation measure. Kaya et al. [33] introduced another approach based on the NSGA-II algorithm, which considers three objective functions: similarity, affine gap penalty minimization, and support maximization. This approach uses three mutations and two crossover genetic strategies. Soto and Becera [42] proposed a multi-objective approach based on the genetic technique to optimize pre-aligned sequences. Their suggested model uses three operators: random insertion, two-point crossover, and shift mutation.
Silva et al. [43] proposed Parallel Niche Pareto by using two different objective functions, including the number of totally identical columns and the sum of pairs. Six mutation operators and three crossover strategies were used in this method. Abbasi et al. [44] proposed different local search methods for MSA solutions to minimize the number of indels and maximize the substitution score. The suggested method uses several neighborhood definitions and perturbations. A multi-objective-based approach based on decomposition applied to solve MSA was introduced by Zhu et al. [45]. This model applies a gap insertion operation to generate the initial population. Several existing evolutionary alignment algorithms were compared with the tool to evaluate the model performances.
For better MSA optimization, recently, some multi-objective GA-based methods were proposed [12]. One method was introduced in [32], which considers three objective functions: Totally Conserved Columns (TCCs), the STRIKE score, and non-gaps percentage. One shortcoming of this method is the inadequate availability of structures. In a similar method [33], three objectives were introduced to derive the non-dominated Pareto alignment solutions: similarity maximization, affine gap penalty minimization, and support maximization. Recently, Rubio-Largo et al. [35,46] introduced two different methods to improve the MSA solution: the hybrid multi-objective Memetic Metaheuristic approach [46] and the hybrid multi-objective artificial bee colony method [35]. These two approaches use the conserved columns and weighted sum-of-pairs function (WSP) with affine gap penalties integrated with the Kalign method [47]. Finally, Rani et al. [48] introduced two approaches, the Bacterial Foraging Optimization method and the Hybrid GA with Artificial Bee Colony Algorithm. The authors notably utilized four objective functions: the maximization of similarity, conserved blocks, non-gap percentage, and minimization of gap penalty. However, in the multi-objective Pareto optimal approach, one needs to specify the dominant and non-dominant solutions to obtain the set of non-dominated solutions. This is hard to conduct in real-world situations.
Despite the good performances of the above GA-based methods, they experience several shortcomings. Firstly, some existing algorithms use only one criterion in their objective function, and improving one objective may deteriorate one or more other objectives. It is impossible to optimize a single objective to achieve all objectives simultaneously. Secondly, the conventional GA generally represents a solution or a chromosome with a binary string. However, the binary coding in MSA increases the chromosome/string length, computational complexity, and memory space. Table 1 summarizes some popular state-of-the-art metaheuristic methods (closer to our proposed model) for the MSA, and Table 2 compares our proposed model with existing methods to justify its novelty.

3. Methodology

This section presents the detailed procedure involved in the proposed method. The problem definition is first presented, followed by a description of the multi-objective functions to be optimized using the proposed method.

3.1. Problem Definition

The primary rationale behind sequence alignment is to generate equal lengths of sequences by adding gaps into the sequences. MSA is considered a process of aligning multiple sequences. The process of optimization in MSA involves working on the gaps (grouping, deleting, inserting, etc.) to maximize the given scores. More specifically, a set of sequences is given (S: { s 1 , s 2   s k } of length L 1 , L 2 ,… L k ). Accordingly, the complexity of finding an optimal alignment is O ( K k L k ) , where k is the number of sequences and L is the max ( s 1 ,   s 2 s k ) . Thus, one of the aims of this study is to address the complexity of the MSA solution.

3.2. Multi-Objective Strategy

In this study, a multi-objective method for MSA optimization that can effectively address the NP-complete problem of the existing approaches is presented. To achieve this, the best solution that can simultaneously maximize the two objective functions is sought in this study, namely, SOP ( F 1 ) [39] and TCC ( F 2 ) [27,40]. More specifically, in the suggested method, each chromosome is linked with two objective functions: F 1 and F 2 . In essence, the TCC ( F 2 ) score determines the sequence conservation, while the SOP ( F 1 ) score indicates the quality of the alignments. Determining the quality of the sequence conservation and alignment is a popular strategy for any sequence alignment, so the proposed method opted to use these functions. More specifically, the SOP score can be optimized as follows in Equation (1):
F 1 ( S O P ) = i = 1 k = 1 j = i + 1 k ψ ( S i ,   S j )  
where ψ ( S i , S j ) denotes the score of pairwise alignments between two aligned sequences S i and S j .   k represents the total number of sequences. The BLOSUM 62 matrix [53] is used to obtain the similarity score. The affine gap penalty score can be calculated as follows:
W = Φ + Υ g 1  
where W represents the total g a p p e n a l t y , and Φ and Υ denote the gap opening penalty and the gap extension penalty, respectively. At the same time, g represents the total number of gaps. On the other hand, the F 2   (TCC) considers the number of aligned columns with similar or identical amino acid residues and can be represented as
T c c = i = 1 m C i  
where C i and m denote the identical column and the total identical columns, respectively.

4. The Proposed Model

In this section, details of the suggested EGMSA approach are reported. We propose a genetic algorithm-based multi-objective sequence alignment method. Here, we attempt to improve the SOP and TCC, the two most popular objective functions. The suggested approach lowers the computing complexity compared to the existing multi-objective optimization strategies since it does not consider any non-dominated set of solutions. This creates two halves out of the total population of solutions. Next, a portion of the population is selected using the SOP objective function, while a separate portion is selected using the TCC objection function. An ideal MSA solution for the proposed model can be obtained using this selection procedure in conjunction with the suggested crossover and mutation operations.
In the suggested framework, alignments are depicted as a matrix where two prerequisites are met: (i) chromosomes are coded according to their locations within the corresponding sequence, and (ii) gaps are coded according to the final chromosomes’ positions within the corresponding sequence, albeit with a negative value. Prior to being incorporated into this program, the input alignments are coded. To complete the optimization, coded alignments are used. Individuals are decoded and subsequently returned to the standard alignment representation once the optimization is complete.
In the following sub-section, we present the evolutionary method based on a genetic algorithm. Then, the individual representation of the individuals is presented, followed by a description of the procedure of the model for the MSA solution.

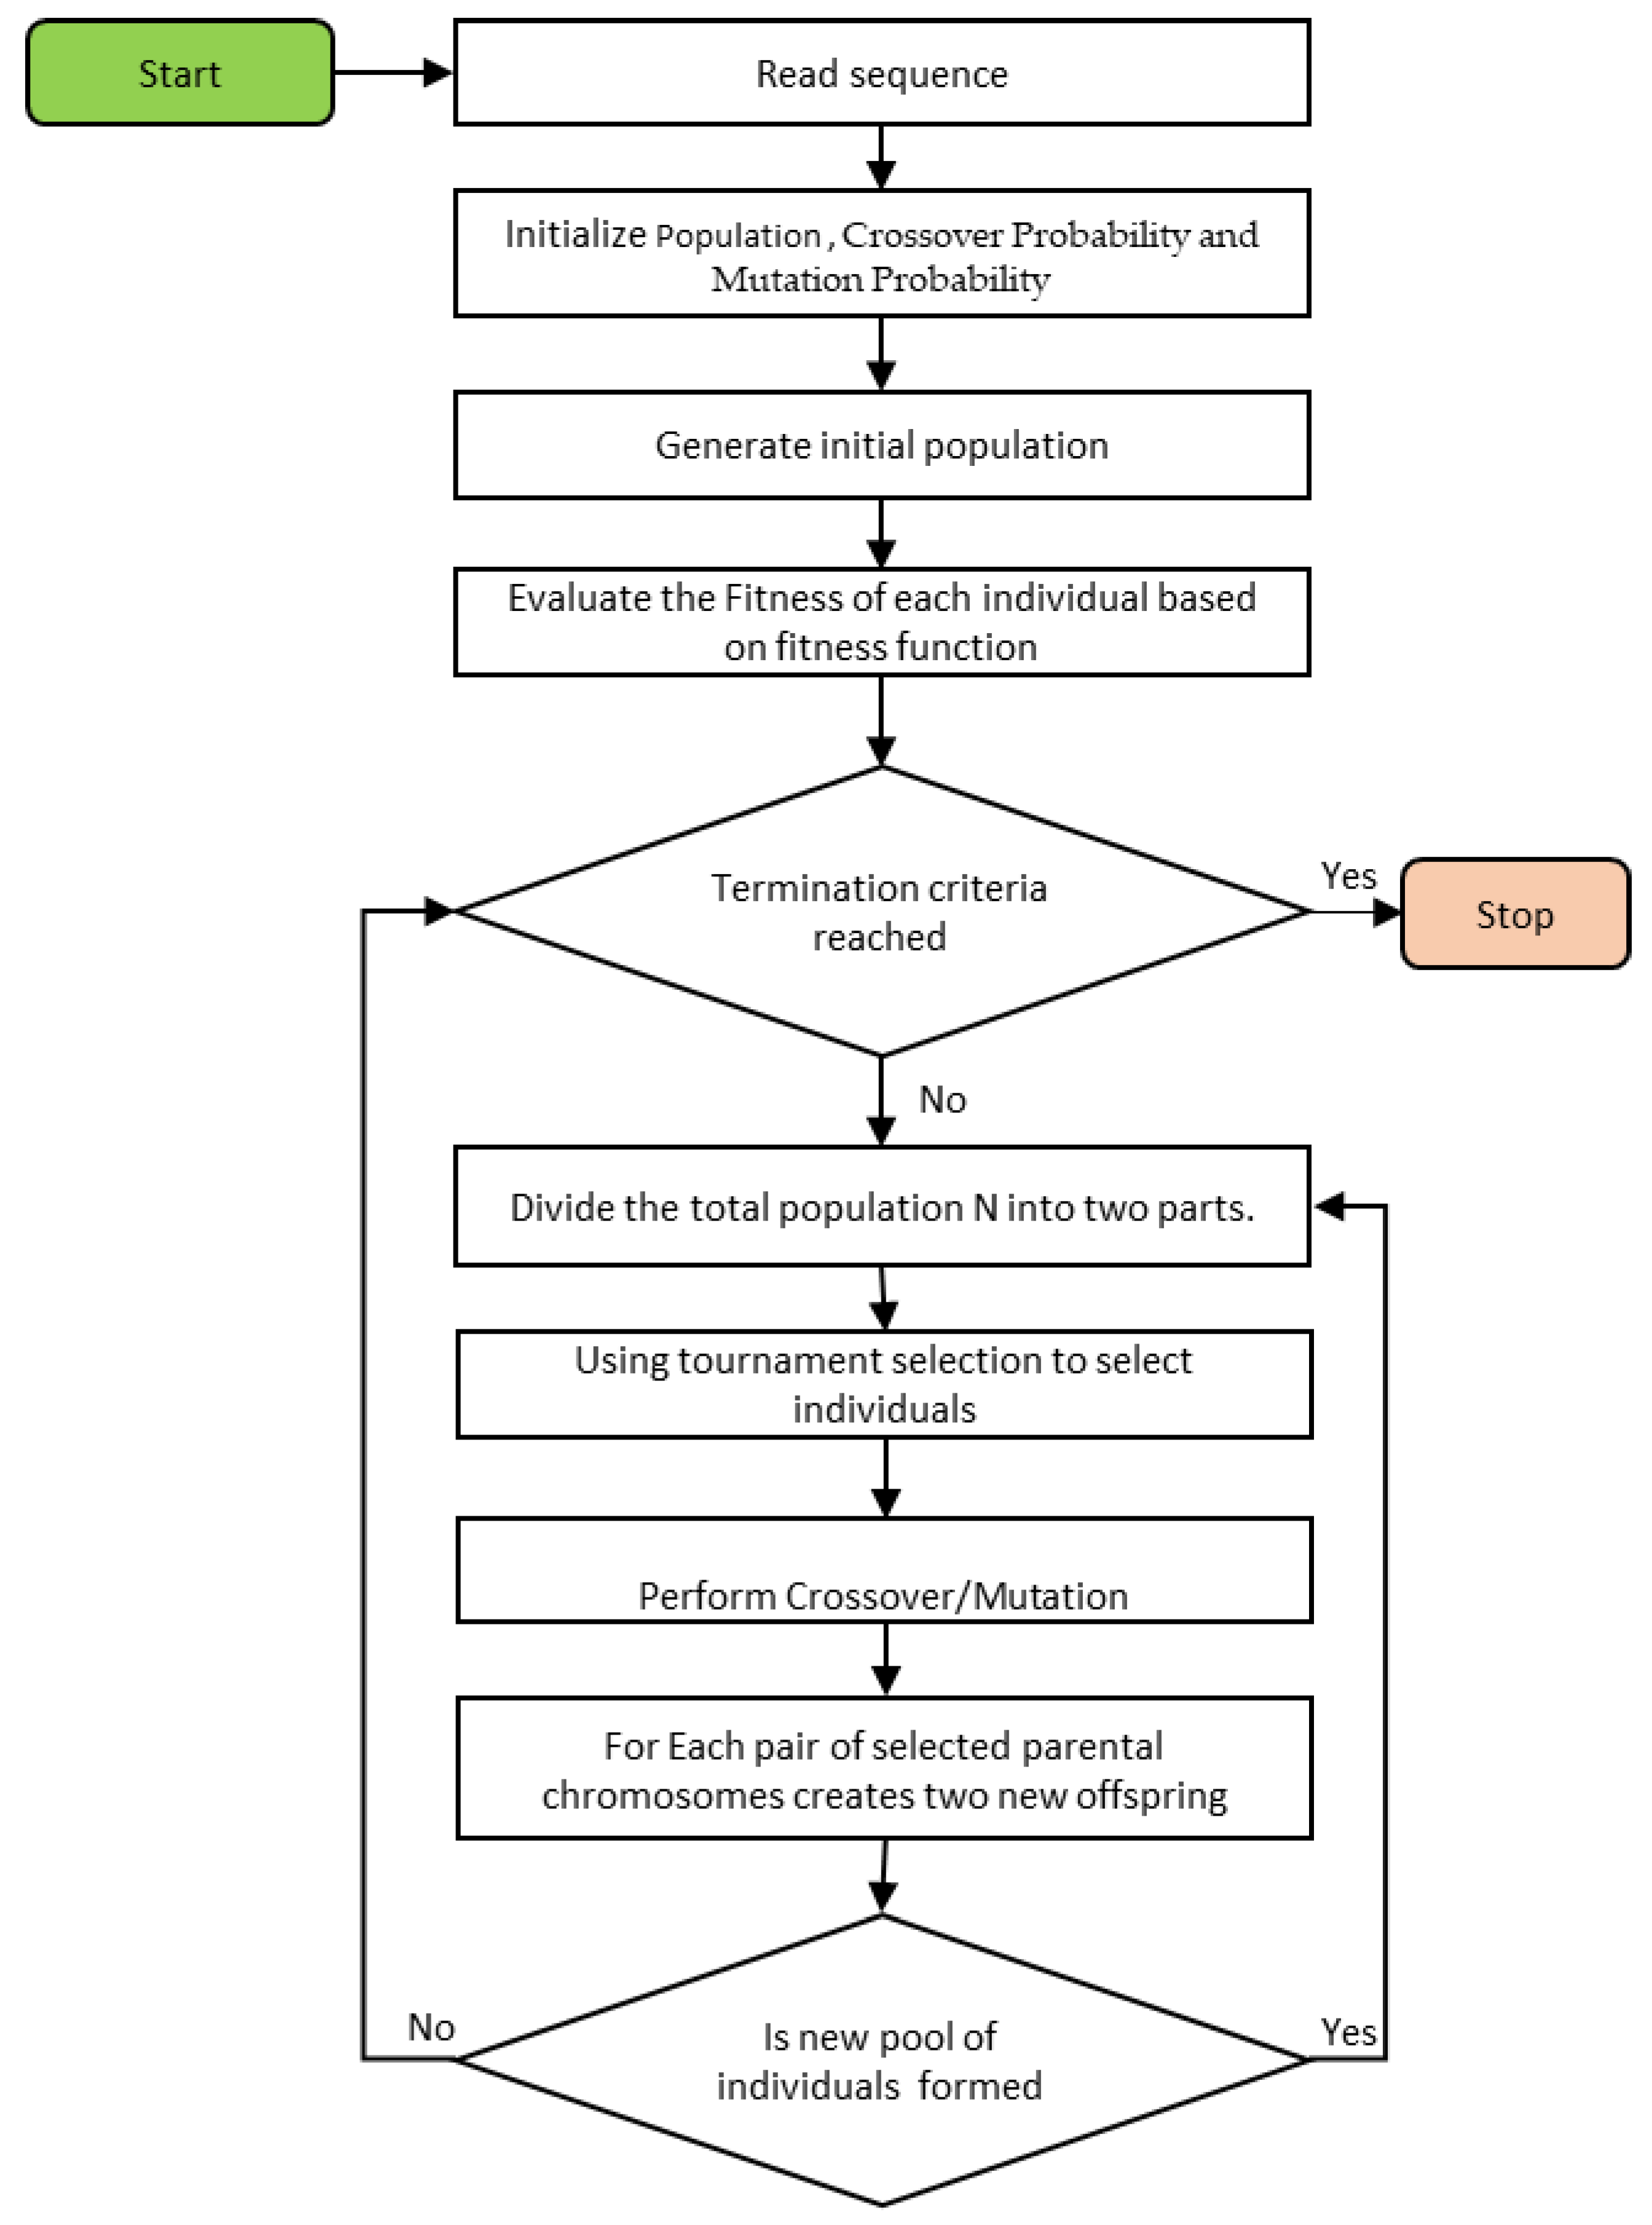
4.1. Genetic Algorithm (GA)

GA is an evolutionary method that imitates the “survival of the fittest” strategy. GA uses a stochastic process that considers a set of probable ways to solve a problem. In this case, each solution represents a chromosome, and the chromosome set is termed a population. To determine the quality of the solution, objective functions or fitness functions are associated with each chromosome. Based on the fitness function, the chromosomes that best fit the generation will be selected using the selection operation. After that, other genetic operations, such as mutation and crossover, are carried out on the mainly chosen chromosomes to change their fitness and produce a new generation. The operators, namely, the selection, crossover, and mutation processes, iteratively proceed until convergence to the best fitness value. All of these steps of the basic genetic algorithm can be found in reference [21]. The flowchart of the proposed GA-based model is illustrated in Figure 1.

4.2. Alignment Representations

The population representation process is essential when using a metaheuristic method to solve an MSA problem. The encoding process generally impacts the behaviors of algorithms, and it determines the operation strategies and their efficiency. In this study, a GA [
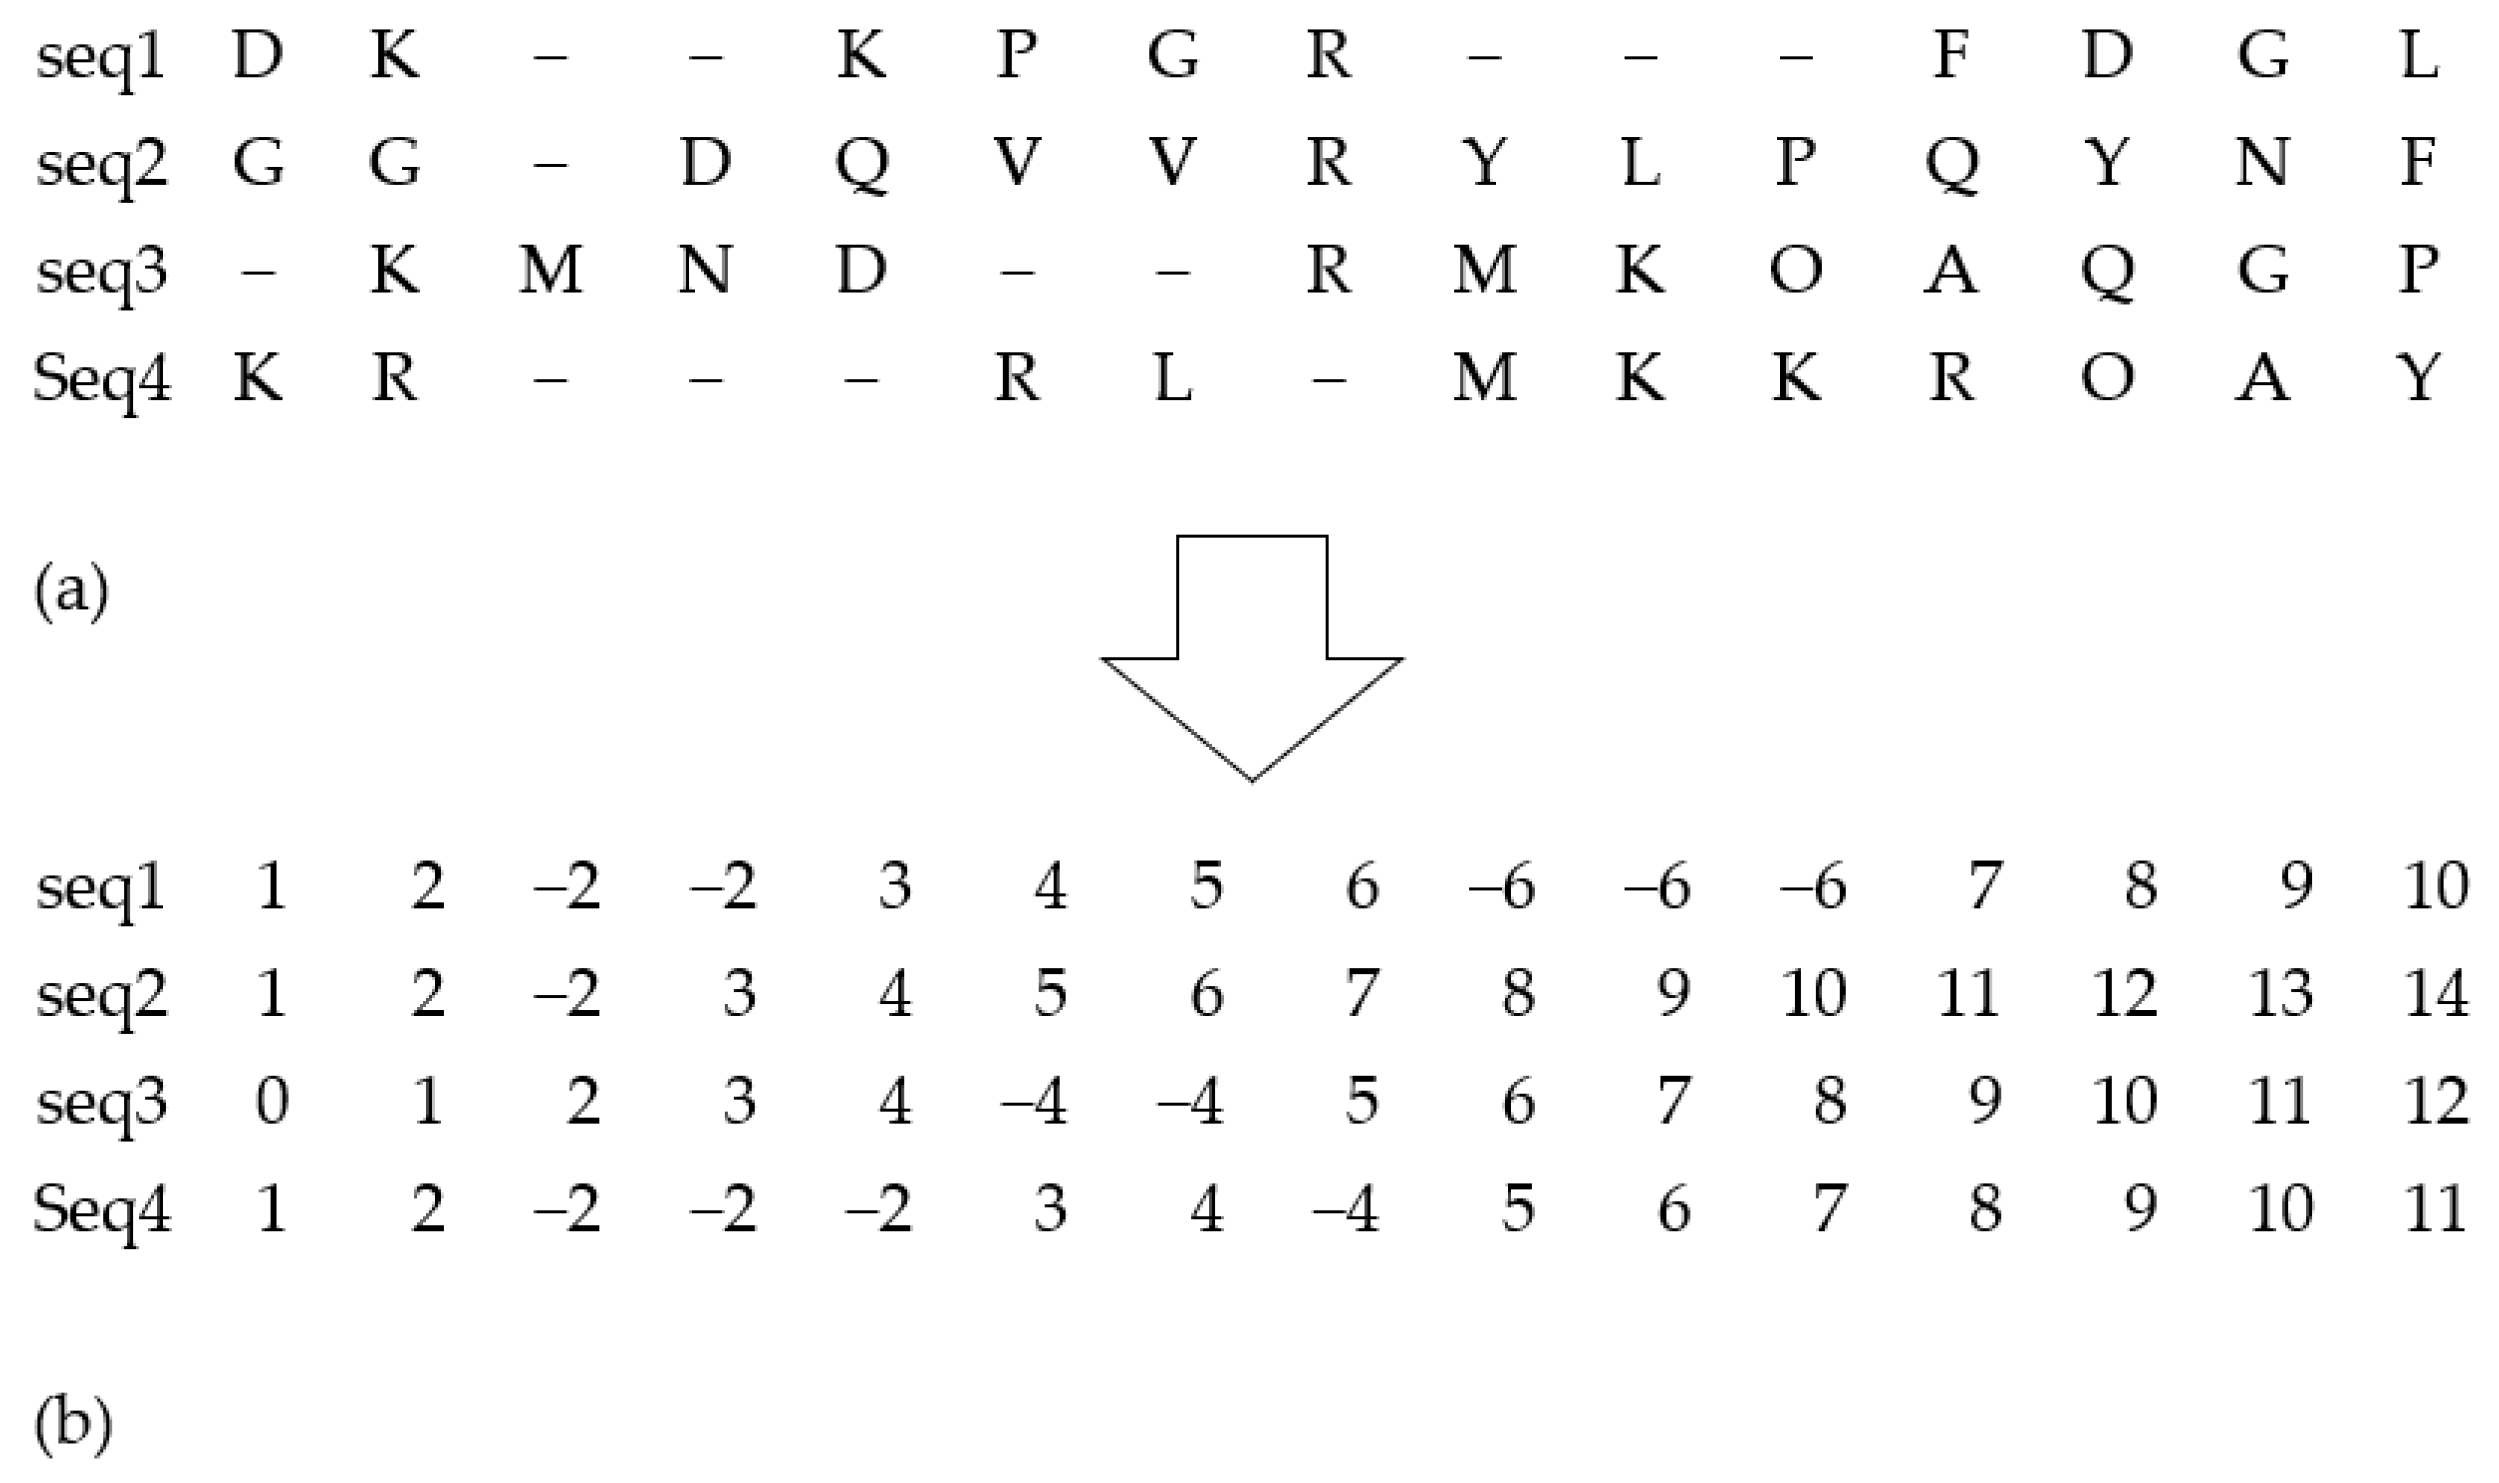
24] was used, which is one of the popular iterative techniques inspired by natural genetics. Most of the existing GA-based approaches for MSA generally focus on the binary string for the chromosomes’ (solution) representation, where the standard alphabet is used for amino acids and the “-” symbol is used for the gaps. However, the existing binary representation in MSA generally increases the length of the string, complexity, and space requirements. To overcome these drawbacks, in this study, an improved integer coding for the string representation is opted to be applied instead of the binary coding process.
In the proposed method, alignments are coded as a matrix, where residues or amino acids are coded according to their positions in their respective sequences. At the same time, the gaps are represented by the last residue positions of their respective sequences but with a negative value. Essentially, the input alignments are coded before their processing. The entire optimization process is conducted by applying coded alignments. After finalizing the optimization process, individuals are decoded and consequently revert to their standard representations. Figure 2 illustrates an example of the suggested representation process. The main benefit of this representation strategy is that it allows for the simple identification of positions for crossover operation. Moreover, it can help to avoid mistakes that are likely to occur in the subsequent crossover operations, thereby ensuring better improvements in alignment management.

4.3. Genetic Operators

The proposed model comprises three different GA operators, which include selection, crossover, and mutation. On the one hand, the selection operator is used to identify the best individuals from the population; conversely, the crossover and mutation operators act on the chosen individuals in the population based on the probabilities, P c and P m , accordingly.

4.3.1. Selection Operator

The selection operator is aimed at randomly identifying a pair of best chromosomes as parents ( P 1 and P 2 ) from the population generation of P i to take part in the crossover and mutation processes to generate offspring P 1 o and P 2 o for the new generation. The chromosomes with the best fitness scores are expected to be chosen for the next generation. In the suggested model, each chromosome is linked with two different functions, F 1 and F 2 , as shown in Equations (1) and (2). However, selecting one chromosome with the best fitness scores for all of the functions is rarely possible. Thus, in the proposed approach, the entire population size is divided into two portions. Essentially, F 1 is used to obtain one portion of the population, while the F 2 is used for the other portions. In this way, the selection operation proceeds along with mutation and crossover until the next generation P j is obtained. Several selection methods can be used [54,55] to select the best individuals. Mainly, in this work, the tournament selection approach with a tournament size of 2 is employed [54], which can consider the different selection pressures without any alterations. In this selection process, two randomly selected individuals compete in the tournament. The fittest among the two is chosen as a parent and takes part in the crossover operation.

4.3.2. Crossover Operator

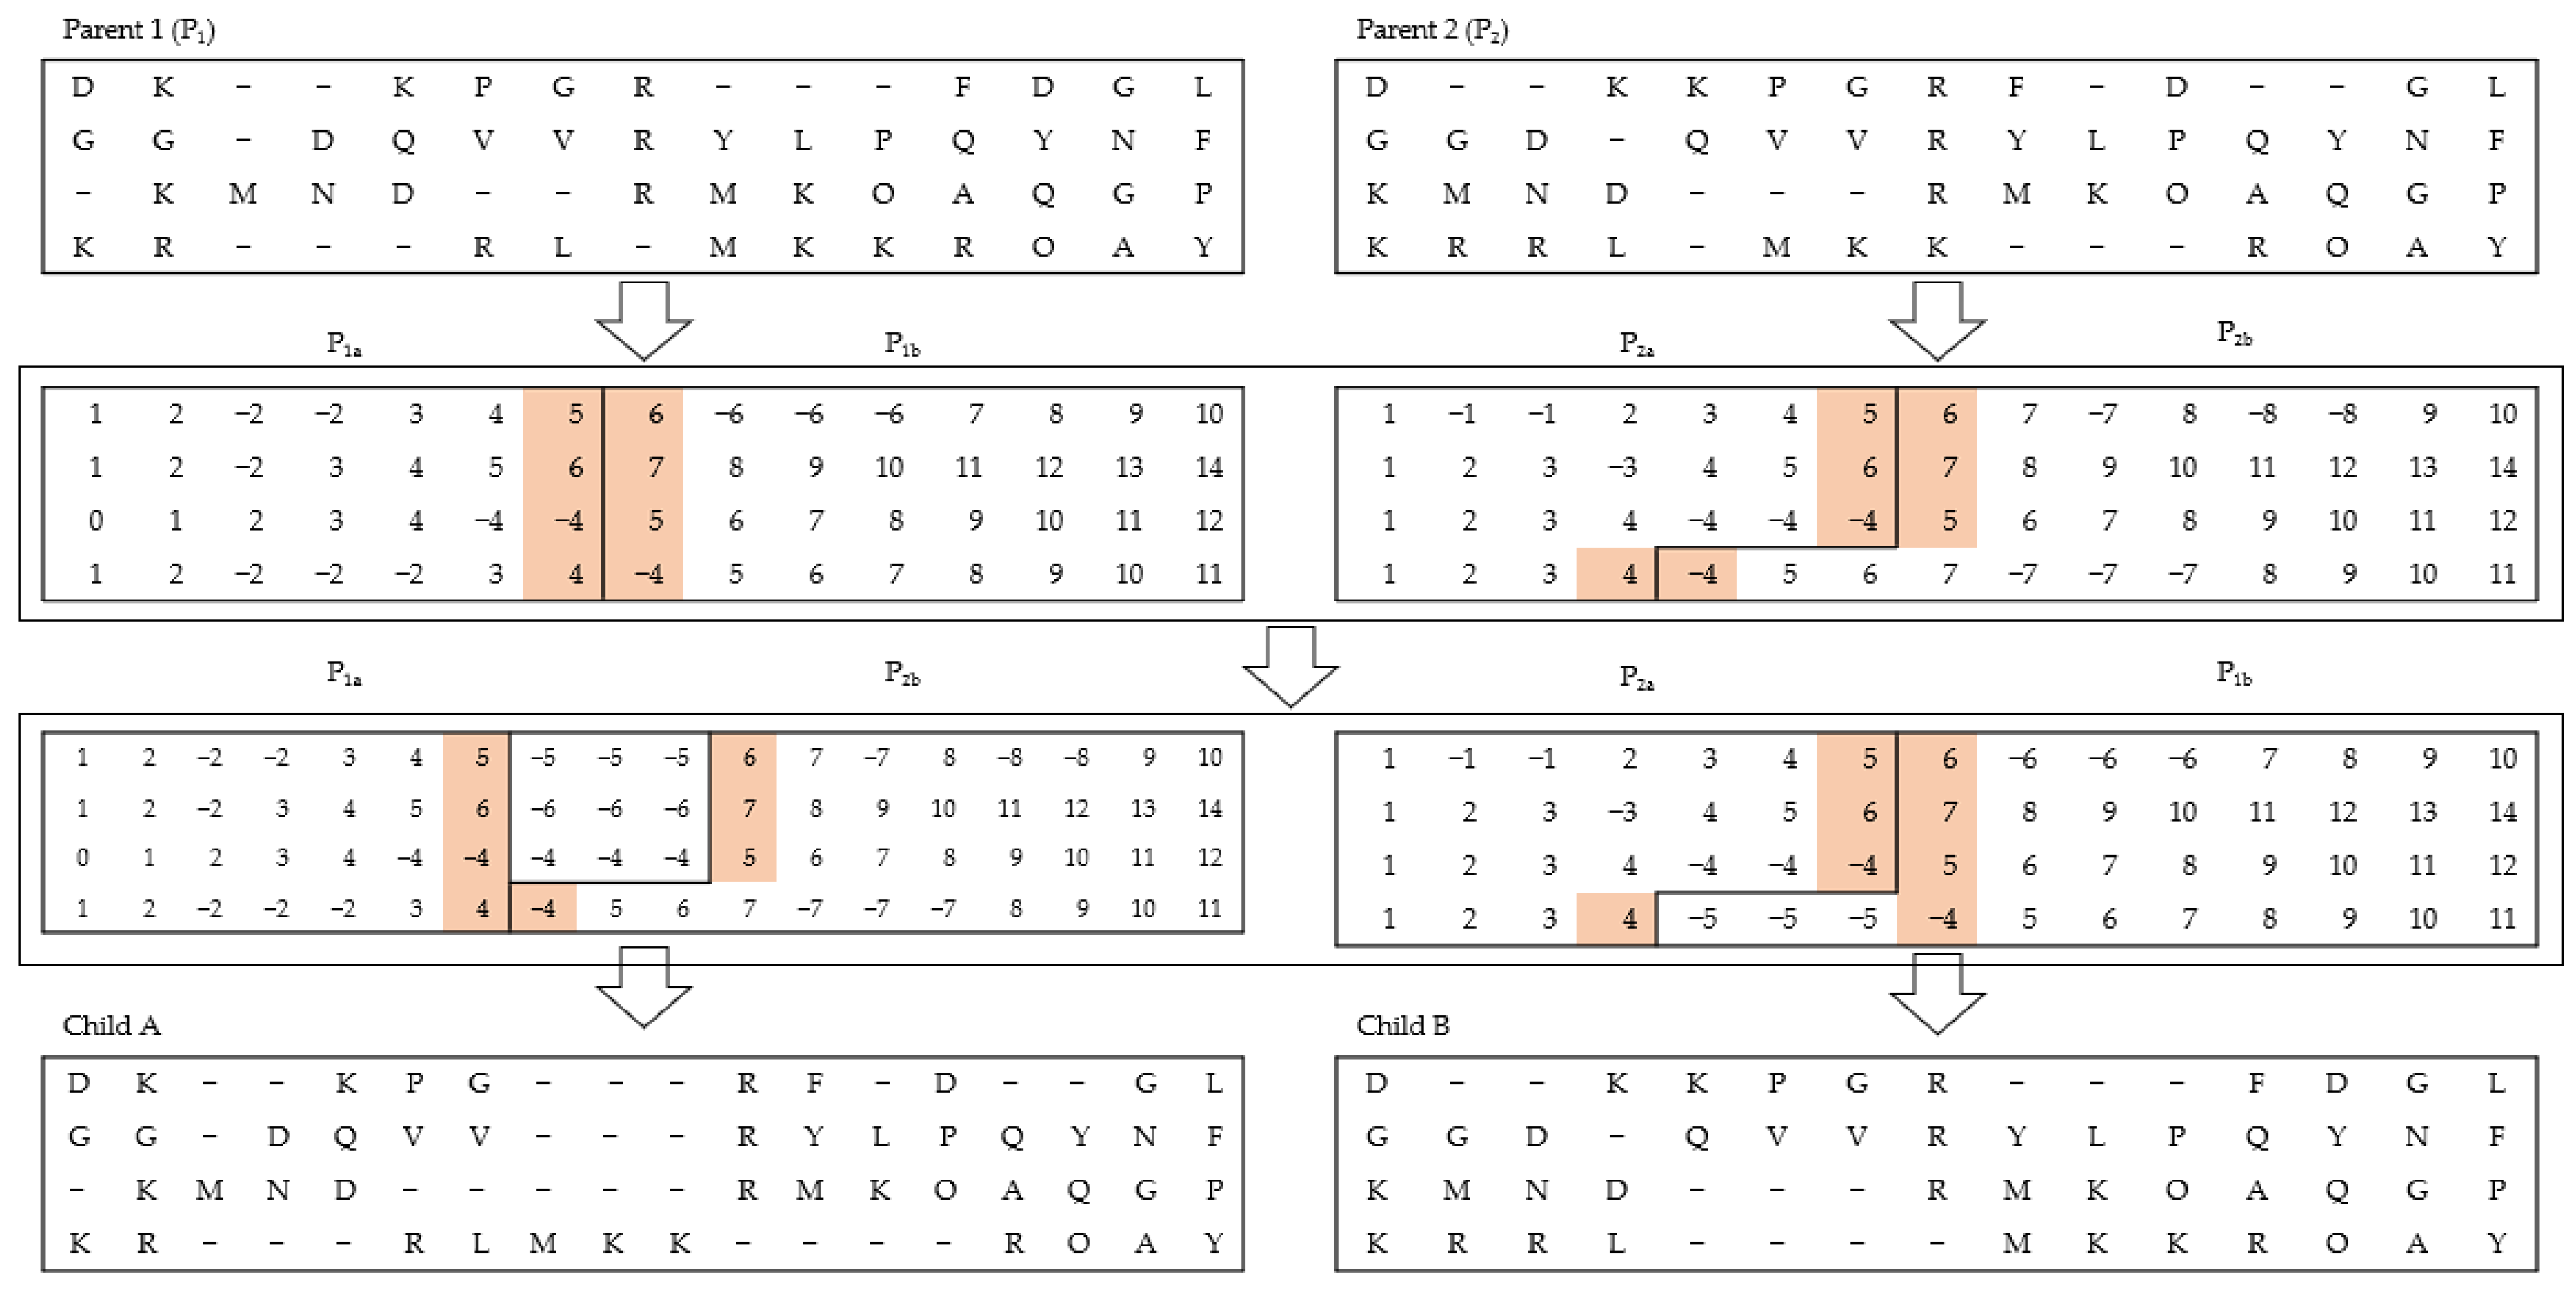
The primary purpose of the crossover strategy is to achieve an interactive exchange of information between a pair of different chromosomes [10] to generate a new one. During the crossover process, the two parents (say P 1 and P 2 ) that are randomly selected exchange their genetic information between themselves to form new populations ( P 1 o and P 2 o ) for the new generation. In the proposed work, an enhanced one-point crossover is introduced to consider each existing gap. In this approach, two-parent alignments are joined by using a single exchange procedure. More specifically, the first parent P 1 is divided at a randomly selected position. The second parent P 2 is processed so that the right part can be combined with the left part of the first parent and vice versa. Null signs are used to fill any vacant position at the junction point. An illustration of this process is shown in Figure 3. More specifically, this operator combines the classical properties of a local arrangement mutation and crossover. However, in each case, the occurrence of this operation is specifically guided based on the crossover probability P c .

4.3.3. Mutation Operator

The main aim of the mutation operation in the evolutionary process is to help maintain the diversity in the population. Mutation operators randomly transmit the evolutionary information among other individuals and help recover the missing genetic data. Mutation operation also helps in preventing algorithm trapping at a local minimum. In the suggested method, different types of mutation operations are used, which include gap merging, gap insertion, single gap, and block gap mutation. Following the completion of the crossover operation, an offspring continues with the mutation process accordingly. However, each of the operation processes is randomly guided by the mutation probability, P m . Each defined mutation operator is applied one at a time to see which one produces a higher score. The operator that yields the best results for that specific sequence is considered, while the others are rejected. Each defined mutation operator is chosen randomly to solve a specific set of problems with a specific probability. Here, in the suggested method, a different mutation operator from the stated set is chosen and applied to solve the provided problem if one of the randomly chosen mutation operators cannot provide an optimal outcome. The following describes every suggested mutation operator for the experimental analysis. A demonstrative example of the mutation procedure is presented in Figure 3.

Merging Mutation

This operation process merges multiple spaces of a sequence. This can be achieved by randomly selecting multiple consecutive gaps of a sequence, which may or may not be adjacent, and then merging these gaps. Consequently, the gaps are moved to a randomly selected position in the same sequence. An illustration of this mutation operation is depicted in Figure 4a.

Insertion Mutation

This variety of mutation operation is used to produce the mutation if the fitness of the mutated alignments is more than the fitness of the original ones. A random position in the alignment sequences (column and line indexes) is randomly selected to achieve this. Then, a chosen number of gaps are added to that position, and all of the other lines are filled with gaps until they all have the same size. Figure 4b depicts an illustration of the insertion mutation.

Block-Gap Mutation

In this operation, a random row is chosen among others, and a block of gap positions that contain continuous gap values is selected. Finally, the whole block of gap values is shifted to a particular random position. The chosen block of gaps must have multiple continuous gap positions. Figure 4c illustrates a typical example of this operation.

4.4. Termination Criteria

Termination criteria are essential for stopping the algorithm when it has achieved a satisfactory solution or when a further optimization is not yielding substantial improvements. We established a termination criterion to reach the optimal score of the leading or most outstanding chromosome. In our suggested approach, which involves considering multiple objective criteria during selection, we end up with two elite chromosomes, each excelling in one of the two objective functions. Suppose the fitness scores of these top-performing solutions persist without change for 100 consecutive generations. In that case, we permit the process to conclude to save computational time and reduce memory usage.

5. Experimental Study

This section presents the experimental study of the proposed EGMSA. The evaluation datasets, BAlisBASE and SABmark, are presented first. The evaluation measures used to assess the performance of the suggested model are then explained. The existing MSA approaches used to compare the accuracy of the proposed model are also explained. The parameter analysis of the proposed approach is presented. Finally, a significance test using the non-parametric Wilcoxon test [56] is conducted to confirm the improvement of the suggested model.

5.1. Evaluation Datasets

Two different datasets are employed to investigate the efficacy of the suggested model, including BAliBASE [18] and SABmark [57]. The datasets are explained below.

5.1.1. BAliBASE

This is one of the most commonly applied benchmark datasets for sequence alignment, which comprises an application known as BAliscore, measuring the sum of pairs and the Totally Conserved Columns scores of sequence alignments. The datasets have two different versions: BAliBASE 2.0 and BAliBASE 3.0. (a) The BAliBASE 2.0 comprises 141 subsets of multiple protein alignments, categorized into five different subsets, named references (ref.). Each of these corresponds to a distinct class of problems. In this study, subsets were randomly taken from refs. [1,2,3]. (b) BAliBASE3.0 comprises six sets of multiple protein alignments with various features. These data define a comprehensive set of 218 sequences obtained from the protein databank. In this dataset, the sets of sequences can be organized into six categories according to their families and similarities; this includes RV11, RV12, RV20, RV30, RV40, and RV50 [18]:
(a)
RV11: This group comprises 38 sets of sequences and equidistant sequences with fewer than 20 percent identities and fewer than 35 inserts.
(b)
RV12: Consisting of 44 sequence sets, this group encompasses families that are not part of the preceding group, with identity percentages ranging from 20 to 40 percent. At least four of these sequences are equidistant.
(c)
RV20: This group includes 41 sequence sets and considers families with more than 40% of their identities shared by a wildly divergent sequence.
(d)
RV30: This set of 30 sets of sequences from various subfamilies shares less than 25% of identity amongst individual subfamilies but shares more than 40% of identity across all of their sequences.
(e)
RV40: It comprises 49 sets of sequences with significant terminal insertions that share more than 20% of their identity and make up this group.
(f)
RV50: This group comprises sixteen sequence sets with a high percentage of internal insertions but more than 20% of shared identity.

5.1.2. SABmark

In addition to BALiBASE, the SABmark dataset was used. Specifically, version 1.65 reference alignments were used, which comprise 423 sets of sequences. The dataset comprises different sets of sequence alignment obtained from the protein structural analysis. The dataset is categorized into two parts: (a) twilight, which comprises 108 sets with 0–25% identity, and (b) superfamily, which comprises 315 sets and shares about 50% of identity.

5.2. Evaluation Measures

To assess the accuracy of the suggested EGMSA model, two different evaluation measures were employed, namely, the total column score (TC) and Q (quality) scores [21]. These metrics are commonly used in related works [32,46]. On the one hand, Q, the same as the sum-of-pairs scores, specifies the amount of appropriately aligned residue pairs divided by the number of residues in the reference alignments. On the other hand, TC, which is also known as the column score, is the number of truly aligned columns divided by the number of columns in the reference alignment. BAliscore is also considered to evaluate the model. Baliscore is a solution used for MSA problems. It is between 0.0 and 1.0. If the solution is identical to the corresponding manually generated reference alignments, the score is exactly 1.0. If nothing resembles the reference alignment, the score is exactly 0.0. However, if some parts match the reference alignment, the score is less than 1.0 but greater than 0.0.

5.3. Parameters Setting

To ensure the best scores for the proposed model, the suggested method was configured by exploring several parameters, which include the number of generations, population size, probabilities of crossover and mutation, and repetitions per problem. These parameters were chosen while considering the standard values used in genetic algorithms [58]. The initial population was generated randomly for the proposed model. To produce a population of solutions based on the two objective functions, as discussed earlier, various combinations of the selections were examined based on the two objective functions, F1 and F2. Finally, they used a 60–40% combination. Specifically, the population size (N) was set to 100 individuals and 200 for the iteration values. These values are a standard setting for GA-based methods [58]. A subset of the BAliBASE datasets validated this parameter setup (see Section 6.2). Once the parameter values were determined, we let our suggested model run 10 times on each dataset. The best run out of the ten runs was chosen as the final score. Table 3 summarizes the parameter setting used for the proposed model.

5.4. Comparison Approaches

To evaluate the quality solution for the proposed method, different existing alignment methods were used. To this end, different comparisons were made with various MSA techniques published in the literature. First, the suggested model was compared with existing evolutionary alignment techniques using BALiBASE 2.0 datasets. These included GAPAM [27], MO-SAStrE [32], MSA-GA [28], RBT-GA [49], SAGA [25], VDGA [26], IMSA [59], HMOABC [46], and BSAGA [23]. In the second and third comparisons, alignment models were used, which used the BALiBASE 3.0 and SABmark datasets with the results obtained in [46]. These included Clustal X [17], DIALIGN-TX [60], FSA and FSA-maxsn [61], MAFFT [62] (ENS-i, LNS-i, and GNS-i), MSAProbs [63], MUMMALS [64], MUSCLE [21], ProbCons [5], PRANK [65], HMOABC [46], ProbAlign [66], and T-Coffee [67].

6. Results and Discussion

This section presents a comparison of the results of the proposed EGMSA model against the existing approaches. In the first place, the comparison results of our model based on BALiBASE 2.0 and BALiBASE 3.0 are reported. Then, later, the results obtained based on the SABmark datasets are presented.
To evaluate our model with the BAlibase 2.0 datasets, only the results for the sum-of-pairs (SOP) score are reported, as all of the compared approaches considered only the SOP scores of the datasets. The bolded values indicate the highest scores in each instance. A blank entry signifies the absence of scores. Table 4 displays the results of the sequence alignments obtained using our proposed method and the compared evolutionary-based approaches published in the literature, which include GAPAM, MSA-GA [19], MO-SAStrE, VDGA, RBT-GA, SAGA, and HMOABC [46]. These approaches were evaluated by using a subset of the BALiBASE2.0 datasets. Essentially, for the VDGA method, there are three various settings of the model, which include VDGA D-2, VDGA D-3, and VDGA D-4; additionally, the MSA-GA variant with a pre-aligned strategy (MSA-GA w/p) is also used in the comparison.
The results show that all of the methods that used multi-objective approaches, namely, MO-SAStr, HMOABC, and BSAGA, recorded the best accuracies compared to the other approaches. However, from the results, it can be seen that our suggested approach outperformed all of the compared methods, including the MO-SAStrE, HMOABC, and BSAGA models.
To further confirm the efficacy of the suggested solution, the suggested model was also compared with popular methods that applied the BALiBASE 3.0 datasets. To this end, the results presented in [46] were used for the comparison. The approaches used for the comparison based on the BALiBASE datasets included Clustal X [17], DIALIGN-TX [60], FSA and FSA-max, MAFFT [62] (LINS-i, EINS-i, and GINS-i), MSAProbs [63], MUMMALS [64], MUSCLE [21], ProbCons [5], PRANK [65], HMOABC [46], ProbAlign [66], and T-Coffee [67]. Furthermore, the latest versions of the T-Coffee and BSAGA [68] models were also included in our comparative study. Table 5 shows the scores of the compared methods and the suggested model on the BALiBASE datasets. Each case’s highest scores are bolded in both the Q and TC metrics. As can be seen, the proposed model obtained the highest results in most subsets in terms of the Q and TC measures. However, for RV11, which has the lowest identity virtually within the range between 0 and 20%, the proposed model performed much better than the prominent methods, namely, the BSAGA and HMOABC approaches. Essentially, the HMOABC methods used multi-objective methods and generated a particularly complex set of non-dominated solutions. Additionally, this method is based on Kalign, which is a deterministic heuristic method. On the other hand, the suggested approach particularly used the evolutionary method for the optimization, and it produced the two best solutions based on the two different objective functions, instead of generating a non-dominated set of solutions. Overall, from the results, it can be observed that our proposed model shows consistently good results for the other sub-datasets in all cases.
Finally, the suggested EGMSA model results were also compared with the existing approaches that used the SABmark v1.65 datasets. The compared methods and their respective results are taken as presented in [46]. Table 6 shows the comparison results of the proposed mode model on the SABmark v1.65 datasets. From the results, one can see that the results of our proposed model outperformed all of the existing approaches, including the H4MSA [46] and BSAGA methods. Essentially, for both of the sub-datasets (superfamily and twilight), the proposed model performed better regarding both the TC and Q measures. Particularly, the second sub-dataset, “twilight”, signifies the worst-case alignment situation as the sequences share below 25% of identity [57]. In all of the cases, our proposed model outperformed the compared approaches regarding both Q and TC.

6.1. Statistical Test

A significance test was carried out to investigate whether the improvement of our proposed approach was statistically significant. To this end, a pairwise comparison was conducted in which the proposed model was compared with each baseline method from the comparative results, as shown in Table 7. To this end, a non-parametric test was used, considering that the data are abnormally distributed. More specifically, a Wilcoxon signed-rank test was used, which is a non-parametric test that is similar to the t-test used for the significance study. In the Wilcoxon test, the null hypothesis is used with the assumption that there is no significant difference in two different outcomes for different sources. Thus, the alternative hypothesis is that there is a significant difference between the two outcomes. Hence, the null hypothesis would be rejected to indicate the significant difference between the two examples. In this case, the 5% significance level was used for the statistical test.
As shown in Table 3, yes and no are assigned (“yes” for p ≤ 0.05 and “no” for p > 0.05) for the comparison of any two approaches (as indicated in the sixth column), where “yes” means that our proposed model improvement over the compared one is significant, and “no” means that there is no significant improvement.

6.2. Parameters Sensitivity Analysis

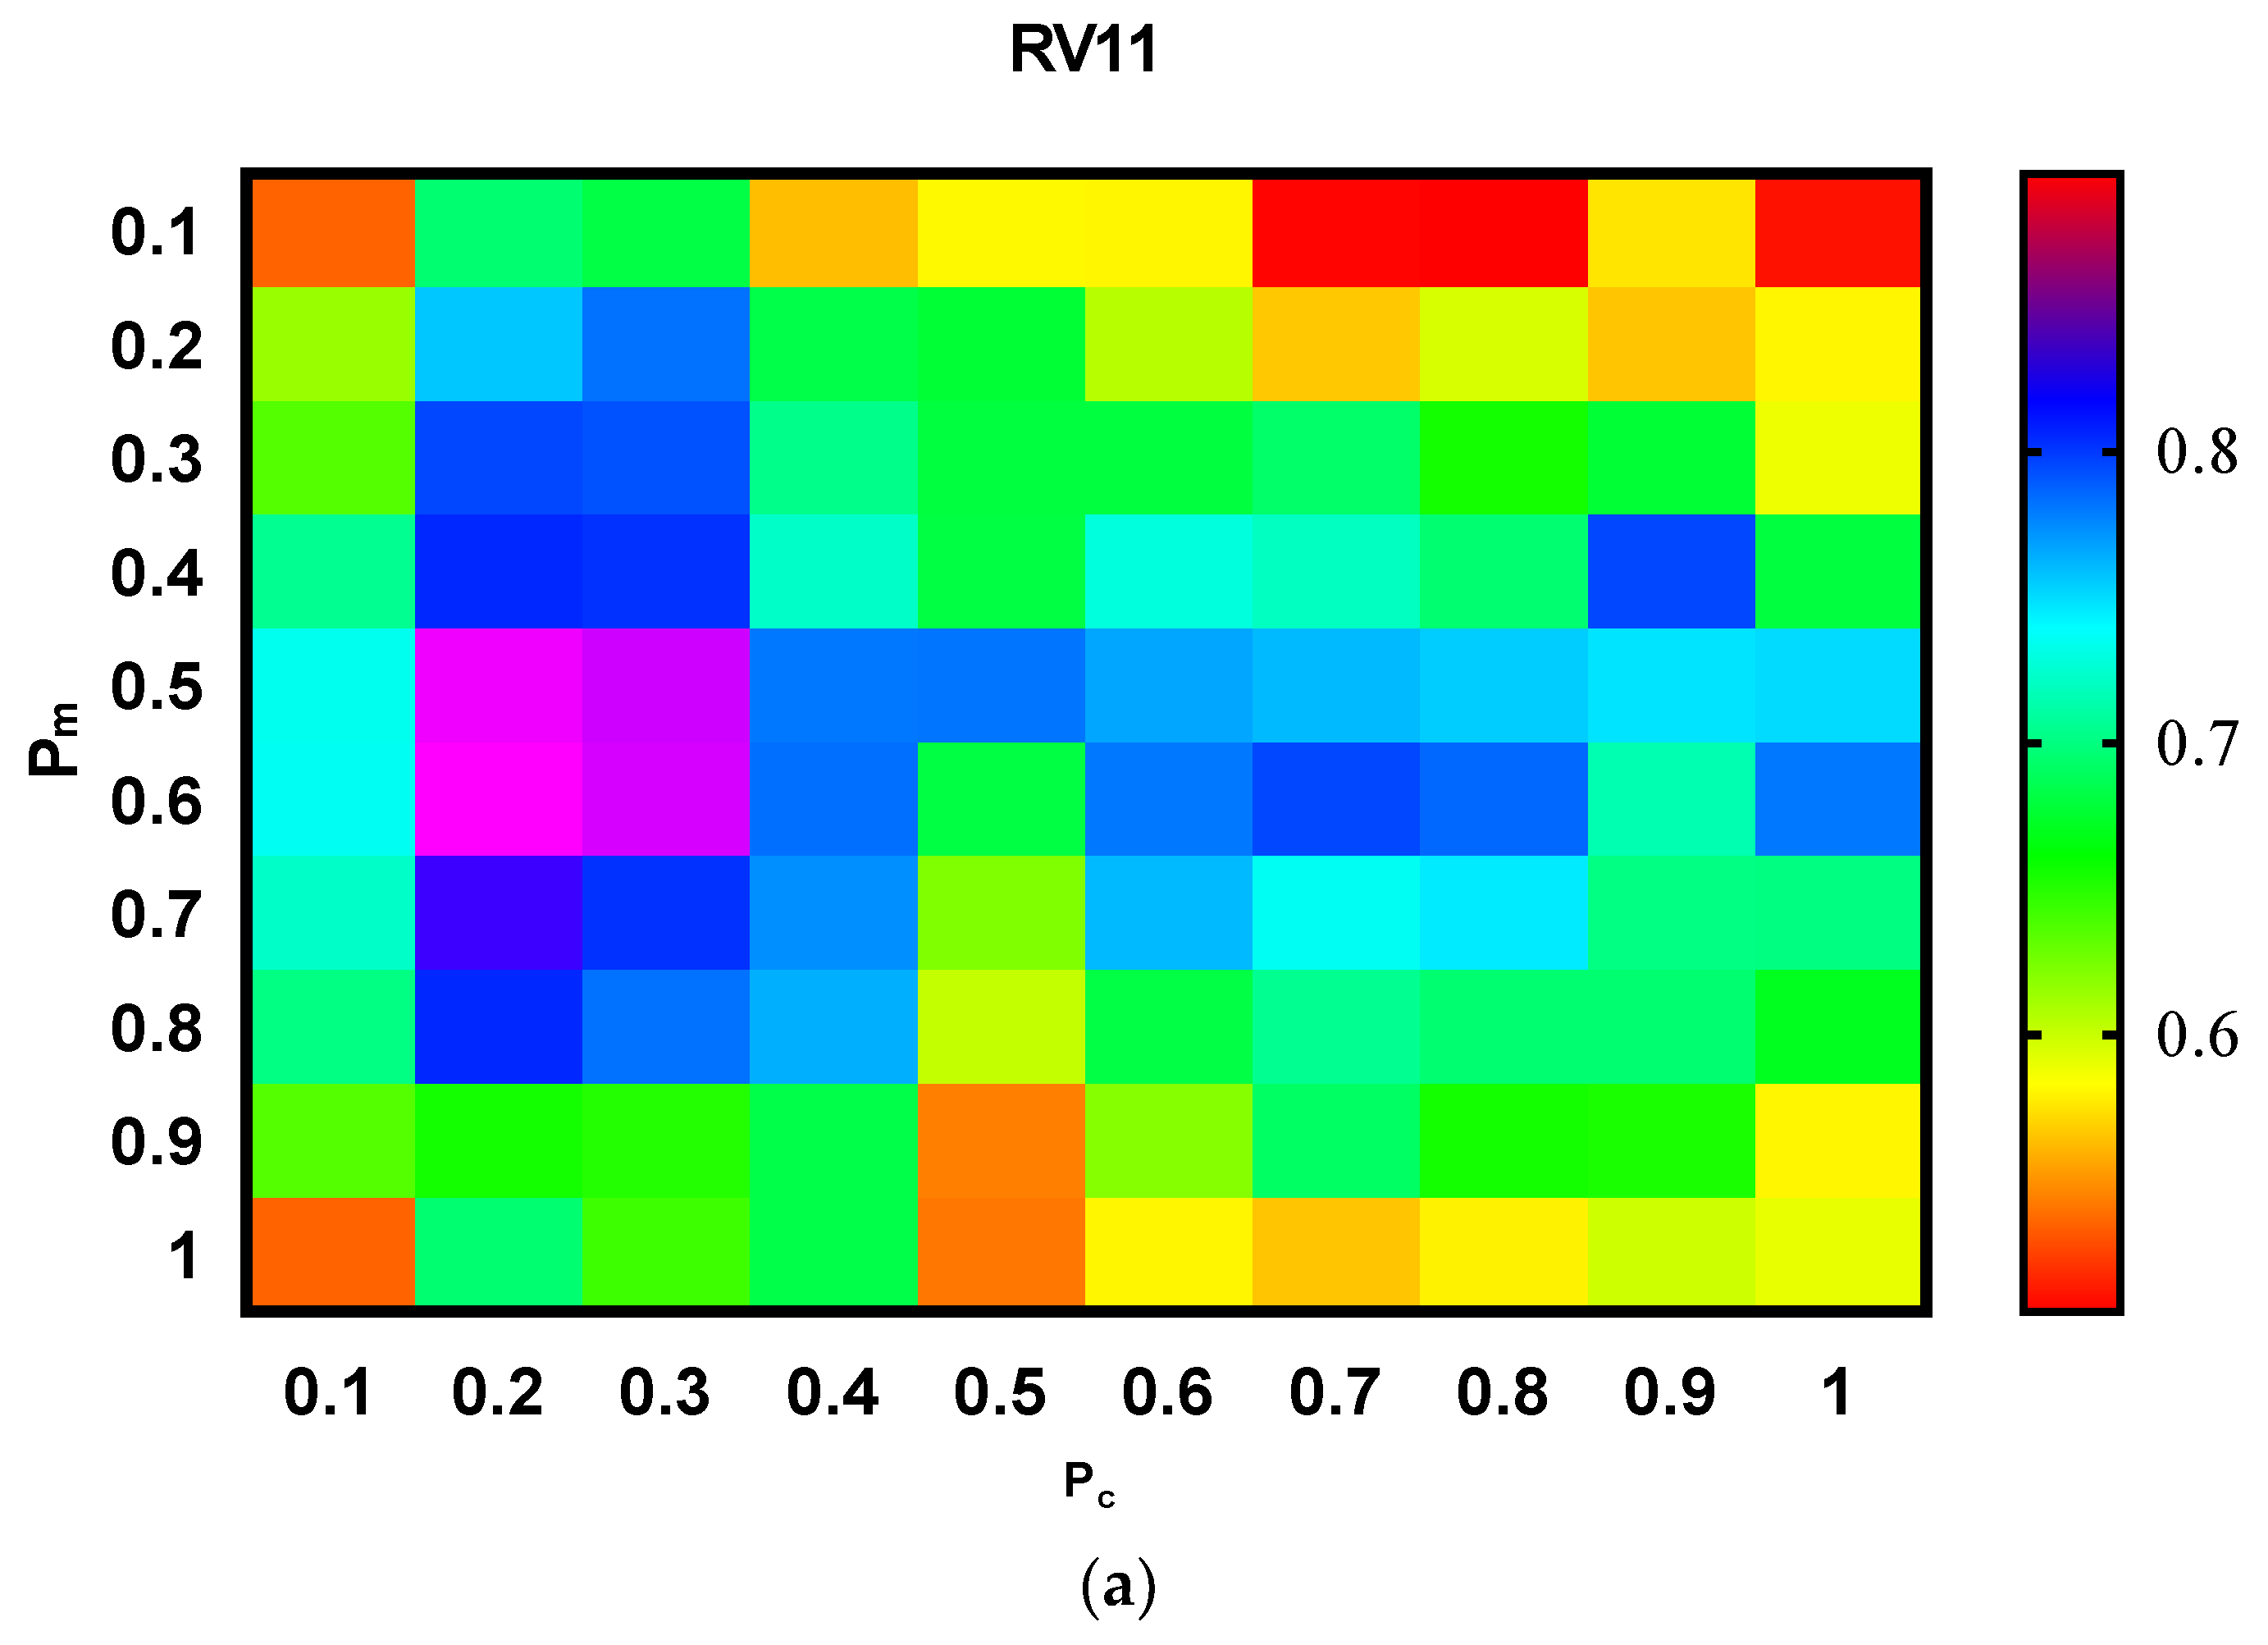
A parameter analysis was also conducted to investigate the influence of the different parameters on the model performances. Thus, an investigation was conducted to measure the impact of the crossover P c and mutation probabilities P m , the impact of the population size (N), and the different iteration values.

6.2.1. Impacts of P c and P m

P c and P m are two important parameters that largely influence the accuracy of the quality solution of GA-based techniques. Thus, in this subsection, an investigation was conducted to measure the impacts of P c and P m on the model accuracy to enable us to select the best combination of parameters. Figure 5 displays the performance of the proposed approach for different values and a combination of P c and P m respectively. Specifically, adjusted values were used [0.1, 0.2, 0.3, 0.4, 0.5, 0.6, 0.7, 0.8, 0.9, 1] for both P c and P m . From the results, it can be seen that although the P c value is not very significant, the proposed model records a stable performance for the value in the range of [0.2–0.5] for both P c and P m . Thus, to obtain a better setting for the best quality solution of the proposed model, the proposed method selected the range of [0.2–0.5] for both parameters.

6.2.2. Impact of N

To investigate the impact of the population size N , different values of the N parameter were experimented with, which include [50, 100, 150, 200, and 250] with already chosen ( P c and P m ) crossover and mutation probability values. From the results in 
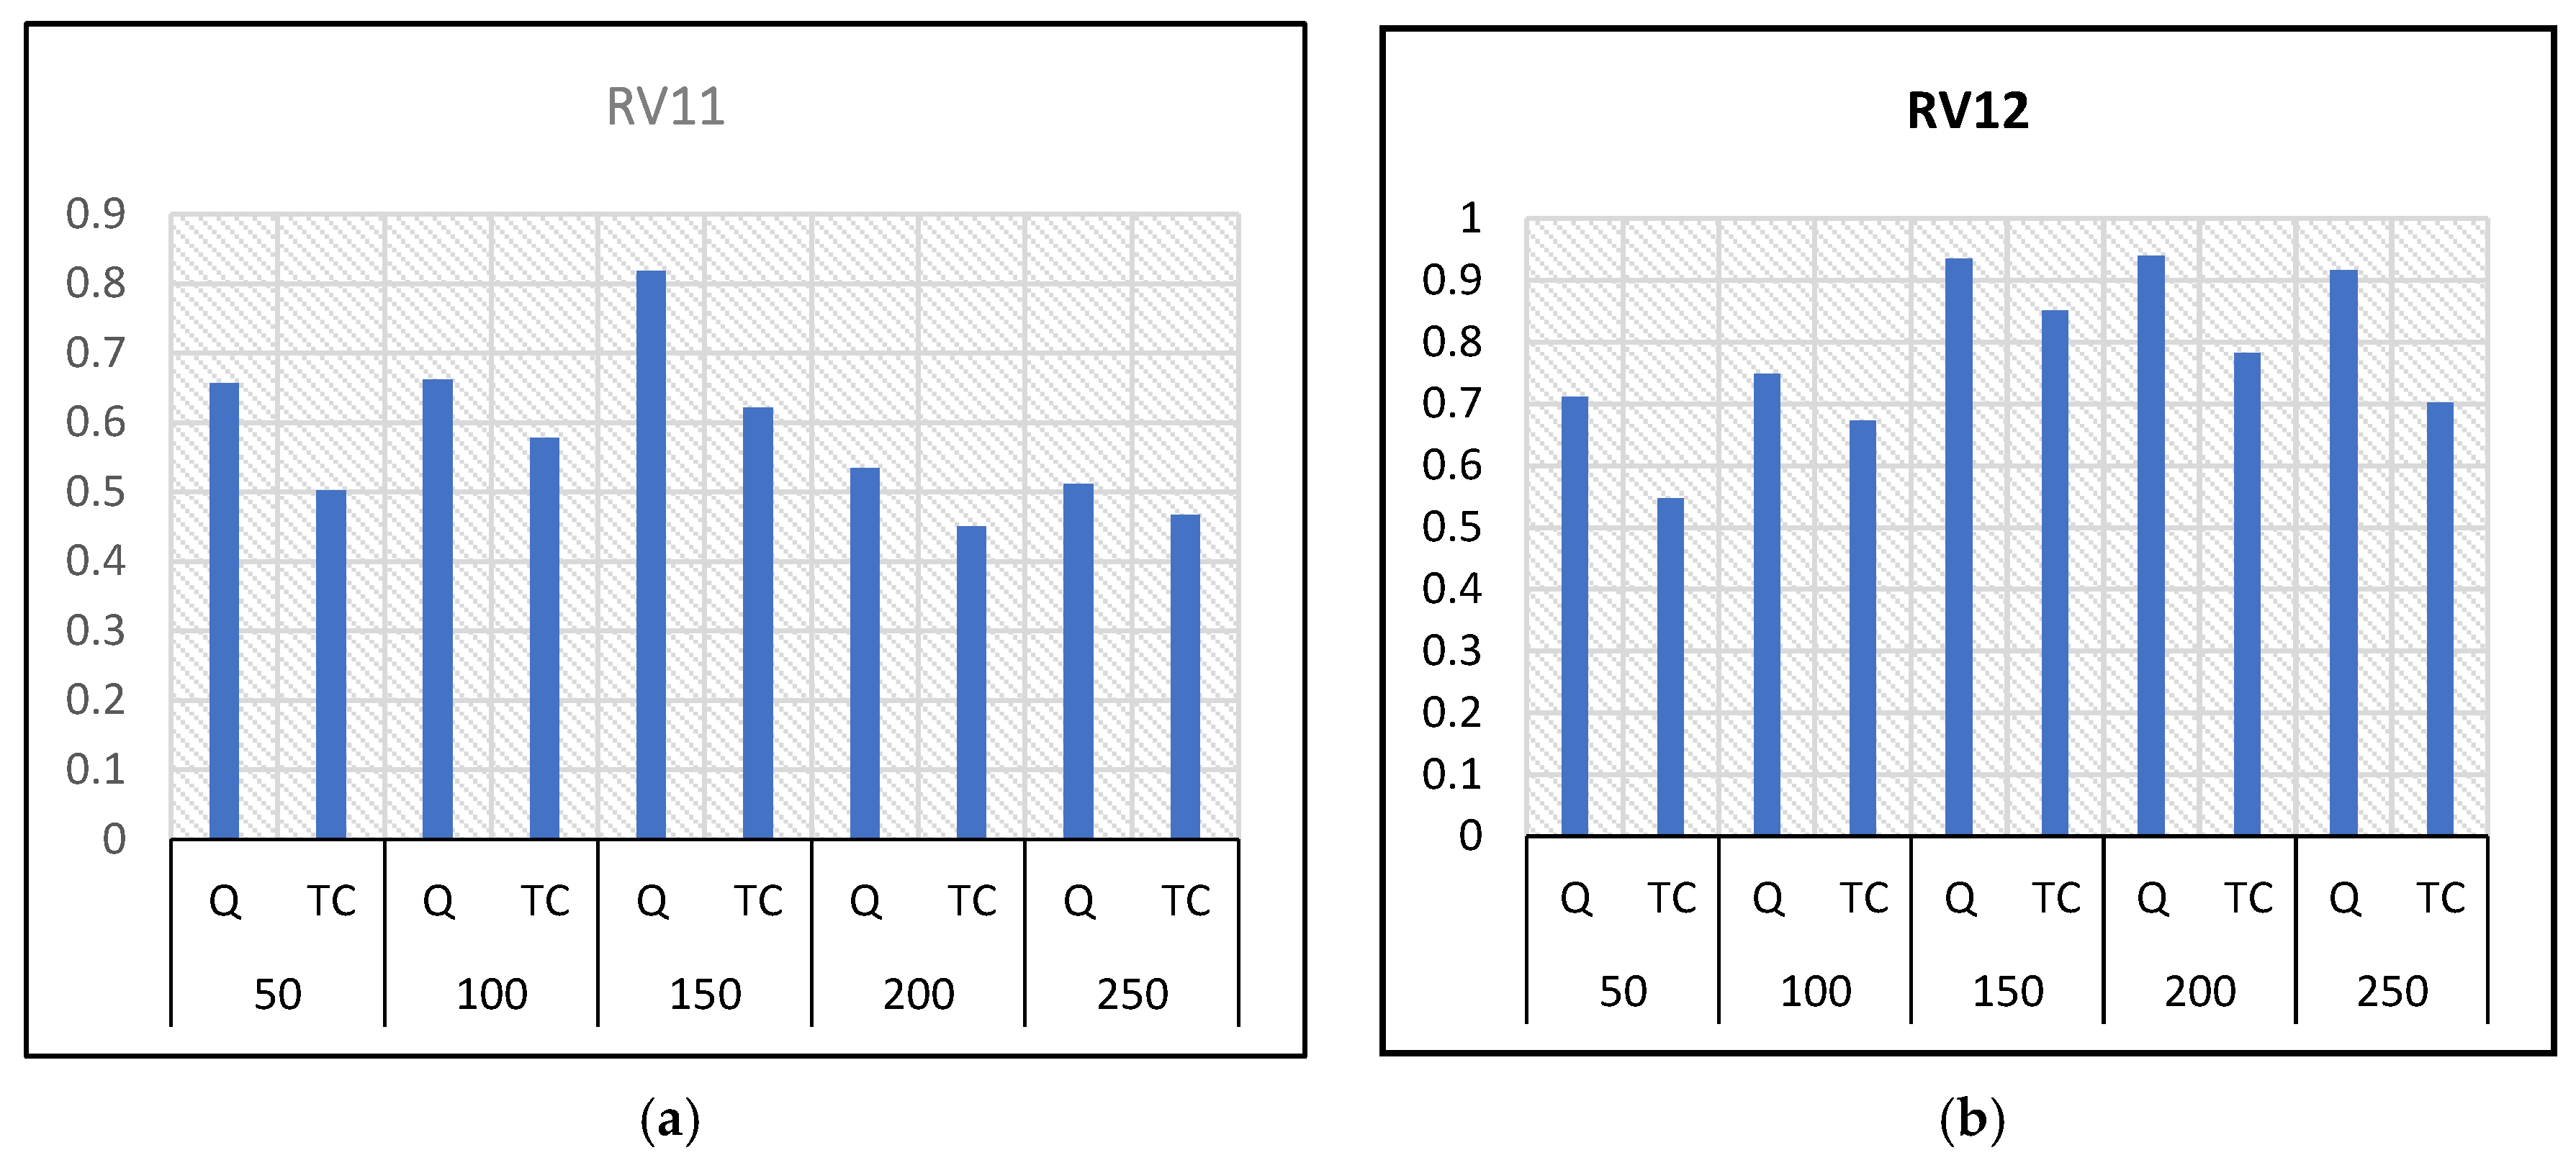
Figure 6a–f, it can be seen that all other values used in the setting do not show a significant improvement between 100 and 150. This means that the model started to improve when the N values reached a value of 150 in most cases. However, increasing the value of N could increase the complexity of the training, including the computation time. The ideal value of the population size for the model configuration was selected as 150.

6.2.3. Iteration

Different values of successive iteration numbers were used in the experiments to determine the termination criteria of the proposed model after convergence [50, 100, 150, and 200]. The different scores obtained are shown in Figure 7a–f. From the results in the figures, one can see that the accuracy improved more between 100 and 150 in most of the cases. However, most cases’ model improvements are almost similar for 100 and 150. Thus, 100 was chosen as the ideal value for setting up the proposed model to minimize the computational complexity.

6.2.4. Time Complexity

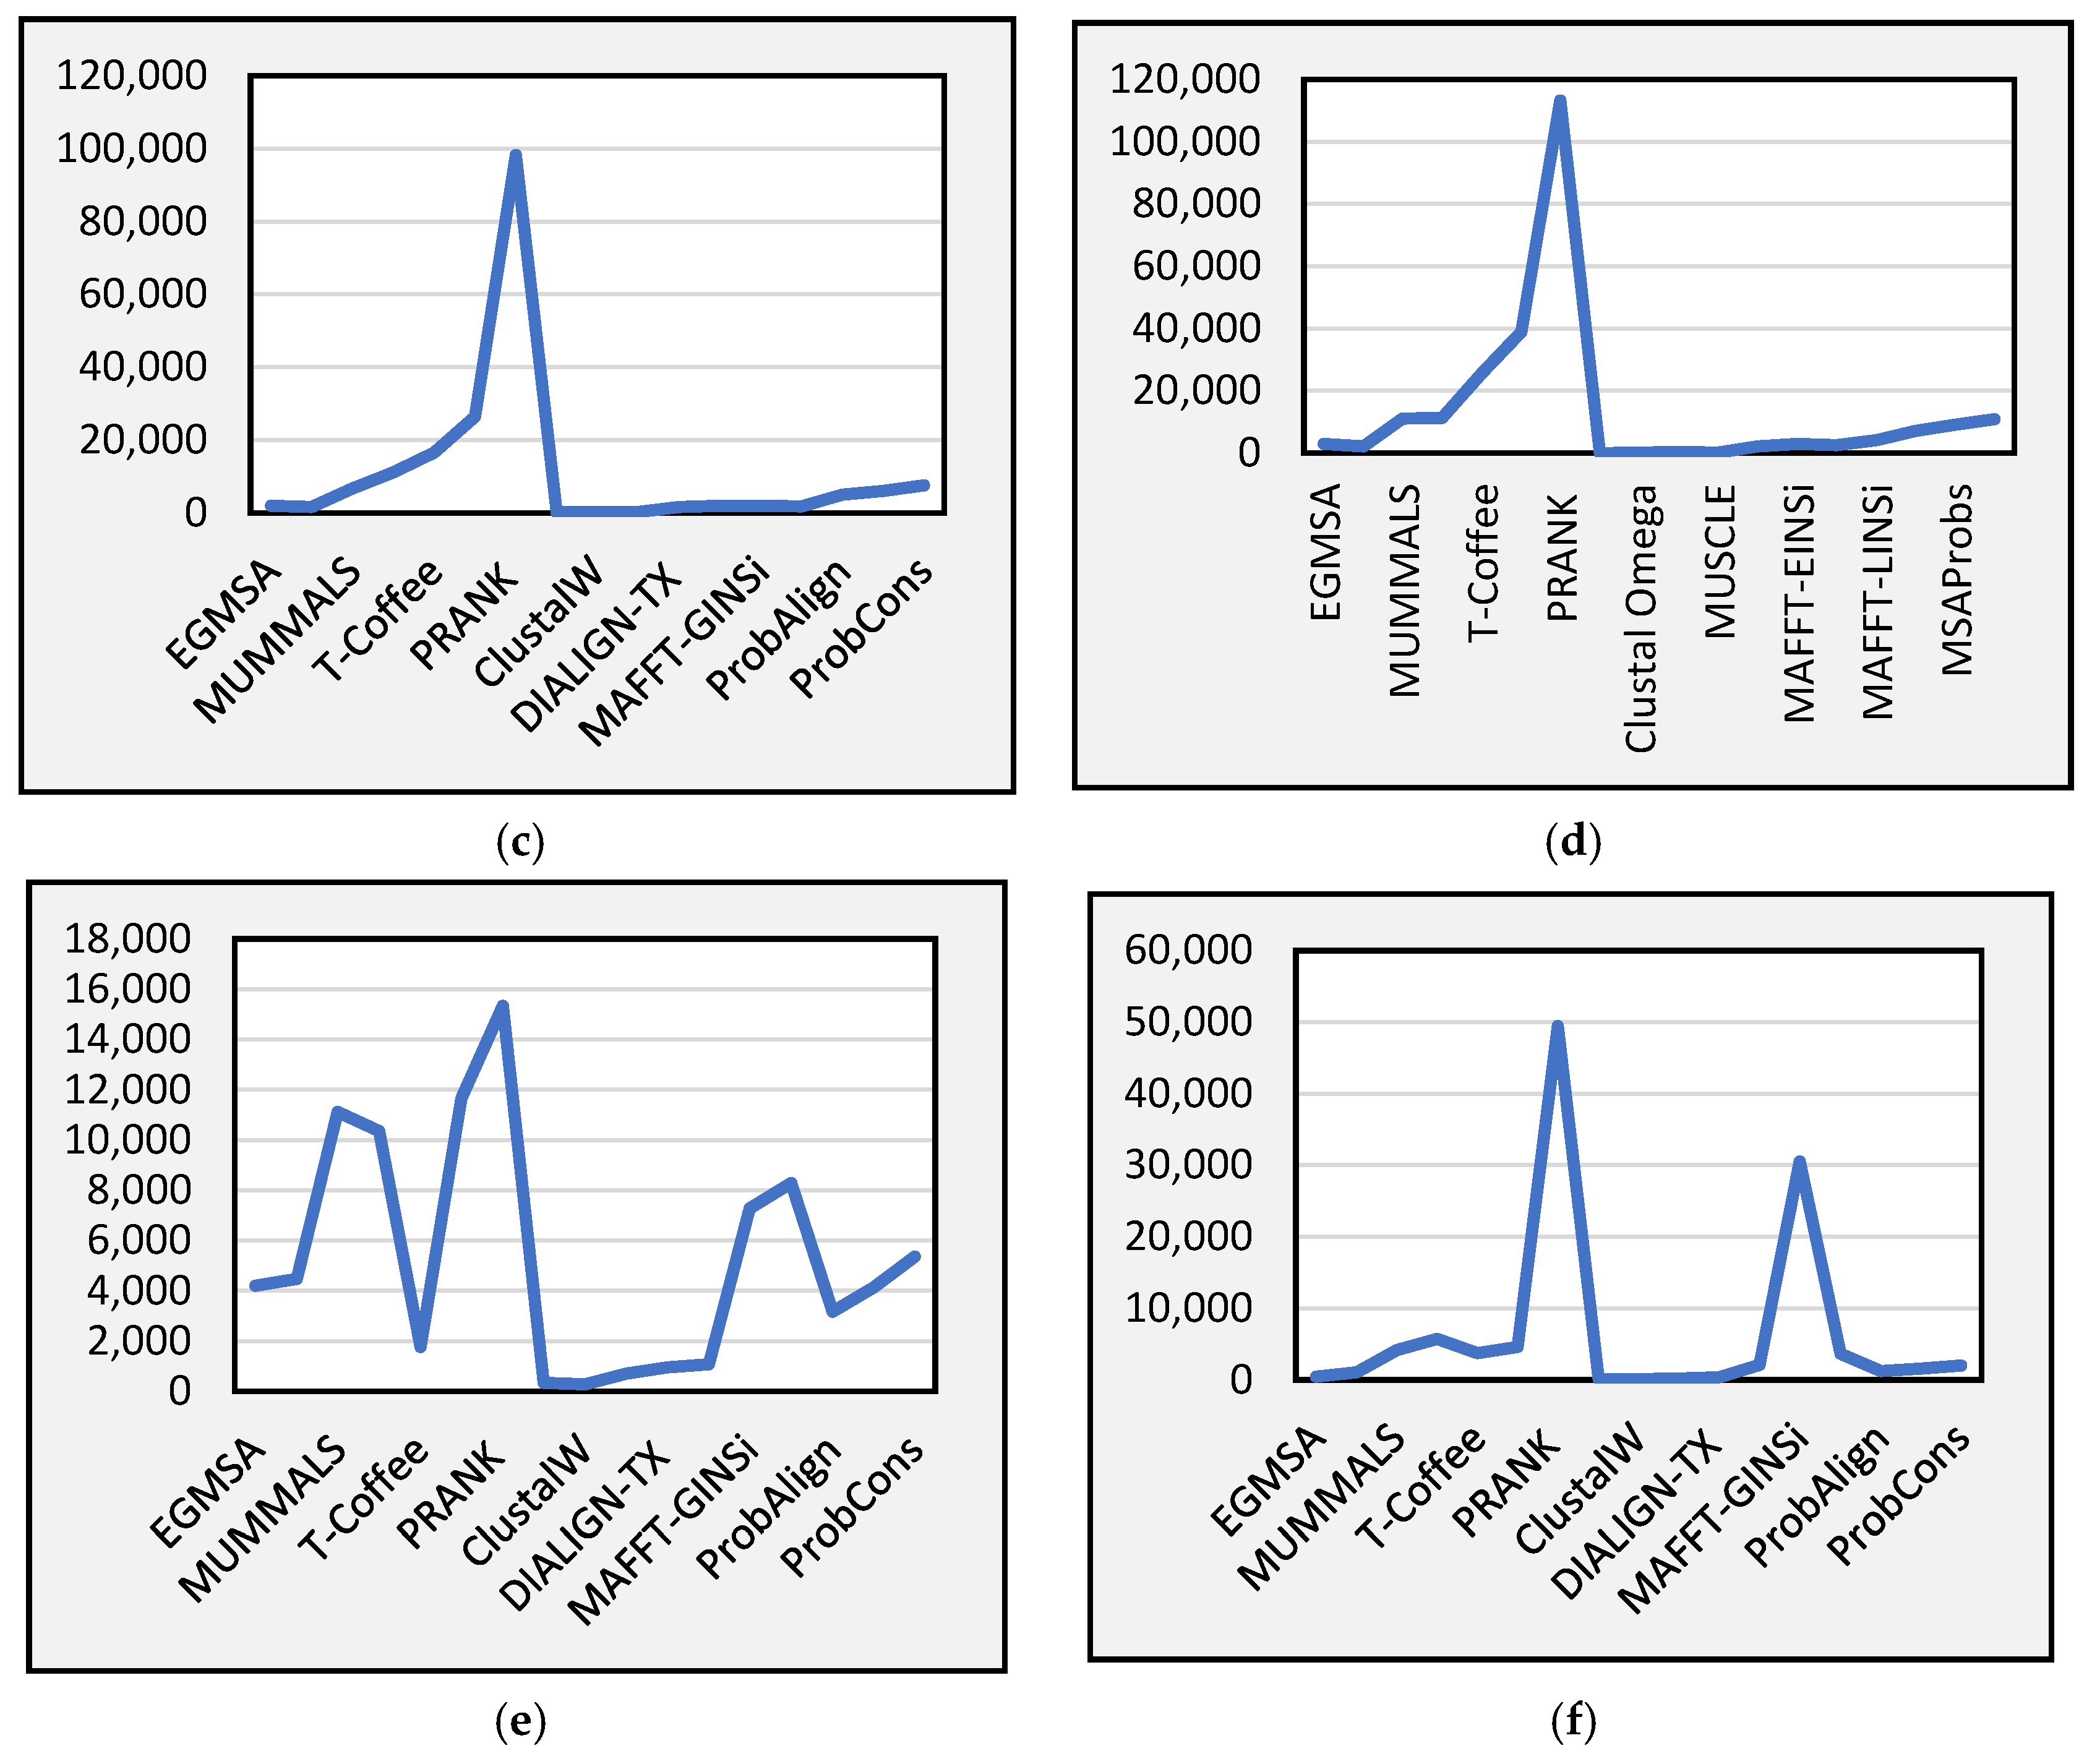
Figure 8 presents the total runtime required by the different comparison methods and our proposed method for the six subsets in BAliBASE v3.0. As can be seen, the runtime required by our proposed model is reasonable. In general, there is a trade-off between the alignment quality performance and computation time across all of the BAliBASE datasets, as can be noted in the existing literature [46]. Figure 8a–f depict the runtime for the proposed model alongside the baseline methods.
Further, from the results, it can be seen that the runtime of the proposed model is relatively stable in each case. This means that our suggested approach consumes less time compared to other multi-objective approaches. Although the proposed model takes a relatively longer time compared to some baseline approaches from the figures, the runtime of our suggested approach is significantly better than GAPAM, HMOABC, and MOSAStrE algorithms, which are also multi-objective methods used to solve the MSA problem. This indicates that the proposed model is an effective algorithm.

7. Conclusions

This study presented a new evolutionary approach to solve the MSA problem. The suggested approach is an integer-based method that simplifies the sequence alignment problem without considering the sequences in the non-dominated solution. This makes the method address the issue of time complexity. The proposed method uses two objective functions, namely, TCC and SP, to optimize the MSA problem, unlike other alignment methods that apply the sorting approach to generate a set of solutions and require a very high computation process. The suggested model essentially uses the two popular objective functions to achieve a better solution quality. Thus, instead of producing a set of non-dominated solutions, it produces two best solutions (one based on TCC and the other based on SOP). This helps the proposed model overcome the issue of complexity and memory requirements. A series of experiments was carried out using the SABmark and BAliBASE datasets. The proposed model was compared with the existing methods, and the experimental results showed a better solution quality than the compared approaches. The Wilcoxon signed-rank test was conducted for the significance test, and the results showed that our model improvement was statistically significant compared to the baseline methods. This method could be extended for future research directions by hybridizing with other optimization techniques to enhance the quality of the solutions. Furthermore, the presented approach can be improved by employing more beneficial MSA parameters to enhance the MSA performances.

Author Contributions

Writing—original draft and conceptualization, M.K.I.; methodology and formal analysis, M.K.I., U.K.Y., T.A.E.E. and M.N.; writing—review and editing, U.K.Y., T.A.E.E. and M.N.; supervision, U.K.Y.; project administration and funding acquisition, T.A.E.E. All authors have read and agreed to the published version of the manuscript.

Funding

The Deanship of Scientific Research at King Khalid University funded this work through a large group research project (under grant number RGP2/52/44).

Institutional Review Board Statement

Not applicable.

Informed Consent Statement

Not applicable.

Data Availability Statement

Data are contained within the article.

Acknowledgments

The authors extend their appreciation to the Deanship of Scientific Research at King Khalid University for funding this work through a large group Research Project under grant number (RGP2/52/44).

Conflicts of Interest

The authors declare no conflict of interest.

References

  1. Paruchuri, T.; Rao, G.; Suresh, K.; Rohit, D.; Yadav, K.; Singh, S. Nature Inspired Algorithms for Solving Multiple Sequence Alignment Problem: A Review. Arch. Comput. Methods Eng. 2022, 29, 5237–5258. [Google Scholar] [CrossRef]
  2. Altwaijry, N.; Almasoud, M.; Almalki, A.; Al-Turaiki, I. Multiple Sequence Alignment Using a Multiobjective Artificial Bee Colony Algorithm. In Proceedings of the 2020 3rd International Conference on Computer Applications & Information Security (ICCAIS), Riyadh, Saudi Arabia, 19–21 March 2020; pp. 1–6. [Google Scholar]
  3. Thompson, J.D.; Linard, B.; Lecompte, O.; Poch, O. A Comprehensive Benchmark Study of Multiple Sequence Alignment Methods: Current Challenges and Future Perspectives. PLoS ONE 2011, 6, e18093. [Google Scholar] [CrossRef] [PubMed]
  4. Shen, C.; Park, M.; Warnow, T. WITCH: Improved Multiple Sequence Alignment through Weighted Consensus Hidden Markov Model Alignment. J. Comput. Biol. 2022, 29, 782–801. [Google Scholar] [CrossRef] [PubMed]
  5. Do, C.B.; Mahabhashyam, M.S.P.; Brudno, M.; Batzoglou, S. ProbCons: Probabilistic Consistency-Based Multiple Sequence Alignment. Genome Res. 2005, 15, 330–340. [Google Scholar] [CrossRef]
  6. Paruchuri, T.; Kancharla, G.R.; Dara, S. Solving Multiple Sequence Alignment Problems by Using a Swarm Intelligent Optimization Based Approach. Int. J. Electr. Comput. Eng. 2023, 13, 1097. [Google Scholar] [CrossRef]
  7. Needleman, S.B.; Wunsch, C.D. A General Method Applicable to the Search for Similarities in the Amino Acid Sequence of Two Proteins. J. Mol. Biol. 1970, 48, 443–453. [Google Scholar] [CrossRef]
  8. Smith, T.F.; Waterman, M.S. Identification of Common Molecular Subsequences. J. Mol. Biol. 1981, 147, 195–197. [Google Scholar] [CrossRef]
  9. Goswami, A.; Dubey, K.K. A Novel Population-Based Optimization for Multiple Sequence Alignment in Protein Sequencing. Eng. Sci. 2022, 21, 786. [Google Scholar] [CrossRef]
  10. Soam, S.S. A Genetic Algorithm Based Approach for the Optimization of Multiple Sequence Alignment. In Proceedings of the 2020 International Conference on Computational Performance Evaluation (ComPE), Shillong, India, 2–4 July 2020. [Google Scholar]
  11. Notredame, C. Recent Progress in Multiple Sequence Alignment: A Survey. Pharmacogenomics 2002, 3, 131–144. [Google Scholar] [CrossRef]
  12. Amorim, A.R.; Zafalon, G.F.D.; de Godoi Contessoto, A.; Valêncio, C.R.; Sato, L.M. Metaheuristics for Multiple Sequence Alignment: A Systematic Review. Comput. Biol. Chem. 2021, 94, 107563. [Google Scholar] [CrossRef]
  13. Shyu, C.; Sheneman, L.; Foster, J.A. Multiple Sequence Alignment with Evolutionary Computation. Genet. Program. Evolvable Mach. 2004, 5, 121–144. [Google Scholar] [CrossRef]
  14. Lipman, D.J.; Altschul, S.F.; Kececioglu, J.D. A Tool for Multiple Sequence Alignment. Proc. Natl. Acad. Sci. USA 1989, 86, 4412–4415. [Google Scholar] [CrossRef]
  15. Wang, L.; Jiang, T. On the Complexity of Multiple Sequence Alignment. J. Comput. Biol. 1994, 1, 337–348. [Google Scholar] [CrossRef]
  16. Hogeweg, P.; Hesper, B. The Alignment of Sets of Sequences and the Construction of Phyletic Trees: An Integrated Method. J. Mol. Evol. 1984, 20, 175–186. [Google Scholar] [CrossRef] [PubMed]
  17. Thompson, J.D.; Higgins, D.G.; Gibson, T.J. CLUSTAL W: Improving the Sensitivity of Progressive Multiple Sequence Alignment through Sequence Weighting, Position-Specific Gap Penalties and Weight Matrix Choice. Nucleic Acids Res. 1994, 22, 4673–4680. [Google Scholar] [CrossRef] [PubMed]
  18. Thompson, J.D.; Koehl, P.; Ripp, R.; Poch, O. BAliBASE 3.0: Latest Developments of the Multiple Sequence Alignment Benchmark. Proteins Struct. Funct. Bioinform. 2005, 61, 127–136. [Google Scholar] [CrossRef] [PubMed]
  19. Yamada, S.; Gotoh, O.; Yamana, H. Improvement in Accuracy of Multiple Sequence Alignment Using Novel Group-to-Group Sequence Alignment Algorithm with Piecewise Linear Gap Cost. BMC Bioinform. 2006, 7, 524. [Google Scholar] [CrossRef]
  20. Katoh, K.; Kuma, K.; Toh, H.; Miyata, T. MAFFT Version 5: Improvement in Accuracy of Multiple Sequence Alignment. Nucleic Acids Res. 2005, 33, 511–518. [Google Scholar] [CrossRef]
  21. Edgar, R.C. MUSCLE: Multiple Sequence Alignment with High Accuracy and High Throughput. Nucleic Acids Res. 2004, 32, 1792–1797. [Google Scholar] [CrossRef]
  22. Gotoh, O. Significant Improvement in Accuracy of Multiple Protein Sequence Alignments by Iterative Refinement as Assessed by Reference to Structural Alignments. J. Mol. Biol. 1996, 264, 823–838. [Google Scholar] [CrossRef]
  23. Pei, J.; Grishin, N. V PROMALS: Towards Accurate Multiple Sequence Alignments of Distantly Related Proteins. Bioinformatics 2007, 23, 802–808. [Google Scholar] [CrossRef]
  24. Golberg, D.E. Genetic Algorithms in Search, Optimization, and Machine Learning. Addion Wesley 1989, 1989, 36. [Google Scholar]
  25. Notredame, C.; Higgins, D.G. SAGA: Sequence Alignment by Genetic Algorithm. Nucleic Acids Res. 1996, 24, 1515–1524. [Google Scholar] [CrossRef] [PubMed]
  26. Naznin, F.; Sarker, R.; Essam, D. Vertical Decomposition with Genetic Algorithm for Multiple Sequence Alignment. BMC Bioinform. 2011, 12, 353. [Google Scholar] [CrossRef] [PubMed]
  27. Naznin, F.; Sarker, R.; Essam, D. Progressive Alignment Method Using Genetic Algorithm for Multiple Sequence Alignment. IEEE Trans. Evol. Comput. 2012, 16, 615–631. [Google Scholar] [CrossRef]
  28. Gondro, C.; Kinghorn, B.P. A Simple Genetic Algorithm for Multiple Sequence Alignment. Genet. Mol. Res. 2007, 6, 964–982. [Google Scholar]
  29. Lee, Z.-J.; Su, S.-F.; Chuang, C.-C.; Liu, K.-H. Genetic Algorithm with Ant Colony Optimization (GA-ACO) for Multiple Sequence Alignment. Appl. Soft Comput. 2008, 8, 55–78. [Google Scholar] [CrossRef]
  30. Zhou, A.; Qu, B.-Y.; Li, H.; Zhao, S.-Z.; Suganthan, P.N.; Zhang, Q. Multiobjective Evolutionary Algorithms: A Survey of the State of the Art. Swarm Evol. Comput. 2011, 1, 32–49. [Google Scholar] [CrossRef]
  31. Ehrgott, M. Multicriteria Optimization; Springer Science & Business Media: Berlin/Heidelberg, Germany, 2005; Volume 491, ISBN 3540213988. [Google Scholar]
  32. Valenzuela, O.; Rojas, F.; Pomares, H.; Ortun, F.M.; Florido, J.P.; Urquiza, J.M.; Rojas, I. Optimizing multiple sequence alignments using a genetic algorithm based on three objectives: Structural information, non-gaps percentage and totally conserved columns. Bioinformatics 2013, 29, 2112–2121. [Google Scholar] [CrossRef]
  33. Kaya, M.; Sarhan, A.; Alhajj, R. Multiple Sequence Alignment with Affine Gap by Using Multi-Objective Genetic Algorithm. Comput. Methods Programs Biomed. 2014, 114, 38–49. [Google Scholar] [CrossRef]
  34. Rubio-Largo, Á.; Vanneschi, L.; Castelli, M.; Vega-Rodríguez, M.A. A Characteristic-Based Framework for Multiple Sequence Aligners. IEEE Trans. Cybern. 2016, 48, 41–51. [Google Scholar] [CrossRef] [PubMed]
  35. Rubio-Largo, Á.; Vega-Rodríguez, M.A.; González-Álvarez, D.L. Hybrid Multiobjective Artificial Bee Colony for Multiple Sequence Alignment. Appl. Soft Comput. 2016, 41, 157–168. [Google Scholar] [CrossRef]
  36. Eusuff, M.; Lansey, K.; Pasha, F. Shuffled Frog-Leaping Algorithm: A Memetic Meta-Heuristic for Discrete Optimization. Eng. Optim. 2006, 38, 129–154. [Google Scholar] [CrossRef]
  37. Karaboga, D. An Idea Based on Honey Bee Swarm for Numerical Optimization; Technical Report—tr06; Erciyes University: Kayseri, Turkey, 2005. [Google Scholar]
  38. Lassmann, T.; Frings, O.; Sonnhammer, E.L.L. Kalign2: High-Performance Multiple Alignment of Protein and Nucleotide Sequences Allowing External Features. Nucleic Acids Res. 2009, 37, 858–865. [Google Scholar] [CrossRef]
  39. DeRonne, K.W.; Karypis, G. Pareto Optimal Pairwise Sequence Alignment. IEEE/ACM Trans. Comput. Biol. Bioinform. 2013, 10, 481–493. [Google Scholar] [CrossRef]
  40. Handl, J.; Kell, D.B.; Knowles, J. Multiobjective Optimization in Bioinformatics and Computational Biology. IEEE/ACM Trans. Comput. Biol. Bioinform. 2007, 4, 279–292. [Google Scholar] [CrossRef]
  41. Seeluangsawat, P.; Chongstitvatana, P. A Multiple Objective Evolutionary Algorithm for Multiple Sequence Alignment. In Proceedings of the 7th Annual Conference on Genetic and Evolutionary Computation, Washington, DC, USA, 25–29 June 2005; pp. 477–478. [Google Scholar]
  42. Soto, W.; Becerra, D. A multi-objective evolutionary algorithm for improving multiple sequence alignments. In Advances in Bioinformatics and Computational Biology, Volume 8826 of Lecture Notes in Computer Science; Springer: Berlin, Germany, 2014; pp. 73–82. [Google Scholar]
  43. da Silva, F.J.M.; Pérez, J.M.S.; Pulido, J.A.G.; Rodriguez, M.A.V. Parallel Niche Pareto AlineaGA—An Evolutionary Multiobjective Approach on Multiple Sequence Alignment. J. Integr. Bioinform. 2011, 8, 57–72. [Google Scholar] [CrossRef]
  44. Abbasi, M.; Paquete, L.; Pereira, F.B. Local Search for Multiobjective Multiple Sequence Alignment. In Proceedings of the Third International Conference on Bioinformatics and Biomedical Engineering, Granada, Spain, 15–17 April 2015; Springer: Berlin/Heidelberg, Germany, 2015; pp. 175–182. [Google Scholar]
  45. Zhu, H.; He, Z.; Jia, Y. A Novel Approach to Multiple Sequence Alignment Using Multiobjective Evolutionary Algorithm Based on Decomposition. IEEE J. Biomed. Health Inform. 2015, 20, 717–727. [Google Scholar] [CrossRef]
  46. Rubio-Largo, Á.; Vega-Rodríguez, M.A.; González-Álvarez, D.L. A Hybrid Multiobjective Memetic Metaheuristic for Multiple Sequence Alignment. IEEE Trans. Evol. Comput. 2015, 20, 499–514. [Google Scholar] [CrossRef]
  47. Lassmann, T.; Sonnhammer, E.L.L. Kalign–an Accurate and Fast Multiple Sequence Alignment Algorithm. BMC Bioinform. 2005, 6, 298. [Google Scholar] [CrossRef]
  48. Rani, R.R.; Ramyachitra, D. Multiple Sequence Alignment Using Multi-Objective Based Bacterial Foraging Optimization Algorithm. Biosystems 2016, 150, 177–189. [Google Scholar] [CrossRef] [PubMed]
  49. Taheri, J.; Zomaya, A.Y. RBT-GA: A Novel Metaheuristic for Solving the Multiple Sequence Alignment Problem. BMC Genom. 2009, 10, S10. [Google Scholar] [CrossRef] [PubMed]
  50. Belattar, K.; Zemali, E.-A.; Baouni, S.; Dehni, S. Parallel Multiple DNA Sequence Alignment Using Genetic Algorithm and Asynchronous Advantage Actor Critic Model. Int. J. Bioinform. Res. Appl. 2022, 18, 460–478. [Google Scholar] [CrossRef]
  51. Kumar, M. An Enhanced Algorithm for Multiple Sequence Alignment of Protein Sequences using genetic algorithm. EXCLI J. 2015, 14, 1232–1255. [Google Scholar] [PubMed]
  52. Ye, L. A Decomposition and Dominance-Based Multiobjective Artificial Bee Colony Algorithm for Multiple Sequence Alignment. Mob. Inf. Syst. 2022, 2022, 5444055. [Google Scholar] [CrossRef]
  53. Henikoff, S.; Henikoff, J.G. Amino Acid Substitution Matrices from Protein Blocks. Proc. Natl. Acad. Sci. USA 1992, 89, 10915–10919. [Google Scholar] [CrossRef] [PubMed]
  54. Abd Rahman, R.; Ramli, R.; Jamari, Z.; Ku-Mahamud, K.R. Evolutionary Algorithm with Roulette-Tournament Selection for Solving Aquaculture Diet Formulation. Math. Probl. Eng. 2016, 2016, 3672758. [Google Scholar] [CrossRef]
  55. Miller, B.L.; Goldberg, D.E. Genetic Algorithms, Tournament Selection, and the Effects of Noise. Complex Syst. 1995, 9, 193–212. [Google Scholar]
  56. Dem, J. Statistical Comparisons of Classifiers over Multiple Data Sets. J. Mach. Learn. Res. 2006, 7, 1–30. [Google Scholar]
  57. Van Walle, I.; Lasters, I.; Wyns, L. SABmark—A Benchmark for Sequence Alignment That Covers the Entire Known Fold Space. Bioinformatics 2005, 21, 1267–1268. [Google Scholar] [CrossRef]
  58. Nannen, V.; Smit, S.K.; Eiben, A.E. Costs and Benefits of Tuning Parameters of Evolutionary Algorithms. In Parallel Problem Solving from Nature, Proceedings of the 10th International Conference on Parallel Problem Solving from Nature, Dortmund, Germany, 13–17 September 2008; Springer: Berlin/Heidelberg, Germany, 2008; pp. 528–538. [Google Scholar]
  59. Cutello, V.; Nicosia, G.; Pavone, M.; Prizzi, I. Protein Multiple Sequence Alignment by Hybrid Bio-Inspired Algorithms. Nucleic Acids Res. 2011, 39, 1980–1992. [Google Scholar] [CrossRef] [PubMed]
  60. Subramanian, A.R.; Kaufmann, M.; Morgenstern, B. DIALIGN-TX: Greedy and Progressive Approaches for Segment-Based Multiple Sequence Alignment. Algorithms Mol. Biol. 2008, 3, 6. [Google Scholar] [CrossRef] [PubMed]
  61. Bradley, R.K.; Roberts, A.; Smoot, M.; Juvekar, S.; Do, J.; Dewey, C.; Holmes, I.; Pachter, L. Fast Statistical Alignment. PLoS Comput. Biol. 2009, 5, e1000392. [Google Scholar] [CrossRef] [PubMed]
  62. Katoh, K.; Misawa, K.; Kuma, K.; Miyata, T. MAFFT: A Novel Method for Rapid Multiple Sequence Alignment Based on Fast Fourier Transform. Nucleic Acids Res. 2002, 30, 3059–3066. [Google Scholar] [CrossRef]
  63. Liu, Y.; Schmidt, B.; Maskell, D.L. MSAProbs: Multiple Sequence Alignment Based on Pair Hidden Markov Models and Partition Function Posterior Probabilities. Bioinformatics 2010, 26, 1958–1964. [Google Scholar] [CrossRef]
  64. Pei, J.; Grishin, N.V. MUMMALS: Multiple Sequence Alignment Improved by Using Hidden Markov Models with Local Structural Information. Nucleic Acids Res. 2006, 34, 4364–4374. [Google Scholar] [CrossRef]
  65. Löytynoja, A.; Goldman, N. An Algorithm for Progressive Multiple Alignment of Sequences with Insertions. Proc. Natl. Acad. Sci. USA 2005, 102, 10557–10562. [Google Scholar] [CrossRef]
  66. Roshan, U.; Livesay, D.R. Probalign: Multiple Sequence Alignment Using Partition Function Posterior Probabilities. Bioinformatics 2006, 22, 2715–2721. [Google Scholar] [CrossRef]
  67. Notredame, C. T-Coffee: A Novel Method for Fast and Accurate Multiple Sequence Alignment. J. Mol. Biol. 1994, 14, 693–699. [Google Scholar]
  68. Chowdhury, B.; Garai, G. A Bi-Objective Function Optimization Approach for Multiple Sequence Alignment Using Genetic Algorithm. Soft Comput. 2020, 5, 15871–15888. [Google Scholar] [CrossRef]
Figure 1. Flow chart of the proposed model.
Mathematics 11 04578 g001
Figure 2. Alignment representation in the proposed model. (a) Conventional codification method of MSA. (b) Alignment represented by an integer value matrix: positions in their sequences and positions of the last amino acid represented with a minus sign.
Mathematics 11 04578 g002
Figure 3. Crossover operator.
Mathematics 11 04578 g003
Figure 4. Different mutation operations: (a) merged gap, (b) gap insertion, and (c) block-gap mutation operation.
Mathematics 11 04578 g004
Figure 5. (a) The results for different P c and P m values on RV11 in terms of Q-Score. (b) The results for different P c and P m values on RV11 in terms of Q-Score.
Mathematics 11 04578 g005aMathematics 11 04578 g005b
Figure 6. The performance on different values of population size. (a) Performance on RV11. (b) Performance on RV12. (c) Performance on RV20. (d) Performance on RV30. (e) Performance on RV40. (f) Performance on RV50.
Mathematics 11 04578 g006aMathematics 11 04578 g006b
Figure 7. The performance on different values of iteration. (a) Performance on RV11. (b) Performance on RV12. (c) Performance on RV20. (d) Performance on RV30. (e) Performance on RV40. (f) Performance on RV50.
Mathematics 11 04578 g007aMathematics 11 04578 g007b
Figure 8. Comparison of running time on the BALiBASE 3.0. (a) RV11, (b) RV12, (c) RV20, (d) RV30, (e) RV40, and (f) RV50.
Mathematics 11 04578 g008aMathematics 11 04578 g008b
Table 1. Some popular methods for MSA.
ModelBrief Description/AdvantagesDrawbacks/Disadvantages
[32]Uses TCC, STRIKE score, and non-gaps percentage as the objective functionInadequate availability of structures
[34]Uses frog-leaping optimization method; considers SOP and TCC as fitness functionsIt is hard to conduct in real-world situations
[33]NSGA-II, which considers similarity, support maximization, and affine gap as the fitness functionsComputationally intensive
[45]A multi-objective-based approach utilizing a decomposition strategyComputationally intensive
[49]A hybrid method combining the RBT and the GASingle objective/function, low performance
[50]Uses a recursive-based GA to find the optimal fragmentation of the sequencesSingle objective function/computationally intensive
[51]MSA of protein sequences using GA; SOP used as the fitness functionSingle objective/function, low performance
[52]A decomposition-based multi-objective method that uses artificial bee colonyInadequate availability of structures
Table 2. Comparison of our proposed model with existing methods.
ModelMSACodification MethodFitness FunctionMutation Strategy
BinaryIntegerTCCSOPInsertionMergingBlock Gap
[32]×××××
[34]×××××
[33]××××××
[45]×××××
[49]××××××
[50]××××××
[51]××××××
[52]××××××
EGMSA (Proposed Method)
Table 3. Parameter setting.
ParameterValue
Population (N)150
Mutation probability ( P m ) [0.2–0.5]
Crossover probability ( P c ) [0.2–0.5]
SOP-TCC selection ratio(60–40)
Stopping criteria100
Iteration 100
Repetition per problem10 times
Table 4. Comparative results of the proposed model with baseline methods on BAliBase 2.0.
ReferenceName of DatasetsCLUST-ALW/XHMOABCMO-SAStreMSA-GAMSA-GA w/pSAGARBT-GAGAPAMVDGA_VDGA_Decomp_3VDGA_Decomp_4BSAGAEGMSA (Ours)
Ref. [1]1uky0.3920.5590.4030.4430.4050.6720.4020.4160.4590.4640.4100.607
Kinase0.4790.7830.8080.2950.4880.8620.4870.5310.5450.5480.6020.791
1ped0.5920.7320.7160.5010.6870.7460.4980.4430.4820.4510.6880.756
2myr0.2960.4660.5440.2120.3020.2850.3170.3470.3590.2820.3250.657
1ycc0.6430.6500.6530.8370.8450.7520.8390.6850.8470.885
1taq0.8260.5250.8260.9310.9450.9380.9590.9440.9650.858
Ref. [2]2pia0.7660.8930.8790.7610.7680.7630.7300.8260.8470.8500.8390.8870.897
1pamA0.7570.8800.9130.7550.7580.6230.660.8590.8570.8630.8530.8450.938
1tvxA0.5520.4480.8910.9200.9440.9740.9440.9710.968
1tgxA0.7270.7730.8350.8780.8670.8780.8500.8840.886
1lvl0.7460.9120.8250.7260.5670.7810.8030.8190.8160.8700.902
2hsdA0.4840.8980.8550.4980.7450.7960.8560.8290.7420.7620.865
3grs0.1920.8630.8640.2820.7550.7460.7170.7510.7810.7240.895
1ubi0.4820.9250.9110.4920.7950.7670.7320.7780.7940.8250.932
1wit0.5570.8550.4170.6940.8250.8510.8750.8150.7740.8900.857
2trx0.8700.8700.9820.9860.9590.9860.9860.9400.9860.9400.965
Ref. [3]1ajsA0.3240.5390.5860.3110.8920.8990.9060.9050.9020.8570.957
2myr0.9040.8250.6750.8220.8060.8300.8080.8100.825
4enl0.3750.7390.8120.8960.8900.8890.8990.9010.931
Kinase0.6190.8740.9180.580.6190.7580.6970.8250.8700.8900.8870.8900.758
1pamA0.7430.7030.7440.5790.5250.8350.8530.7880.7920.5000.673
1idy0.2730.3640.5460.6010.4460.5990.5690.8640.875
1uky0.1300.6920.6730.2690.350.4680.4690.4810.5260.4810.734
1ped0.6270.6460.4250.7750.8480.8930.7830.8510.756
2myr0.5380.4940.330.8130.5860.6510.5190.5640.879
Bold numbers represent the best values.
Table 5. Comparative results of our proposed model on BAliBase 3.0.
ModelRV11RV12RV20RV30RV40RV50Overall
QTCQTCQTCQTCQTCQTCQTC
EGMSA0.8870.7120.9400.9030.9400.5500.9410.6610.9260.6450.9230.7130.8900.749
BSAGA0.810.6220.9350.8510.9290.5480.9080.6560.9290.650.860.6060.8950.655
HMOABC0.7470.5760.9510.8870.9350.5130.8870.6340.9380.6550.8920.610.8920.646
ClustalX0.590.3620.9060.7940.9120.4530.8620.5790.9010.5870.8620.5370.8390.551
DIALIGN-TX0.5050.2680.8820.7570.8780.3080.7610.3890.8340.4520.8210.470.780.441
FSA-maxsn0.6180.3660.9370.8480.9010.3430.8140.4830.9160.5850.8720.5660.8430.532
FSA0.5030.2720.9240.8220.8650.1890.6890.2630.8610.4780.7890.420.7720.408
MAFFT-ENSi0.660.440.9360.8390.9260.4510.8610.5920.9140.5750.8990.5980.8660.582
MAFFT-GNSi0.6070.3470.9270.8250.9050.3910.8530.5320.8860.5160.8840.550.8440.527
MAFFT-LNSi0.6710.450.9360.8420.9260.4570.8550.5730.9190.6010.8990.5660.8680.582
MUMMALS0.6690.420.9430.8450.9060.4310.8480.4980.8710.4880.8790.5330.8530.536
MUSCLE0.6830.4410.9450.8620.9280.4790.8750.6230.9250.6040.8940.5930.8750.6
MSAProbs0.6820.4440.9460.870.9280.4690.8650.6110.9230.610.9080.610.8750.603
PRANK0.4620.2160.8370.6210.8010.1240.5780.0640.7470.3420.6730.2090.6830.263
T-Coffee0.6570.4140.9450.8590.9160.4060.8370.4780.8960.5540.8950.5910.8580.55
ProbCons0.670.420.9410.860.9170.4120.8450.5470.90.5360.8940.5790.8610.559
ProbAlign0.6950.4570.9460.8670.9260.4440.8530.5690.9220.6120.8890.5550.8720.584
Bold numbers represent the best values.
Table 6. Comparative results of our proposed model with baseline methods on SABmark.
ModelSuperfamilyTwilightOverall
QTCQTCQTC
EGMSA 0.8230.6370.6540.4500.6810.635
BSAGA0.7430.5920.6090.4590.6760.525
H4MSA0.7370.5890.5830.4360.6600.512
DIALIGN-TX0.5710.3490.2990.1230.4350.236
ClustalX0.6170.4140.3550.1810.4860.298
FSA-maxsn0.6070.3920.3410.1550.4740.274
FSA0.5310.3110.2480.1040.3990.208
MAFFT-ENSi0.6310.4220.3770.1810.5040.302
MAFFT GNSi0.6310.4090.3790.1950.5050.302
MAFFT-LNSi0.6420.4300.3920.1890.5180.309
MSAProbs0.6620.4590.4280.2280.5450.344
ProbAlign0.6540.4410.4240.2260.5390.334
MUSCLE0.6550.4490.4140.2150.5350.332
PRANK0.5550.3310.2980.1270.4270.229
MUMMALS0.6810.4860.4480.2450.5640.365
ProbCons0.6550.4490.4250.2230.5400.336
T-Coffee0.6570.4580.4250.2430.5410.350
Bold numbers represent the best values.
Table 7. Significance test for the proposed model.
MethodW–W+Zp-Value (Two Tails)p < 0.05
CLUST-A/X3205−2.798 b0.005yes
HMOABC8025−3.094 b0.002yes
MO-SAStre9213−2.731 b0.006yes
MSA-GA25917−2.758 b0.006yes
MSA-GA w/p651−2.946 b0.003yes
SAGA615−3.823 b0.000yes
RBT-GA1900−2.490 b0.013yes
GAPAM27253−2.845 b0.004yes
VDGA_226560−3.680 b0.000yes
VDGA_Dec_326461−2.480 b0.013yes
VDGA_Dec_4277.547.5−1.726 b0.084no
BSAGA266.558.5−4.238 b0.000yes
Disclaimer/Publisher’s Note: The statements, opinions and data contained in all publications are solely those of the individual author(s) and contributor(s) and not of MDPI and/or the editor(s). MDPI and/or the editor(s) disclaim responsibility for any injury to people or property resulting from any ideas, methods, instructions or products referred to in the content.

