Article

Anomaly Detection of Underground Transmission-Line through Multiscale Mask DCNN and Image Strengthening

1
Department of Mechanical Convergence Engineering, Hanyang University, 222 Wangsimni-ro, Seondong-gu, Seoul 04763, Republic of Korea
2
KEPCO Research Institute, Korea Electric Power Corporation, 105 Munji-ro, Yuseong-gu, Daejeon 34056, Republic of Korea
*
Author to whom correspondence should be addressed.
Mathematics 2023, 11(14), 3143; https://doi.org/10.3390/math11143143
Submission received: 5 June 2023 / Revised: 7 July 2023 / Accepted: 11 July 2023 / Published: 17 July 2023

Abstract

:
This study proposes an integrated framework to automatically detect anomalies and faults in underground transmission-line connectors (UTLCs) with thermal images because anomaly detection of underground transmission-line connectors (UTLCs) plays a critical role in power line risk management. The proposed framework features three key characteristics. First, the measured thermal images were preprocessed through z-score normalization and image strengthening. Z-score normalization improves the robustness of feature extraction for UTLCs even though noise exists in a thermal image, and image strengthening improves the accuracy of segmentation for UTLCs. Second, a preprocessed thermal image is segmented to detect UTLCs by addressing a multiscale mask deep convolutional neural network (MS mask DCNN). The MS mask DCNN effectively detects UTLCs, enabling anomaly detection only for pixels of UTLCs. Specifically, the multiscale feature extraction module enables the extraction of distinct features of UTLCs and environments, and the skip-layer fusion module concatenates distinct features from the feature extraction module. Furthermore, a half tensor is used to reduce computational resources but maintain the same segmentation accuracy, enhancing the feasibility of the proposed framework in field applications. Third, anomaly detection is performed by addressing the contour method and unsupervised clustering method of DBSCAN. The contour method compensates for the limits of the MS mask DCNN for real-world applications because the neural networks cannot secure perfect accuracy of 100% owing to a lack of sufficient training images and low computational resources. DBSCAN improves the accuracy of diagnosis and ensures robustness to eliminate noise from thermal reflection caused by low-emissivity objects. Field experiments with high-voltage UTLCs demonstrated the effectiveness of the proposed framework. Ablation studies also confirmed that the methods addressed in this study outperform other methods. The proposed framework with a novel automatic non-destructive patrol inspection system would decrease the risks of human casualties during the periodic operation and maintenance of UTLCs, which are currently the most critical concerns.

1. Introduction

Underground transmission lines (UTLs) have been introduced in urban areas because they are safe and robust to degradation originating from external environments compared with overhead transmission lines [1,2,3]. UTLs are also free from the limitations of installation spaces and concerns regarding the negative effects of magnetic fields on citizens in concentrated urban areas [4]. These advantages offered by UTLs have made them an indispensable option, actively replacing overhead transmission lines worldwide in urban areas despite the higher installation cost [5]. UTLs are installed with connectors that include insulators and various auxiliary components because the manufacturing process might have a limitation on the maximum length of the UTLs. Incorrect installation or poor jointing during repeated electrical loading can accelerate the degradation of connectors, and the faults of UTLs could affect the entire UTLs system, resulting in significant economic losses and human casualties [6]. In addition, UTLs are designed to have an expected lifetime of over 30 years with appropriate operation and maintenance [7]. Therefore, inspection of UTLs should be real-time, reliable, and automatic because it plays a critical role in ensuring the reliable operation and safety of UTLs.
Various studies have been conducted to ensure the reliability and safety of UTLs, focusing on UTLCs in which most faults and accidents have occurred in connectors [8]. Faults in UTLCs can be detected using non-destructive sensors, including magnetic sensors [9], current-voltage sensors [10,11] and electro-magnetic sensors [12,13,14]. Specifically, a set of measurements from a magnetic field sensor was used to reconstruct the current source of underground power cables for inspection by addressing the stochastic optimization technique and an artificial immune algorithm [9]. Fault detection of UTLs was also proposed by addressing an algorithm that considers the fault arc voltage with power quality monitoring data in the time domain [10] and by combining two methods of wavelet and time-domain analyses [11]. PD measurements have been proposed for anomaly detection of UTLs [12] because these measurements have several advantages, including accurate detection of anomalies and localization [13] and immunity to noise [14]. However, these methods involve installing contact-type sensors in the entire region of UTLs for accurate condition monitoring, suggesting that these methods are inefficient from an economic perspective because this approach requires a significant installation cost.
Fault detection with a non-contact type of sensor is promising because many sensors do not need to be installed for UTLs. In particular, infrared (IR) cameras have received considerable attention for health monitoring in the application field of electric and mechanical facilities because they provide meaningful information on the thermal energy emitted from an object of interest when a fault occurs. Intensive studies have been conducted to detect anomalies using IR cameras [15,16,17,18,19]. Fault detection using an aerial system deploying an IR camera was proposed for anomaly detection in photovoltaic farms [15,16] and overhead transmission lines [17]. A patrol inspection robot was proposed by deploying an IR camera to monitor the temperature of underground power facilities (UPF) with 2-D simultaneous localization and mapping [18]. Object detection through a customized neural network has also been proposed to identify defects in a thermal image [19]. These studies have improved the accuracy and efficiency of infrastructure health monitoring by deploying IR cameras. However, these methods are addressed by thresholding the intensity of pixels in the measured thermal images to detect anomalies in an autonomous manner, suggesting that these methods are difficult to apply in field applications because defining an appropriate threshold of intensity in thermal images is difficult and depends on the operational conditions of inspection.
The automatic separation of UTLs from environments could be achieved through deep learning because deep learning has witnessed significant advancements in recent years, revolutionizing various domains with its remarkable capabilities with complex data and extracting high-level representations. In particular, image segmentation has been improved by addressing mask-based deep convolutional networks (CNNs). CNNs are specialized in extracting hierarchical features from images, allowing them to recognize complex patterns and structures in images. Moreover, the spatial invariance of CNNs enables them to recognize patterns regardless of their location in an image. Parameter sharing and local connectivity enable reducing the computational cost, overcoming the limitations related to memory constraints. Specifically, image segmentation can be categorized into semantic segmentation and instance segmentation. Semantic segmentation assigns a label to each pixel in an image, providing a pixel-wise classification map, where each pixel is assigned a specific class. It offers a more comprehensive understanding of the entire image, enabling efficient image classification, object detection, and contextual comprehension. Moreover, semantic segmentation requires fewer computational resources compared with instance segmentation, whereas this method could not differentiate between instances of the same class; all pixels belonging to the same class are labeled identically. Instance segmentation provides an accurate description of object boundaries and enables object-level analysis, but this method is a more complex task that requires higher computational resources and slower inference times. Hence, the choice between the two methods depends on the specific application and the desired level of detail.
Various studies have been conducted on image segmentation through mask-based DCNNs to improve accuracy and robustness using models such as Fully Convolutional Network (FCN) [20], Residual U-Net (ResUNet) [21], and Mask-Region-based Convolutional Neural Network (Mask R-CNN) [22]. Specifically, FCN was proposed for the semantic segmentation of arbitrary-sized images through fully convolutional and deconvolutional layers, without relying on predefined fully connected layers, and employed end-to-end learning to optimize the network’s performance across the entire architecture [20]. ResUNet employed the U-Net autoencoder architecture with residual and skip connections to enhance information flow, the ability to capture fine details and the spatial context of the image, and address the problem of gradient vanishing, even in deeper networks [21]. Mask-RCNN was proposed for the instance segmentation, combining object detection and semantic segmentation through the integration of a region proposal network and RoIAlign for accurate feature extraction of the images. Furthermore, a mask branch is employed to predict pixel-level object masks for image segmentation [22]. Note that it is challenging to detect anomalies in UPF using semantic segmentation with IR measurements, even though several architectures have been proposed to effectively extract features of objects of interest. This limitation would originate from the inherent characteristics of UTLCs, which are the major location of failures in UPF because UTLCs are covered by several auxiliary components, which significantly disturb the extraction of features of UTLCs for separating UTLCs from environments.
To overcome these limitations, this study proposes an integrated framework for the automatic anomaly detection of UTLCs using IR measurements. The proposed framework is simple yet accurate for fault detection in field applications; it includes a preprocessing phase with statistical image strengthening, separation of UTLC from environments based on the features extracted through the MS mask DCNN, and anomaly detection with unsupervised clustering. Note that this complete framework compensates for the limitations of deep learning approaches, thereby securing high accuracy and robustness for field applications. The contributions of this study are summarized as follows:
  • The preprocessing phase improves the performance of the segmentation of UTLCs in a thermal image statistical image strengthening by employing two key features. Specifically, z-score normalization improves the robustness of feature extraction for UTLCs and reduces the noise in a thermal image. BHEPL improves the accuracy of segmentation for UTLCs.
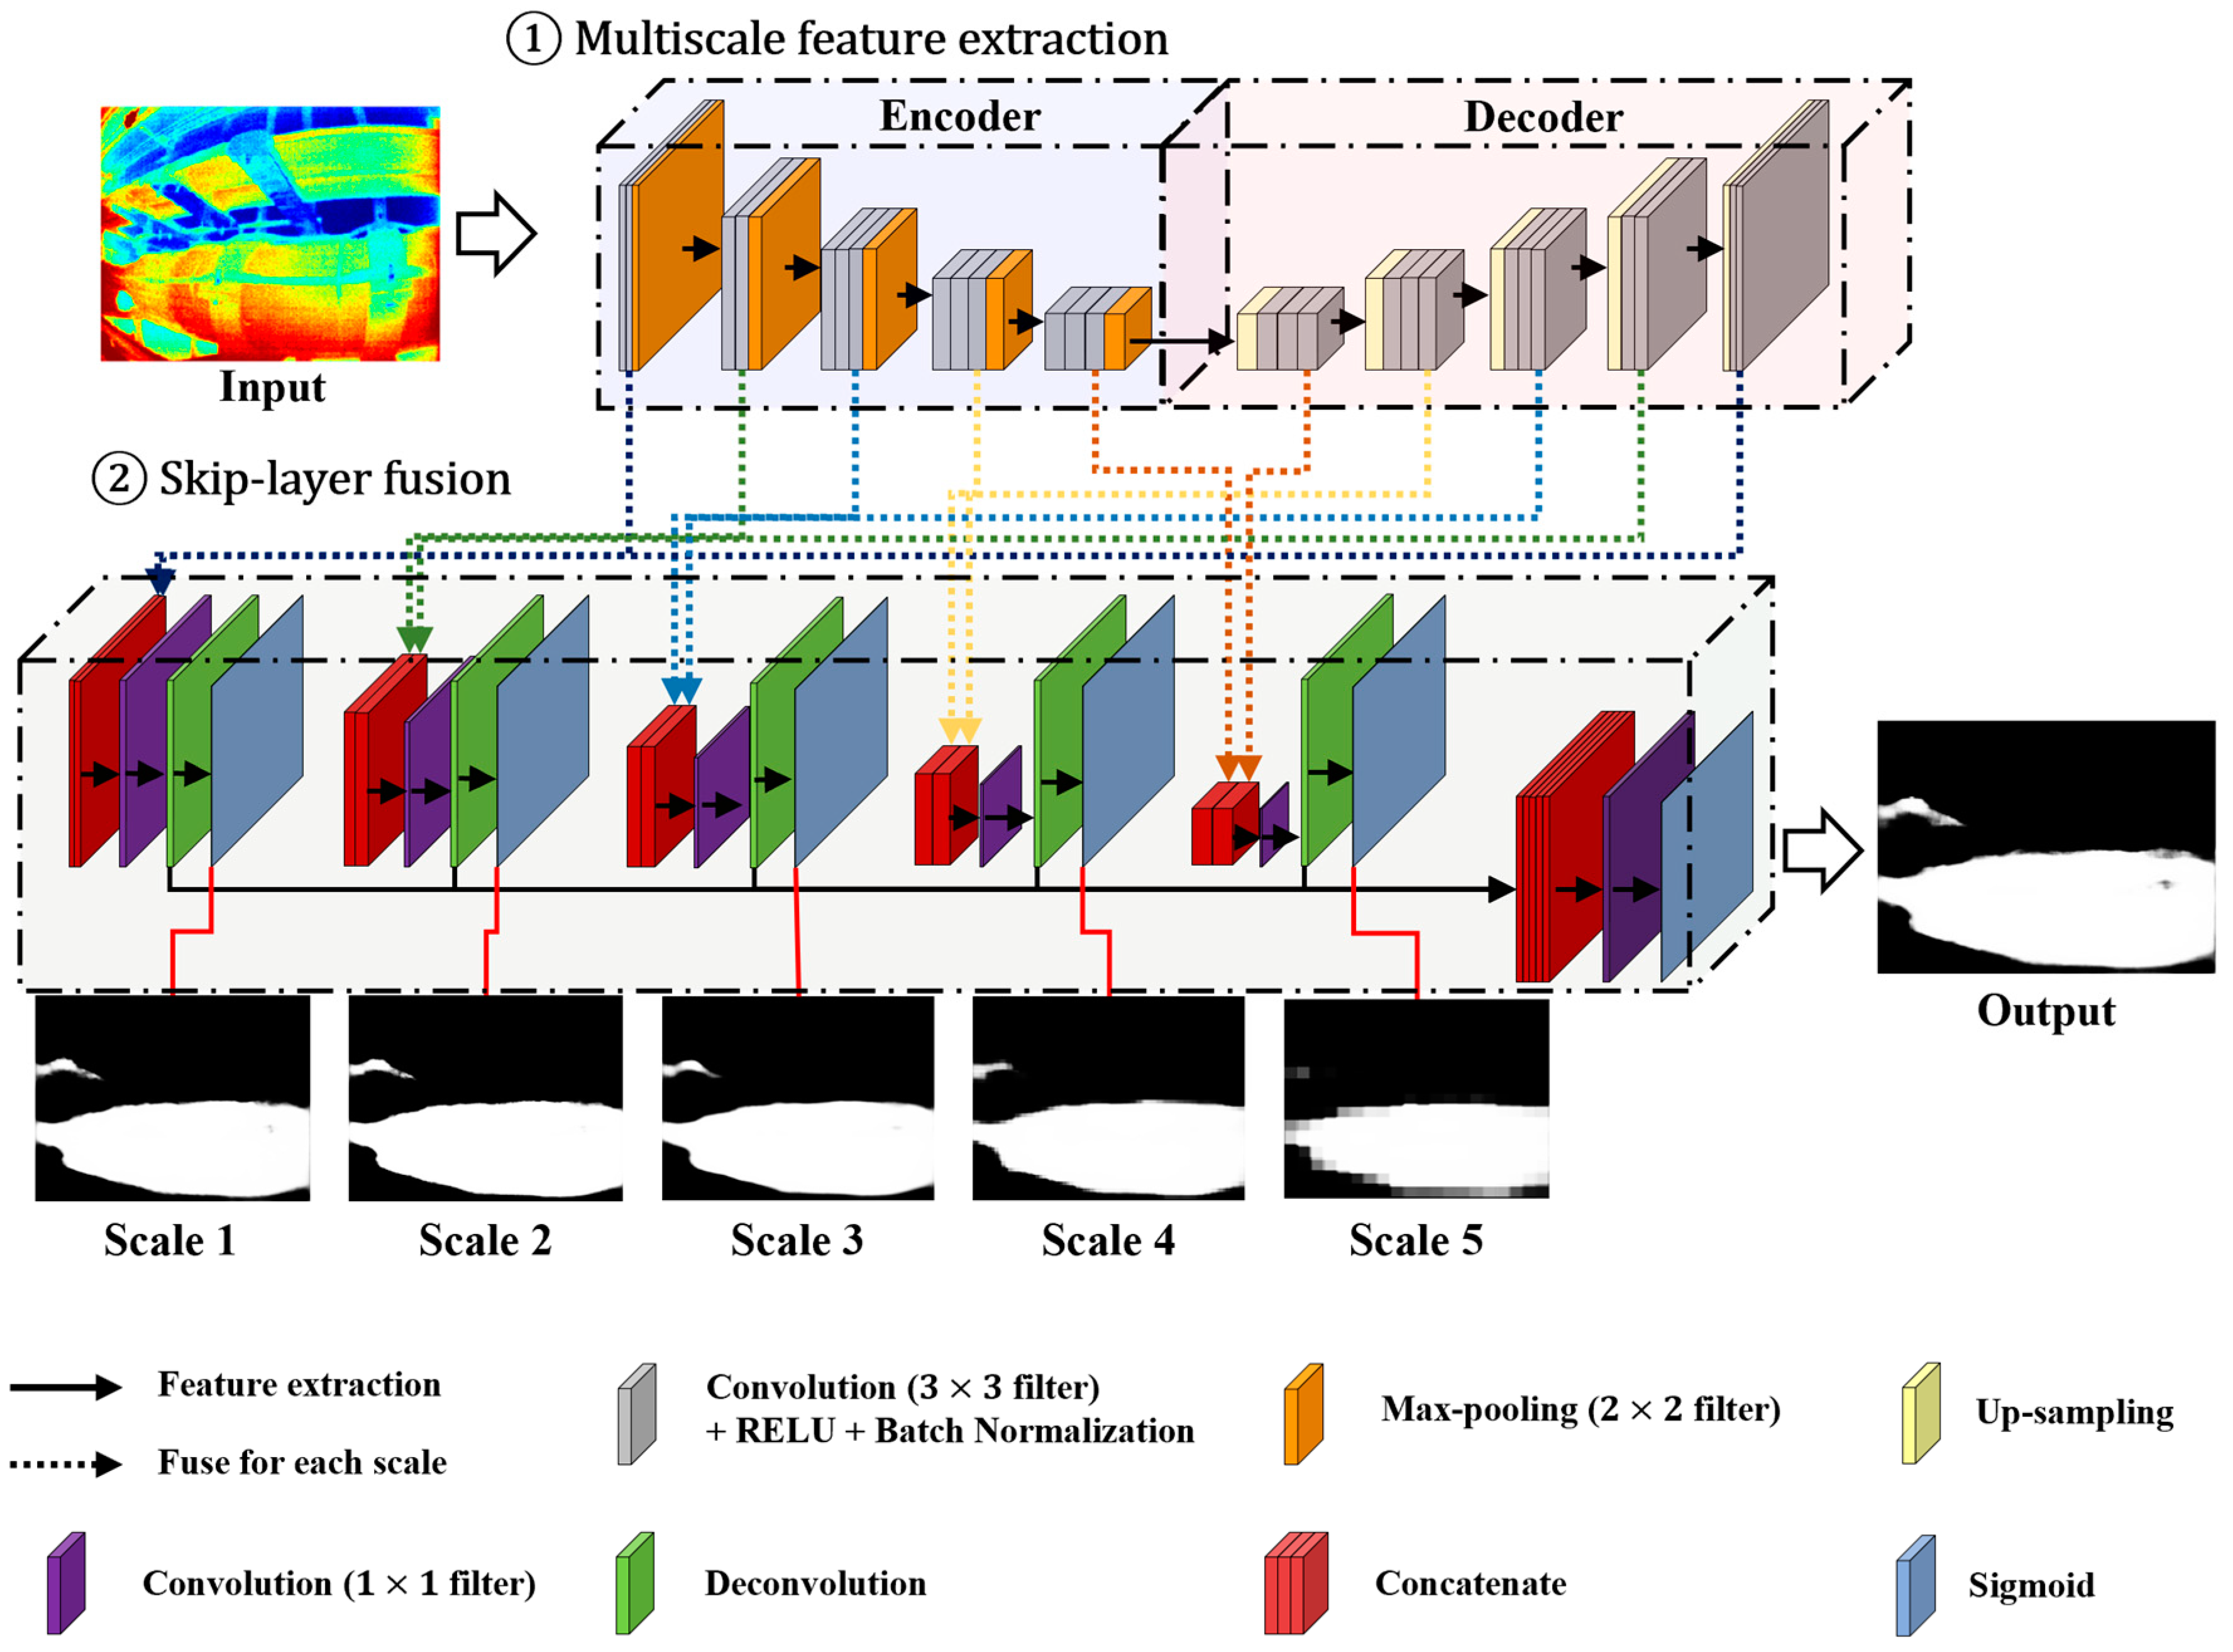
  • Automatic separation was achieved through the MS mask DCNN, which incorporates two key characteristics: a multiscale feature extraction module and a skip-layer fusion module. The multiscale feature extraction module enables the extraction of distinctive features from UTLCs and their environments, whereas the skip-layer fusion module combines these features extracted from the multiscale feature extraction module.
  • The anomaly detection phase addressed the problem of false segmentation of UTLCs when detecting anomalies with fast yet accurate post-processing methods. Specifically, the contour method can eliminate false segmentation of UTLCs with low computational cost, whereas the unsupervised clustering method of DBSCAN eliminates noise from thermal reflection, securing high accuracy and robustness in field applications.
  • Intensive field tests demonstrate the effectiveness of the proposed framework in real-world applications. Moreover, implementation of the half tensor during testing noticeably improved the framework’s inference time, demonstrating its suitability for practical field applications.
The remainder of this paper is organized as follows. Section 2 proposes an integrated framework for anomaly detection in the UTLCs. This section includes a detailed statistical image-strengthening method and the architecture of the MS-mask DCNN. Section 3 describes experiments for the calibration of the IR camera, dataset measurements from field experiments, and the construction of the MS mask DCNN. Section 4 presents the results, an ablation study of the proposed framework, and an in-depth discussion. Section 5 concludes the paper with both quantitative and qualitative highlights.

2. An Integrated Framework of Anomaly Detection

This section presents an integrated framework for the anomaly detection of UTLCs with thermal images measured using an IR camera. The proposed method comprises three phases (Figure 1). First, the visualized thermal energy of the UTLCs overlaid on a visible spectrum image was normalized and statistically strengthened in phase A. This phase aims to help the proposed neural network extract features of UTLCs by distinguishing their features from those of the environment. Second, semantic segmentation is executed through the MS mask DCNN in Phase B to separate the UTLC from the environments in the thermal image. Hence, the MS mask DCNN plays a filtering role in detecting a UTLC in the proposed method. Third, anomalies in UTLCs are detected in phase C based on the KEPCO inspection regulation [23] using a contour method and an unsupervised clustering method. The contour method aims to eliminate false-segmented inference from MS mask DCNN because artificial intelligence cannot secure complete accuracy of 100% owing to a lack of sufficient training images. An unsupervised clustering method of DBSCAN is also employed to improve the robustness of the proposed method by decreasing the false alarms caused by noise from thermal reflection. The proposed method can detect anomalies for single and multiple phases of UTLCs in the sense that UTLCs are composed of multiple phases. Details of each phase are described in the following subsections.

2.1. Phase A Image Preprocessing and Statistical Image Strengthening

This subsection presents detailed methods of image preprocessing and statistical strengthening (Phase A in Figure 1), which aim to improve the performance of semantic segmentation and thereby help effectively train a neural network in the next phase. The proposed method comprises three procedures: conversion of thermal energy into a temperature image (Figure 1a), z-score normalization (Figure 1b), and image strengthening through bi-histogram equalization with a plateau limit (BHEPL, Figure 1c) [24].
First, thermal energy measured from an IR camera is converted to a representative temperature because inspection regulation defines anomaly detection based on the temperature variation of UTLCs [23]. Hence, the accurate conversion of thermal energy into a representative temperature plays an important role in ensuring the accuracy and reliability of inspection. The IR camera is a non-contact sensor for measuring thermal energy through the infrared wavelength band radiated from objects with an absolute temperature above 0 K. An IR camera of the TE-EV1 (I3systems, Daejeon, Republic of Korea) was used for anomaly detection of UTLCs because this camera features a low noise-equivalent temperature difference of 30 mK (@ 300 K), a wide-range field of view (FOV) of 76° and 59.5 ° and a high resolution of 640 × 480 pixels. The calibration sheet was provided with specifications from the manufacturer, i.e., I3 systems. This sheet provides a conversion formula from the thermal energy of the thermal data measured from the IR camera to temperature as follows:
T i j = ( W i j 5000 ) 100 ,
where W i j and T i j denote the measured thermal energy and converted temperature at the i th row and j th column of the image. However, preliminary experiments revealed that this calibration formula has a large uncertainty, suggesting that independent calibration should be executed to ensure the accuracy of conversion with a governing equation as follows:
T i j * = a 1 T i j + b 1 ,
where T i j * denotes the calibrated temperature at the i th row and j th column of a pixel in the temperature image of interest, and a 1 and b 1 denote the coefficients in the first-order polynomial regression. Note that the detailed process of the calibration is described in Section 3.1.
Next, a calibrated temperature image was z-score-normalized. This method aims to help the proposed framework detect UTLCs regardless of several existing heat sources, such as ceiling lights and hot spots in the UTLCs. These heat sources are located in the UPF and disturb the ability to distinguish UTLCs from the environment because these objects also emit thermal energy. In other words, UTLCs and other environments are difficult to distinguish without z-score normalization when these heat sources exist in a measured thermal image because the heats emitted from these heat sources are higher than those emitted from UTLCs, as exemplified in Figure 2a,b. The proposed method would be effective in this situation because z-score normalization can statistically mitigate outliers exceeding three-sigma, as follows:
Z i j = μ T + 3 σ T μ T 3 σ T T i j * ( T i j * μ T + 3 σ T ) ( T i j * μ T 3 σ T ) e l s e ,
where Z i j denotes the z-scored temperature in the i th row and j th column of a pixel in an image, and μ T and σ T denote the mean temperature and standard deviation of the converted temperature. Specifically, temperatures exceeding ± 3 σ T are changed to values of μ T ± 3 σ T (blue and red line in Figure 2b), whereas temperatures within ± 3 σ T hold the same values because excessive temperature is measured, that is, outliers exceeding 3 σ T , resulting in a small variation in UTLCs compared with environments in a thermal image (Figure 2a). In other words, this process helps to suppress excessive temperatures exceeding μ T ± 3 σ T . Furthermore, a thermal image, where outliers are calibrated to μ T ± 3 σ T , is normalized as:
X i j = Z i j μ T 3 σ T μ T + 3 σ T μ T 3 σ T = Z i j μ T 3 σ T 6 σ T ,
where X i j denotes the z-score normalized thermal energy in the i th row and j th column of a pixel in an image. Note that z-scored temperatures corresponding to μ T 3 σ T and μ T + 3 σ T are changed to zero and unity, whereas z-score temperatures within μ T ± 3 σ T are normalized in the range between zero and unity. Hence, these processes clearly distinguish UTLCs and other auxiliary facilities in a calibrated thermal image, even though some heat sources exist in the image, as shown in Figure 2c, suggesting that the MS mask DCNN easily detects and separates a UTLC from the environment. Note that this procedure does not eliminate statistical outliers during the final inspection. This preprocessing aims to clearly distinguish UTLCs from environments in spite of existing unexpected anomalies, including hot spots in UTLCs and ceiling lights, through MS mask DCNN in thermal images in phase C.
Finally, a z-score normalized image was statistically strengthened by addressing the BHEPL (Figure 3) [24]. This process comprises seven steps. First, the average intensity X m is calculated for each z-score-normalized thermal image (Figure 3a). Second, a thermal image is decomposed into two sub-images by X m to maintain the mean brightness of the thermal image (Figure 3b) as follows:
X = X L X U ,
where X L and X U denote two sub-images divided by X m defined as
X L = X i , j X i , j X m , X i , j X } ,
X U = X i , j X i , j > X m , X i , j X } .
Note that the sub-image X L is composed of { X 0 , X 1 , , X m } , and the other sub-image X U is composed of { X m + 1 , X m + 2 , , X L 1 } based on the calculated average intensity X m as shown in Figure 2d. Third, two plateau limits T L and T U are set calculated to clip each sub-histogram (Figure 3c) as follows:
T L = 1 X m + 1 k = 0 X m h L k ,
T U = 1 L 1 X m k = X m + 1 X L 1 h U k ,
where h L and h U denote two sub-histograms of the divided sub-images, X L and X U . Furthermore, T L and T U is calculated to the average of h L and h U as shown in Figure 2d.
Fourth, each sub-histogram is clipped by two plateau limits to prevent a level saturation effect (Figure 3d), which pushes the intensities toward the right or left side of the histogram. The clipped histograms through the two plateau limits T L and T U are denoted as h C L and h C U , which are given as
h C L x = h L x T L    i f   h L x T L e l s e w h e r e ,
h U L x = h U ( x ) T U    i f   h U x T U e l s e w h e r e .
Fifth, the probability density functions, and cumulative density functions of each clipped histogram were calculated to obtain the robustness transformation functions (Figure 3e) as
p L x = h L X K M L , for   k = 0,1 , , m ,
p U x = h U X k M U , for   k = m + 1 , m + 2 , , L 1 ,
where p L and p U denote the probability density functions of h C L and h C U , respectively, and M L and M U denote the total number of pixels in h C L and h C U , respectively. These probability density functions are used to calculate the cumulative density functions c L and c U of X L and X U , respectively, as follows:
c L x = k = 0 m p L X k ,
c U x = k = k + 1 L 1 p U X k .
Sixth, the robustness transformation functions f L ( x ) and f U ( x ) are addressed with two sub-images for executing histogram equalization and inversion histogram equalization processes (Figure 3f) as
f L x = X 0 + X m X 0 c L x 0.5 p L x ,
f U x = X m + 1 + X L 1 X m + 1 c U x 0.5 p U x .
Note that the two decomposed sub-images are strengthened independently based on their transformation functions. Finally, the output image is expressed (Figure 3g) as follows:
Y = Y i , j = f L X L f U X U ,
where f L ( X L ) and f U ( X U ) denote the sub-set images defined, respectively, as
f L X L = f L X i , j X i , j X L ,
f U X U = f U X i , j X i , j X U .
The strengthened image Y from BHEPL is shown in Figure 2e, and the intensity histogram of image Y is shown in Figure 2f. A comparison between Figure 2c,e suggests that enhanced thermal image through BHEPL (Figure 2e) would be more effective in training the MS mask DCNN when other heat sources exist in a representative temperature image, implying that the proposed method helps distinguish features of UTLCs from those of environments in a thermal image for training the mask-based neural network, even though several heat sources exist in the thermal images.

2.2. Phase B Multi-Scale Mask Deep Convolution Neural Network

This subsection presents a method for detecting a UTLC through an MS mask DCNN (phase B in Figure 1) from a thermal image preprocessed in phase A. The MS mask DCNN is designed to separate a UTLC from the background of the thermal image because the MS mask DCNN ensures high accuracy and robustness [25]. The architecture of the proposed MS mask DCNN is designed for pixel-wise semantic segmentation, as shown in Figure 4, featuring two characteristics: a multiscale feature extraction module (① in Figure 4) and a skip-layer fusion module (② in Figure 4).
The multiscale feature extraction module is constructed using a symmetric autoencoder architecture. Specifically, the encoder and decoder construct multiscale layers to effectively extract both local and global semantic features from an input thermal image. Each layer in the encoder comprises several ConvReLU layers (gray blocks at ① in Figure 4) that combine a convolution layer, activation function layer, batch normalization layer, and max-pooling layer. First, different scales of convolution layers are used to extract low- and high-scale features and construct multiscale feature maps. Low-scale layers extract high-frequency details, including complex temperature gradients and the edges of facilities, with high resolution. Hence, complex local features of UTLCs and the background are extracted at low scales because they are similar in size to an input image. In contrast, the high-scale layers extract low-frequency details, including the global temperature gradient and overall shapes of the UTLCs and the background with low resolution. In other words, the global features of the UTLCs and the background are extracted at the high-scale layers because they retain the implicated features at a small size. Hence, the proposed architecture effectively extracts both local and global features from a thermal image. Second, the activation function layer executes a nonlinear space transformation to easily identify and extract features. This layer addresses the ReLU function as an activation function because it helps train the feature maps effectively through nonlinear space transformation with efficient gradient propagation [26]. Third, a batch normalization layer plays a regulatory role, preventing the gradient vanishing problem. Finally, a max pooling layer (orange blocks at ① in Figure 4) is added at the end of the encoder layers in each scale. This layer consists of a stride larger than one and helps train the input thermal images effectively because these networks reduce the size of the parameters and extract important features from an input thermal image. Similarly, each layer in the decoder comprises several up-sampling and ConvReLU layers symmetric to those in the encoder. The up-sampling layers (yellow blocks at ① in Figure 4) in front of each decoder layer match the extracted feature maps corresponding to the size of the encoder layers. This layer uses a bilinear interpolation method to improve the inference time [27]. However, this might result in a loss of spatial resolution and boundary bias. Hence, max-pooling indices are recorded and used for up-sampling to compensate for the absence of representative information. The ConvReLU layers in the decoder play the same role as those in the encoder. However, several nonlinear space transformations at the activation layers of each scale enable feature extraction at different hyperplanes, strengthening the features for accurate separation of UTLCs.
The skip-layer fusion module is introduced at each scale to mitigate concerns regarding spatial loss from the convolution layers of the encoder and decoder. This module comprises a concatenate layer (red blocks at ② in Figure 4), a convolution layer (purple blocks at ② in Figure 4), a deconvolution layer (green blocks at ② in Figure 4), and a sigmoid activation function layer (sky blue blocks at ② in Figure 4). First, the same scales of the feature maps in the encoder and decoder are concatenated to reduce the spatial loss in the concatenated layer. Second, each concatenated feature map is fed into a 1 × 1 convolution layer, changing the size of the feature maps from multi-channel to one-channel. This layer helps train a neural network effectively because it reduces the size of the parameters. Subsequently, one-channel feature map passes through the deconvolution layers to resize the feature maps the same as the input image. Finally, these feature maps are concatenated and then passed through 1 × 1 convolution and sigmoid layers to separate the UTLCs from the environment, as shown in Figure 5a. Therefore, the MS mask DCNN results in a binary filter image to separate the UTLC from the environment.

2.3. Phase C Anomaly Detection of Transmission Line

This subsection presents a detailed method for anomaly detection in UTLCs (Figure 5) The proposed method combines the contour method and the unsupervised clustering method to improve the accuracy of semantic segmentation of UTLCs, thereby decreasing the false-alarm rate. The contour method effectively eliminates the false-segmented pixels of UTLCs with a low computational cost. The proposed method comprises three procedures: elimination of false-segmented UTLCs, anomaly detection for single-phase UTLCs, and anomaly detection for multiple phases of UTLC.
First, false-segmented pixels of the UTLCs are eliminated through a contour method (Figure 1d) because a segmented UTLC through the MS-mask DCNN included false-segmented pixels (red circles in Figure 5a). Note that neural networks cannot secure the perfect accuracy of 100% because of insufficient training data and thermal reflection, which are inherent characteristics of IR cameras [28]. Additionally, this study predefined a value of 1 for the number of segmented UTLCs in an image. These concerns were mitigated by employing a contour method [29] comprising four steps. First, contours were detected by extracting pixels corresponding to the same value in a binary image. Second, the areas of each contour were calculated, and the detected contours were sorted by area. Third, all the pixels were eliminated, excluding the contour with the largest area. The contour method eliminates all false-segmented regions predicted from the MS mask DCNN because prediction from the MS mask DCNN secures an accuracy of over 90%, and thus, the largest region represents the connector region of interest. Finally, the retained contours are filled to refine the segmented UTLC (Figure 5b), demonstrating that the contour method effectively eliminates false-segmented regions. Note that this binary image is used as a filter to extract only the temperature distribution of a UTLC, implying that this method does not affect the detection accuracy of an anomalous UTLC. Subsequently, the UTLC regions are extracted from a thermal image. Specifically, the binary filter (Figure 5b) refined from the contour method is multiplied by the original thermal image, resulting in the temperature distribution of the UTLC regions (Figure 5c).
Second, an anomaly was detected for the single- and multi-phase UTLCs. The criteria for anomaly detection are defined by regulations from KEPCO [23]. Specifically, the regulations given by KEPCO classify the conditions of UTLCs into three categories: normal, caution, and warning. Caution and warning are defined as regions with temperatures exceeding 2 °C and 4 °C from the mean temperature of the UTLCs, respectively; otherwise, the UTLCs are normal. Interestingly, a filtered thermal image of a UTLC includes a small region of high-temperature pixels (the black box in Figure 5d) in some cases, which could be considered an anomaly. An expert system reveals that these regions clustered below 10 pixels are not overheated regions but regions of thermal reflection because overheating leads to large pixels clustered because of thermal conduction in UTLs. Thermal reflection is an inherent characteristic of IR cameras, which occurs when recording a highly reflective object [28]. Underground transmission facilities include highly reflective metallic components such as supporting structures, bolts, and nuts. Bolts and nuts fixing the supporting structures are orthogonal to the IR camera in some cases, resulting in thermal reflection (the red boxes in Figure 5e,f). Hence, the anomaly is determined by an unsupervised clustering method of the DBSAN among several outlier pixels [30] because this method is effective in eliminating small numbers of noisy pixels (Figure 1e). The proposed anomaly-detection method comprises four steps. First, the mean temperature is calculated for the pixels of a UTLC, which corresponds to a segmented UTLC in a thermal image (Figure 5d). Second, overheated pixels exceeding 2 °C are identified because these pixels are anomaly candidates in the KEPCO regulation [23]. Third, these pixels are clustered through DBSCAN to separate anomalies from noise from thermal reflection with two parameters, radius and number of minimum points, where radius and number of minimum points denote the maximum distance between pixels and the minimum number of pixels within the radius in a cluster, respectively. This study uses predefined values of 100 and 10 for the radius and number of minimum points, respectively, based on experiments. Hence, clustered pixels exceeding the predefined threshold are overheated regions, whereas other clusters are noise from thermal reflection. Specifically, overheated regions are classified as caution and warnings when they exceed 2 °C and 4 °C, respectively. Anomalies were further analyzed (Figure 1e) for the three phases of UTLCs because UTLCs comprise three phases of UTLCs. Specifically, the mean temperatures for the three phases of the UTLCs were compared. A UTLC with a high mean temperature exceeding 2 °C and 4 °C is classified as an anomaly UTLC with a class of caution and warning. Moreover, the proposed method is capable of handling various types of UTLC anomalies because anomalies in UTLCs are caused by mechanical and electrical defects, which result in localized temperature increases at the faulty components, and temperature distributions could exhibit similar patterns.

3. Experiments

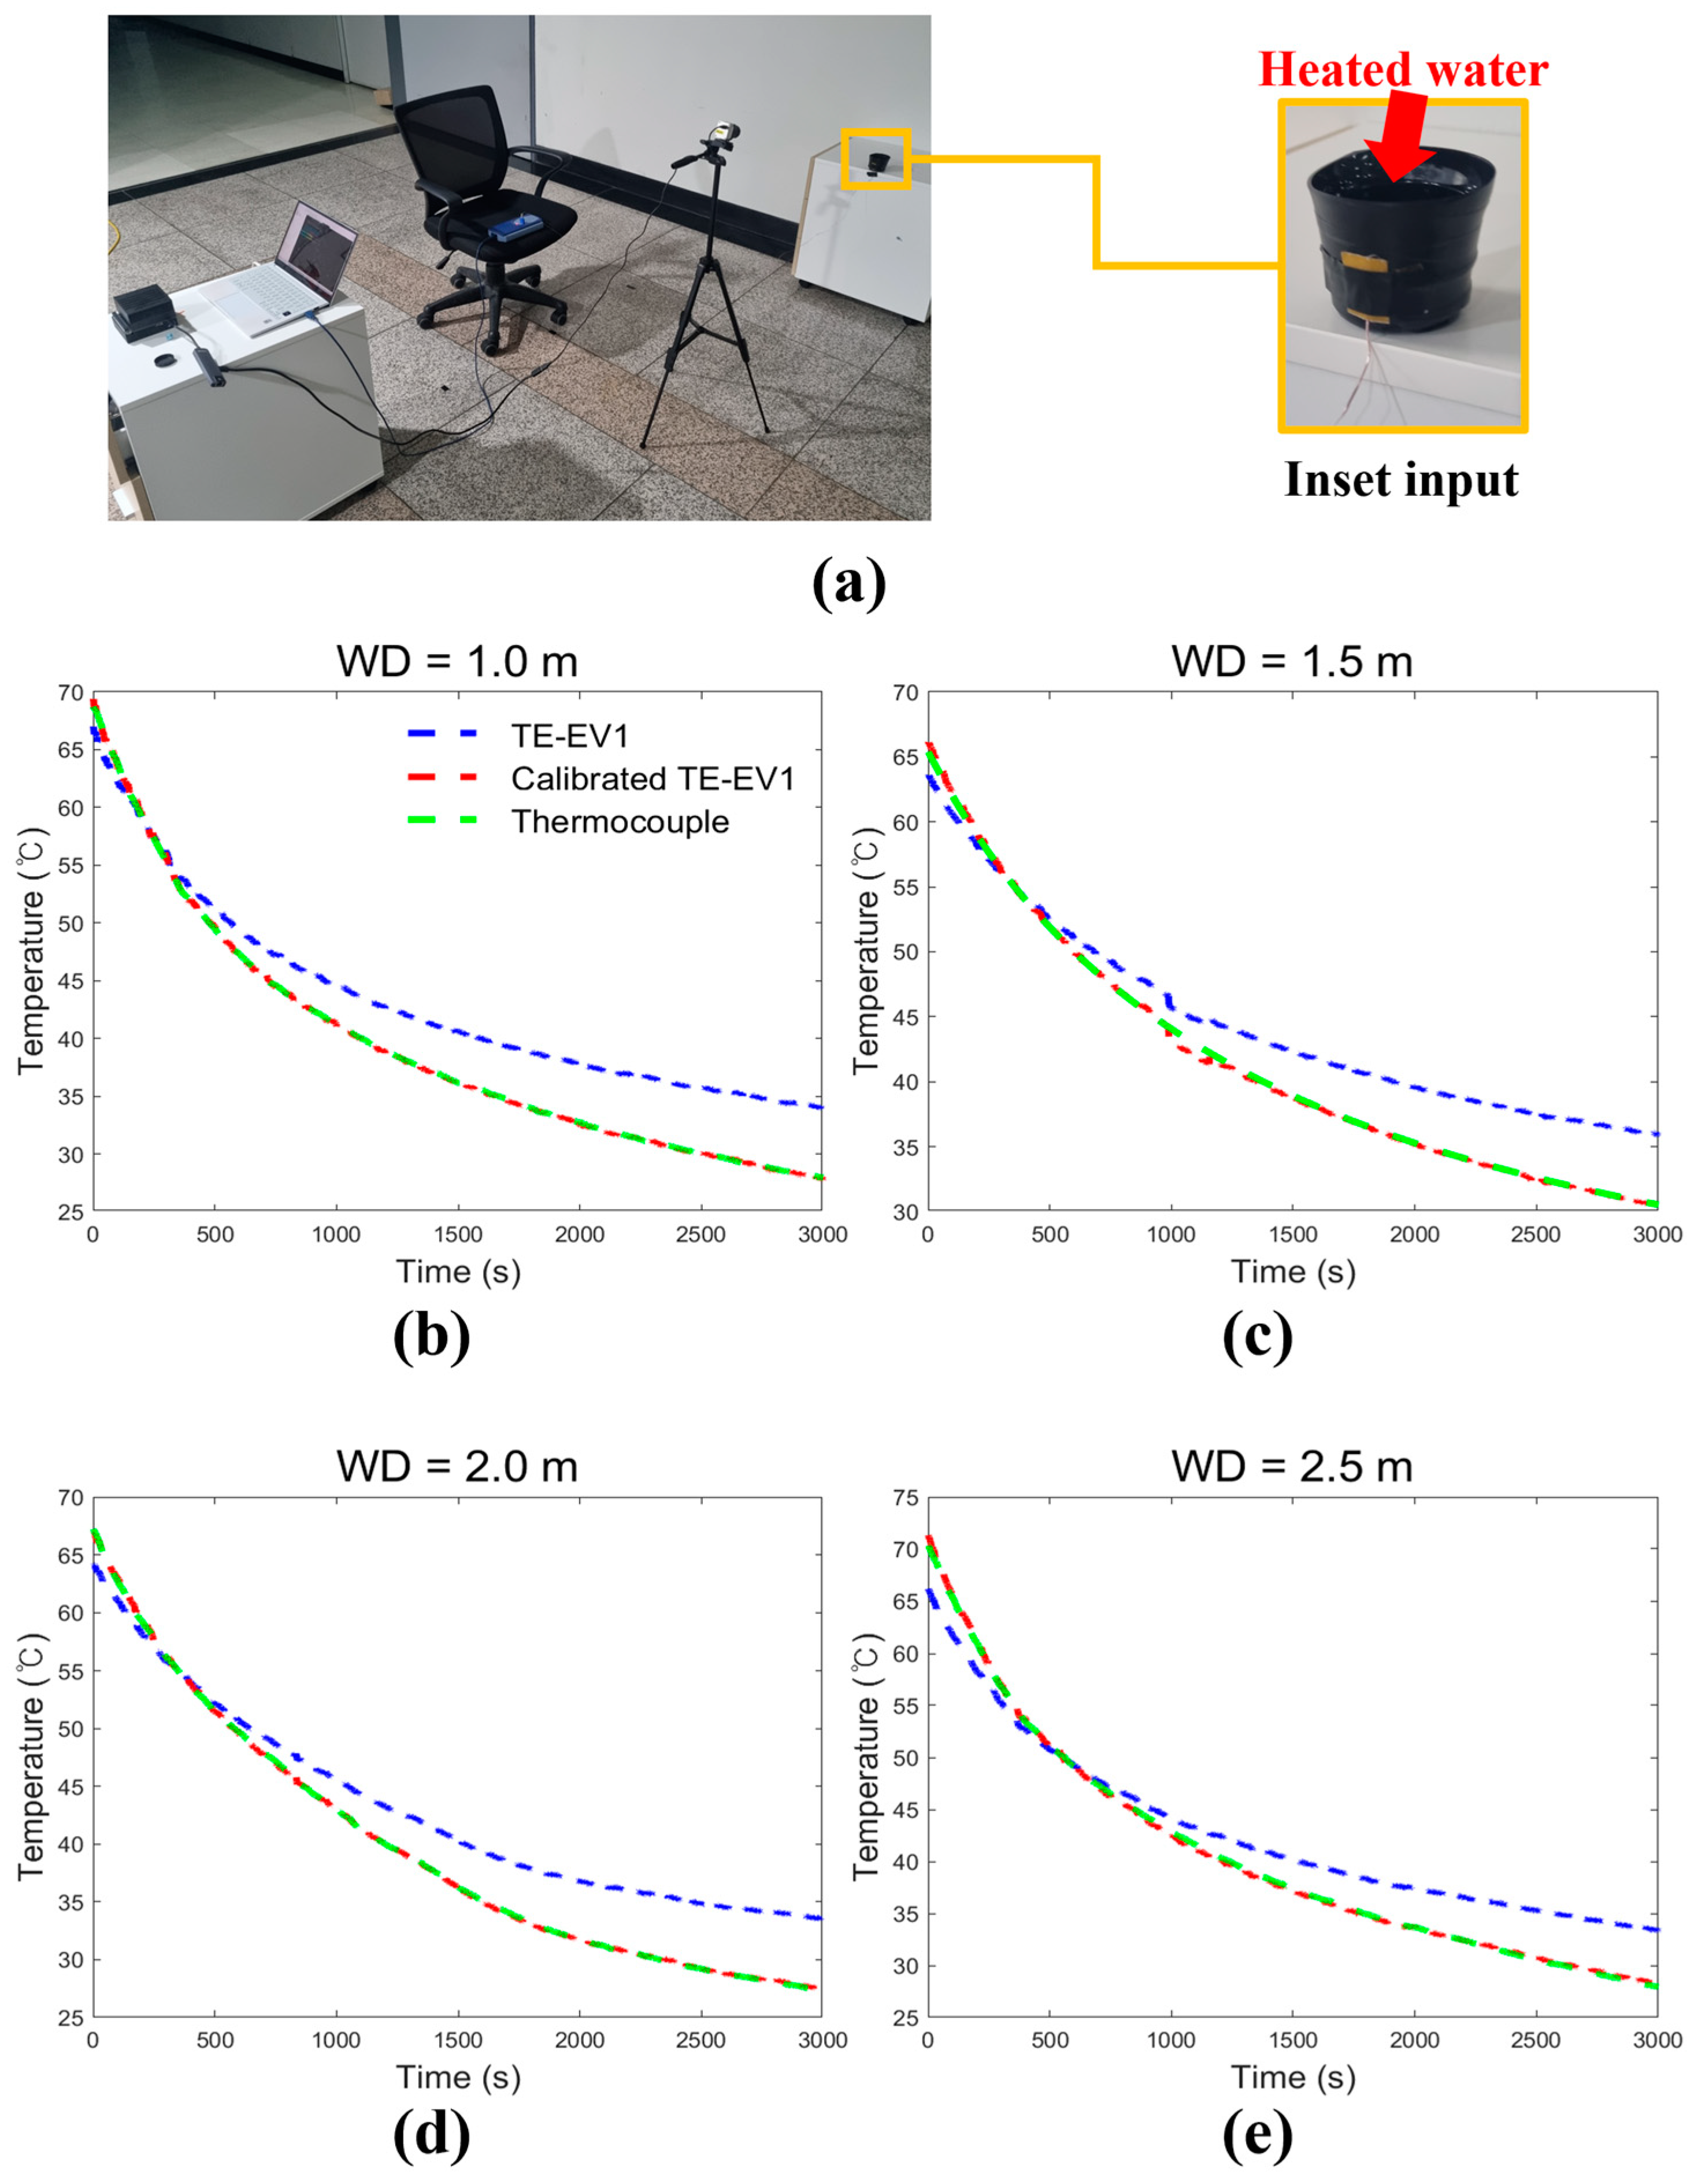
3.1. Calibration of IR Camera

This subsection presents a detailed calibration process for an IR camera to accurately convert thermal energy to the temperature of the UTLCs. Note that the inherent characteristics of an IR camera make it difficult to obtain accurate measurements of the UTLCs. Specifically, an IR camera is a non-contact sensor that measures thermal energy rather than temperature from the radiant wavelength of objects. Hence, the conversion of thermal energy into temperature results in errors when the parameters correlated to the conversion are affected by the environment, including thermal reflection. Hence, the conversion equation from the thermal energy to the representative temperature (Equation (1)) of TE-EV1 should be calibrated to accurately estimate the temperature of the UTLCs and their environments.
Calibration was performed by comparing the temperature estimated from the IR camera with that from the T-type thermocouple (OMEGA, Norwalk, CT, USA) with a cup covered with black insulating tape made of polylactic acid (PVC, orange box in Figure 6a). A cup covered by PVC was used in this experiment to match the emissivity of the surface of the UTLCs because the surface of the UTLCs is covered by an insulator made of PVC (Figure 5e). Note that matching emissivity is important for the accurate calibration of measurements from an IR camera [31]. Experiments were conducted with several working distances (WD) from 1.0 to 2.5 m with 0.5 m intervals between UTLCs and an IR camera under heated water inside a cup at a natural convection condition. Hence, the temperature of the cup filled with water decreased over time because of the thermal convection between the cup and the environment. Measurements with a period of 3000 s were used for calibration.
The coefficients a and b in the first-order polynomial regression are identified as 1.29 and −15.53, respectively, using Equation (2) based on the least square method, minimizing the root mean square errors (RMSEs) between the converted temperature from the IR camera and the temperature measured by the thermocouple (Figure 6b–e). The RMSEs of the calibrated temperature were 0.63, 0.35, 0.20, and 1.07 °C (the red lines in Figure 6) when executing calibration at WDs of 1.0, 1.5, 2.0, and 2.5 m, respectively, whereas the RMSEs of temperature were 4.96, 4.62, 4.17, and 3.55 °C without calibration for the corresponding WDs (the blue lines in Figure 6). The mean RMSE for all cases was reduced from 4.325 to 0.56 °C after calibration, implying that errors in estimating temperature significantly decreased over seven times through the proposed calibration process. These results confirm that the calibrated temperature of an IR camera is accurate for measuring the surface temperature of PVC UTLCs.

3.2. Thermal Diagnosis System

A thermal diagnosis system (TDS) was designed and mounted on a mobile robot (Rover Zero 2, Rover Robotics, Wayzata, MN, USA) for the patrol inspection of UTLCs (Figure 7). This system can also be used to measure sufficient image sets of UTLCs because deep learning approaches require significant images for model construction. The weight reduction of the TDS was a major consideration when designing the TDS because the weight of the payload equipped in the mobile robot significantly affects the operating time (i.e., inspection time). The TDS comprises an IR camera of TE-EV1 (I3systems, Daejeon, Republic of Korea), a 3D Lidar (Velodyne VLP-16, USA), a Jetson Xavier AGX (NVIDIA, Santa Clara, CA, USA), five gas sensors, and a customized gimbal. Specifically, the IR camera was mounted on a customized gimbal printed with polylactic acid using a three-dimensional printer from S5 (Ultimaker, Utrecht, The Netherlands). The FOV of TE-EV1 was 76° and 59.5 ° in the horizontal and vertical directions, respectively, and a vibration isolator with a soft sponge was designed in the gimbal to isolate vibration from the motors and ground during operation (red box in Figure 7). A 3D Lidar was used for the autonomous driving of a mobile robot, and the five gas sensors monitored the air conditions of the UPF. However, detailed descriptions of these sensors are omitted because their measurements were beyond the scope of this study. A Jetson AGX featuring a 512-core Volta graphical processing unit and an octa-core ARM 64-bit central processing unit was also mounted on a customized gimbal printed of carbon fiber to secure high stiffness because the Jetson AGX is heavier than the TE-EV1. The power was supplied by a series of six-cell 18650 Li-ion batteries with 3.7 a of normal voltage and 3500 mAh capacity. The total weight of the TDS was only 2.7 kg, resulting in an operating time of 4 h, ensuring sufficient inspection time.

3.3. Field Experiments

A mobile robot equipped with TDS was used to record thermal images of connectors in UTLCs at 345 kV (Shingwangmyeong-Yeongdeungpo (SY) UPF, Seoul, Republic of Korea). The robot was positioned at the center of the sidewalk in the UPF (Figure 8a), and the thermal images were measured using an IR camera with a resolution of 640 × 480 pixels that faced the UTLCs perpendicularly. The IR camera was panned from side to side to measure the entire connector of the UTLCs because it could not record the thermal images of the connectors of interest in one frame. Note that this limit occurred because of the short distance between the IR camera located on the sidewalk and the connectors, even though the IR camera with the widest FOV was selected and used. Thermal images were measured from five junction boxes (JB) #1 to #5 of two 345 kV UTLCs, SY #1 and SY #2 (the red and blue boxes in Figure 8a), under normal and replicated anomalous conditions (Table 1). Repeated frames of the thermal images were removed from the recorded images because they were not useful for training the proposed neural network. A hot pack was randomly located at one phase of each connector from JB #1 to #5 to replicate anomalous conditions because it is difficult to measure thermal images of anomalous connectors in actual field experiments. Hence, some thermal images measured under normal conditions were used to construct the MS mask DCNN, and several thermal images measured under normal and replicated anomalous conditions were used to test the effectiveness and robustness of the entire framework of the proposed anomaly detection method.
Total thermal images of 6894 were measured from SY #1 to #2. These images were divided into two datasets (DS), DS #1 and #2. DS #1 comprises 644 thermal images recorded from JB #1 and #2 of SY #1 and #2 in two different frames. Images in the first frame included thermal reflection from the supporting structures, whereas those in the second frame minimized thermal reflection from the supporting structures. Note that images from different views can improve the robustness of the trained MS mask DCNN. In contrast, the images of DS #2 were only measured at the frame to minimally locate the metal supporting structures in the recorded thermal images. This frame was selected from the expert system of KEPCO to minimize errors from thermal reflection because the high thermal reflectivity of metal frames distorts the measured thermal images, resulting in inaccurate thermal images. Note that thermal images of metal frames with relatively low emissivity are predominantly influenced by the environment [32]. DS #2 comprises thermal images of 6250 recorded from JB #3 to #5 of SY #1 and #2 to test the proposed anomaly detection method for real-world applications. The total thermal images included 5000 and 1250 normal and replicated abnormal images, respectively (Figure 8b).

3.4. Construction of MS Mask DCNN

This subsection describes the construction of the MS-mask DCNN. Two Tesla V100 (32GB) processing units (GPU) with two Intel Xeon Gold 5220R central processing units (CPUs) were used for training, validation, and testing of the proposed MS mask DCNN with the image sets described in Section 3.3.
Original input images with a resolution of 640 × 480 pixels and downsized images with a resolution of 320 × 240 pixels were prepared to quantitatively analyze the accuracy and inference time of the proposed MS mask DCNN with different scales. All the thermal images were used to construct the ground truth of binary images through the open-source labeling tool, labelimg [33]. Thermal images of DS #1 were separated into thermal images of 386 (60%), 129 (20%), and 129 (20%) for model construction. The proposed architecture was trained with the 3-channel RGB thermal images and masked binary images denoting ground truth through the format of an autoencoder combining four to six scales of encoders and decoders (Figure 4). Notably, combining features extracted from deep and wide neural networks enhances the accuracy and robustness of the model. The larger the scale of the multiscale neural network, the more accurate the estimation, but the greater the inference time, suggesting that trade-offs exist in the construction of neural networks. Therefore, the optimal architecture of the MS mask DCNN was selected by comparing the performances of the MS-mask DCNN with three different scales because both accuracy and inference time are important for real-time applications. Specifically, the encoder comprised 10, 13, and 16 convolutional layers when four, five, and six scaled layers were used, respectively, and the decoder was a symmetrical network corresponding to the encoder. In the encoder, the feature maps were extracted by a factor of 1/2 of the size of the input feature map using the max-pooling layer after the convolutional layers until the number of scale feature maps was generated. In the decoder, convolution layers were used to extract features, and up-sampling layers were then used to increase the size of the feature maps by a factor of two, resulting in prediction maps that were the same as the ground truth feature maps. The convolutional kernel size is chosen to be 3 × 3 and the max-pooling kernel size is chosen to be 2 × 2 to build a deeper network effectively.
A balanced binary cross-entropy loss function was used in the training because this loss function ensures high accuracy of the segmented unbalanced UTLCs [34]. Thermal images with statistical image strengthening were used to decrease the losses between the ground truth of the UTLCs and the prediction of the MS mask DCNN using the Adam optimizer. The hyperparameters of the Adam optimizer were optimized using Bayesian optimization (BO) [35] because BO secures the global minimum with fast convergence compared with other optimization methods, including grid search and genetic algorithms. Note that the scales of the MS mask DCNN were manually changed during training to quantitatively analyze the accuracy and inference time of the proposed neural network from four to six scales, whereas the other hyperparameters were optimized from BO. In addition, the hyperparameters of the Adam optimizer for other mask-based neural networks were optimized using BO for a fair comparison of the performance of the neural networks (Table 2). Hence, this optimization procedure can guarantee the best performance of each neural network, demonstrating the superiority of the proposed method. The training and validation image sets were used to optimize the hyperparameters, whereas the test image sets were used to evaluate the final accuracy and robustness of the proposed method.
A half tensor was employed to test the proposed method to increase the FPS for real-time applications because most deep neural networks do not require a large number of bits during the testing phase in the absence of any vanishing or exploding concerns [36]. In other words, the proposed network employs a float tensor during the training and validation phases, whereas the half-tensor is used to enhance the inference time during the test, suggesting that the efficiency of our approach does not come at the expense of accuracy. The mean intersection over union (MIoU) was used to evaluate the semantic segmentation performance of mask-based neural networks as
M I o U = T P T P + F P + F N ,
where T P , F P , and F N denote the intersection area between ground truth and prediction.

4. Results and Discussion

4.1. Results of Each Phase from the Proposed Integrated Framework

This subsection describes the results from each phase of the proposed method, including statistical image strengthening, segmentation of the UTLC through the MS mask DCNN, and the contour method. This demonstration executes all the procedures with two samples from the test dataset of SY #2 under normal (Figure 9a–e) and abnormal (Figure 9f–j) conditions. Note that training of the MS mask DCNN was executed with the dataset of SY #1; thus, the demonstration of the proposed method should be conducted with different images from the training images.
First, a measured thermal image (Figure 9a,f) was passed through statistical image strengthening, including z-score normalization and BHEPL. This process results in a significant thermal gradient of pixels corresponding to a UTLC and environments in a thermal image using clipped plateaus and statistical limits (Figure 9b,g), enabling the neural network to easily extract features of the UTLC for separating connectors from environments. Notably, this process also effectively eliminates environments when a strong heat source or anomaly exists in the environment or a UTLC exists in a recorded thermal image. The preprocessed thermal images are then passed through the MS mask DCNN, separating the UTLC of interest from the environment as a binary classification (Figure 9c,h) with a predefined threshold of 0.5. However, false segmentations would be included in the predicted result (Figure 9h) because the neural network cannot secure a perfect accuracy of 100% owing to insufficient training datasets. This limitation can be compensated for by employing a simple yet effective image-processing method. Specifically, the contour method eliminates false segmentations of the UTLC (Figure 9d,i) because it effectively detects the corners and edges of the UTLC from the predicted binary information. The proposed framework then selects pixels corresponding to the largest region of the contour representing the UTLC in a thermal image and eliminates other regions, thereby improving the accuracy of semantic segmentation of the UTLC with a low computational cost. Finally, anomalies are detected by comparing the temperature of pixels in the UTLC region with the mean temperature of the UTLC through DBSCAN, resulting in an orange box within the thermal image (Figure 9j). Note that the anomaly is detected by analyzing the temperature of the UTLC using only the corresponding pixels in the refined segmented UTLC. Hence, a strong heat source in the environment was excluded from this process. DBSCAN also effectively removes a small portion of the relatively high temperature due to thermal reflection from metal structures in connectors, such as bolts and nuts (Figure 5e,f), improving the accuracy of anomaly detection.

4.2. Ablation Study for the Proposed Framework

This subsection demonstrates the effectiveness of z-score normalization, BHEPL methods, and MS mask DCNN compared with min-max normalization, other histogram-based image strengthening (HBIS) [37,38,39], and other mask-based DCNNs to extract distinct features of a UTLC from a thermal image (Figure 10). Table 3 lists the MIoUs obtained from three different factors using the SY #2 dataset. The min-max normalization was executed using the minimum and maximum temperatures from each thermal image. “None” in the HBIS methods in Table 3 denotes that an original thermal image was used for separating a UTLC from an environment through mask-based DCNNs.
First, MIoUs obtained with z-score normalization are generally higher than those obtained with min-max normalization, regardless of HBIS and mask-based DCNNs. Specifically, z-score normalization enhances MIoUs from 0.23 to 18.72% under normal conditions and from 1.78 to 63.64% under abnormal conditions compared with those of min-max normalization (bold values in Table 3). This quantitative analysis implies that z-score normalization is more effective than min-max normalization for extracting features of thermal images because a statistical threshold secures high accuracy compared with min-max normalization in this situation. Statistical normalization also ensures high robustness because field measurements include several unexpected anomalies, such as ceiling light and hot spots in UTLCs, that distort the estimated results from the neural network. Similar results have been reported in the literature when using field measurements [40,41], confirming that z-score normalization is effective for inferences from neural networks with field measurements. Note that HBIS methods cannot secure the accuracy of MIoU under abnormal conditions when min-max normalization is used because min-max normalization cannot separate the environments and UTLs effectively in cases in which unexpected anomalies exist, including ceiling lights and hot spots in UTLCs.
Second, the BHEPL method enhances MIoUs when z-score normalization is employed, regardless of the mask-based DCNNS. Specifically, BHEPL enhances the MIoUs from 0.11 to 26.12% under normal conditions and from 0.46 to 29.43% under abnormal conditions compared with those from other HBIS methods. This quantitative analysis implies that the BHEPL is appropriate when z-score normalization is used because the BHEPL emphasizes numerous pixels, including environments and UTLC, with two sub-histograms using the clipped plateau limit. Note that BHEPL effectively preserves the bias of the intensity using two sub-histograms and the level saturation using the clipped plateau limit, thereby strengthening the features of the UTLCs.
Third, the MS mask DCNNs show the highest MIoUs, regardless of the number of latent layers, for both normal and abnormal conditions when the z-score normalization method and BHEPL are addressed. Specifically, the MS mask DCNNs secure high MIoUs of around 90% regardless of the number of latent layers. Quantitatively, the lowest accuracy of the MS mask DCNN is 2% higher than the highest accuracy of other networks. This observation suggests that a multiscale feature extraction module in the MS mask DCNN secures high accuracy because it effectively extracts distinct and semantic features to separate UTLC from the environments in the prediction layers. In contrast, Mask R-CNN requires both segmented mask and bounding box information to calculate the loss, including the classification and regression of masks and bounding boxes, for instance, for segmentation of the images [22]. However, the training dataset of DS #1 may include different environments adjacent to UTLCs, characterized by irregular and diverse shapes and complex thermal gradients in the bounding boxes. These irregular and diverse shapes in the surrounding environment pose challenges for extracting distinct features from thermal images in the Mask R-CNN architecture, resulting in low accuracy. Furthermore, Mask R-CNN shows lower FPS compared with both ResUNet and MS mask DCNN, two semantic segmentation models. Specifically, FPS from Mask R-CNN is 2.8 times lower than ResUNet and 1.8 to 3.8 times lower than MS mask DCNN. The architecture of ResUNet is similar to that of the MS mask DCNN because ResUNet also employs the architecture of the autoencoder. However, MIoUs from ResUNet are lower than those from the MS mask DCNN because the architecture of ResUNet is less effective than that of the MS mask DCNN. Specifically, ResUNet [21] concatenates feature maps from both the encoder and decoder and then estimates the mask at the last layer after passing through several convolution layers, whereas the MS mask DCNN generates multiscale feature maps from the autoencoder and directly estimates the mask of the UTLC. In other words, feature maps extracted from ResUNet faded out when passing through several convolution layers, whereas the MS mask DCNN preserved the semantic information of UTLCs, which were extracted from different scales, resulting in enhanced performances for separating UTLCs from the background. Among the MS mask DCNNs with different numbers of latent layers, the MS mask DCNN (S6) showed the highest accuracy for normal data, whereas the MS mask DCNN (S5) showed the highest accuracy for abnormal data. These results can be explained by the fact that the neural network was trained using the SY #1 dataset, which only included normal data. Therefore, the MS mask DCNN (S6) is overfitted to the normal condition because of its deep architecture. In this study, the MS mask DCNN (S5) is deployed on TDS because it aims to accurately detect anomalies in UTLCs. Note that the FPS of the MS mask DCNN (S5) is also higher than that of the MS mask DCNN (S6), suggesting that the MS mask DCNN (S5) is more effective for field applications.
In summary, a combination of the z-score normalization, BHEPL method, and MS mask DCNN (S5) outperformed min-max normalization, other HBIS methods, and other mask-based DCNNs in terms of both accuracy and robustness. Moreover, the MS mask DCNN (S5) is accurate and fast for deploying this method in TDS.

4.3. Contribution of the Contour Method and Half Tensor

This subsection describes the contribution of the contour method and half tensor to the improvements in MIoU and FPS (Table 4). The MS mask DCNN (S5) is used for this analysis because this architecture shows the best performance, as described in Section 4.2.
The contour method improves the MIoU by 1.9% under normal conditions and the same under abnormal conditions, effectively eliminating false segmentation of UTLCs. Note that the contour method improves the MIoU under normal conditions because it eliminates the false segmentation of UTL, which has a similar temperature distribution as UTLC under normal conditions. In contrast, there is no false segmentation of UTLC in the abnormal condition because anomalies in the UTLC make the intensity of the pixels higher than that in the normal condition (Figure 9b,g), resulting in no error in estimating the segmentation of UTLC. Moreover, the FPS is approximately equivalent to that of anomaly detection when addressing the contour method, leaving out consideration for the contour method. Specifically, the contour method increases the framework slowly from 42.0 to 41.6 FPS, implying that the contour method effectively eliminates falsely segmented UTLCs with low computational cost. Remarkably, the FPS of the proposed framework was significantly enhanced by addressing the half-tensor with the same accuracy. The half tensor reduces the inference time from 41.6 to 62.7 FPS when the contour method is addressed, whereas the MIoUs are the same. This observation suggests that the half tensor can allocate the weights of the trained neural networks with lower GPU resources than the single tensor because the half tensor comprises 1, 5, and 10 bits for the sign, exponent, and fraction, respectively, whereas the single tensor comprises 1, 8, and 23 bits for the sign, exponent, and fraction, respectively. Moreover, inference in the final application does not require large digits of 32 because it is performed by forward propagation, whereas training is performed by back propagation, which might cause gradient vanishing or exploding problems. Therefore, the segmented UTLCs from the proposed framework can be used for anomaly detection by analyzing the corresponding temperature.

4.4. Anomaly Detection

This subsection describes the anomaly detection for single- and multi-phase connectors. The detection performances of anomalies for single and three phases were analyzed with the DS #2 dataset. An anomaly randomly located at the phase of UTLCs was inspected through the proposed framework (Figure 9i) based on the regulations of KEPCO [23]. Specifically, inspection of UTLCs was conducted by analyzing sequential thermal images because detection of anomalies should be considered for both single and three phases.
First, DBSCAN eliminates noise exceeding 2 °C over the mean temperature in segmented pixels of the UTLC because noise from highly reflective objects, including supporting structures, bolts, and nuts, should be eliminated. Note that the number of pixels for noise was less than 10, within a radius of 100 pixels. Hence, noise elimination does not affect the accuracy of anomaly detection in UTLCs. Furthermore, the temperature of each pixel was compared with the mean temperature of the UTLC to detect pixels exceeding 2 °C and 4 °C, which are classified as a caution and an anomaly in the regulation of KEPCO, respectively. Finally, the centers of caution and anomalies were calculated using a thermal image. Hence, the detected anomaly for a single phase is noted with the temperature difference from the mean temperature demonstrated as 9.8 °C in Figure 9j. Remarkably, the proposed framework achieves a precision of 99.25% and a recall of 100% with a correct direction of 6203 from a total of 6250 images, confirming that the proposed framework is effective for real-world applications.
Second, an anomaly was detected for the three phases of the UTLC. Specifically, the maximum temperature of the UTLCs ( T m a x ) was calculated from the measured sequential thermal images for all three phases, excluding the pixels under abnormal conditions because abnormal pixels are used to detect anomalies by comparison with the maximum temperature of each phase of the UTLCs. Furthermore, the maximum temperature of each phase T m a x @ p h a s e was calculated, and the maximum temperature of each phase T m a x @ p h a s e was compared with T m a x to detect anomalies of the UTLCs. Finally, the maximum temperature difference ( Δ T) exceeding 2 °C and 4 °C was classified as a caution and an anomaly, respectively. Note that a hot pack was randomly installed in one of the three phases. Table 5 lists the detected anomalies for the three phases of the UTLCs. For example, the anomaly is detected only in phase B with a Δ T of 9.2 °C at JB #5 because T m a x is 32.7 °C, whereas T m a x A , T m a x B , and T m a x C are 32.6, 41.9, and 32.7 °C, respectively. Similar results were observed for the other JBs. Hence, randomly located abnormal phases of the UTLCs were detected. Future work will include long-term monitoring of UTLCs with the proposed framework by deploying TDS and quantifying the accuracy of the proposed framework for real anomalies occurring at UTLCs.

5. Conclusions

This study proposes an integrated framework for anomaly detection of UTLCs in automatic manner based on three crucial characteristics. First, statistical image strengthening is addressed to improve the performance of segmentation for UTLCs through mask-based CNNs through z-score normalization and BHEPL. Specifically, z-score normalization improves the robustness of feature extraction for UTLCs even if a hot spot exists in the thermal image, and BHEPL improves the accuracy of segmentation to separate UTLCs from environments. Second, semantic segmentation of the MS mask DCNN is employed to detect the UTLC domain from a thermal image. The MS mask DCNN has two key characteristics: a multiscale feature extraction module enables the extraction of distinct features of UTLCs and environments, and the skip layer fusion module concatenates distinct features from the multiscale feature extraction module, effectively separating the ULCs from the environment. Third, anomaly detection based on temperature differences is addressed to improve the accuracy of diagnosis for anomaly detection by the contour method and unsupervised clustering of DBSCAN. Specifically, the contour method is addressed to eliminate the false segmentation of UTLCs by considering the largest domain of UTLCs, and DBSCAN improves the robustness and accuracy of diagnosis by eliminating noise from thermal reflection, which is caused by low-emissivity objects within thermal images. In addition, intensive field tests and ablation studies confirmed the effectiveness of the proposed framework in real-world applications. The simple yet accurate framework proposed would open a new era of automatic inspection for tunnel facilities. The proposed method could also be deployed on mobile robots that inspect for various field applications, including power lines, facilities, military, medicine, and security. Note that it is important to carefully evaluate the specific characteristics and requirements of the target domain when applying the proposed framework. The future work includes validating the robustness and efficiency of the proposed method in UPFs constructed in different environments. Furthermore, efforts should be focused on gathering real anomalous thermal images through long-term monitoring with a mobile robot equipped with an infrared camera to validate the proposed method. Alternative clustering methods will also be explored with other applications.

Author Contributions

Conceptualization, M.-G.K., S.-T.K. and K.-Y.O.; methodology, M.-G.K.; software, S.J. and M.-G.K.; data curation, M.-G.K. and S.J.; validation, S.-T.K. and M.-G.K.; formal analysis, M.-G.K.; investigation, S.-T.K.; resources, S.J.; writing-original draft preparation, M.-G.K.; writing-review and editing, K.-Y.O.; visualization, S.-T.K.; supervision, K.-Y.O.; project administration, K.-Y.O. All authors have read and agreed to the published version of the manuscript.

Funding

This research was supported by the Korea Electric Power Corporation through the KEPCO Research Institute (gran no. R19TA10) and the Research and Development on Fire Safety Technology for ESS Hydrogen Facilities, 20011568, Development of Automatic Extinguishing System for ESS Fire, funded by the National Fire Agency (NFA, Korea) and Korea Institute of Energy Technology Evaluation and Planning (KETEP) grant funded by the Korea government (MOTIE) (20213030020260, Development of Fire detection and protection system for wind turbine).

Data Availability Statement

The datasets generated and analyzed during the current study are not publicly available due they contain confidential national information but are available from the corresponding author on reasonable request.

Conflicts of Interest

The authors declare no conflict of interest.

References

  1. Aras, F.; Alekperov, V.; Can, N.; Kirkici, H. Aging of 154 kV underground power cable insulation under combined thermal and electrical stresses. IEEE Electr. Insul. Mag. 2007, 23, 25–33. [Google Scholar] [CrossRef]
  2. Yang, X.; Choi, M.S.; Lee, S.J.; Ten, C.W.; Lim, S.I. Fault location for underground power cable using distributed parameter approach. IEEE Trans. Power Syst. 2008, 23, 1809–1816. [Google Scholar] [CrossRef]
  3. Bicen, Y. Trend adjusted lifetime monitoring of underground power cable. Electr. Power Syst. Res. 2017, 143, 189–196. [Google Scholar] [CrossRef]
  4. Bascom, E.C.R.; Antonello, V.D. Underground power cable consideration: Alternatives to overhead. In Proceedings of the Conference Minnesota Power Systems, Brooklyn Center, MN, USA, 1–3 November 2011. [Google Scholar]
  5. Shafiq, M.; Kiitam, I.; Taklaja, P.; Kutt, L.; Kauhaniemi, K.; Palu, I. Identification and location of PD defects in medium voltage underground power cables using high frequency current transformer. IEEE Access 2019, 7, 103608–103618. [Google Scholar] [CrossRef]
  6. Densley, J. Ageing mechanisms and diagnostics for power cables—An overview. IEEE Electr. Insul. Mag. 2001, 17, 14–22. [Google Scholar] [CrossRef]
  7. Kaminaga, K.; Ichihara, M.; Jinno, M.; Fujii, O.; Fukunaga, S.; Kobayashi, M. Development of 500-kV XLPE cables and accessories for long-distance underground transmission line V. Long-term performance for 5000-kV XLPE cables and joints. IEEE Trans. Power Deliv. 1996, 11, 1185–1194. [Google Scholar] [CrossRef]
  8. Peter, C.J.M.; der Wielen, V.; Steennis, E.F. On-line PD monitoring system for MV cable connections with weak spot location. In Proceedings of the 2008 IEEE Power and Energy Society General Meeting—Conversion and Delivery of Electrical Energy in the 21st Century, Pittsburgh, PA, USA, 20–24 July 2008. [Google Scholar] [CrossRef]
  9. Sun, X.; Lee, W.K.; Hou, Y.; Pong, P.W.T. Underground power cable detection and inspection technology based on magnetic field sensing at ground surface level. IEEE Trans. Magn. 2014, 50, 6200605. [Google Scholar] [CrossRef]
  10. Kulkarni, S.; Santoso, S.; Thomas, A. Incipient fault location algorithm for underground cables. IEEE Trans. Smart Grid 2014, 5, 1165–1174. [Google Scholar] [CrossRef]
  11. Sidhu, T.S.; Xu, Z. Detection of incipient faults in distribution underground cables. IEEE Trans. Power Deliv. 2010, 25, 1363–1371. [Google Scholar] [CrossRef]
  12. Boggs, S.A. Partial Discharge: Overview and signal generation. IEEE Electr. Insul. Mag. 1990, 6, 33–39. [Google Scholar] [CrossRef]
  13. Satish, L.; Nazneen, B. Wavelet-based denoising of partial discharge signals buried in excessive noise and interference. IEEE Trans. Dielectr. Electr. Insul. 2003, 10, 354–367. [Google Scholar] [CrossRef] [Green Version]
  14. Wu, R.N.; Chang, C.K. The use of partial discharge as an online monitoring system for underground cable joints. IEEE Trans. Power Deliv. 2011, 26, 1585–1591. [Google Scholar] [CrossRef]
  15. Kirsten, V.O.A.; Aghaej, M.; Rüther, R. Aerial infrared thermography for low-cost and fast fault detection in utility-scale PV power plants. Sol. Energy 2020, 211, 721–724. [Google Scholar] [CrossRef]
  16. Alsafasfeh, M.; Abdel-Qader, I.; Bazuin, B.; Alsafasfeh, Q.; Su, W. Unsupervised fault detection and analysis for large photovoltaic systems using drones and machine vision. Energies 2018, 11, 2252. [Google Scholar] [CrossRef] [Green Version]
  17. Jalil, B.; Leone, G.R.; Martinelli, M.; Moroni, D.; Pascali, M.A.; Merton, A. Fault detection in power equipment via an unmanned aerial system using multi modal data. Sensors 2019, 19, 3014. [Google Scholar] [CrossRef] [PubMed] [Green Version]
  18. Jia, Z.; Liu, H.; Zheng, H.; Fan, S.; Liu, Z. An intelligent inspection robot for underground cable trenches based on adaptive 2d-slam. Machines 2022, 10, 1011. [Google Scholar] [CrossRef]
  19. Kim, J.S.; Choi, K.N.; Kang, S.W. Infrared thermal image-based sustainable fault detection for electrical facilities. Sustainability 2020, 13, 557. [Google Scholar] [CrossRef]
  20. Long, J.; Shelhamer, E.; Darrell, T. Fully convolutional networks for semantic segmentation. In Proceedings of the 2015 IEEE Computer Vision and Pattern Recognition (CVPR), Boston, MA, USA, 7–12 June 2015; pp. 3431–3440. [Google Scholar] [CrossRef] [Green Version]
  21. Zhang, Z.; Liu, Q.; Wang, Y. Road extraction by deep residual u-net. IEEE Geosci. Remote Sens. Lett. 2018, 15, 2961–2969. [Google Scholar] [CrossRef] [Green Version]
  22. He, K.; Gkioxari, G.; Dollar, P.; Girshick, R. Mask R-CNN. In Proceedings of the 2017 IEEE International Conference on Computer Vision (ICCV), Venice, Italy, 22–29 October 2017. [Google Scholar] [CrossRef]
  23. KEPCO. Underground Transmission Operation Standards; KEPCO: Naju-si, Republic of Korea, 2016. [Google Scholar]
  24. Ooi, C.H.; Kong, N.S.P.; Ibrahim, H. Bi-histogram equalization with a plateau limit for digital image enhancement. IEEE Trans. Consum. Electron. 2009, 55, 2072–2080. [Google Scholar] [CrossRef]
  25. Zou, Q.; Zhang, Z.; Li, Q.; Qi, X.; Wang, Q.; Wang, S. DeepCrack: Learning hierarchical convolutional features for crack detection. IEEE Trans. Image Process. 2018, 28, 1498–1512. [Google Scholar] [CrossRef]
  26. Nair, V.; Hinton, G.E. Rectified linear units improve restricted Boltzmann machines. In Proceedings of the 27th International Conference on International Conference on Machine Learning, Haifa, Israel, 21–24 June 2010. [Google Scholar]
  27. Noh, H.; Hong, S.H.; Han, B.Y. Learning deconvolution network for semantic segmentation. In Proceedings of the 2015 IEEE International Conference Computer Vision (ICCV), Santiago, Chile, 17 May 2015. [Google Scholar] [CrossRef] [Green Version]
  28. Henke, S.; Karstadt, D.; Mollmann, K.P.; Pinno, F.; Volmmer, M. Identification and suppression of thermal reflection in infrared thermal imaging. InfraMation 2004, 5, 287–298. [Google Scholar]
  29. Suuzuki, S.; Be, K. Topological structural analysis of digitized binary images by border following. Comput. Vis. Graph. Image Process. 1985, 30, 32–46. [Google Scholar] [CrossRef]
  30. Ester, M.; Kriegel, H.P.; Sander, J.; Xu, X. A density-based algorithm for discovering clusters in large spatial databases with noise. In Proceedings of the Second International Conference on Knowledge Discovery and Data Mining, Portland, OR, USA, 2–4 August 1996; pp. 226–231. [Google Scholar]
  31. Bernard, V.; Staffa, E.; Mornstein, V.; Bourek, A. Infrared camera assessment of skin surface temperature-effect of emissivity. Phys. Medica 2013, 29, 583–591. [Google Scholar] [CrossRef] [PubMed] [Green Version]
  32. Barreira, E.; Almeida, R.M.S.F.; Simões, M.L. Emissivity of building materials for infrared measurements. Sensors 2021, 21, 1961. [Google Scholar] [CrossRef] [PubMed]
  33. Russell, B.C.; Torralba, A.; Murphy, K.P.; Freeman, W.T. LabelMe: A Database and web-based tool for image annotation. Int. J. Comput. Vis. 2008, 77, 157–173. [Google Scholar] [CrossRef]
  34. Jardon, S. A survey of loss functions for semantic segmentation. In Proceedings of the 2020 IEEE Conference on Computational Intelligence in Bioinformatics and Computational Biology (CIBCB), Via del Mar, Chile, 27–29 October 2020. [Google Scholar] [CrossRef]
  35. Frazier, P.I. A tutorial on Bayesian optimization. arXiv 2018, arXiv:1807.02811. [Google Scholar] [CrossRef]
  36. Micikevicius, P.; Narang, S.; Alben, J.; Diamos, G.; Elsen, E.; Garcia, D.; Ginsburg, B.; Houston, M.; Kuchaiev, O.; Venkatesh, G.; et al. Mixed precision training. arXiv 2018, arXiv:1710.03740. [Google Scholar] [CrossRef]
  37. Kim, Y.T. Contrast enhancement using brightness preserving bi—Histogram equalization. IEEE Trans Consum. Electron. 1997, 43, 1–8. [Google Scholar] [CrossRef]
  38. Chen, S.D.; Ramli, A.R. Contrast enhancement using recursive mean-sperate histogram equalization for scalable brightness preservation. IEEE Trans Consum. Electron. 2003, 49, 1301–1309. [Google Scholar] [CrossRef]
  39. Chen, S.D.; Ramli, A.R. Minimum mean brightness error bi-histogram equalization in contrast enhancement. IEEE Trans Consum. Electron. 2003, 49, 1310–1319. [Google Scholar] [CrossRef]
  40. Fei, N.; Gao, Y.; Lu, Z.; Xiang, T. Z-score normalization, hubness, and few-shot learning. In Proceedings of the 2021 IEEE/CVF International Conference on Computer Vision (ICCV), Montreal, QC, Canada, 10–17 October 2021. [Google Scholar] [CrossRef]
  41. Singh, D.; Singh, B. Feature wise normalization: An effective way of normalizing data. Pattern Recognit. 2022, 122, 108307. [Google Scholar] [CrossRef]
Figure 1. The proposed framework for anomaly detection of underground transmission-line connectors (UTLCs).
Mathematics 11 03143 g001
Figure 2. Resulting images of each process in phase A: (a) original thermal image and (b) its histogram; (c) z-score normalized thermal image and (d) its histogram; (e) BHEPL enhanced thermal image with z-score normalization and (f) its histogram.
Mathematics 11 03143 g002
Figure 3. A flow chart of image strengthening through bi-histogram with a plateau limit (BHEPL).
Mathematics 11 03143 g003
Figure 4. Architecture of the proposed multiscale mask deep convolutional neural network (MS mask DCNN).
Mathematics 11 03143 g004
Figure 5. A binary image (a) through MS mask DCNN and (b) refined by the contour method from a thermal image; temperature distribution of a connector passing through the refined filter (c) without and (d) with thermal reflection; (e,f) an optical image of a connector, where the red box denotes bolts and nuts resulting in thermal reflection.
Mathematics 11 03143 g005
Figure 6. Experimental (a) setup and (be) results for calibration of an IR camera.
Mathematics 11 03143 g006
Figure 7. Hardware configuration of the thermal diagnosis mobile robot.
Mathematics 11 03143 g007
Figure 8. (a) Configuration of UPF for image acquisition from SY UPF and (b) detailed construction of a dataset for MS mask DCNN and an integrated framework.
Mathematics 11 03143 g008
Figure 9. Results of the proposed integrated framework for underground transmission connectors under (ae) normal; (fj) replicated anomaly conditions.
Mathematics 11 03143 g009
Figure 10. (a) A measured thermal image and strengthened image for an underground transmission connector using (b) HE; (c) BBHE; (d) RMSHE; (e) MMBEBHE; (f) BHEPL.
Mathematics 11 03143 g010
Table 1. Detailed information on the acquired thermal images.
Dataset #UTLC #JB #Images-Sets
NormalAbnormal
DS #1SY #11–2515-
DS #1SY #21–29732
DS #2SY #13–52500625
DS #2SY #23–52500625
Table 2. Initial ranges and optimal hyperparameters of the mask-based CNNs with Z-score normalization and BHEPL image strengthening.
Initial Ranges of the Hyperparameters
NetworksHyperparameters
Batch SizeLearning RateFirst MomentumSecond MomentumWeight DecayEpsilon
All4–20
w/2 interval
1 × 10⁻⁶
−1 × 10⁻⁴
0.9–0.9990.9–0.9990.01
–0.3
1 × 10⁻⁸
−1 × 10⁻⁶
Optimized Hyperparameters
NetworksHyperparameters
Batch SizeLearning RateFirst MomentumSecond MomentumWeight DecayEpsilon
Mask R-CNN12 9.41 × 10 5 0.9290.9580.129 2.41 × 10 8
ResUNet20 9.63 × 10 5 0.9550.9850.143 5.80 × 10 7
MS mask DCNN (s4)18 5.74 × 10 5 0.9230.9510.113 9.69 × 10 6
MS mask DCNN (s5)20 2.67 × 10 5 0.9440.9830.017 2.42 × 10 6
MS mask DCNN (s6)4 5.21 × 10 5 0.9590.9610.269 5.27 × 10 8
Table 3. Comparative analysis of MIoU with the dataset of DS #1 @ SY #2.
MIoU (%) @ Normal Data
Mask-Based CNNsNormalizationHistogram-Based Image StrengtheningFPS
NoneHEBBHERMSHEMMBEBHEBHEPL (Proposed)
Mask R-CNNMin-Max68.4574.8077.6676.7078.0481.9216.4
Z-score82.6977.8279.1579.9478.4284.42
ResUNetMin-Max79.3777.9082.4082.1581.4086.3444.2
Z-score82.1882.8984.1485.8686.8187.43
MS mask DCNN (s4)Min-Max70.8685.5385.6378.4676.5070.8563.1
Z-score63.4585.7789.1187.9684.3489.57
MS mask DCNN (s5)Min-Max87.1680.6481.6585.2682.8888.6546.7
Z-score90.4886.0284.6788.0083.1990.59
MS mask DCNN (s6)Min-Max88.1887.0887.5983.0883.0290.7830.0
Z-score89.2789.2589.4187.1989.6690.95
MIoU (%) @ Anomaly Data
Mask R-CNNMin-Max27.1374.9364.5618.7949.0024.6216.4
Z-score73.4677.2277.1979.4378.7480.38
ResUNetMin-Max25.9877.9040.0417.2248.7245.9344.2
Z-score77.5084.0683.7280.8685.2486.95
MS mask DCNN (s4)Min-Max32.9775.9764.5230.3860.8743.3563.1
Z-score62.1487.5282.0083.8186.4391.57
MS mask DCNN (s5)Min-Max68.9380.1279.0271.6270.1660.6246.7
Z-score70.7188.7187.0280.7182.5892.92
MS mask DCNN (s6)Min-Max76.8187.4475.0358.8071.9474.4930.0
Z-score82.6891.4085.0371.7890.3391.86
Table 4. Contribution of the contour method and half tensor on the accuracy and inference time of the proposed framework.
DatasetData Typew/o the Contour Methodw/the Contour Method
MIoU (%)FPSMIoU (%)FPS
NormalSingle tensor90.5942.092.4941.6
NormalHalf tensor90.6064.492.4962.7
AbnormalSingle tensor92.9234.692.9234.0
AbnormalHalf tensor92.9248.292.9247.5
Table 5. Detected anomalies from three-phases of UTLCs at the dataset of DS #2.
UTLC #JB # T m a x (°C) * T m a x A (°C) ** T m a x B (°C) ** T m a x C (°C) ** Δ T (°C) *** Anomaly Phase #
SY #1# 332.632.641.332.78.7B
# 432.743.332.932.610.6A
# 531.731.931.943.111.5C
SY #2# 331.631.641.131.49.5B
# 432.545.032.531.912.6A
# 532.732.641.932.79.2B
* T m a x : mean temperature of the maximum temperature in the UTLCs for three phases, excluding pixels under abnormal conditions. ** T m a x @ : maximum temperature of each phase. *** Δ T : maximum temperature difference between T m a x   a n d   T m a x @ .
Disclaimer/Publisher’s Note: The statements, opinions and data contained in all publications are solely those of the individual author(s) and contributor(s) and not of MDPI and/or the editor(s). MDPI and/or the editor(s) disclaim responsibility for any injury to people or property resulting from any ideas, methods, instructions or products referred to in the content.

