1. Introduction
Nowadays, the use of computer simulation to develop new materials has become a widespread practice. From the point of view of the visual perception of the material, it is important to model the interaction of light with it. Many modern materials are dispersed media, i.e., they consist of optically contrasting particles distributed in the volume of a transparent substance. Such media are used in modern light sources (diffusers in flat sources, luminous linear sources and devices in car interior), and they are also the basis of modern paints, auto glass, plastics, and inks for 3D printers.
Visual appearance is the main characteristic of paint and it manifests itself through the human perception of objective optical properties, such as color, brightness (reflection coefficient), glossiness, texture (spatial heterogeneity), etc. Hence, simulation and visualization of optically complex materials, such as multilayer paints with a complex microstructure (like pearlescent and metallic paints) in the automotive industry, have been developed in recent years. Advanced software allows one to simulate light propagation through a paint composed of clear varnish with pigment particles and flakes (metallic or interference ones) dispersed in it. The color of these paints depends on the observation and illumination directions. Therefore, its visual appearance should be described by a bidirectional reflectance distribution function (BRDF). The primary task is to calculate how the paint with given composition looks under given illumination and observation directions [
1].
We consider two main approaches of calculating light scattering in dispersed media. The first one is based on the continuous medium model [
2]. In this model, any infinitesimal volume scatters light proportionally to that volume. This model leads to the differential light transport equation (LTE) (or Radiative Transfer Equation in [
2]). There are several methods within this approach. For example, deterministic methods, the method of discrete ordinates [
3], finite difference, and matrix methods like doubling/adding [
4]. Additionally, it can be solved via stochastic (Monte Carlo) integration. The continuous medium approximation (i.e., LTE) works pretty well for atmosphere for which it was originally created. Presently, it is quite popular and widely applied to a wide class of turbid media. However, this approach becomes inaccurate when the pigment particles are large or are packed densely in the paint.
The second approach is the simulation of light propagation through an ensemble of paint flakes and particles represented as an explicit geometry. Here, we can solve it by using the Monte Carlo ray tracing (MCRT) [
5]. It is possible to either create a huge sample geometry that includes billions of randomly distributed particles or use many random samples of a rather small piece of paint geometry (corresponding to small area of paint layer) and average over them. This approach is straightforward but rather resource and time consuming. However, it does provide accurate solution, and thus we call it the “accurate approach”.
Comparing the measurements of real paint samples with simulation, we found that for effect pigments (e.g., metallic flakes), the LTE solution cannot correctly predict the total integral reflectance [
6]. Moreover, the measured BRDFs, while generally running more or less closely to the simulated ones, show a strong deviation for nearly normal incidence and observation. The LTE seriously underestimates it, while ray tracing through an ensemble of flakes gives a more accurate result. This is a major problem for the simulation of automotive metallic and pearlescent paints that must look bright. Thus, investigating the reasons of this problem and development of a possible numerical solution is the main motivation of our research.
Our study shows that this effect is due to the correlations between close incident and scattered rays and not the correlations between particles. The mathematical method was borrowed from a thought experiment of perfectly aligned flakes. We consider a ray that goes down to some depth where it is reflected upward by the flake and leaves the layer. We calculate the probability of this event and thus obtain the attenuation (extinction) of the light. It does not follow the usual exponential attenuation in a continuous medium, i.e., it is an anomalous extinction. It is not the one found in the studies of correlated particles. Having the probability of such light path, we calculate the statistical properties of the single scattered light. Then, we take the LTE results as the sum of the scattering orders and replace the first of them with the one given above, leaving the higher orders unchanged. It provides a very good approximation to the results of the accurate model. This allows to obtain near-accurate results much faster than the Monte Carlo ray tracing and without its noise. Additionally, the correction term is almost an analytic function that allows to understand the role and effect of various paint parameters and predict some nontrivial effects. It also predicted that the BRDF could deviate greatly (up to twofold) from the LTE results, even for tiny particles, in the case of near-normal illumination and observation. That is, there is no simple good convergence to the LTE results when the particle size approaches 0.
Initially, these ideas had been applied to the simplified case when all flakes have equal size and are opaque [
7]. However, in reality, flakes vary in size and are not always opaque; for example, mica flakes are semi-translucent. This paper aims to remove these limitations and thus considers a general case.
Continuous medium approximation works with the product “area times concentration” and thus do not use the flake size separately. It means that for this approximation, the mean surface luminance is exactly the same for particles n-times larger area in n-times lower concentration. In this paper, we investigated the dependence of the painted surface luminance (BRDF) on the flake size. We compared LTE with a more reliable and accurate (yet expensive) simulation. This simulation is MCRT in the explicit paint geometry that contains an ensemble of individual flakes, instead of replacing their scattering with the phase function of the continuous medium.
The main contribution of this paper is that it proves that the effect of coarse particles can emerge even in a model where positions of these particles are not correlated. This is different from the mainstream studies which have only concentrated on the role of these correlations to describe the effect of coarse particles. Moreover, we suggest a semi-analytical model of dependence based on particle size which not only allows to calculate a more accurate BRDF but also admits an intuitive comprehension of how various parameters of medium affect the BRDF. In case of the divergence in results of LTE and accurate approaches, we propose a simple approximation that allows to improve the accuracy of the LTE results for coarse particles.
The remainder of the paper is organized as follows.
Section 2 describes related studies. The proposed method is introduced in
Section 3.
Section 4 presents the results calculated using the proposed method and their comparison with other methods. In
Section 5, discussion and conclusions are stated.
2. Related Works
Many studies are devoted to the simulation of paints or 3D printer inks as disperse media. Simulated BRDF of paint layer is then used for visualization of a virtual car. Some works propose the paint models and try to realistically visualize the paint appearance based on the paint composition. An approximate model for predicting the car paint appearance by the paint composition is presented in the paper [
8]. Therein, authors proposed to use a modified version of the micro-flake model based on double-sided specularly reflecting flakes. Their model provides visually satisfactory results in the appearance of multilayer automotive paint, if one is to ignore sparkling. Accurate representation of the reflectivity of metallic paint using a two-layer model with sample distribution functions of microfacets was proposed in [
9]. This model provides better accuracy due to the use of the nonparametric terms and allows the analysis of the characteristics of metal particles using the analytical form built into the model.
Texture is proposed to model sparkling effect. The sparkling texture is usually calculated by modulating the BRDF with random field whose statistical characteristics are taken from light interaction with an ensemble of individual particles [
1,
10]. This is inevitable because continuous medium (i.e., LTE) cannot have a texture. Several approaches for obtaining the spatial variation of the luminance are considered in [
11]. The basic approach based on a bidirectional texture function is compared with four variants of half-difference parametrization. With the help of a psychophysical study, the authors concluded that bivariate representations better preserve the visual accuracy of effect coatings.
Several works are devoted to paint rendering. Some of them operated with measured data either combined with analytical solution [
12] or postprocessed to archive effective and realistic rendering of real car paint [
13]. An interactive interpolation between measured metal paints for cars was presented in [
14]. It can be used to create new realistic-looking metallic paint. The authors consider optimal transfer between types of metallic paints by clustering the color information presented in the measured bidirectional texture function responsible for the sparkling effect. The work in [
15] describes the methodology of metallic paint visualization based on the measured data. The authors matched the measured spectral reflectivity of several paint samples to the BRDF analytical model to obtain its parameters. To achieve the sparkling effects, several images of the surface were taken at different light incidence.
There are many works that investigate propagation of light in a medium where positions of particles are correlated [
16,
17,
18,
19]. The authors have proven that the extinction of light beam is no longer exponential, as it would be for the classic case. Although there are sophisticated mathematical models to handle this effect, its base idea is rather intuitive and is illustrated in Figure 1 of [
17], which explained it so perfectly that it was re-used in [
18]. The basic LTE is then replaced by a sort of generalized equation of similar type, termed “Generalized Boltzmann Equation” [
18]. Indeed, there is some similarity with the classic Boltzmann equation, at least in the integral (scattering) term. It still has the same structure as the classic LTE: a sort of convolution of the local angular intensity with the phase function. The latter is still treated as usual in the classic continuous medium approximation, i.e., it is the phase function of an isolated particle scaled to the local density. Investigation into ensembles of correlated particles is advanced in [
19]. Its authors finalize their work using the numerical method of calculation of light propagation (and scattering) based on MCRT. A slightly different method of calculation of light propagation in correlated medium and resulting “anomalous extinction” can be found in [
20].
While the studies [
16,
17,
18,
19,
20] operate ray optics, there are investigations proceeding from the wave theory of light. The first thing which this is aimed at is the interference between particles. Indeed, the LTE (and even its above generalizations) requires phase function of medium, i.e., scattering by the elementary volume
. It can contain many particles at close distance and inevitably diffraction of light by this group is different from the sum over isolated, not interacting with particles. While the phase function of medium is usually assumed proportional to the scattering of an isolated particle, it would be more accurate to compute it as a diffraction of light by the group of particles within
. Here, it is silently assumed that the result converges as we increase
. Such an approach is pursued in [
21], wherein only the multiple body diffraction problem (scattering by many close particles) is calculated.
In [
22,
23,
24], the radiative transfer problem is considered for particle agglomeration and dependent scattering. Calculations are performed for very close, particles with refraction close to the bounding medium one. The Percus–Yevick approximation is used in these works to obtain the local concentration and the rule of its change from the cluster center. Then, in [
22,
23], the authors calculate scattering of the wave field by this group of particles, which is effectively a piece of inhomogeneous medium with correlated variation of refraction index. This scattering gives the local phase function of the elementary volume of the medium. However, this approach still remains a hybrid of wave optics (used to compute phase function of small volume) and ray optics to handle the change of illumination by large and meso scale.
An ultimate wave optics approach would use wave optics consistently at all space scales. Additionally, an attempt of such a treatment is made in [
25]. Roughly, the method of calculation of [
25] is the development and extension of the single-scattering method from statistical electrodynamics [
26] where we use the Born approximation of the wave equation, i.e., a homogeneous medium with volumetric source being incident wave field times the deviation of the squared local refraction from its mean value
. Scattered wave field is then naturally linear in that deviation. Intensity of light is squared field averaged over the random distribution of refraction. It results in the local intensity of scattered light proportional to the spatial correlation function of refraction. Whilst the above is the first approximation, one can try to go further and improve the volumetric source by including the scattered field in it. Continuing successive approximation, we obtain the scattered field as the sum of an infinite series whose terms are local Green resolvents of homogeneous medium. This procedure is somewhat similar to the operator series of solution of the global illumination equation in ray optics [
27].
The authors of [
25] take the base wave equation in a stochastically inhomogeneous medium and then write its solution through the propagators of wave field. The authors investigate in detail the extreme cases of long and short wave limits. For long waves, the role of short-scale spatial variations decreases (cf. Rayleigh law) and eventually light propagates like in a homogeneous medium with effective refraction index derived from formulae [
25]. The effective medium is similar to the Bruggemann formula for a molecular-level mixture of several substances. For short wave limit, they naturally approach the ray optics. Their transport equation converges to a sort of generalized LTE.
A similar approach can be found in [
28]. Higher orders of scattering (scattering of scattered field) are calculated as iteration of the integral operator. The scattering operator includes the spatial correlation of the squared refraction index (= dielectric permittivity), so it also enters the higher order scattering terms.
3. Methods
There are two main approaches for calculation of scattering in paint layer. The first is the continuous medium approach. Roughly speaking, this means that a ray never hits the same flake even when it is reflected exactly backwards. In other words, scattering of two adjacent rays is statistically independent: when a ray hits a flake, the ray shifted by just a bit may miss it. The most famous method of practical calculations in this situation is the light transport equation (LTE). It can be solved via MCRT in the continuous medium when successive scattering or absorption events are independent. Such behavior takes place in the case of infinitesimal flakes (gas mode) or to be precise, in case when the vertical separation of flakes is much greater than their diameter.
When the flakes are large or are packed densely with large concentration, this assumption is violated and calculations deviate from the real flake ensemble properties. Thus, we need the second approach to calculate light interaction here. Nonetheless, MCRT still can be used but now the ray goes in an empty space populated with some individual flakes that do not overlap. If these flakes are large enough then a ray might hit the same flake several times. Since this is the same flake, the corresponding scattering events are correlated.
Below we shall compare the LTE and the accurate approaches.
3.1. Full BRDF as a Sum of BRDF Orders
To calculate paint visual appearance expressed via BRDF, we can use ray tracing which leads to the following expansion of the full BRDF:
where
corresponds to BRDF created by ray paths with
flake hits. It is called the
-th order of BRDF. The order equals the number of ray scattering (the changes of ray direction), so only reflections are counted but the specular transmissions that do not change ray direction and only attenuate it are not counted (
Figure 1). In a sense, our BRDF orders are similar to the scattering orders in [
28].
To be precise, any ray that contributes to the BRDF must penetrate the top Fresnel boundary twice, entering the paint layer and then leaving it. Thus, formally the minimal count of ray scattering events is 2, not 0, and BRDF components should be numbered as , ,… We, however, do not count these two constant events in the orders.
Every BRDF order is an average over all the ray paths of the corresponding type. For
, this means that the ray transmits Fresnel boundary and enters the paint layer, then descends until it hits a flake. After that, it is reflected by that flake and ascends to the top boundary but not intersecting any flake. Finally, it transmits through the Fresnel boundary and leaves the paint layer (
Figure 1a).
Generally, different flakes can be slightly correlated. If the flakes are well aligned and there are no forces between them, then we can neglect correlations between flakes at different depths. As a result, the flake hit event is rather independent from the obscure event (if another flake intersects the incident or reflected rays). Therefore
where
are direction of the refracted incident and observation rays
and
, respectively,
is Fresnel transmittance of the binder-air boundary,
is the product attenuation along both ray segments and
is the first-order BRDF of the sublayer of thickness
at depth
. It is independent from
in case of a homogeneous paint. We do not use its explicit form which is the same for both LTE and accurate approach (derivation is in [
1]).
By definition, attenuation
is the average probability that the given fixed full path (along
down to
then upwards along
) over all possible geometries of the flake ensemble which we can write as
where
is the probability that the given one ray goes from the surface to the depth
(or vice versa). The first term is for the incident ray, and the second is for the reflected one.
In the continuous medium approximation, it is assumed that the fates of these two rays are statistically independent, and therefore
Meanwhile calculation of the mean probability of ray transmitting the paint layer is simple and leads to
(regardless of direction), and therefore
where
is the flake transmittance,
is the mean flake’s area and
is the total concentration of flakes as their number in unit paint volume:
where PVC is the pigment volume concentration and
is flake thickness. This value determines BRDF of paint with thin planar flakes.
The formula (3) of attenuation for a single ray is very general and correct. It is true for both continuous medium approximation and ray tracing individual flakes of finite size. However, (4) is not accurate because it assumes statistical independence of the fates of the incident and reflected rays. Meanwhile, in reality they are correlated, and below we shall calculate how this affects attenuation and demonstrate large deviation from (4).
3.2. Combined Attenuation along Both Rays
Let the flakes be opaque thin disks of radius
aligned horizontally or with small inclination the horizontal plane.
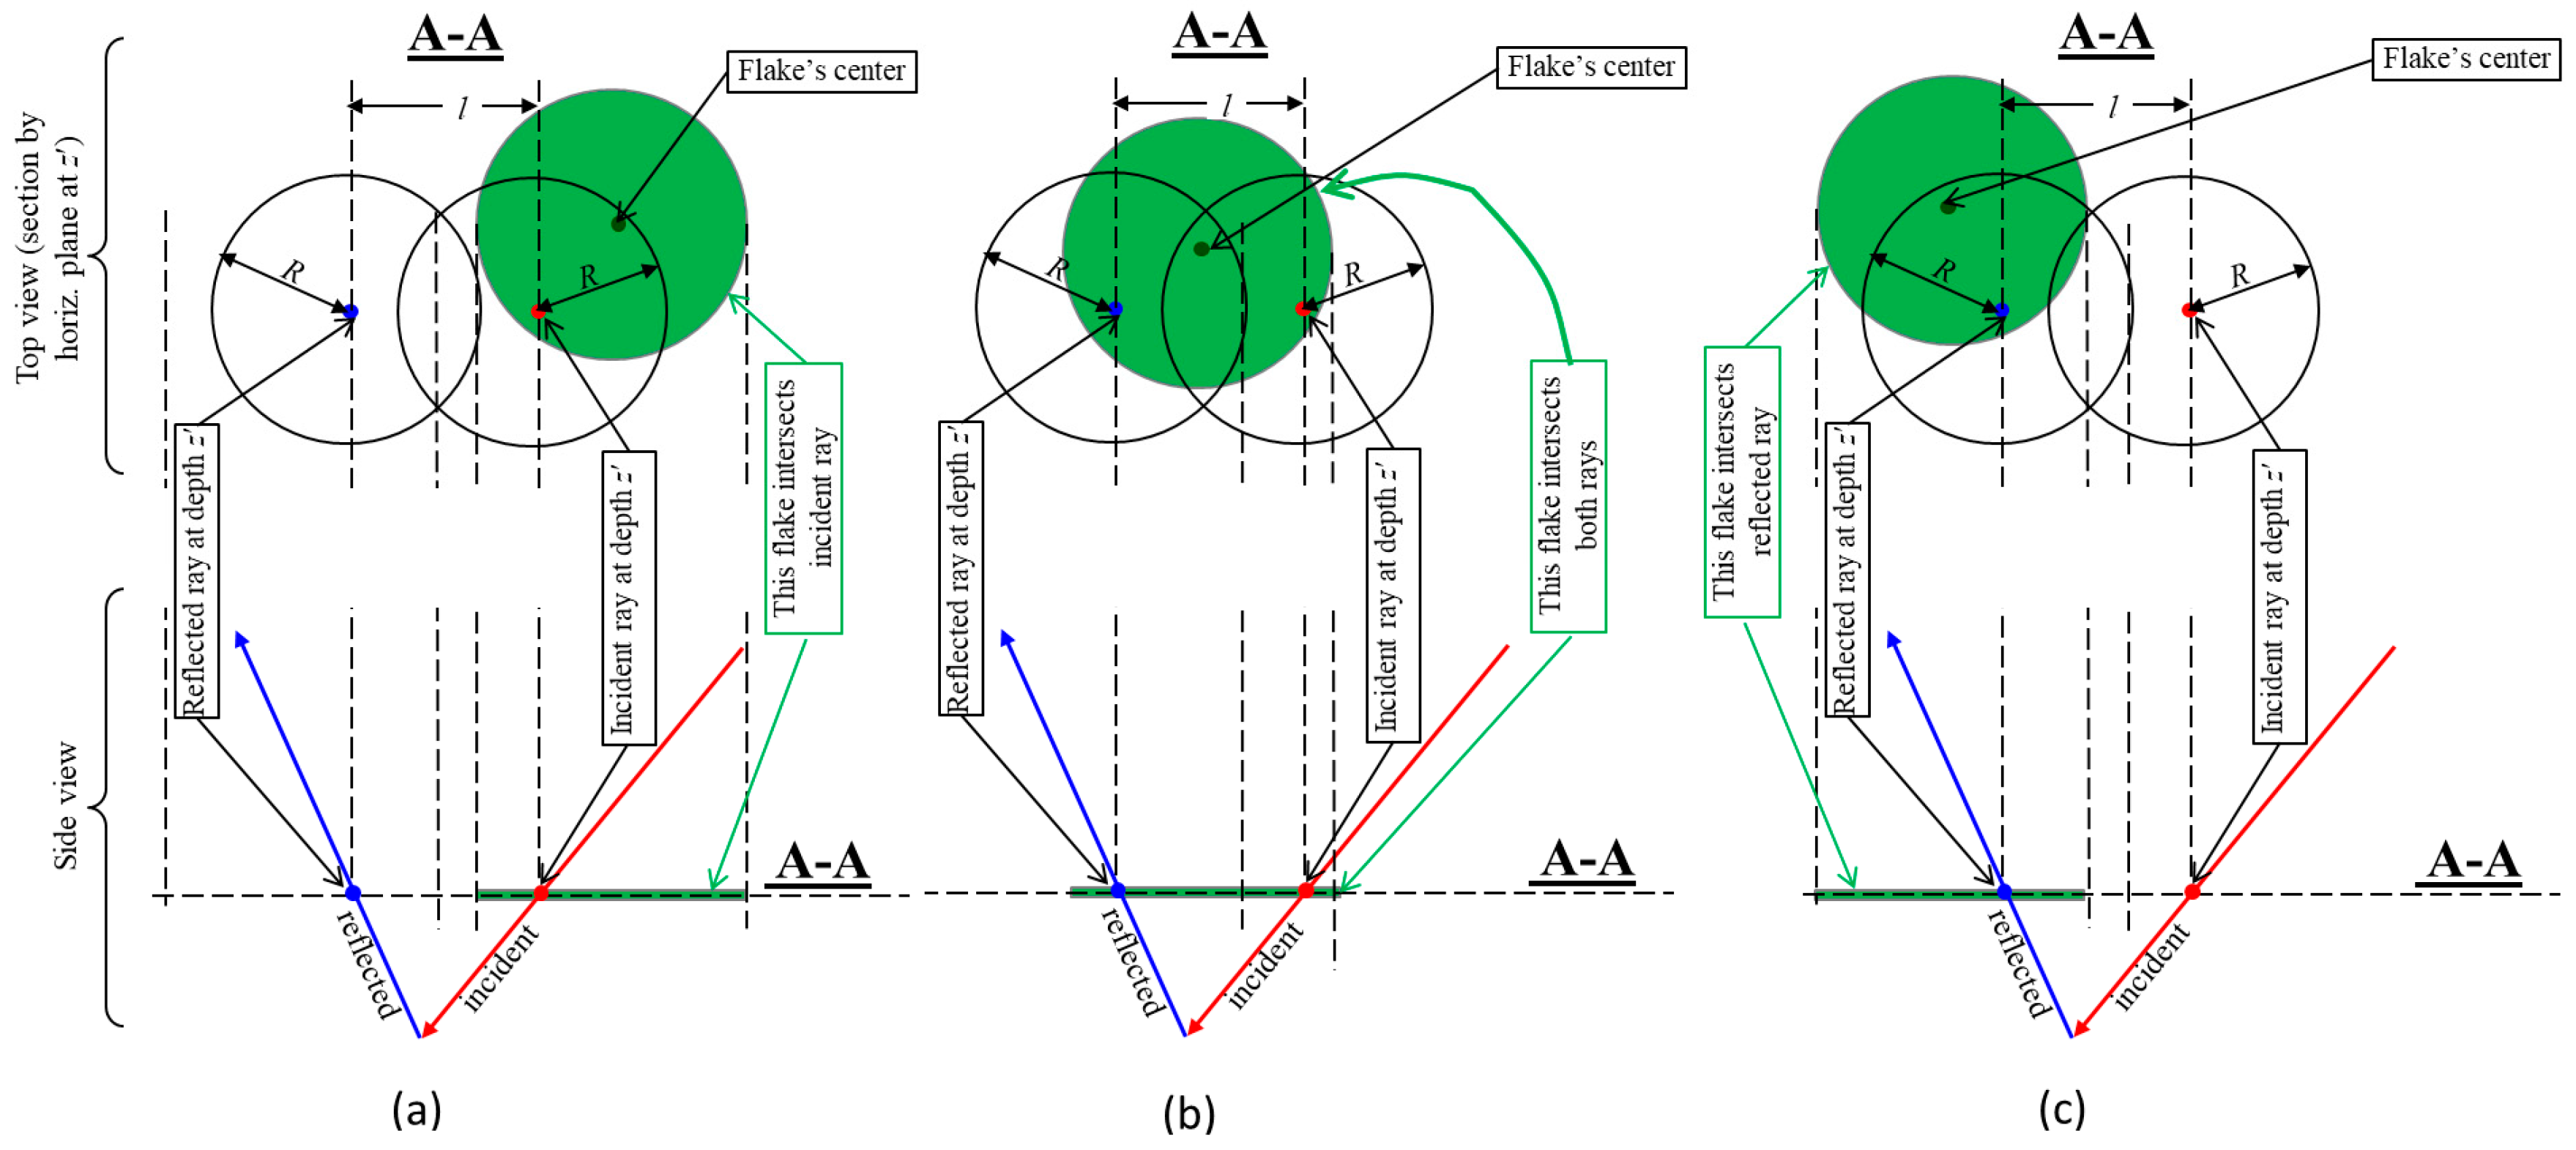
Figure 2 shows the cross-section of paint layer by a horizontal plane. As it is seen there, a horizontal disk of radius
at depth
intersects a ray if its center is closer than
from the ray point at this depth, i.e., the center is within the circle of radius
and center in the ray point.
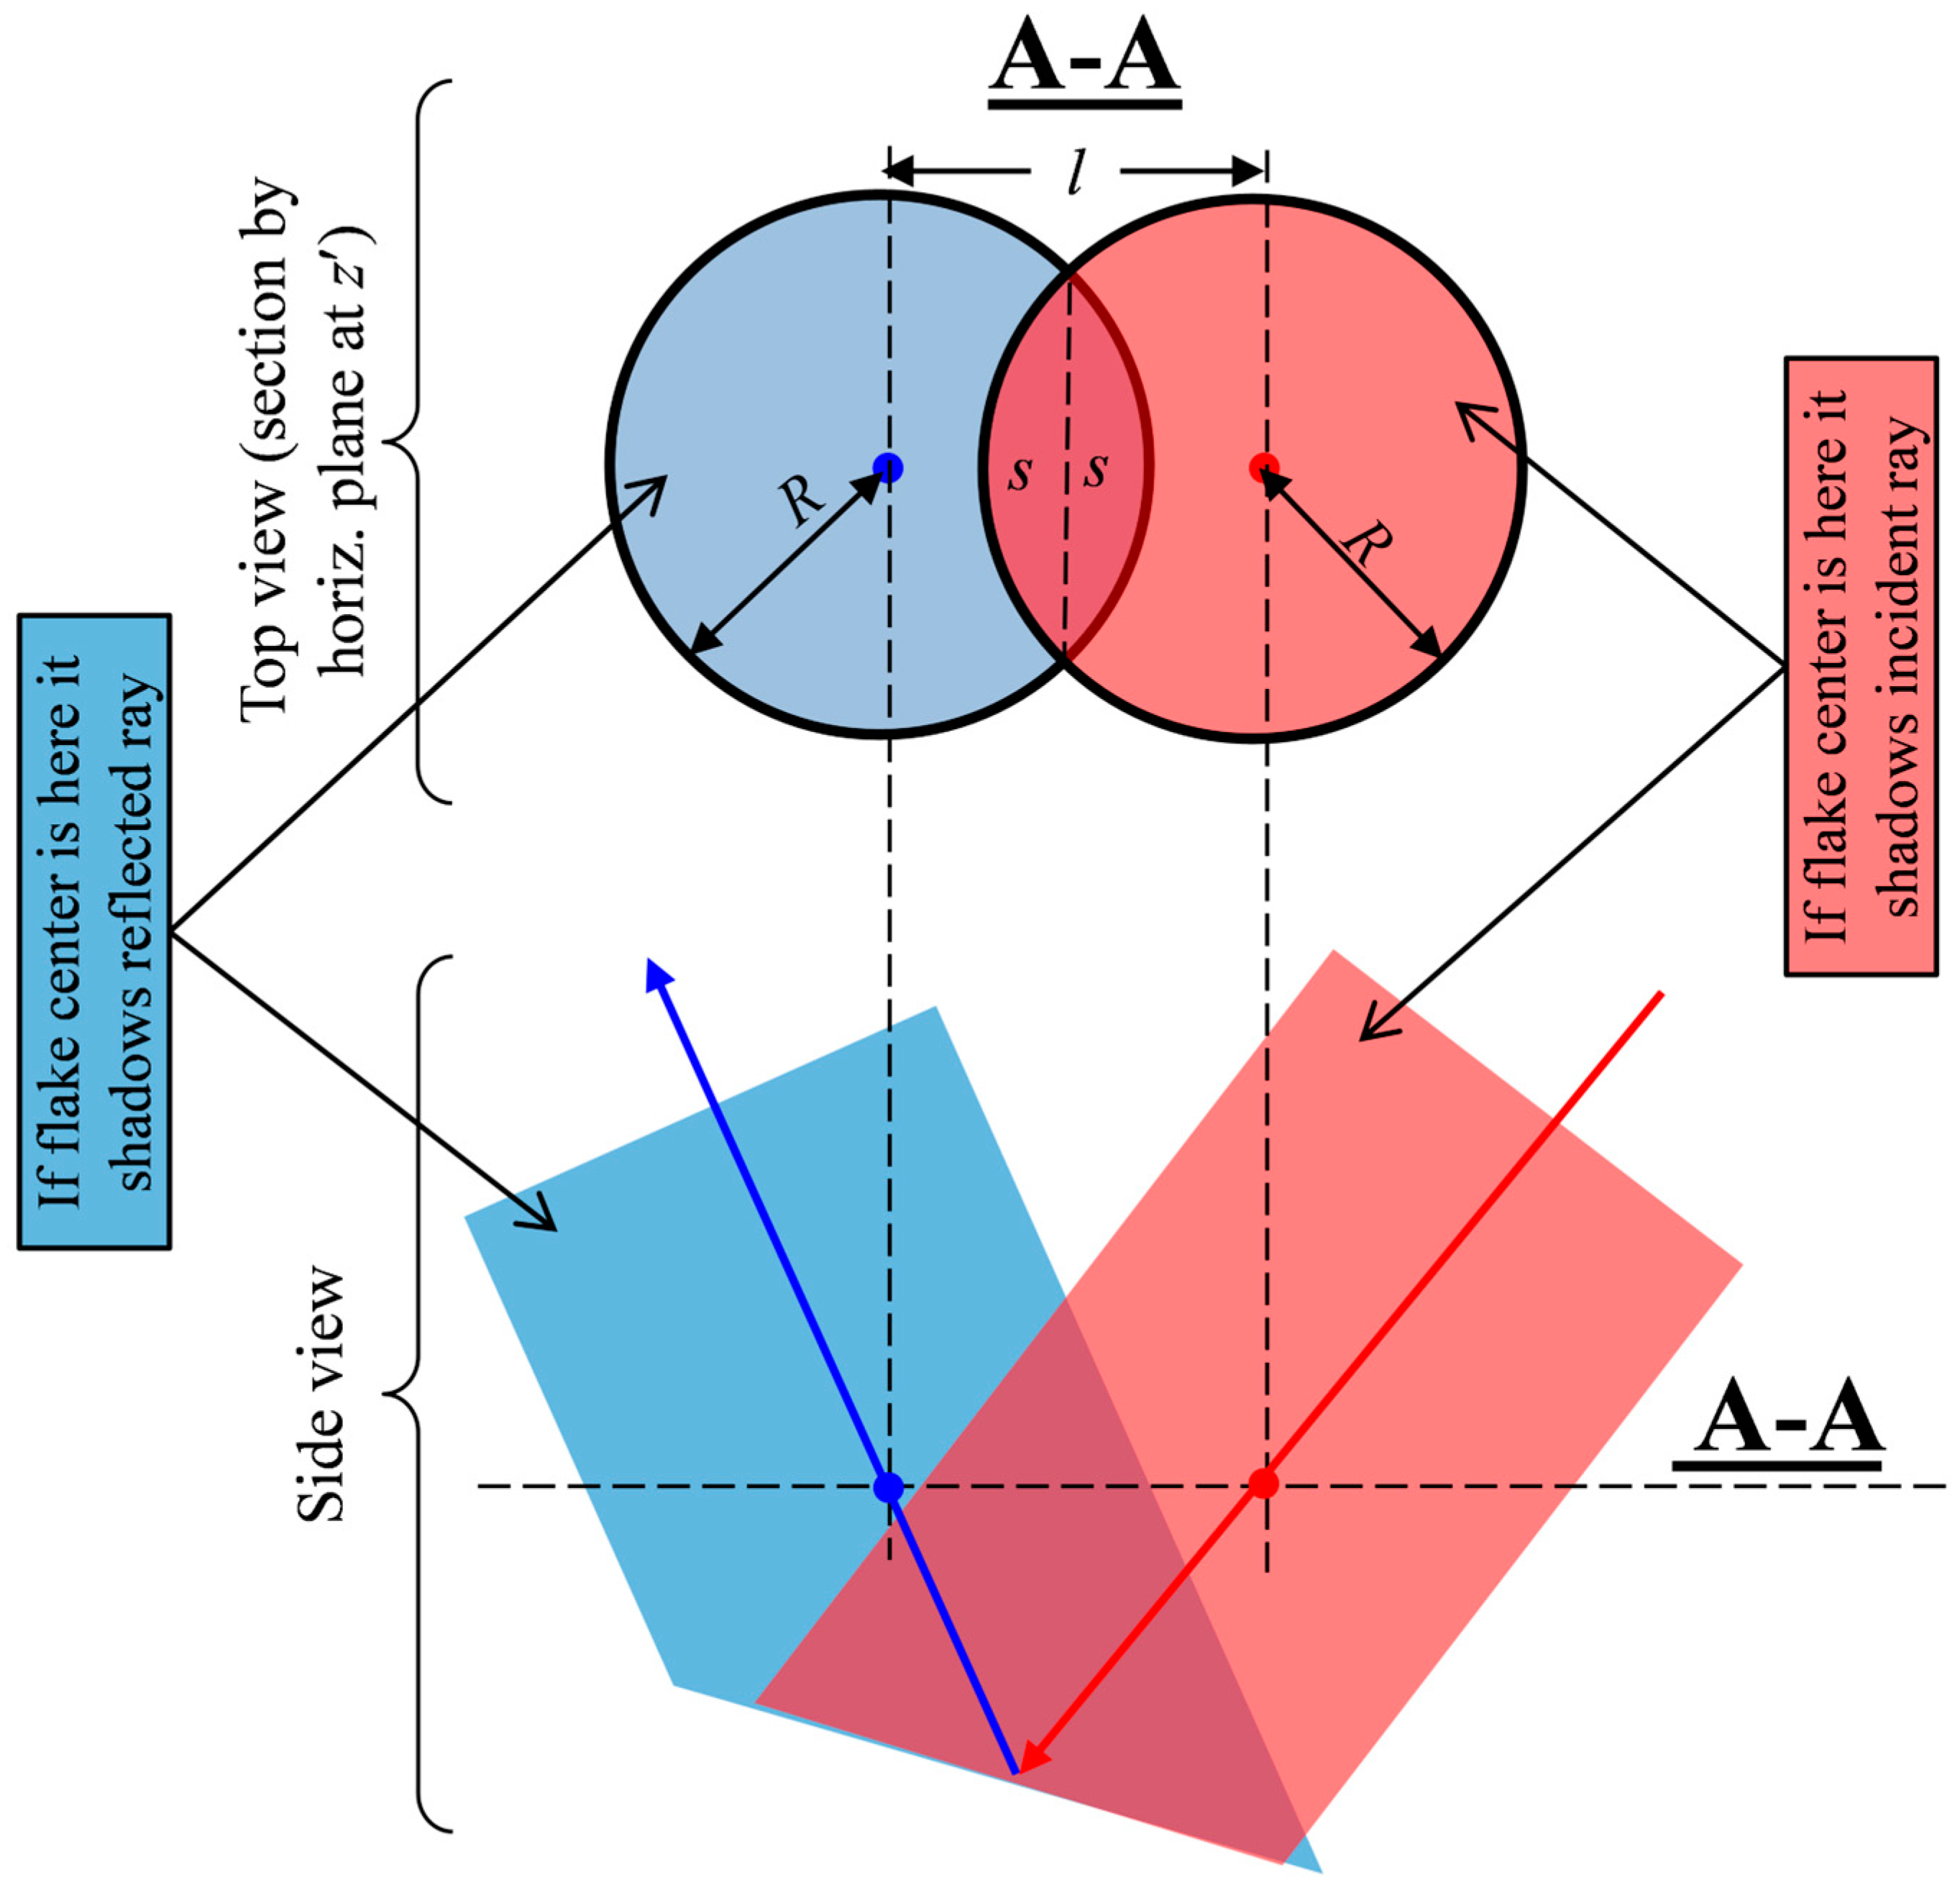
Figure 3 shows the domain where the flake center intersects with the incident or reflected ray. If the flake center is in the red domain, the flake intersects the incident ray (red arrow). If the flake center is within in the blue domain, the flake intersects the reflected ray (blue arrow). If the center is in the intersection of the domains, the flake shadows both. The area of the horizontal section of the intersected domains at depth
is denoted by
. As it is seen from the top panel of
Figure 3, the area
is twice circle’s area
minus area of intersection of these circles. The intersection is twice the area of the sector
:
The area of each of this sector spanning the angle
is
where
is the distance between the points of the incident and reflected rays at depth
and equals to
where
is the depth of the reflection point where both ray segments join; and
depends only on the directions of the incident and reflected rays [
7].
To calculate transmission for the whole path (whose deepest point, i.e., the point of reflection is at depth ), we slice the paint’s layer into horizontal thin sub-layers of thickness .
Notice that if the flake has a non-zero transmittance then if a ray intersects that flake, it still can pass with probability . Thus, if both (incident and reflected) rays intersect a flake, the whole path still transmits with probability . Then, from simple geometric considerations we can infer the following:
The area where the center of a flake must be in order to intersect one of the rays is . Thus, the probability that one of the rays intersects a flake is ; if it happens, the whole path is blocked with a probability . Thus, the total probability that the whole path is blocked is ;
The area where the center of a flake must be in order to intersect both the rays is . Thus, the probability that both of the rays intersect a flake is ; if it happens, the whole path is blocked with a probability . Thus, the total probability that the whole path is blocked is
Since
, see (6), the total probability that the whole path is blocked by sublayer
is then
In the case of horizontal flakes, the flakes at different depths are independent and so the shadowing events at different depths are independent. The probability that the path transmits the whole layer
is then the product of probabilities of transmission of each sublayer:
In case there is a mixture of flakes of different area
(in different concentrations
), the path can be blocked by either of them, so the total probability of blocking is a sum over flake species, i.e.,
where
is given by (7) for
and
So, attenuation becomes
where
Let us calculate the above
, which in view of (7) and recalling that
can be written as
where
Changing the order of integration
this becomes
where
Additionally, .
Complexity of (12) prevents us from obtaining the analytic dependence of the integral
on its parameter
even for a simple distribution
. This can be overcome if we find a good polynomial approximation to
, then
could be moved out of the integral of each its term. It is reasonable to require that this approximation preserves the following properties of the exact function
: it is 0 for
, it is
for
, and it has zero derivative at
. Then, the lowest degree polynomial is
The value of
can be found from the least square fit that gives
and thus
Substituting it in (11) we arrive at
where
Remark 1. In case the distribution of flake area is Gaussian
then 3.3. BRDF for Specular Flakes
The expansion in scattering order (1) works in the accurate approach and in the LTE. In most cases, the first-order term is the principal one and the latter ones are secondary corrections to it. Therefore, if we take the first-order calculated using the accurate approach and the second and other orders calculated using the LTE, we shall give a decent approximation
For vertically homogeneous paint, the equation for the first-order BRDF (2) becomes
It is valid for both the LTE and the accurate approach. The pre-integral factor is the same for both approaches. The attenuation is different: (4) for the LTE and (8) for the accurate approach. So
where
Therefore, the final approximation to the full (all orders) BRDF becomes
For the LTE method, the integral of attenuation (4) is
While for the accurate model, according to (8),
where
The is a sort of a concentration parameter like PVC. It can be named PAC (pigment area concentration) because by definition is the total area of flakes in the paint layer of the unit area. is the effective mean radius, and is the relative effective radius. is determined just by the three parameters , and and depends on the directions and only through which is inversely proportional to .
The integral (17) can be calculated only numerically.
The functions and are determined solely by the distribution of flake area. Thus, they can be pre-calculated in advance and re-used for all color channels and all BRDF points (i.e., for all combinations of the directions of incidence and illumination) because it is only that depends on these directions and which depends on the color channel.
3.4. Opaque Flakes of Fixed Size as a Limiting Case
Obviously, BRDF scaling for opaque flakes of fixed size that was initially investigated in [
7] can be calculated now as the limiting case when the distribution of area is a delta-function and
.
In case this distribution is sharp,
quickly change at
and
As a result, the integral of attenuation is
where
in case
, and
in case
.
For opaque flakes this gives
The difference from [
7] is very small because
.
3.5. The Effect of Variation of Size
As we can see, BRDF depends on the flake size (and its distribution) through the ratio
, see (15). Strange as it may seem, the correction scale is nearly insensitive to the distribution of flake area being determined by the average area. To understand this effect, let us consider the exponential distribution of area
where
is the mean area and
is the “total density”. This form of distribution allows to calculate
analytically.
We see that while the difference between fixed size flakes and LTE can be even twofold, the difference between fixed size flakes and variable size flakes can only reach about for very special parameters.
According to (14), the main first-order component of BRDF is proportional to the integral of attenuation
Therefore, the quantitative measure of the effect of the distribution of size on BRDF is the relative difference of that factor, i.e.,
. According to (13)
where
,
and
.
The case of fixed size flakes relates to the delta-function distribution
for which
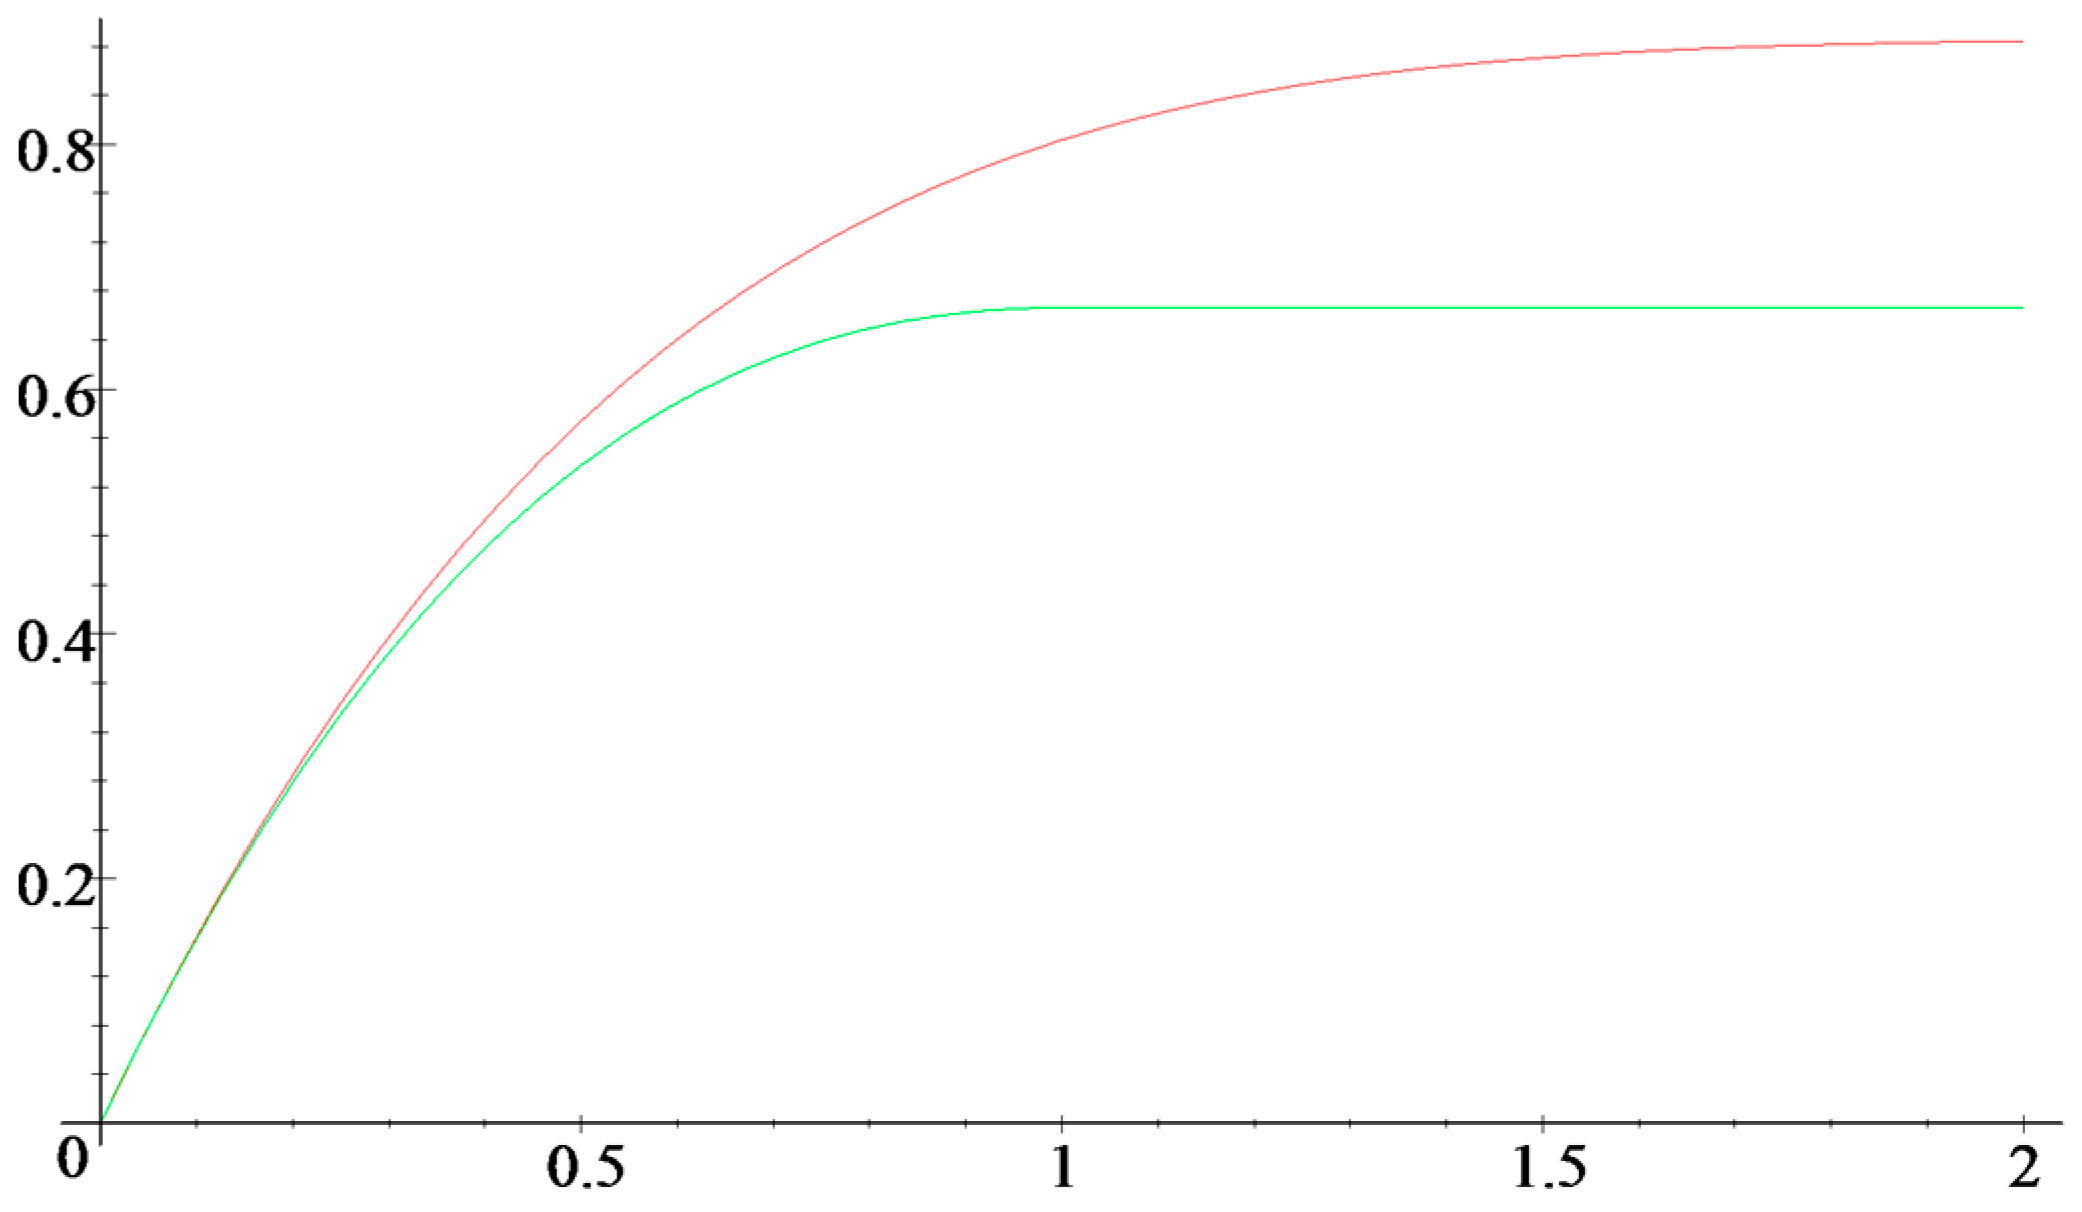
The plots of
as a function of
for both cases are shown in
Figure 4.
So, the two functions converge.
For
both functions saturate
3.6. Back Scattering Approximation
Back scattering means that the incident ray is reflected in the exactly opposite direction, i.e., both rays go the same path. In case of the first-order BRDF, the incident and reflected rays have a common point. In this case, obviously,
or
. As the reflected ray approaches the incident path,
approaches
and
diverges. For very large
, integration effectively ends at
where
, and so
While LTE (which corresponds to
) gives
And thus, the ratio of the first-order BRDFs (14) is
which for opaque flakes is
This asymptotic highlights a remarkable fact: the difference between continuous medium (the LTE approach) and individual particles (the accurate approach) persists even for the tiniest flakes for illumination and observation close to normal.
4. Results
The following paint structure was used in our simulation experiments: the binder refraction index is 1.5, and the paint layer thickness is . Flakes are thin platelets with thickness of 0.5 and specular reflectance of 50%. Their specular transmittance is 0% (calculations for opaque flakes) or 50% (calculations for semi-transparent flakes). The angle between the paint surface normal and normal of flakes has a Gaussian distribution with a variance of 2 degrees. The concentration and size of the flakes are described by two dimensionless parameters: relative radius and pigment area concentration , which equals to the total area of flakes in paint layer with unit area. In our calculations, varies from 1 for large flakes to 0.01 for small flakes and varies from 2 (high concentration) to 0.2 (low concentration). Flake area has a Gaussian distribution with center at 0 and two different widths: 4000 and 40,000 . Effective flake radius (such a value that equals the mean flake area) was 1 , 10 and .
BRDF is a function of incident and outgoing directions. The azimuth of incidence is irrelevant because of the isotropy of our paint layer. The outgoing direction is taken in the coordinate system with the polar axis along the mirror reflection of the incident ray. This allows to choose high angular resolution for the sharp near-specular peak which is close to the pole regardless of . Hence, in our coordinate system, BRDF is a function of three angles: the angle between illumination and paint normal and two angles of observation, , where is the angle between observation and direction of the mirror reflection and is the rotation of the observation direction about the mirror direction.
BRDF of the paint layer was calculated using three methods: Monte Carlo ray tracing in continuous medium (the LTE approach), ray tracing within paint layer with explicitly specified individual particles (the accurate approach) and the LTE approach with correction (15). For the accurate approach, we created a sample of paint geometry with randomly distributed and not overlapping flakes. Additionally, for comparison, we calculated the BRDF for fixed flake area (with the same mean area
). However, the plots for fixed area and for the Gaussian distribution of area are indistinguishable within the line thickness; the LTE results are completely independent from flake area while the accurate ray tracing results change but very slightly, see
Section 3.5.
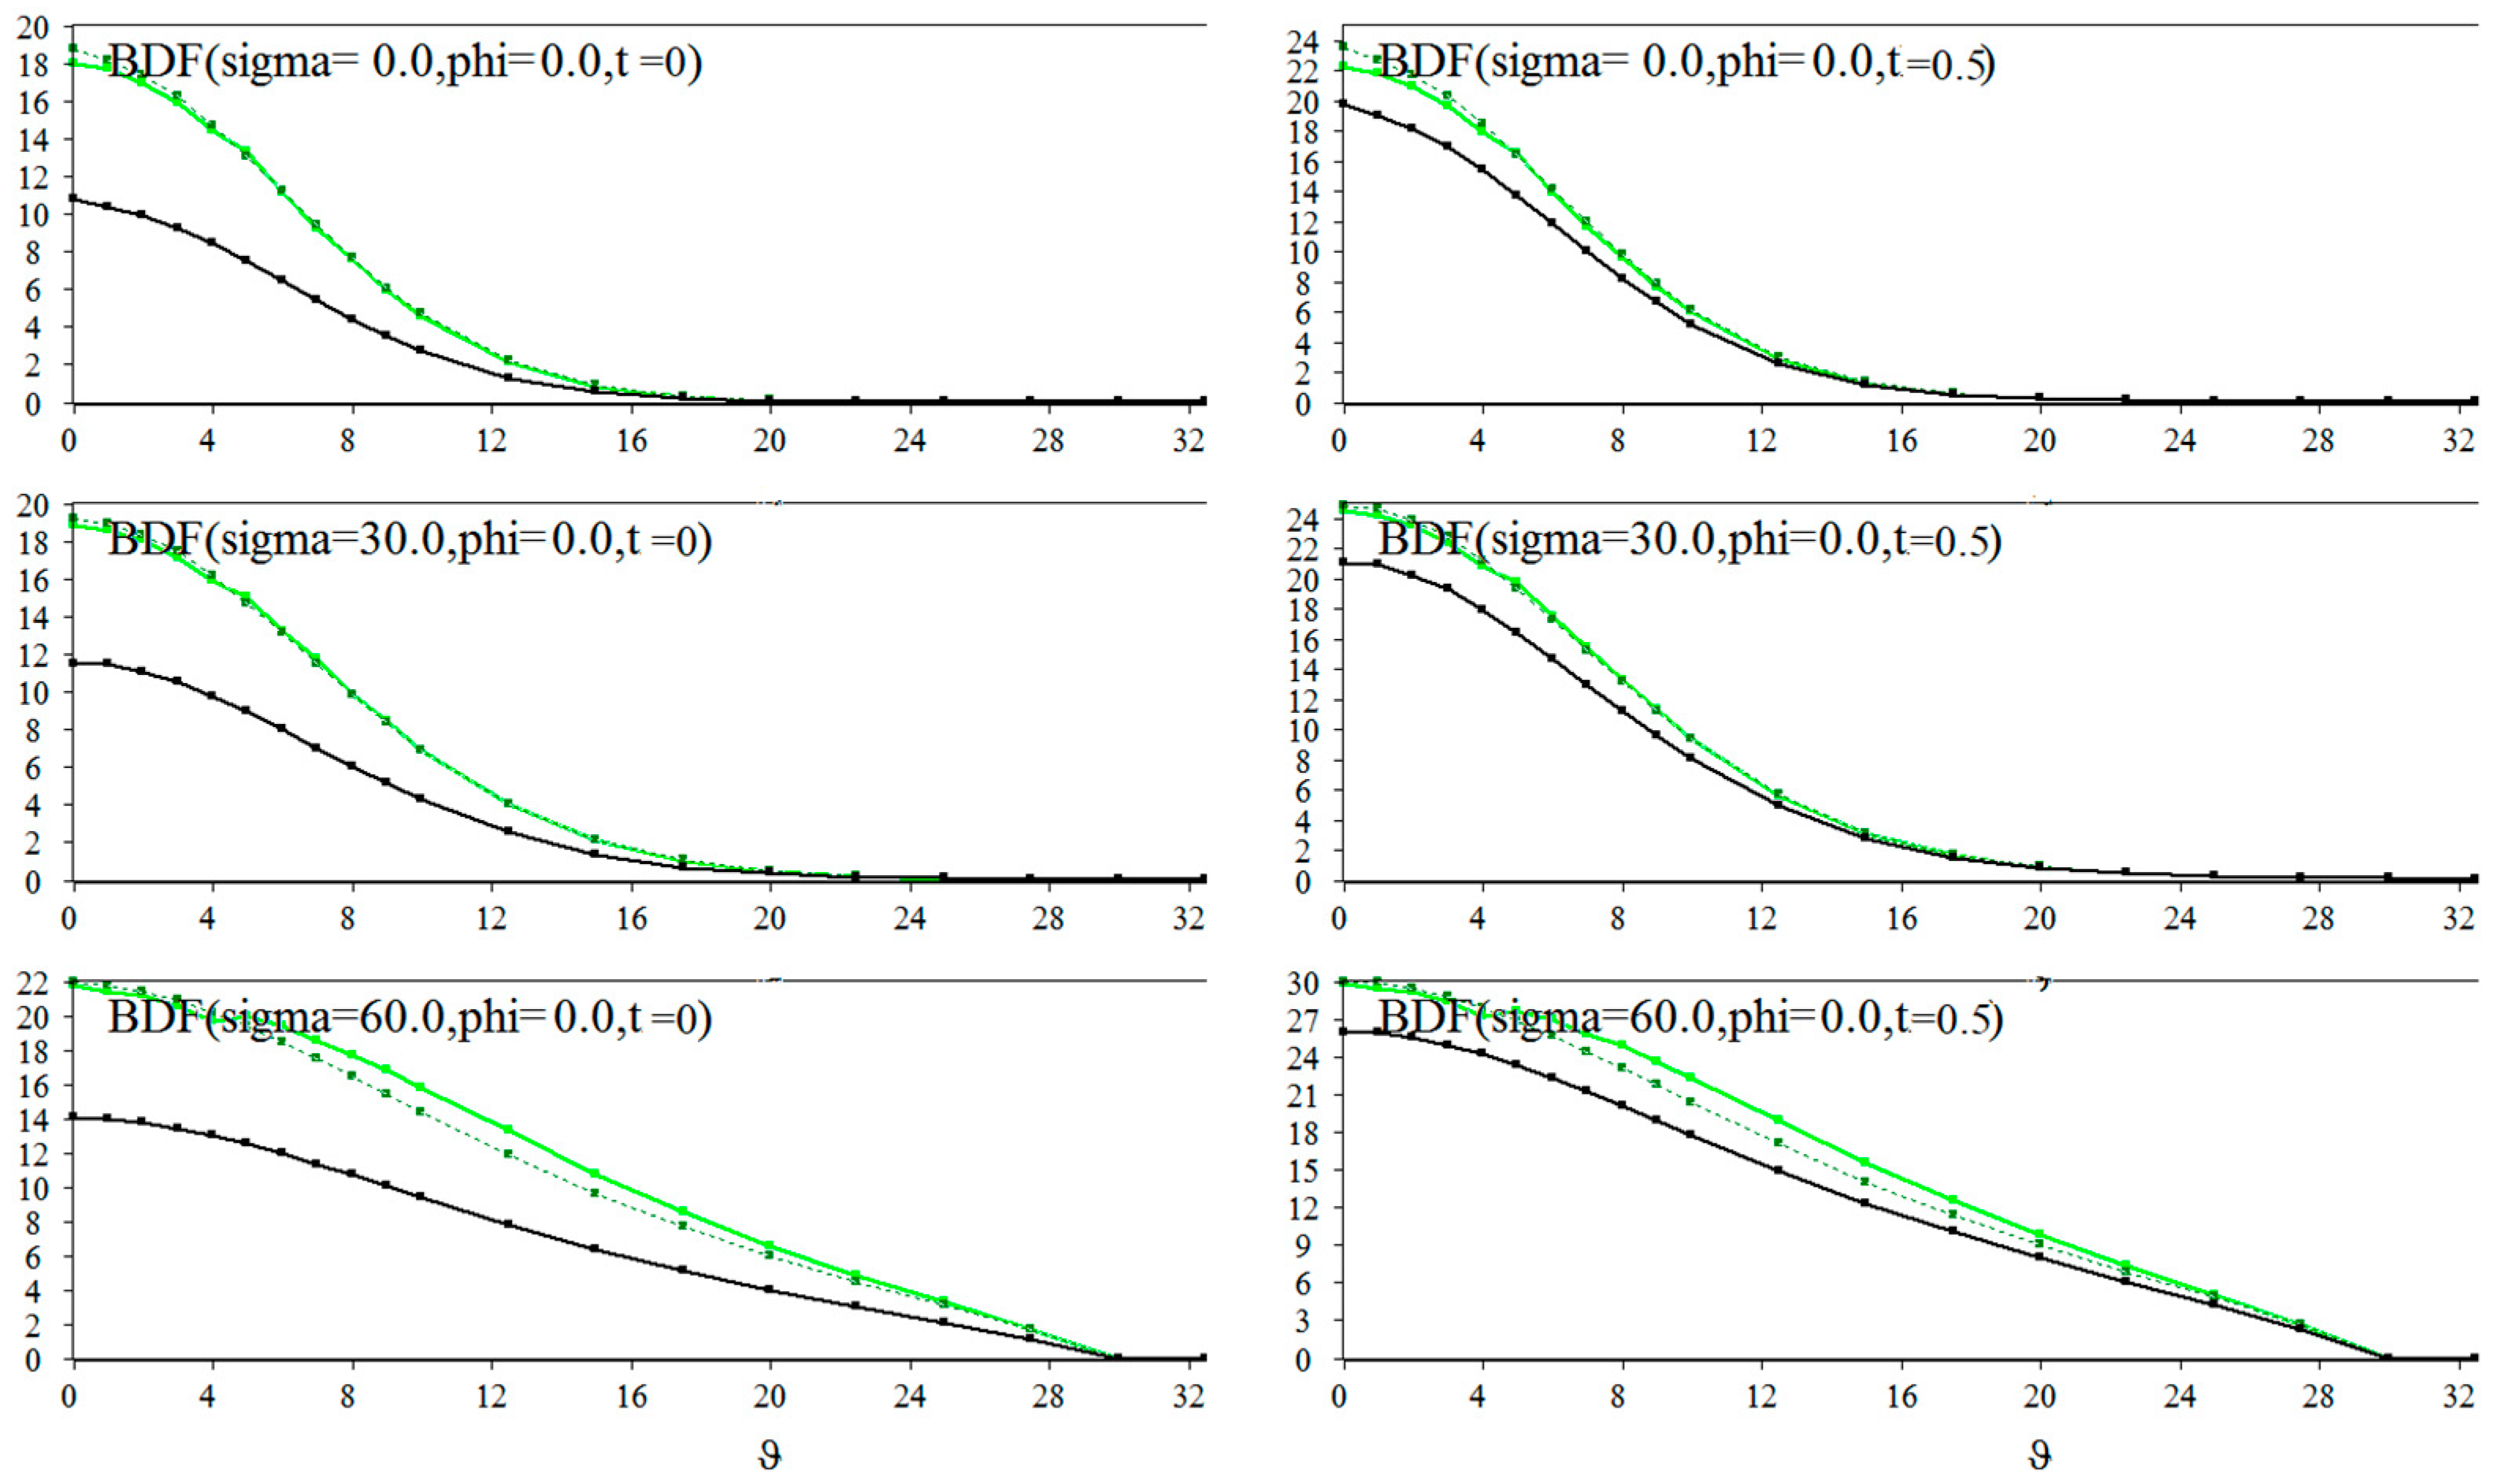
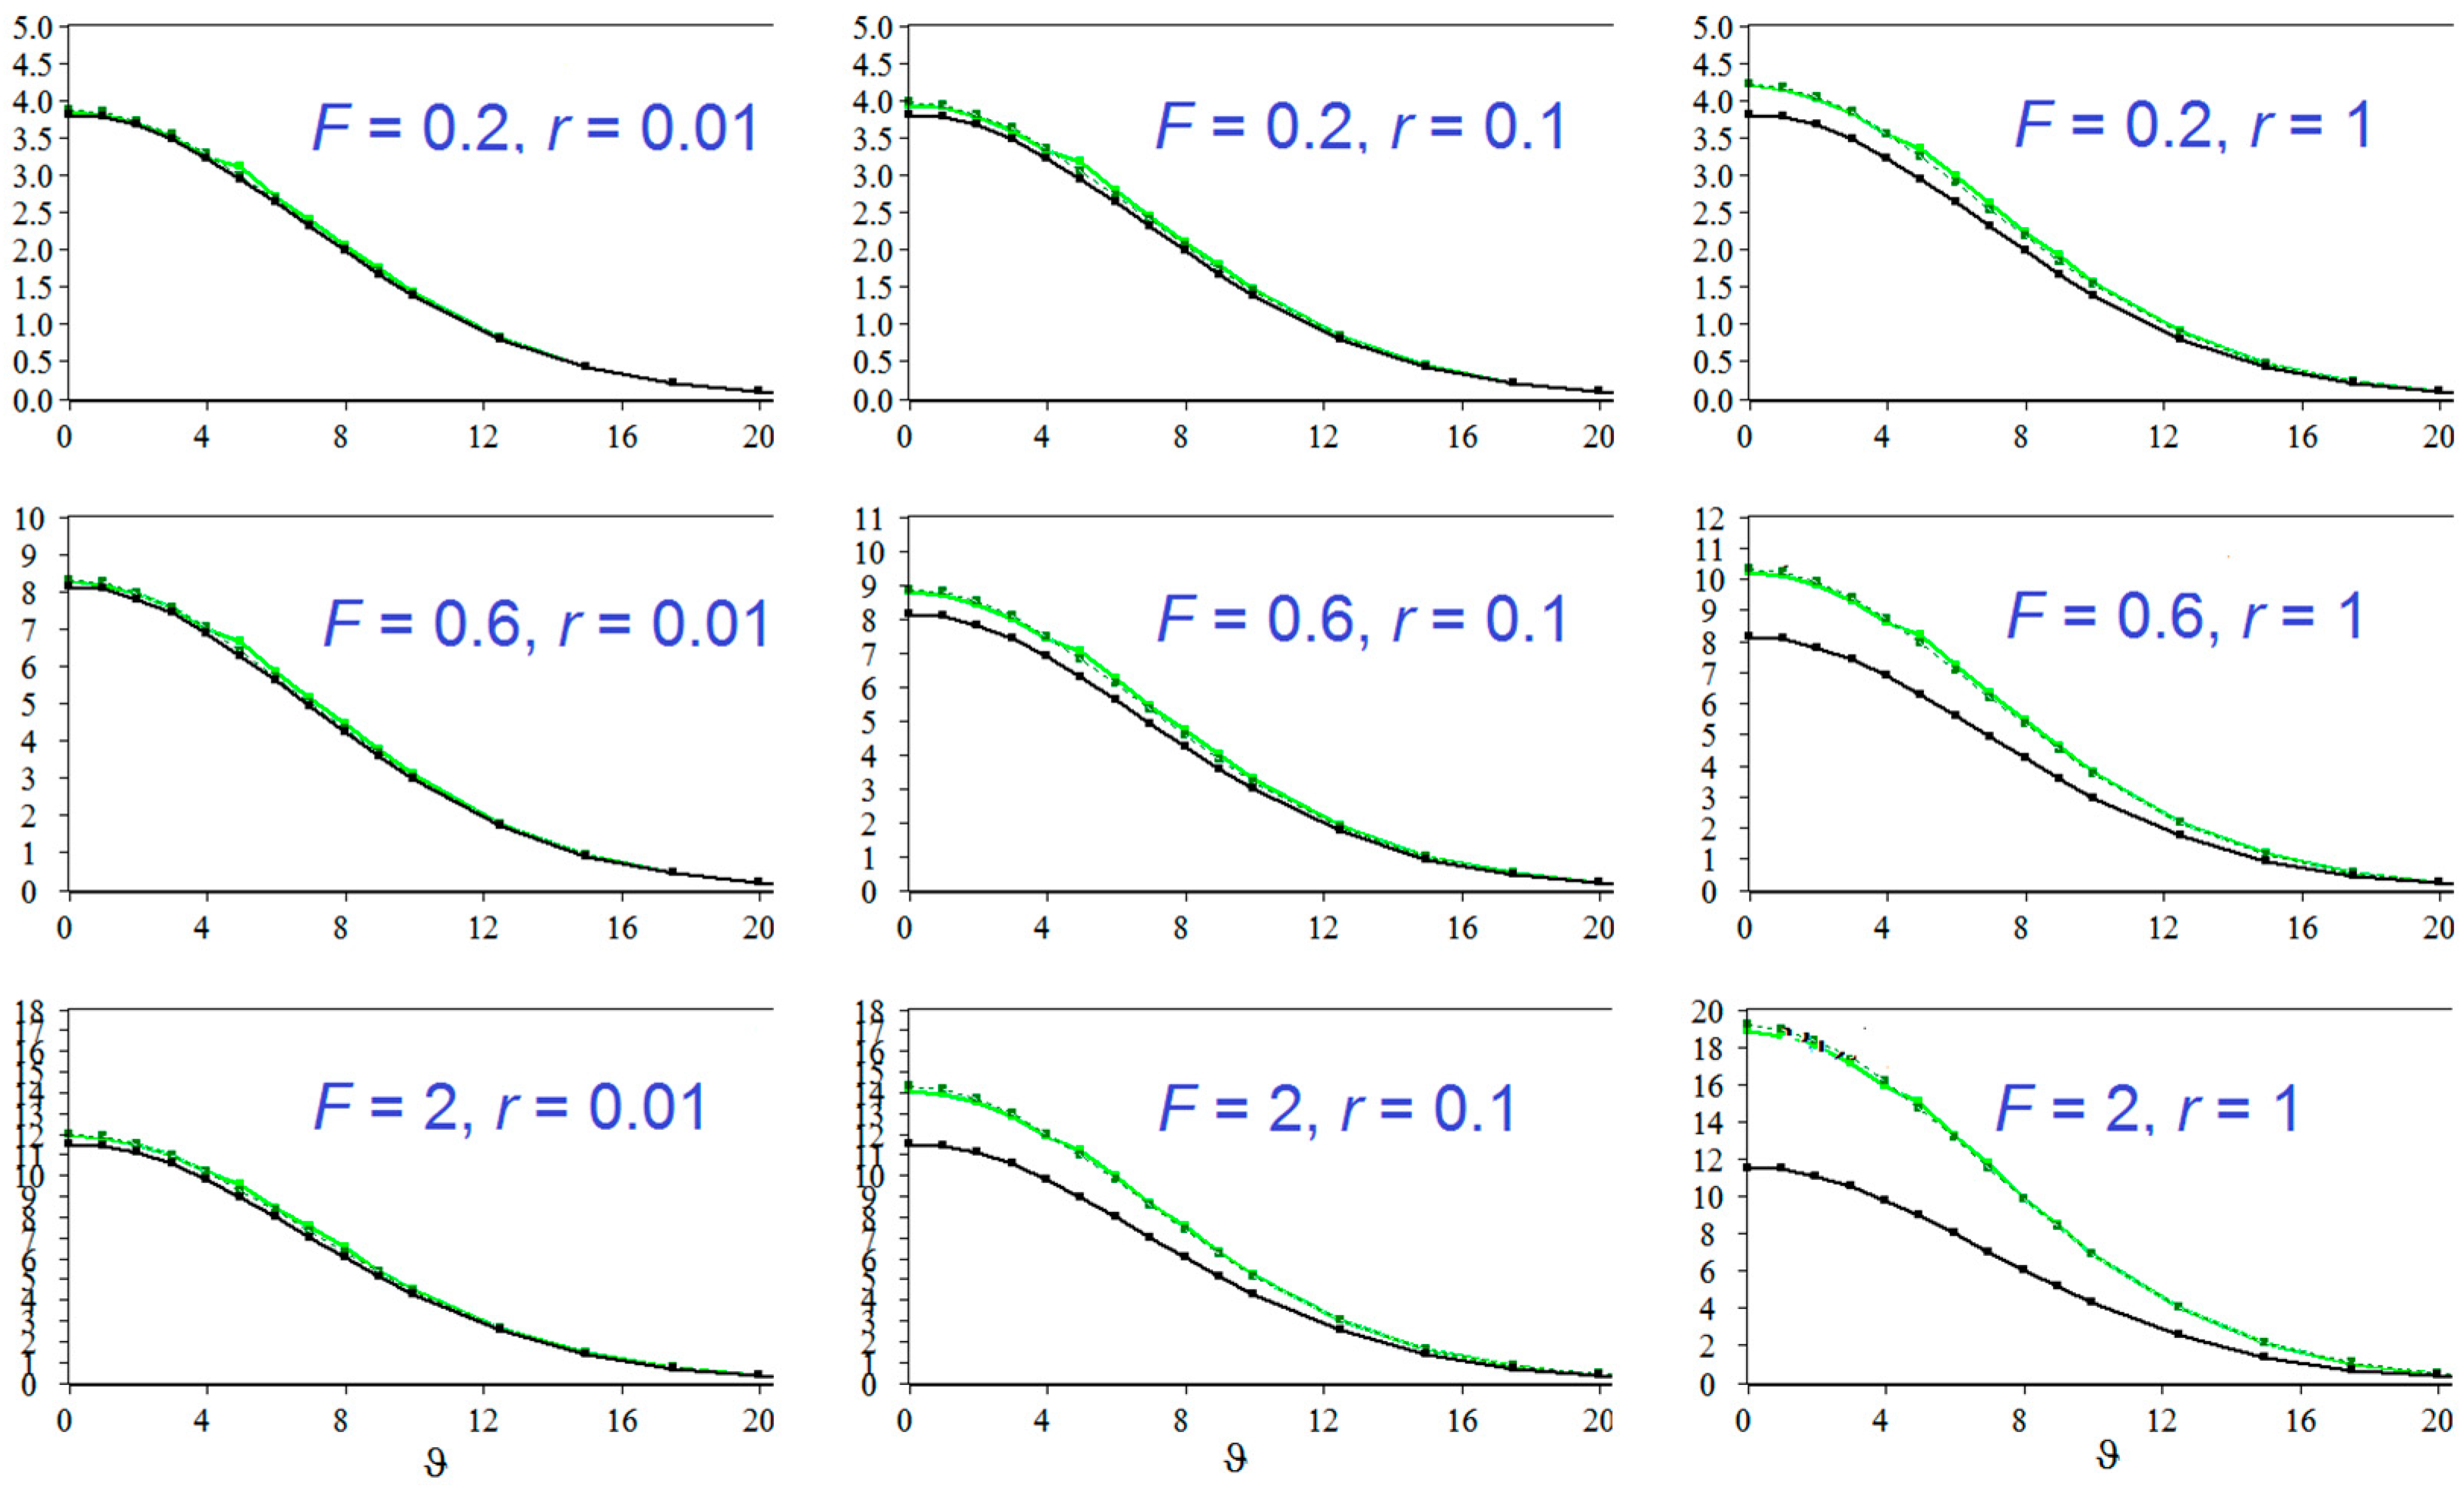
Figure 5 shows the results of calculations using these three models for the case
(high concentration) and
(large flakes) when the difference is maximal. To fit them all in one image, we show BRDF only in the plane of incidence (
) and for three angles of incidence
, because the other BRDF plots demonstrate nearly the same relation.
In
Figure 5, we can see that the correction (15) significantly improves the accuracy. Results of the accurate approach and the LTE with correction are close. Additionally, we can see that the role of size is weaker for semi-transparent flakes than for the opaque ones. This is because BRDF depends on flake size through the term
, see (17), and this term is scaled by
, so for
it vanishes.
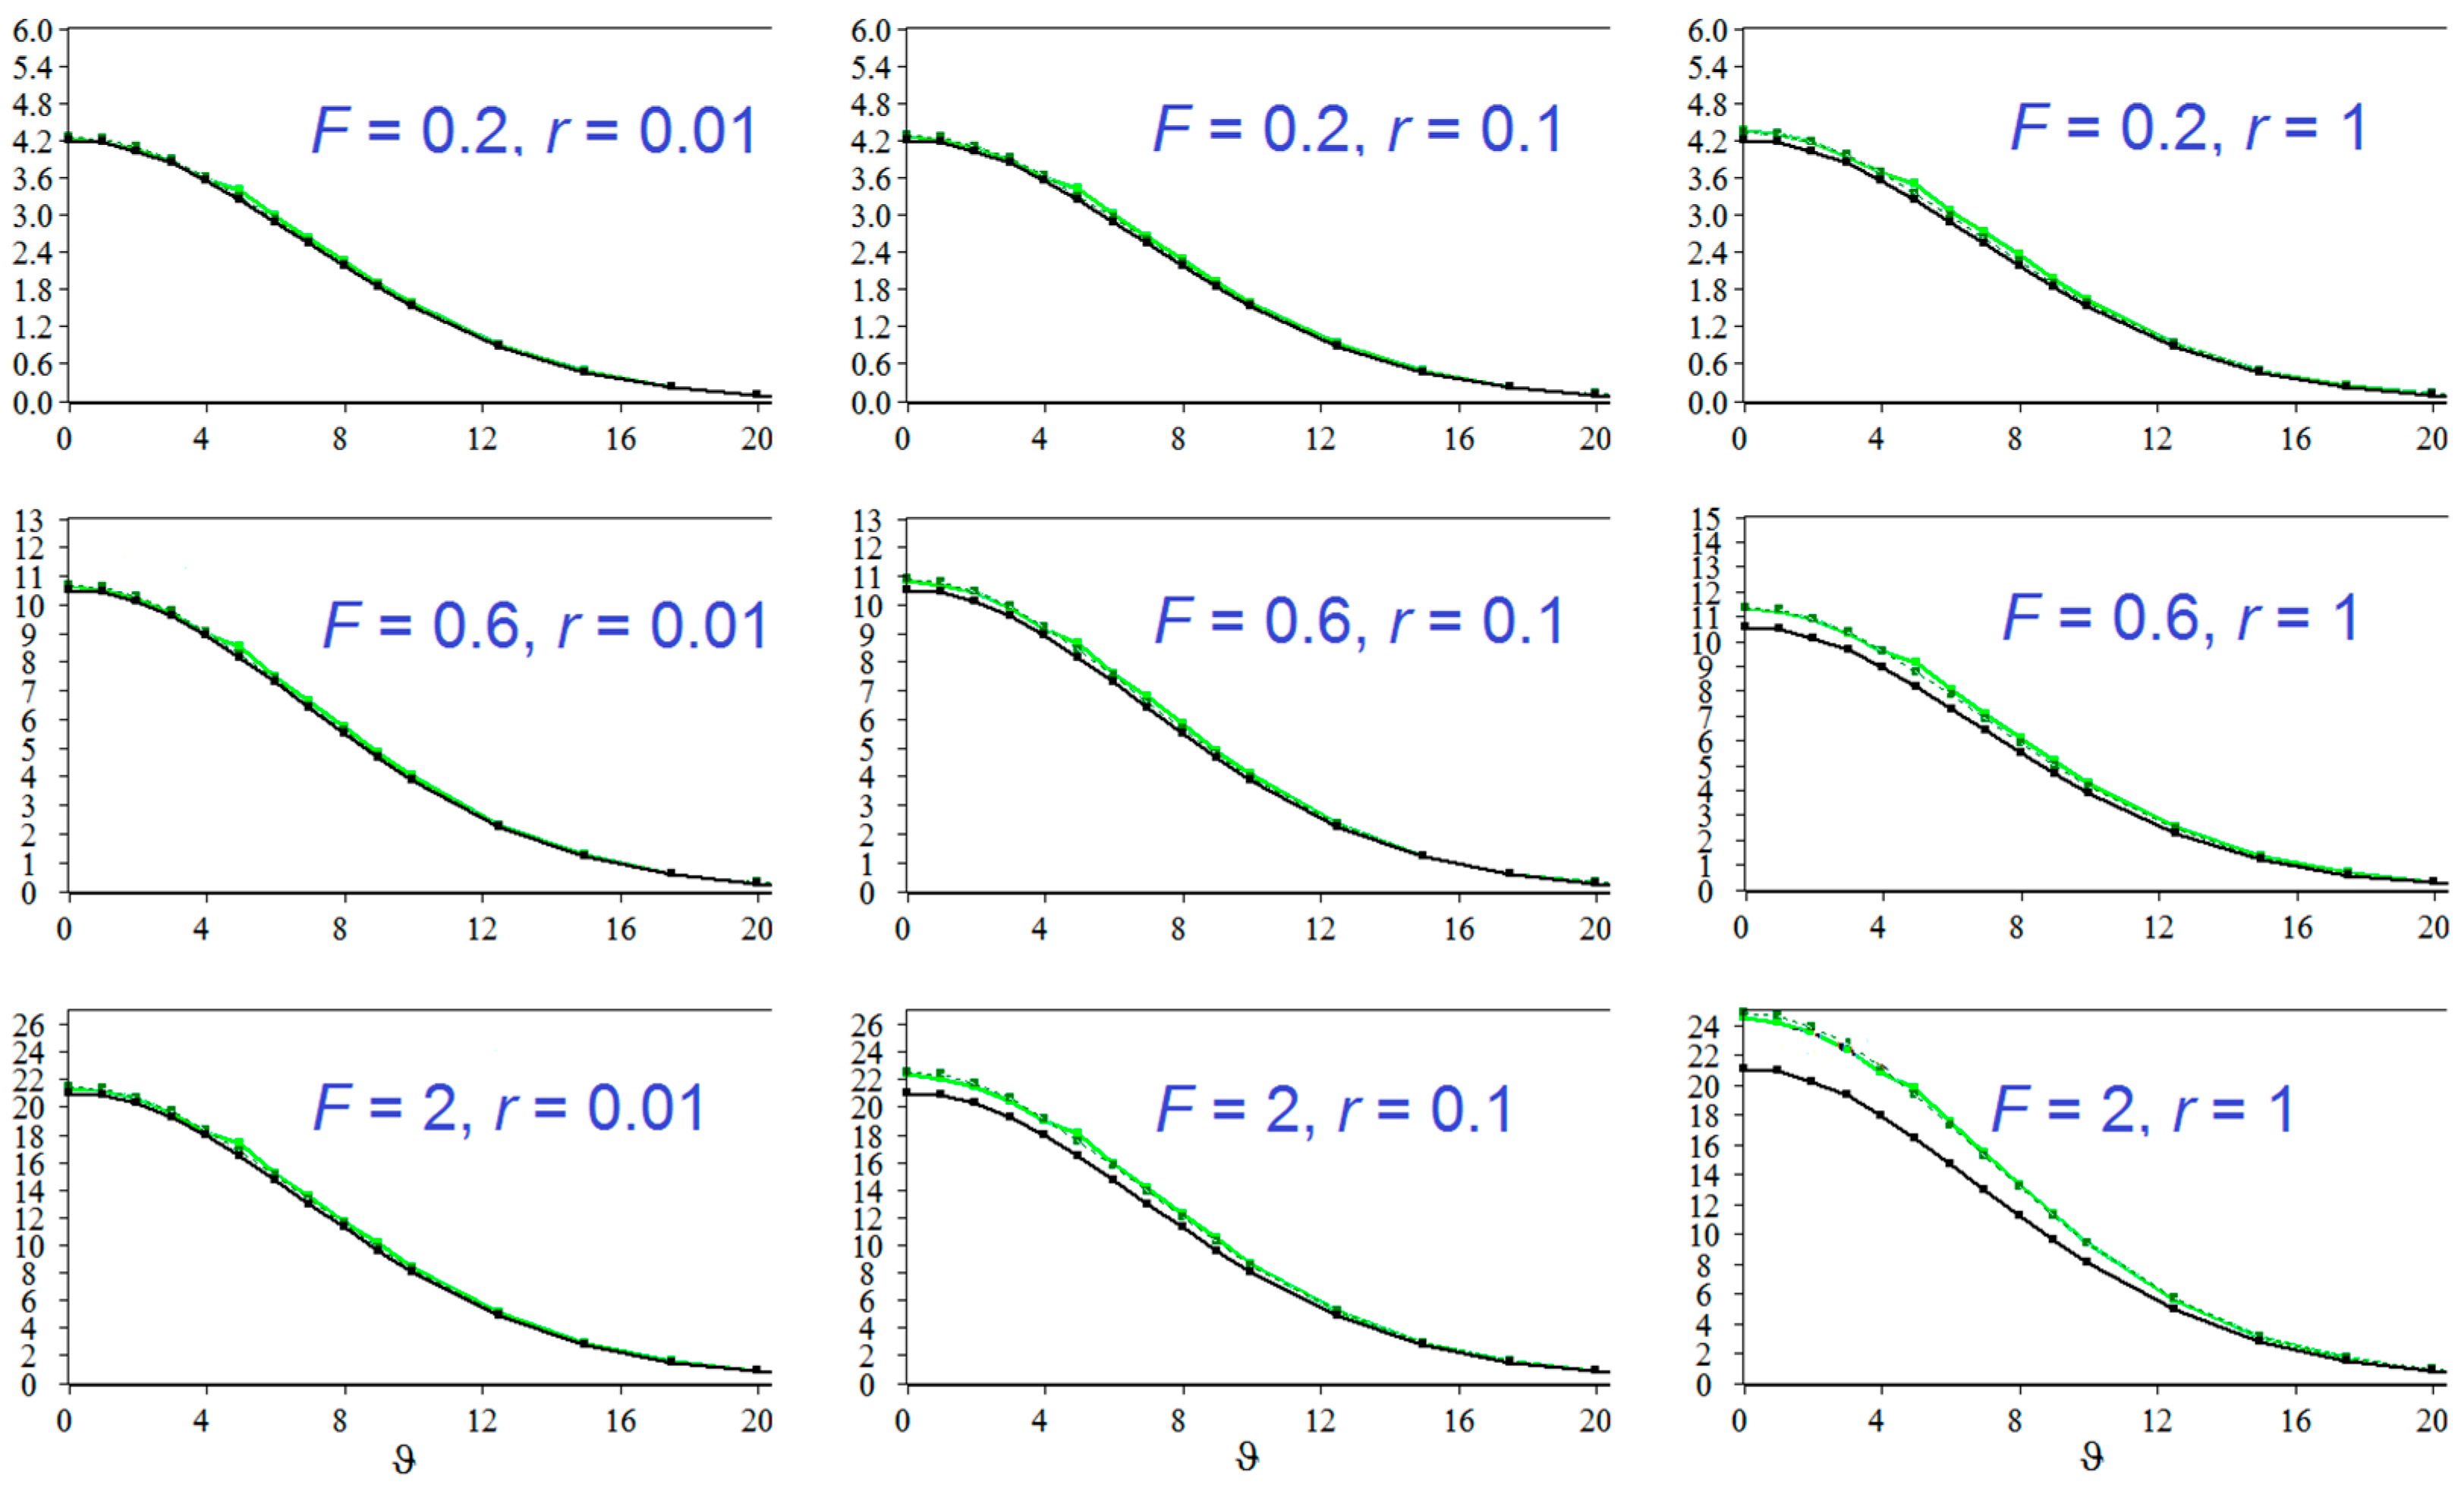
The difference between the LTE and the accurate approaches increases with the increase in
or
parameters.
Figure 6 shows the results of the increasing (from left to right and from top to bottom) parameters for opaque flakes.
Figure 7 demonstrates the same tendency for semi-transparent flakes. It is seen that the difference from LTE increases with
and
and that the correction significantly improves the accuracy.
One can see that our method that calculates BRDF from scaling of the LTE results provides good accuracy in the wide range of flake size and concentration. Naturally, as the flake size decreases, the accurate model for individual flakes and the LTE for continuous medium converge (
Figure 6, left column).
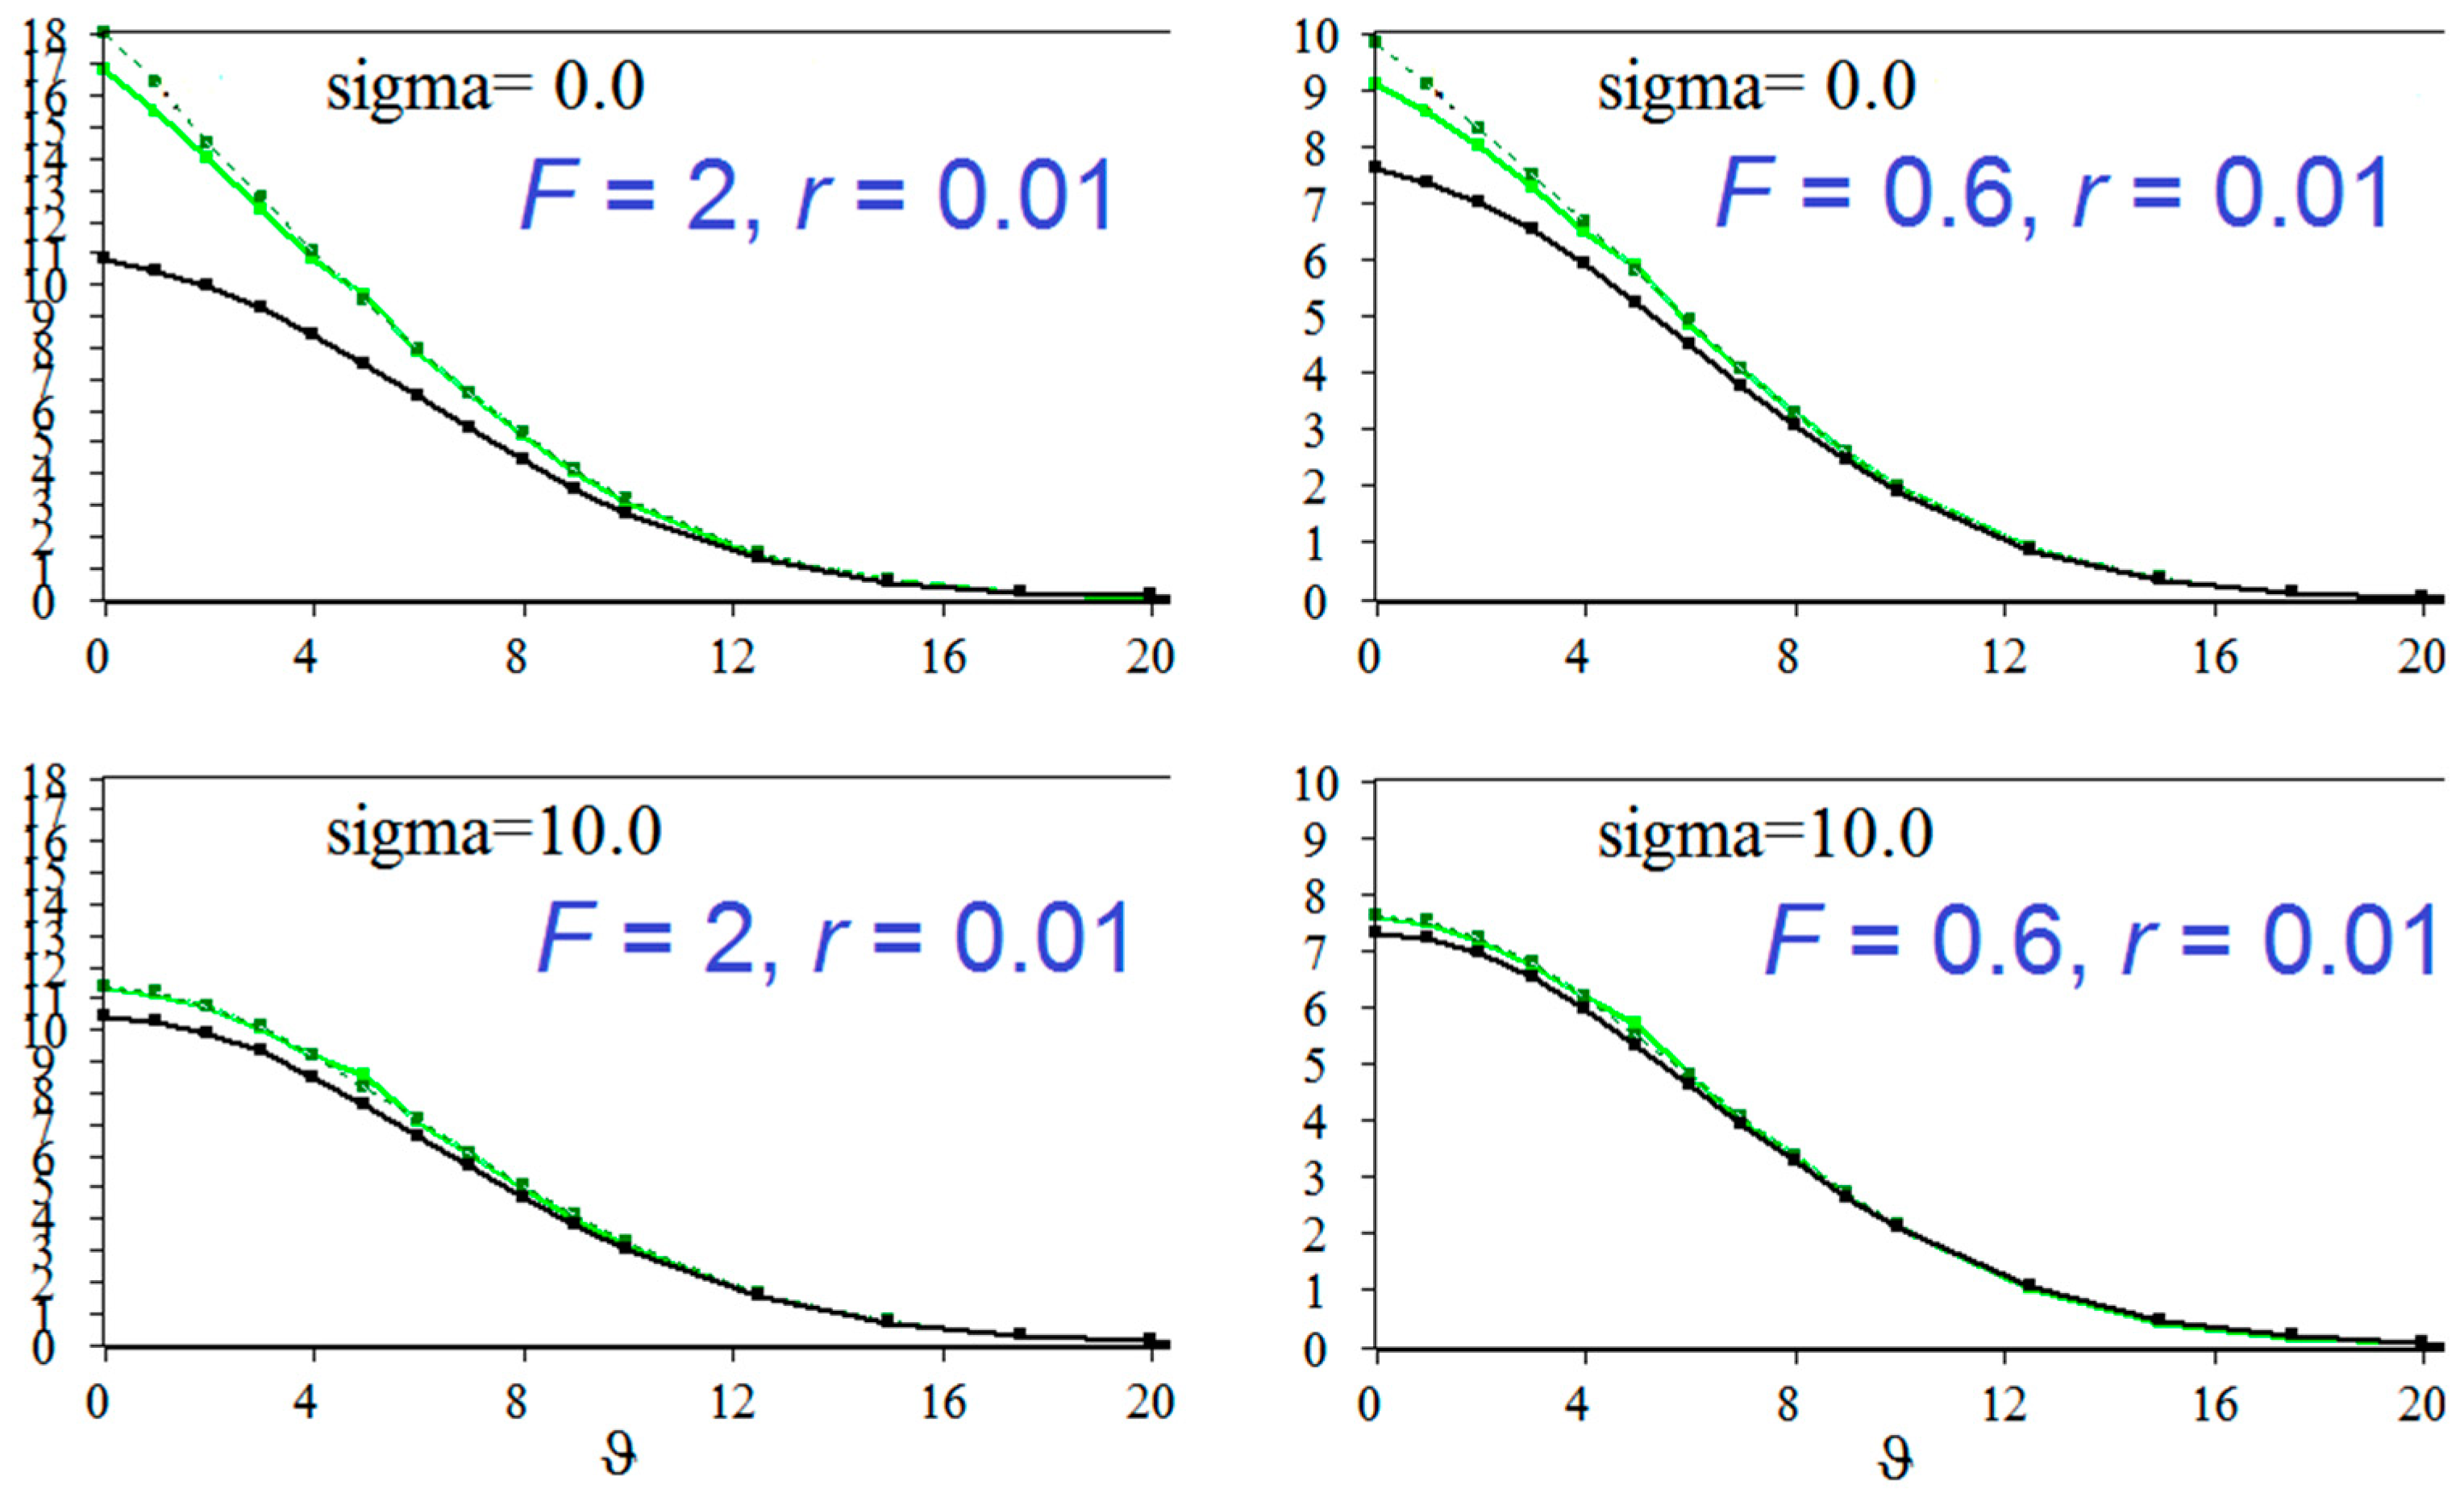
As expected from the derived formulae, the case of normal incidence is special. Indeed, for normal incidence and observation close to normal, we have nearly the back scattering when correlation effects do not vanish even for tiny flakes, see
Section 3.6. Therefore, now the difference between the accurate approach (individual flakes) and the LTE (continuous medium) must persist even for tiny particles.
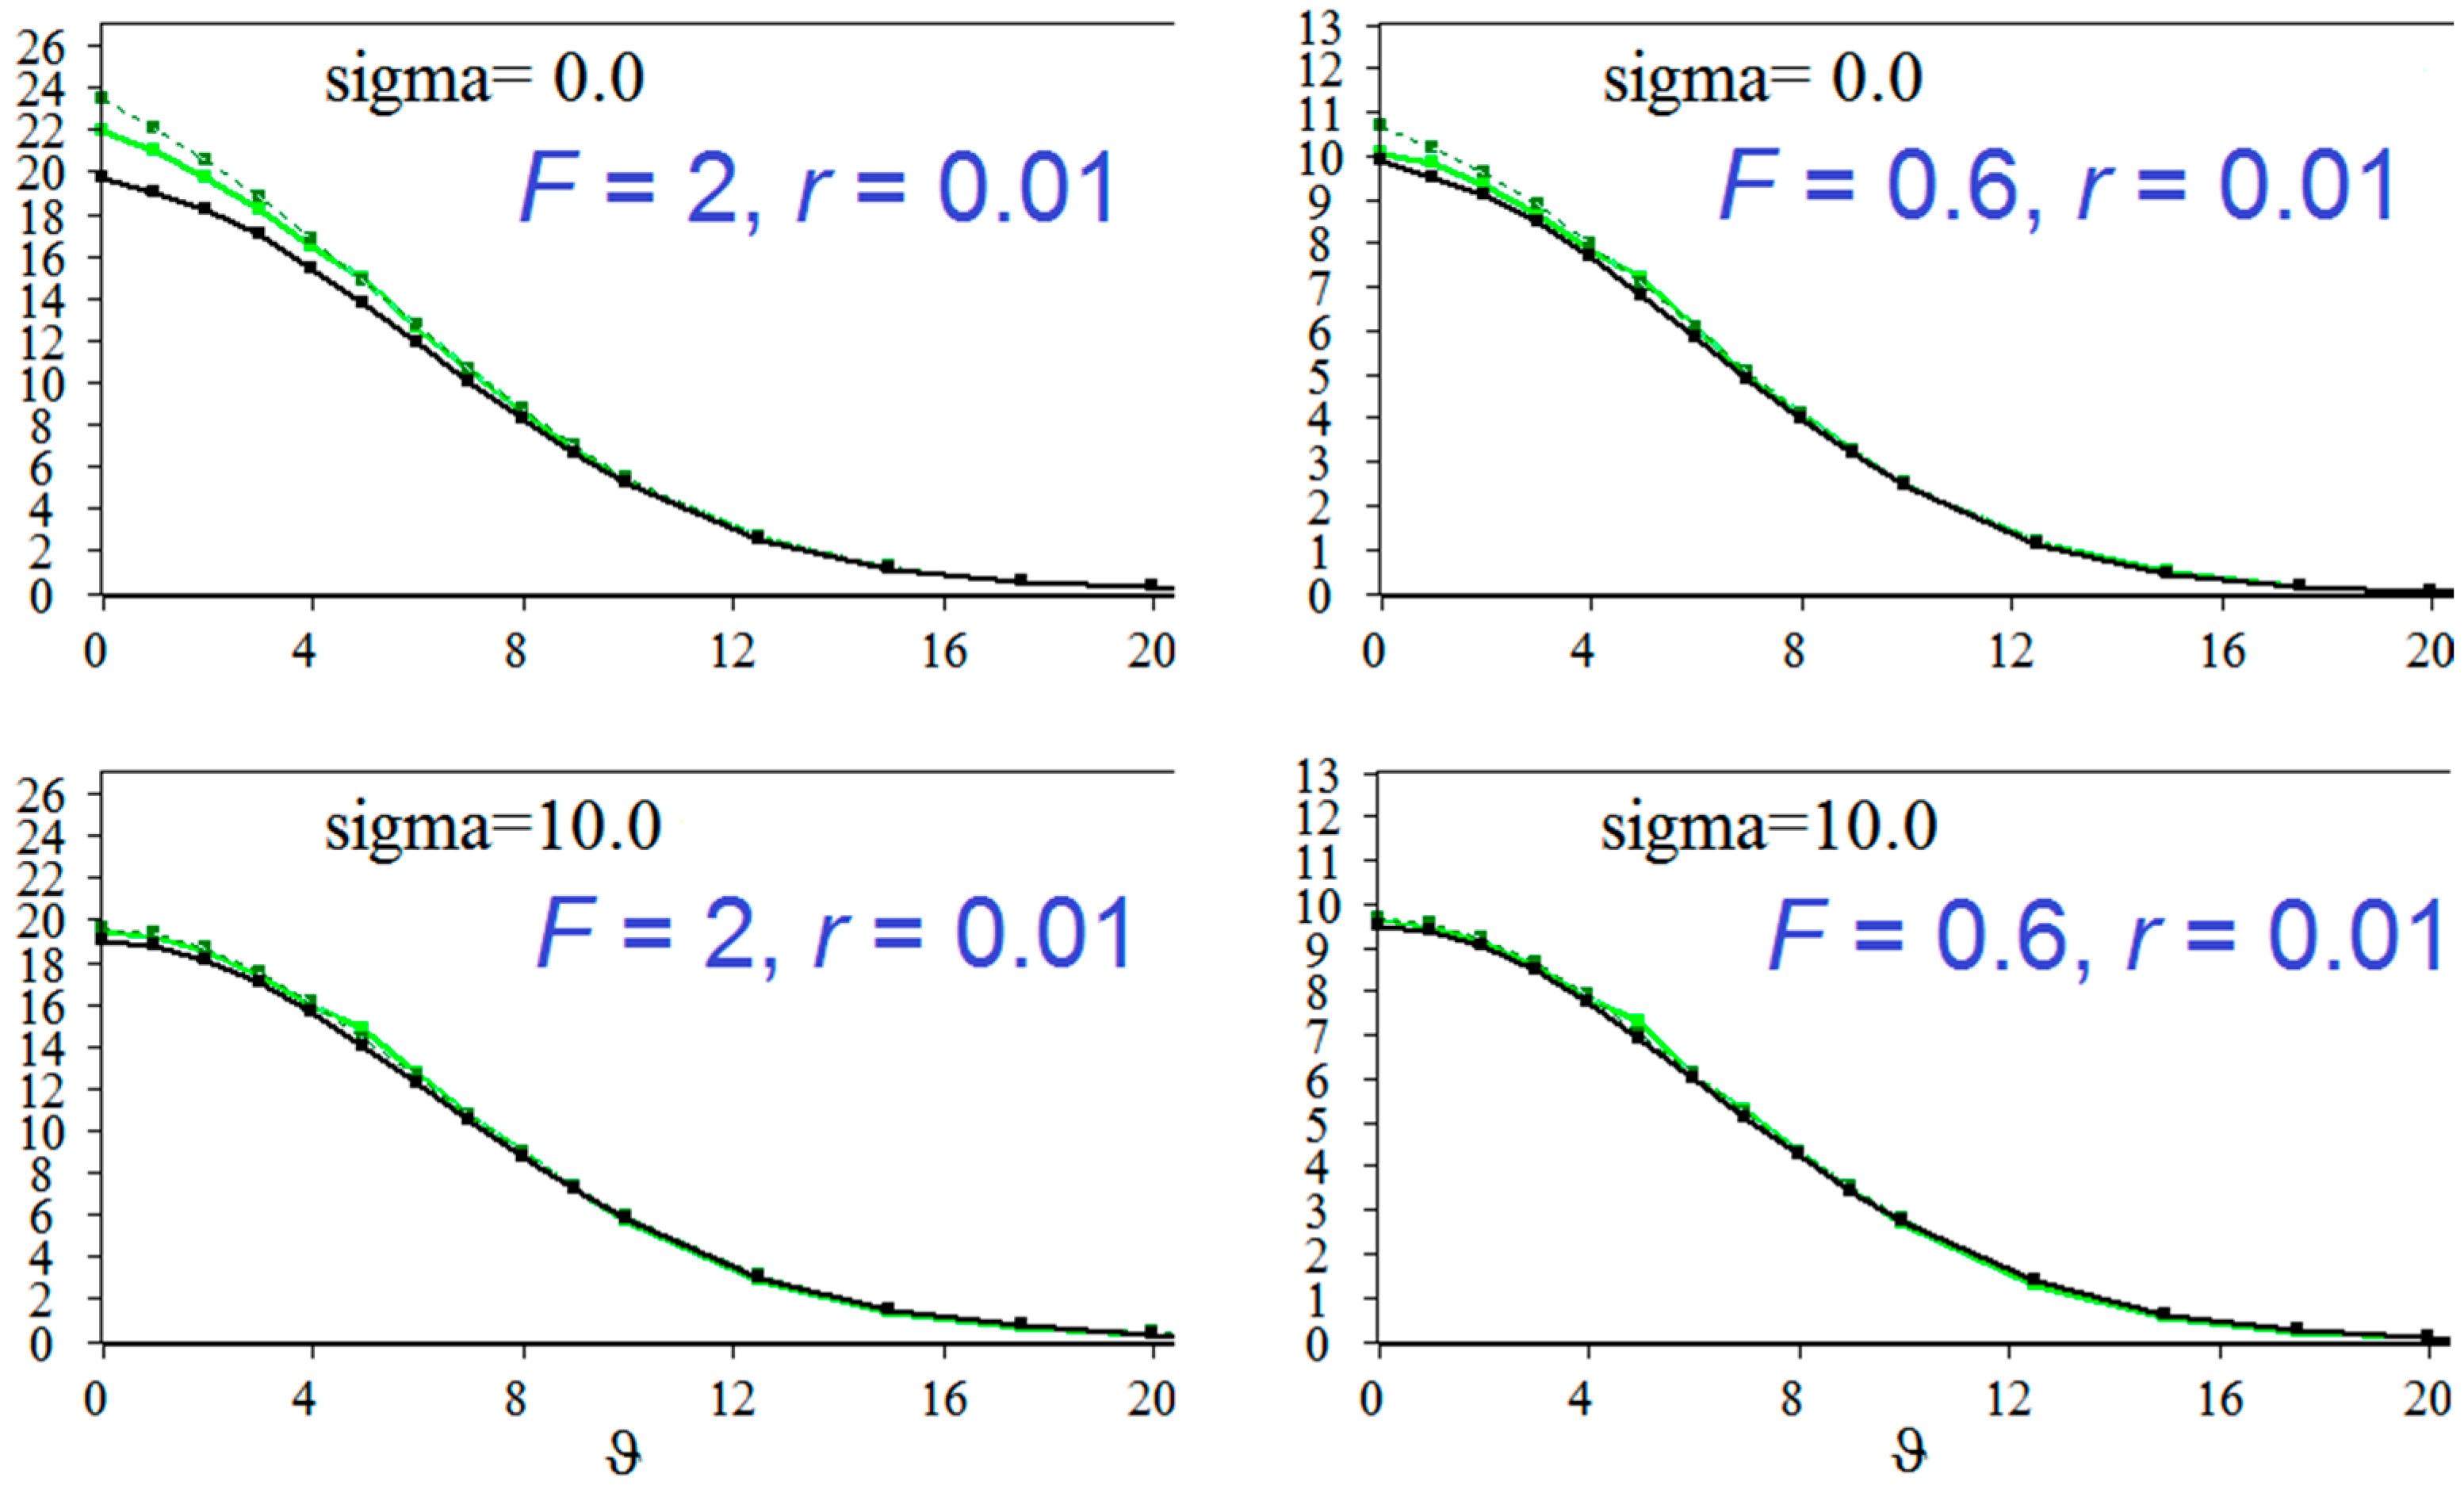
Figure 8 and
Figure 9 demonstrate that this is really so. The effect is more pronounced for opaque flakes (
Figure 8, top row) than for semi-transparent flakes (
Figure 9, top row). The effect is, however, gone for
(bottom rows of
Figure 8 and
Figure 9).
Again, the effect of size is much weaker for semi-transparent flakes than for the opaque ones.
It should be noted that the back scattering occurs for any
. It corresponds to
. Therefore, the first order BRDF for
must deviate seriously from the LTE results according to (18), for example, the difference can be up to twofold for
. However, this applies to the first-order BRDF, which for this angle is less than 10% of the full one. Meanwhile, for higher scattering orders, the reflected ray does not have a common point with the incident ray. Hence, it is spatially separated even if its direction is exactly opposite to the direction of incidence. Therefore, this effect does not apply to higher scattering orders while they dominate for, for example,
. This is why we do not see significant divergence of the two curves at this point (
Figure 9, bottom row).
5. Discussion and Conclusions
While the mainstream studies on the deviation of light scattering in dispersed media from the continuous medium approximation concentrate on the role of correlations between particles (such as their agglutination), we demonstrate that another mechanism exists in automotive paints with “effect pigments” (metallic and pearlescent paints). Here, the light scattering deviates significantly from the continuous medium approximation even in the absence of such correlations, i.e., when the particles of an “effect pigment” are homogeneously, evenly and stochastically distributed. The deviation is caused by correlations between subsequent light scattering events. We prove that this effect is very rough and exists whenever the flakes of “effect pigment” are aligned parallel to the paint surface. This effect is very widespread because such paints are always applied to achieve exactly this alignment.
Meanwhile, correlations between particles are a more subtle effect of chemical physics, usually caused by positive or negative mutual affinity of particles. This may or may not happen depending on many factors including surfactants. It is not always known if this will happen, and it is even a more rare case if we know it quantitatively (i.e., know the potential of interaction). In this case, predictions of its effect on the optical appearance can only be qualitative.
On the contrary, the effect investigated by us is rather rough and it is not related to the subtle interaction potential. It depends on the flake size (and the law of dependence is simple and close to analytical) and on alignment. If alignment is good, we can use the asymptotic. Thus, quantitative prediction is possible and we have provided nearly analytical laws that allow very accurate calculation. Moreover, being mostly simple analytical formulae, they allow you to “intuitively feel” the effect so that you can figure out what is going to happen, even without massive computations. It is noteworthy that at normal incidence and observation, the deviation from LTE is almost twofold even for tiny flakes, i.e., there is no simple convergence as the particle size goes to 0.
We have derived a correction term which makes the paint appearance calculated using LTE very close to that of the accurate model. If we apply this correction to the first scattering-order BRDF of the LTE approach leaving the higher orders unchanged, the sum will already be very close to the full accurate BRDF. The value of the derived analytical corrections is that they are more easy to obtain numerically and even admit some analytical approximation, while the accurate approach calculations (for individual flakes) are more difficult and time consuming.
Simulation and realistic visualization of pearlescent and metallic paints have direct and inverse problems. The direct problem is calculating how the paint with given composition looks under given illumination and observation directions. The inverse problem emerges when we are looking for the paint composition whose appearance is the closest to the target one. The latter problem is more interesting for the automotive industry. It always occurs when repairing a car body. For modern paint formulations, optical characteristics have many degrees of freedom, and the dimension of the paint matching problem increases to dozens of parameters, and it is almost impossible to adjust them by mixing several basic options. This problem is solved by minimizing the discrepancy between the target appearance and the one calculated by the simulation of the direct problem.
There have been attempts to solve the inverse problem basing on LTE, for example, the radiative transfer equation is used in optical tomography [
29]. For the paint visualization task, we have demonstrated that BRDF (visual appearance of paint) depends on the flake size. At the same time, LTE does not operate the flake size, and therefore cannot be used for the inverse problem of the automotive paint simulation. However, after application of our correction term, we have a “modified LTE” and can vary all parameters to find the composition for which the calculated BRDF best fits the measured one. Thus, we can solve not only the direct but also the inverse problem. This is a possible direction for future work.
This work continues [
7] where the first steps of this research were taken. Herein, the method is generalized and allows the flakes to vary in size and have a transmittance. However, there are still some limitations and assumptions. First of all, we considered only the case of perfectly aligned flakes. It is assumed that for non-aligned flakes, our method should work with less accuracy. Investigation of the influence of flake alignment on the method accuracy is one of the directions of future work. Another possible study is related to the influence of the flakes with a matte/diffuse surface. In our study, they are specular and do not have a diffuse component while in reality there exists partially diffuse flakes.

