Article

Analyzing the Impacts of Inbound Flight Delay Trends on Departure Delays Due to Connection Passengers Using a Hybrid RNN Model

1
Department of Industrial and Manufacturing Engineering, Florida A&M University-Florida State University College of Engineering, 2525 Pottsdamer St., Tallahassee, FL 32310, USA
2
Department of Scientific Computing, Florida State University, 600 W College Ave., Tallahassee, FL 32306, USA
3
Operational Efficiency, Copa Airlines, Panama 0816-06819, Panama
*
Author to whom correspondence should be addressed.
Mathematics 2023, 11(11), 2427; https://doi.org/10.3390/math11112427
Submission received: 7 April 2023 / Revised: 18 May 2023 / Accepted: 21 May 2023 / Published: 24 May 2023
(This article belongs to the Special Issue Modelling and Analysis in Time Series and Econometrics)

Abstract

:
Some delay patterns are correlated to historical performance and can reflect the trend of delays in future flights. A typical example is the delay from an earlier inbound flight causing delayed departure of a connecting and downstream outbound flight. Specifically, if an arriving aircraft arrives late, the connecting airline may decide to wait for connecting passengers. Due to the consistent flow of passengers to various destinations during a travel season, similar delay patterns could occur in future days/weeks. Airlines may analyze such trends days or weeks before flights to anticipate future delays and redistribute resources with different priorities to serve those outbound flights that are likely to be affected by feeder delays. In this study, we use a hybrid recurrent neural network (RNN) model to estimate delays and project their impacts on downstream flights. The proposed model integrates a gated recurrent unit (GRU) model to capture the historical trend and a dense layer to capture the short-term dependency between arrival and departure delays, and, then, integrates information from both branches using a second GRU model. We trained and tuned the model with data from nine airports in North, Central, and South America. The proposed model outperformed alternate approaches with traditional structures in the testing phase. Most of the predicted delay of the proposed model were within the predefined 95% confidence interval. Finally, to provide operational benefits to airline managers, our analysis measured the future impact of a potentially delayed inbound feeder, (PDIF) in a case study, by means of identifying the outbound flights which might be affected based on their available connection times (ACTs). From an economic perspective, the proposed algorithm offers potential cost savings for airlines to prevent or minimize the impact of delays.

Graphical Abstract

1. Introduction

1.1. Background

Predicting departure delays induced by inbound feeder flights is critical in airline operations management, particularly for airlines operating hub and spoke systems. When a feeder flight is delayed, connecting passengers may arrive late, potentially leading to delays in the outbound flight waiting for them. This delay can spread through the network, leading to longer delays and increased costs for the airline [1,2]. The delays in the feeder flights are not entirely random and can be learned from historical data. For example, passenger flows on an earlier flight on many days in summer may exhibit a relatively stable pattern in making connections at the hub when connecting a flight to a popular resort near the beach. Therefore, the trend of flight delays resulting from waiting for connecting passengers may be extracted from historical patterns. A reliable estimation/prediction of delay trend patterns reflected in the near future may help airlines anticipate future delay patterns and, thereby, allow managers to allocate resources to different priorities in advance.
Figure 1 illustrates the impact of multiple inbound flights that feed passengers to an outbound flight at a connection station. This delay can propagate through the network, resulting in longer delay times and increased costs for the airline.

1.2. Motivation

The prediction of departure delays caused by inbound feeder flights poses a critical challenge for airlines implementing hub and spoke systems. If a feeder aircraft experiences a delay, the timely arrival of connecting passengers may be compromised, potentially resulting in delays for the subsequent outbound flight. These delays have the potential to spread through the airline network, leading to longer delays and increased costs. Figure 1 visually shows the impacts of multiple inbound flights that transfer passengers to an outbound flight at a connection station. Consequently, such delays can propagate throughout the network, resulting in longer delays and increased costs for the airline.
The overall economic impact of airline delays is a critical aspect of the aviation industry, as highlighted in several studies [3,4,5,6,7]. The annual economic impact of airline delays was estimated to be $ 31.2 billion in 2010 [6], while other recent studies estimated these expenditures to be $ 40.2 billion [7]. According to a report from the Performance Review Unit (PRU) of Eurocontrol [8], each minute of primary delay generates 2/3 min of reactionary (induced) delay. The total cost of the flight, including crew, fuel, maintenance, aircraft ownership, and other costs, can range from approximately 59 to 85 euros for each minute of primary delay. The proposed algorithm has the potential to save airlines money by preventing or minimizing the effects of delays, and thus enhancing the economic performance of airlines.
Among the many delay studies, prediction of delay trends is essential for the airline industry to improve airline and airport operations and passenger satisfaction. An accurate prediction of delay trends in the near future (1–2 weeks ahead) allows passengers to adjust their travel plans so as to improve their overall travel experiences. Furthermore, an estimate of delay trends enables operations managers to make timely dispatch adjustments and reschedules, especially if dramatic delay increases or decreases are likely [9]. It should be noted that a delay trend analysis is not an estimated time of arrival (ETA). The delay trend focuses on exploring historical delays patterns to facilitate the arrangement of resources 1–2 weeks before the delay. Estimated arrival time is a valuable tool for real-time scheduling, providing useful information up to one day ahead of a delay. Extensive research has been conducted on the ETA and commercial tools are also available to facilitate its application.
This study proposes a hybrid GRU model to estimate departure delays and project their impacts on downstream flights. The model integrates a GRU model to capture the historical trend and a dense layer to capture the short-term dependency between arrival and departure delays. Data from nine airports in North, Central, and South America were used to train and tune the proposed model. The model outperformed alternative approaches with traditional structures in the testing phase. The study also considers downstream flight delays propagated by inbound feeders arrival delays, potentially helping airline operations managers prepare for possible schedule disturbances and congestion based on the impact of delayed feeder flights. The remainder of this paper comprises the following five sections. Section 2 reviews the state-of-the-art, while Section 3 explains the materials and methods. In Section 4, we present a case study, followed by the results and discussion in Section 5. Finally, Section 6 provides our conclusions.

2. State-of-the-Art

2.1. Delay Prediction

Previous attempts to estimate delays have used statistical and machine learning techniques to anticipate delays to mitigate their impacts on downstream flights. Machine learning algorithms, such as Bayesian modeling, random forest, and support vector machine, have been used to estimate the occurrence and magnitude of delays [10,11]. However, these studies have primarily focused on binary, or categorical, classification of delays, providing limited information on delay duration and combining long and short delays.
To address the limitations of binary and categorical classification, researchers have attempted to estimate the underlying causes of delays to establish relationships. For example, studies have used machine learning techniques on real-world traffic data to forecast taxi-out times in forecasting delay [12,13]. Improvement of prediction accuracy requires the development of more sophisticated models that account for the multiple factors that contribute to delays and their subsequent effects.
Using recurrent networks and long short-term memory (LSTM) has opened new opportunities to analyze and forecast temporal data related to flight delay prediction. RNN models have the potential to forecast propagation delays due to such models being able to learn time series data [14,15,16,17]. Hybrid RNN models, such as the convolutional LSTM (convLSTM) architecture and the gated recurrent unit (GRU) model, have successfully captured the historical trend and short-term dependency between arrival–departure delays. For example, ref. [15] used the convLSTM architecture to predict delays at multiple airports in China. In [16] a hybrid model was created that combines K-means, graph convolution neural network, bi-LSTM neural network, and a sequence-to-sequence framework to anticipate multistep-ahead flight delays across a network.
Several studies [18,19,20,21,22] have attempted to predict and analyze delay trends in the airline industry, allowing airlines and airports to implement the necessary adjustments to their operations and reduce the overall impact of delays on passenger experience. Traditional statistical models, such as time series analysis and regression, have been used to predict flight delays [23]. However, these methods have limitations in capturing complex nonlinear relationships and dynamic patterns in airline flight data. Machine learning methods, such as neural networks and convolutional neural networks, have been shown to outperform traditional models in predicting flight delays [24,25,26]. In particular, recurrent neural networks (RNNs), designed to handle sequential data, have been applied to the problem of predicting flight delay [27].
However, most previous work on flight delay prediction has focused on estimating the delay of individual flights rather than the trend of delays induced by delayed feeders. Recently, researchers have proposed methods to predict the impact of delayed feeders on downstream flights. In [28], a graph convolutional network was used to model the correlation between the feeders and the downstream flights in an airport network. In [29,30], a neural network was used to estimate the arrival delay of feeder flights and predict the impacts of delays on the departure delays of downstream flights. However, these methods do not explicitly model the historical trend of delays induced by feeders.
Recurrent Neural Networks (RNNs) have shown great potential to predict sequential data, such as time series [31,32,33]. Given the sequential nature of flight delay data, RNNs might prove an effective approach to forecasting delay trends in the airline industry. However, more research is needed to evaluate the effectiveness of RNNs compared to other machine learning techniques in predicting delay trends. Conducting further research in this area could significantly advance our understanding of the various elements that lead to flight delays and allow airline managers to take proactive steps to minimize the impacts of delays on their operations. Such a study could lead to significant improvements in the overall efficiency and performance of the airline industry.
After reviewing the literature, we identified a potential gap in the field of airline delay prediction related to the prediction of delay trends. Although various studies have been conducted on predicting flight delays, very few studies have focused on predicting the trend of delays for the next few weeks. This gap presents an opportunity for future research to develop more accurate models to provide airline managers with timely and relevant information to better manage delays.

2.2. Delay Propagation

In the aviation industry, flight delays can cascade, leading to delays and disruptions in subsequent flights. Several studies have applied statistical and machine learning methods to model and anticipate the propagation of flight delays. For example, Boswell et al. [34] proposed a statistical model to predict how delay from a single flight affects subsequent flight delays by the same aircraft. Similarly, Beatty et al. [35] introduced the concept of a delay multiplier to estimate the impact of propagation delay on airline schedules. Abdelghany et al. [36] calculated propagation delays for irregular operating conditions using historical data on taxi times, flight times, maintenance schedules, and regulatory rules.
More recently, researchers have used machine learning techniques to model the propagation of flight delays. Wong et al. [37] introduced the Cox proportional hazards model to construct departure and arrival delay models. This approach demonstrates how flight delay propagation can be modeled using repeated chain effects in aircraft rotation. In another study, Khan et al. [38] proposed a hierarchical integrated machine learning model to predict the duration and delay of aircraft departures, considering the downstream impacts of such delays.
Other studies have focused on developing recommendation systems and models to estimate airport delays caused by propagation effects. For example, Wong et al. [37] developed a recommendation system that uses historical data to identify similar past scenarios and forecast airport delays caused by propagation effects. Zoutendijk et al. [39] designed a model to estimate flight delays and integrate them into a probabilistic flight-to-gate assignment. Lastly, Zheng et al. [40] studied the buffer times related to arrival and departure delays to understand the effects of propagated delays.
However, most studies [37,38,39,40] have proposed machine learning and statistical methods to predict propagation delay. A potential gap in the literature is the need to estimate propagation delays that takes into account the available connection times between flights. Furthermore, limitations in ML research on the propagation of flight delays include data availability and quality, modeling complexity and uncertainty, and model performance and interpretability.

2.3. Gaps in the State-of-the-Art

We identified the following gaps in delay trend analysis:
  • The airline industry lacks the appropriate tools to assess the possible impacts of feeder delays on the flight network. Therefore, developing a reliable method to estimate the impacts of feeder delays on flights departing from connection airports is crucial. Such a method can estimate the impacts of feeder delays several days or weeks before flight departures. This approach would allow airlines to take proactive measures to mitigate the effects of feeder delays on their operations.
  • There is still room for improvement of data-driven algorithms for delay trend forecasting. Current state-of-the-art methods that utilize time-dependent networks and recurrent neural networks (RNNs) effectively handle time dependency, but face challenges in local variability in the data and the short-term relationship between arrival and departure delays. Although a dense network offers more flexibility, large network structures can require analyzing delay data over a long period of time, resulting in increased computational complexity and a higher risk of overfitting.

3. Materials and Methods

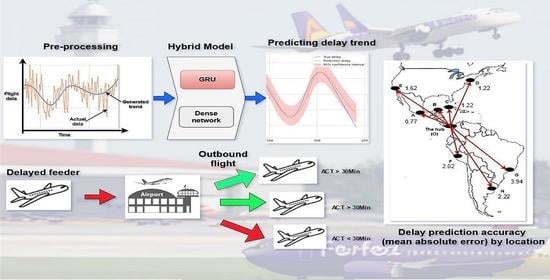
3.1. Overview of Methodology

The methodology section describes the proposed approach to predict flight delays using recurrent neural networks (RNNs). The historical delay behavior of a flight can help improve the prediction of a possible landing delay several days into the future. This delay dependence on past patterns facilitates prediction by recurrent neural networks, and, in particular, the latest version, the Gated Recurrent Unit (GRU). GRU models are a subclass of RNN models that can recognize and model time series memory, which is a crucial feature of some sequence data [41]. The GRU model is also known to be simpler with faster convergence and may learn nonlinear connections from the data without prior knowledge of the data structure. The following sections detail our proposed approach to delay trend analysis, forecasting, and delay propagation.
In contrast to GRU, the linear Autoregressive Moving Average (ARMA) and Autoregressive Integrated Moving Average (ARIMA) models must satisfy two assumptions, those of stationarity and seasonality [42]. Note that RNN/GRU models may also handle long-term dependencies and complicated patterns by handling the outputs of these as inputs for a following phase. This feature enables them to maintain a state from one iteration to the next [31]. According to several studies, RNN/GRU models can perform better than ARMA/ARIMA models for some time series data, including forecasting COVID-19 trends [32] and energy forecasting [33].
This paper presents a hybrid recurrent neural network (RNN) model that combines a GRU and a dense layer to accurately predict the trends of feeder delays and study their impacts on departure flights. The model takes in-flight data and extracts delay trends. The data are then scaled and sequenced during the preprocessing stage, after which the data serve to train the hybrid model, which is then used to forecast the trends of flight delays. These three stages are depicted in Figure 2.

3.2. Flight Data Preprocessing

Extracting flight delay trend: The flight delay data are often noisy and fluctuate over time. Delay trend refers to the long-term change in flight delays over time. It represents the systematic patterns and shifts observed in the delay data, typically spanning months or years. Our study describes the flight delay trend by a natural cubic spline, representing a smoothed approximation of the underlying long-term changes and patterns in the flight delay data. We fit a natural spline to the data to extract the underlying trend, as proposed in [43]. The natural spline is a piecewise cubic polynomial that reduces fluctuations in the data by smoothing them. The natural cubic spline is a piecewise cubic polynomial constructed by satisfying the following conditions: a continuous first and second derivative and a zero second derivative at the endpoints. This results in a linear curve at the endpoints with no bending moment at the endpoints. Figure 3 shows the smoothing characteristics of a natural cubic spline to extract the delay trend (blue) from the actual oscillating data (orange).
Let T = t 1 , t 2 , , t m denote the set of time points and Z = z 1 , z 2 , , z m the set of corresponding delay values. The natural cubic spline is a function g ( t ) defined as a piecewise cubic polynomial that interpolates the given data points ( t k , z k ) and satisfies the condition that g ( t ) = 0 at the endpoints t 1 and t m . The natural cubic spline is represented by
g ( t ) = k = 1 m β k M k ( t )
where β k are the coefficients and M k ( t ) are the cubic spline basis functions, k 1 , , p is the feature index. The natural cubic spline is a smooth function with less tendency to oscillate between successive data points than polynomial interpolation. The interpolated data sequence g ( t ) is stored in the data matrix D R m × p . The resulting data matrix D was used as input to the scaling step to prepare it for training our model.
Scaling: Data standardization, also known as scaling, is a preprocessing technique used to improve the performance of machine learning models by reducing the bias caused by the high variance of the data. Scaling is significant when dealing with delay data with different scales or a wide range of values, as in the flight delay data used in this study. Furthermore, outliers in the data can produce unrealistic mean and variance values, making it necessary to adopt other options, such as the median and interquartile range. Let D R m × p be the original delay data matrix, where m and p are, respectively, the number of samples and the number of features. The median and interquartile ranges of the k-th feature are defined as median k and IQR k , respectively. For this study, we selected the RobustScaler method [44,45], which sets the median to zero and, then, linearly scales the data to lie within the first and third quantiles. As a result, the scaled data became
D l , k = D l , k median k IQR k ,
where l 1 , , m denotes the sample index and k 1 , , p is the feature index. The resulting scaled data matrix, D , became the training sample for our model.
Converting delay time series data to supervised learning data format: The time series data D R m × p were converted to a supervised learning data format (input, target) using a sliding window technique. A fixed width sliding window ϵ is moved by a fixed step size, denoted by s, through the time series data. At each position of the window, the past s 1 time steps are used as the input sequence, denoted by S R ϵ 1 , and the current time step is used as the target variable, denoted by Γ R . The sliding-window technique creates a new matrix D R ( m ϵ s + 2 ) × ϵ 1 , where each row of D contains the input sequence S and the corresponding target variable Γ . This process is illustrated in Figure 4, where a sliding window width of five units and a sliding step size of a single time step were used for illustrative purposes. During the case study, several window sizes were evaluated to determine the optimal size for the given data.
This technique retains the order of the observations in the sliding window, thus, maintaining the temporal context of the data. However, a sequence of length ϵ was required to generate an input sequence for the target, with no associated predictions. Similarly, we discarded the last ϵ values of the series. The optimal window width depends on the complexity and size of the data.
Autocorrelation analysis of arrival and departure delay data: This section describes the autocorrelation analysis performed on the departure and arrival delay time series. Autocorrelation describes the degree of similarity between a time series and a lagged version of itself, measuring the dependence of the current value on past values.
We quantified the degree of autocorrelation in the delay time series with the autocorrelation function (ACF). At lag δ , the ACF becomes
ACF ( δ ) = t = δ + 1 n ( z t z ¯ ) ( z t δ z ¯ ) t = 1 n ( z t z ¯ ) 2 ,
where z t is the delay at time t, z ¯ is the mean delay, and n is the number of observations. To determine whether the signals exhibited memory, we ran an autocorrelation analysis of the departure and arrival delay time series. A significant correlation between the delays at time t and t δ , where δ was the lag time, indicated that the data exhibited memory effects.
The existence of correlation in the delay data provided evidence that the time series used in the analysis had memory and supported the use of RNN models, which are well suited to capture temporal dependencies in sequential data.

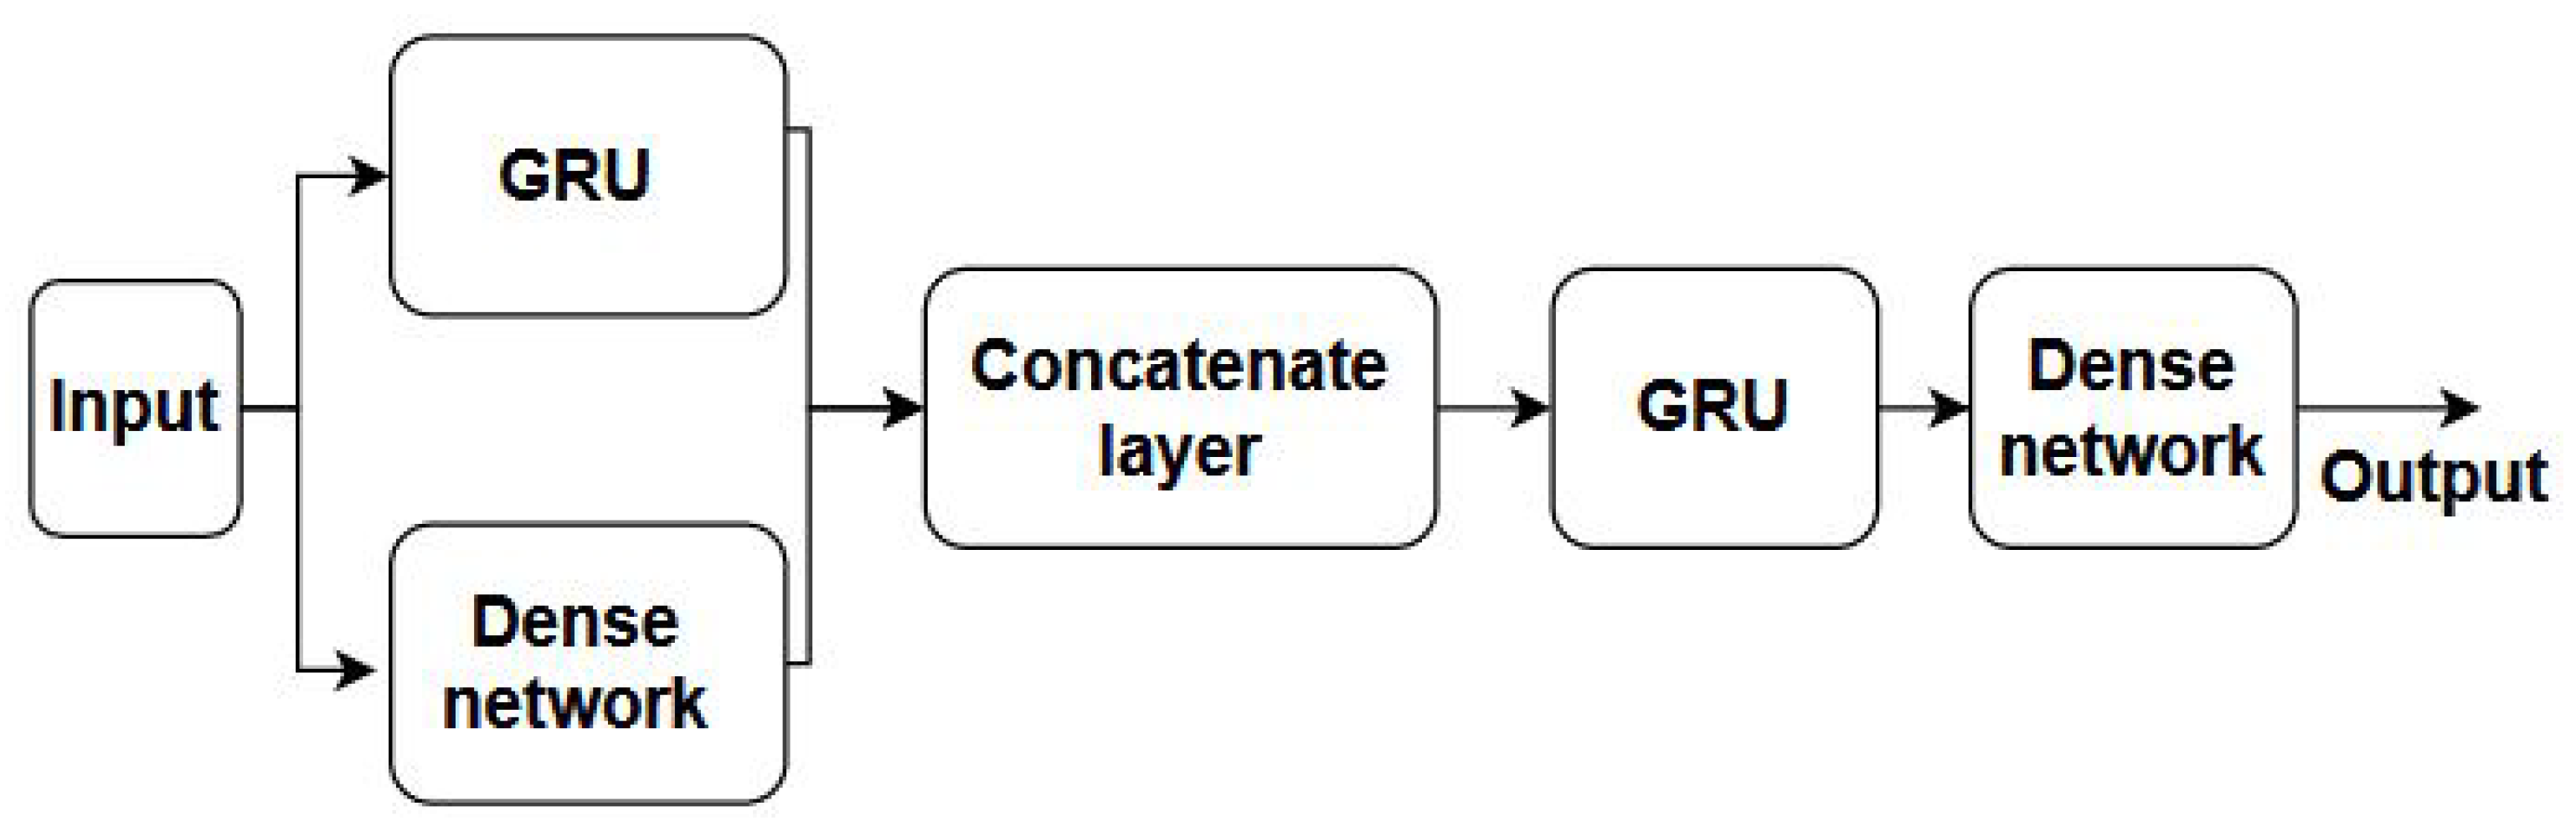
3.3. The Hybrid RNN Model

The proposed hybrid RNN model aims to capture the dependence of delays on short-term input and historical flight characteristics. The model consists of two branches: a GRU layer and a dense layer (see Figure 5).
The input data to the model is the matrix D , obtained from converting time series data into a supervised learning format process, as described in the previous section. At the input layer, the GRU branch learns the historical pattern of a flight delay, while the dense branch models the regression function that captures the effect of current input on arrival delays. The outputs of the two branches are concatenated and are represented by O = [ A , B ] R u + v , where A R u and B R v . The concatenated output is then fed into a second GRU layer, which predicts arrival delays. Parameters of the GRU are trained to aggregate historical behavior and short-term impacts of departure delays. Let A R u and B R v represent the outputs of a GRU layer and a dense network, respectively. Another GRU layer learns a parameter α R that aggregates the input from A and B as O = α B + ( 1 α ) A R c . The output of the GRU layer, O , is then fed into another dense layer to predict the delay of flight arrivals.

3.3.1. GRU

The GRU, a type of RNN, was used in the proposed hybrid model to predict arrival delays. The input data to the model was the matrix D , obtained by converting the time series data into a supervised learning format process, as described in the previous section. At the input layer, the GRU branch learned the historical pattern of a flight delay, while the dense branch modeled the regression function that captured the effect of current input on arrival delays. GRU was proposed by Cho et al., in [46], as a solution to the problem of vanishing gradients in recurrent neural networks, while also capturing short-term memory effects. GRU consists of two gates, one for resetting and one for updating, making it more efficient than Long Short-Term Memory (LSTM). The internal cell operations of the GRU are illustrated in Figure 6. The reset gate r t , the update gate z t , the candidate activation ν t , and the activation h t were calculated using sigmoid, hyperbolic tangents, element-wise multiplication functions with weight matrices W r , W z , W ν , and bias vectors b r , b z , b ν in Equation (4).
r t = σ ( W r · [ h t 1 , x t ] + b r ) z t = σ ( W z · [ h t 1 , x t ] + b z ) ν t = tanh ( W ν · [ x t , h t 1 ] + b ν ) h t = ( 1 z t ) ν t + z t h t 1 ,
where W and b are the weight and bias matrix, respectively. The operator “⊙” denotes element-wise multiplication.

3.3.2. Dense Network

The dense network in the proposed hybrid model is a fully connected feedforward network consisting of an input layer, a hidden layer, and an output layer. In this architecture, each neuron in the input layer is connected to every neuron in the first hidden layer, and so on, until the output layer. The input to the dense branch of the hybrid model is the current input data D . The outputs of the dense branch, denoted by B R v , are passed to the second GRU layer. A dense layer in a fully connected feedforward network refers to all-to-all connectivity. The intermediate output Y R η is calculated as:
Y = σ ( W X + b )
where X R ρ is the input, W R ρ × η is the weight matrix, b R η is the bias vector and σ is the activation function (sigmoid). The final output Z R λ is then calculated as:
Z = U Y
where U R λ × η is the output weight matrix.

3.4. Model Deployment

Using a training set, the hybrid model utilized in this study was trained to predict arrival delay patterns. The incoming data flow D was preprocessed by extracting trends, scaling, and conversion to a format suitable for supervised learning. The model architecture incorporates a dense layer and a GRU layer. The model hyperparameters, such as training, validation, testing splits, number of epochs, batch size, and sliding window size, were tuned for optimal model performance. Once the training procedure reached convergence, the model was evaluated with a separate test data set to estimate delays given the historical data.
To establish the confidence interval of the model, the mean absolute error ( Δ ) was calculated using Equation (7). The mean absolute error is the average difference between the predicted x ι and the true values z ι of the test set.
Δ = ι = 1 n z ι x ι n
A 95% confidence interval (CI) was established using the t distribution for the mean absolute error of the delay predictions, as shown in Equation (8). The confidence interval indicates the range within which the true mean absolute error of the model is likely to lie.
C I = Δ ± Γ × ζ n
In Equation (8), Γ is the t-value corresponding to the confidence level, ζ is the sample standard deviation, and n is the total sample size in the test set.
In general, the model deployment phase provides the steps taken to train, validate, test, and establish the confidence interval for the hybrid model. These steps were essential to predict the patterns of arrival delays and to analyze their impacts on departure delays.

3.5. The Impact of Potentially Delayed Inbound Feeders (PDIFs) in the near Future

In this section, we apply the hybrid RNN model to develop a tool that determines whether PDIFs have significant impacts on outbound flight departures in the near future, based on passenger connection data (Figure 1) and the corresponding available connection times (ACTs). The study used the true arrival time of a flight to calculate the ACT for each connecting flight. The available connection time refers to the minimum amount of time required to make a connecting flight after the true arrival of a previous flight, given the departure time of the connecting flight. This allows an accurate determination of whether an airline has enough time to make a connection, based on the actual arrival time of the previous flight. ACT is an important factor to consider when predicting flight delays, as a short ACT can increase the probability of a missed connection and lead to delays for subsequent flights. Accurate prediction of potential delays and analysis of true arrival times can allow airline managers to take proactive measures to mitigate the impacts of delays and to improve overall customer satisfaction. The impact calculation for PDIF proceeds as follows:
Step 1:
Determine the most delayed PDIF by count during the last M months.
Step 2:
Obtain weekly outbound flights from PDIF based on passenger connections in the next n weeks.
Step 3:
Calculate the impact of PDIF:
(a)
Understand the delay pattern of PDIFs over the past months and predict if PDIFs will be delayed in the next n weeks, using the proposed hybrid RNN model.
(b)
Enumerate the number of times that the ACT for the connected outbound flight is estimated to be less than i minutes, due to PDIFs in the next n week. Let N be the set of future weeks (i.e., {1,2,…n}; Ω be the set of connected outbound flights of PDIF (that is, A, B,…, H); R n be the arrival delay of PDIF as predicted by the hybrid RNN model in week n; T n k be the nominal connection time between the inbound feeder and the connected outbound flight k in week n, where k K . The future impact of PDIF is calculated in Equation (9) using the indicator function.
n N 1 ( T n ω R n < i m i n s ) , ω Ω

4. Case Study

4.1. Data Source

Airline data from a single hub and eight destination airports in North, Central, and South America were used to train the delay prediction model (Figure 7). Data were obtained from a commercial airline with permission for research purposes. The dataset includes flight information such as flight number, departure time, arrival time, origin and destination airport, and departure and arrival.
Several steps were taken to ensure data quality during the data collection process. First, data was obtained from a single airline to ensure data format and quality consistency. Second, for each airport, a regular weekly flight was considered. Finally, the data was cleaned to remove flights with missing or incomplete information. In regard to the number of flights and the time span covered, 453 flight records were collected from Airport D and cleaned to train and evaluate the delay prediction model.
The geographical locations of the hub and destination airports are shown in Figure 7. The historical delay patterns of each origin–destination (OD) pair were used to train the delay prediction model.
A statistical analysis of the data indicated that arrival delays at the destination airport, for example, Airport D, were normally distributed around mean zero. Further analysis revealed that a significant proportion of flights, approximately 84.7 % , recorded delays in the range of [−20, 20] min, with an equal number of early and delayed arrivals. In particular, 56.7% of flights from the hub to the destination Airport D recorded delays between −10 and 10 min, which meant they did not meet the FAA standard of being “delayed.” The histogram in Figure 8 represents the distribution of arrival delays at Airport D.

4.2. Models for Comparison

This study compared the proposed hybrid model (Figure 5) with other widely applied and accepted models, including dense layer, LSTM, and GRU. These models were selected because they have been shown to perform well in time-series prediction tasks.
To perform the comparison, this study used the same input data that contained a series of departure and arrival delays for each Origin–Destination (OD) pair (Figure 9). Specifically, the input data is a matrix D R n × 2 , where n is the number of time steps. The columns of D consist of the departure delay followed by the arrival delay.
All models were trained on the same data splits using the same training parameters and platform. Each model was connected in parallel to the input data D , and the output of each model was a sequence of predicted delays in minutes at each time step. The models were evaluated based on several accuracy metrics between predicted and actual arrival delays, calculated from a test set of flights.
The proposed hybrid model, which combines the strengths of the dense layer and GRU models, can recognize and model effects embedded within a time series. This is a crucial feature of some sequence data, such as flight delays, with high temporal dependence. In addition, our hybrid model is simpler, with faster convergence, and can learn nonlinear connections from data without previous knowledge of the data structure.
In contrast, the dense layer model is a basic neural network that contains only fully connected layers. It lacks memory of past data, which is required to accurately predict flight delays. The LSTM and GRU models are RNN models that can recognize and model memory within a time series, but differ in how to update and forget past data.
Overall, the proposed hybrid model had advantages over traditional models. This study provides a detailed comparison of their performance in the Results section.

4.3. Data Exploration and Preprocessing

To better visualize and understand the data, Figure 10 shows the actual arrival and departure delays of a sample destination airport (Airport D). Delay data fluctuate and are noisy. Therefore, a natural cubic spline was applied to arrival and departure delays to extract delay trends. As shown in Figure 10, the natural cubic spline takes noisy delays (orange) and produces a smooth delay trend (blue).
Flight time steps refer to the discrete intervals at which flight data is recorded and analyzed. These time steps were used to represent the sequential nature of the flight data in a time series format. Each flight time step was one week.
The spline reduces the noise level in the data and speeds up convergence. Smoothness is controlled by the degrees of freedom in the spline function. When the degree of freedom is too low, the curve becomes “stiff”. Although very smooth, it does not fit the actual delays well. However, a large degree of freedom gives the curve high flexibility and tends to pass through every data point, and, hence, it loses its smoothness. In this study, a natural cubic spline with 20 degrees of freedom smoothly interpolated the actual arrival and departure delay data, as shown in Figure 10.
Scaling and converting time series data to the supervised learning data format were conducted once the data were cleaned during preprocessing. A scaling technique known as “RobuScalar” was used to avoid the undesired consequences of ordinary scalars. The final step of the preprocessing stage consisted of data restructuring. The applied sliding window method effectively changed 2D data to 3D data by restructuring sequences into windows. The main benefit of the restructuring was the conversion of the time-sequence flight data into a supervised learning data format with input and target values. Each window (of dimension 30 × 2 ) covered a 30 week arrival and departure delay for each OD pair. The target data corresponded to the flight’s arrival delay on the 31st week.

4.4. Experimental Setup and Training

The model was trained and tested on Google Colab using Python 3.7.13 and TensorFlow 2.8.0. The model has 3061 trainable parameters that were updated during the training process. For Airport D, the training process was carried out with a batch size of 20 over 32 epochs. During training, 181 flights (40%) of the data were used for training (Figure 11), of which 20% were set aside for validation. A set of 272 flights (60%) of the total data were used to test the performance of the model. The training process was terminated once the model converged to acceptable levels of training and validation losses.

5. Results and Discussion

5.1. Experimental Results

5.1.1. Autocorrelation Analysis

The autocorrelation analysis indicated a significant correlation between delays at times t and t δ for departure and arrival delays. The correlation was strongest for a small lag ( δ ) and decreased as the lag time increased. For example, the autocorrelation of departure delay at Airport D (Figure 12) was the highest for small lag values ( δ ) and decreased to 0.3 at lag 20. Similarly, the autocorrelation of arrival delays was strong for small lags and decreased to 0.38 for a time lag of 20.
These results provide evidence that delay time series have memory and exhibit temporal dependencies that support the use of GRU models to predict future delays. A strong autocorrelation at small lags suggests that a current delay can be a reliable indicator/predictor of delays in the immediate future. This assumption is based on the fact that the factors that caused the delay in the current period are likely to affect the flight in the next period.
Overall, these results suggest that a GRU model can effectively predict future delays based on historical data. However, additional research is required to determine the optimal model parameters and to assess the model’s efficacy on a larger and more diverse dataset.

5.1.2. Delay Prediction

Model training, parameter optimization, and model restructuring were performed to improve prediction accuracy and reduce data requirements without sacrificing precision. The proposed model was trained using the same training data and hyperparameters as those mentioned above. Training and validation losses were plotted to monitor training progress. Figure 13 shows the training and validation losses over epochs during the training process. As seen in the figure, both the training and validation losses dropped from their initial values of 0.3 and 0.5, respectively, to almost zero by the end of the training phase. This convergence indicates that the model converged well without overfitting. The hybrid nature of the algorithm, in which one branch learns the short-term effect of departure delay and the other branch learns the historical flight delay patterns, reduced the complexity of the model, the learning effort, and data requirements. As little as 40%, or even fewer, training data were sufficient to achieve satisfactory prediction results, provided that the training data were a representative sample of the given flight data. Figure 14, shows the results of the prediction of arrival delay in Airport D plotted against actual delays. Figure 14 also shows the 95% confidence bands of the delay. The plot clearly shows that the model could accurately predict delays. Flight delays are not periodic. Although the data lack periodicity, we believe that there is a pattern in the historical data that could be learned using our hybrid model. In all other airports in this study (A, B, C, E, F, G and H), despite differences in destination, geographic location, and duration of flight, our model exhibited performance similar to that for Airport D (Figure 14). In the following sections, the results of Airport D are presented for analysis and comparison with other models.
Our results indicate that the model performs well, even with a delay close to zero. As shown in Figure 14, in all instances where the actual delay was close to zero, the model predicted a delay with an error of less than 2 min. This suggests that the hybrid RNN model can distinguish between delayed and on-time flights, even when there is little delay in the data.

5.1.3. Comparison with Other Traditional Models

In this section, we describe some comparisons of the proposed hybrid model with traditional networks. Figure 15 demonstrates the prediction accuracy of the LSTM model trained on the same data as our proposed model. Similarly, Figure 16 shows the results for the GRU model and Figure 17 shows the performance of the dense layer model.
Table 1 shows the results of various metrics used to evaluate the performance of the proposed hybrid RNN model, together with the LSTM, GRU, and dense layer models. These metrics were MAE (Mean Absolute Error), MSE (Mean Squared Error), RMSE (Root Mean Squared Error), MAPE (Mean Absolute Percentage Error) and R-squared. The values of these metrics indicate the accuracy of the model in predicting flight delays. Lower values for MAE, MSE, RMSE, and MAPE and higher values for R-squared indicate better performance.
As can be observed in Table 1, the proposed hybrid RNN model outperformed the other models in all metrics, achieving the lowest MAE, MSE, RMSE, and the highest R-squared value. LSTM was the worst, with the highest MAE, MSE, and RMSE values and the lowest R-squared value. The GRU and dense layer models performed better than the LSTM model, but worse than the proposed hybrid RNN model.
Regarding numerical values, the hybrid RNN model achieved an MAE of 1.218, significantly lower than the MAE of the other models (LSTM: 3.370, GRU: 1.588, Dense layer: 2.803). Similarly, the hybrid RNN model achieved the lowest MSE and RMSE values of 2.297 and 1.516, respectively, while the other models had higher MSE and RMSE values. Additionally, the hybrid RNN model achieved the highest R-squared value of 0.928, indicating a better fit to the data than the other models. Overall, the proposed hybrid RNN model outperformed the other models.
The hybrid RNN model combines the strengths of RNN memory and dense models to achieve better performance in predicting flight delay trends. RNN memory allows the model to learn and capture temporal dependencies and long-term trends in flight delay data. At the same time, dense layers help to learn the short-term dependence on the data. The ability of the hybrid RNN model to accurately predict trends in flight delays can lead to improvements in airport operations, as it allows better planning and decision making, ultimately improving the passenger experience. For example, airlines can adjust their schedules and staffing based on predicted delays. Airport operations can also use this information to optimize resources and minimize delays.
The accuracy of arrival delay prediction is crucial in estimating the impact of inbound feeder delays on downstream flights. As mentioned above, this study considers the delay of downstream flights propagated by the arrival delay of the inbound feeders. This delay can squeeze the ACT and increase the likelihood of delays in catching connecting passengers. The proposed hybrid model achieves a mean absolute error of 1.218, lower than the errors reported by the LSTM and GRU models. This improved accuracy can help airline operations managers better understand how inbound feeder delays can affect upcoming flights. By estimating the number and severity of delays in the future, the model can inform airlines and airport managers about the impact of feeder flights and help them prepare for possible schedule disturbances and congestion. In the following sections, we use the proposed model to estimate the impact of PDIFs on downstream flights and demonstrate how our approach can provide valuable insights for airline and airport operations.

5.1.4. Future Impact of PDIFs

This study demonstrates the applicability of a hybrid model to create an impact estimation tool. We considered four outbound flights that commonly receive passengers from feeders and are scheduled for PDIFs in the next two months. Based on training data, this case study predicted the arrival delays of PDIFs for the next two months. Figure 18 compares the actual and predicted arrival delays, highlighting the performance of our proposed model. In Figure 19, the effects of arrival delay of a PDIF on the available connection time (ACT) for four outbound flights A, B, C, and D were investigated. The scheduled connection times were 35, 40, 38, and 45 min for A, B, C, and D, respectively. The red bar in Figure 19 indicates instances where the ACT was below the specified alarm threshold (PAT) of 30 min.
The analysis showed that the delays of the PDIF affected outbound flights differently, with flight A affected the most and flight D the least. Therefore, prioritizing mitigation of the delay of a PDIF was crucial for flight A to prevent possible disruptions in its scheduled operations. The analysis recommended that the airline explore alternative options to reduce the impact of PDIF delays on flight A.
In Figure 20a, we present the future impact of PDIFs on outbound flights for the next two months, with each outbound flight affected by PDIFs represented by a different color. Figure 20a enables us to observe which outbound flights had the shortest ACTs due to PDIF delays.
Figure 20b shows the interquartile range of the ACT shrinkage in minutes for each outbound flight. The results showed that the outbound flight to Airport D experienced a lower impact than the other three flights.
The statistical analysis in Figure 20b complements the information presented in Figure 20a, providing further insight into outbound flights constantly affected by PDIF delays over the next two months. These findings could help the airline prioritize mitigation strategies and improve operational efficiency by focusing on the flights most affected by PDIF delays.

5.2. Discussion

Autocorrelation analysis shows a significant correlation between the delay at time t and the delay at time t δ for both departure and arrival delays. The correlation was strongest for small lag times and decayed as the lag time increased. This finding is consistent with previous studies [47,48] and supports the hypothesis that there is a temporal pattern in flight delays.
The findings of this study demonstrate the effectiveness of the proposed hybrid model as an impact forecasting tool, considering potential delays of inbound feeder flights (PDIFs) and the available connection times (ACTs) for passengers. In this case study, four outbound flights commonly receiving passengers from feeders were selected for analysis to predict the arrival delays of PDIFs for future flights. The performance of the proposed model was evaluated by comparing the actual and predicted arrival delays. Furthermore, we investigate the impact of PDIF arrival delay on the actual connection time in the future, assuming a nominal connection time between a PDIF and the four outbound flights. The results showed that the proposed model could provide valuable information on airline and airport operations by estimating the potential impact of PDIF delays on the available connection times for passengers.
As highlighted in several studies [3,4,5,6,7], the economic impact of airline delays is a critical aspect of the aviation industry. For example, the United States has one of the world’s largest domestic civil aviation markets, valued at US $ 179 billion, with the top four airlines accounting for 67% of total domestic revenue [3]. Eurocontrol’s Performance Review Unit (PRU) [8] reports that the total unit cost per minute of delay, including crew, fuel, maintenance, aircraft ownership, and other costs, can range from EUR 59 to EUR 85 for each minute of primary delay. Furthermore, on-time performance is a critical factor in consumer perception and choice of airline, according to [4]. Our algorithm improves on-time performance and positively impacts the economic performance of airlines.
The hybrid model proposed in this study shows promise in predicting flight delays and estimating their impacts on downstream flights. However, the following limitations must be considered: The historical data used to train the model may not capture all potential factors that could affect flight delays, which could affect the accuracy of predictions. The model cannot be used directly for predictions after a significant global event, such as a pandemic, as it would require retraining with new data. Data that represent the new travel patterns resulting from transients due to a pandemic may not be available. The model may not be suitable to account for rare events, such as major storms or equipment failures that can cause significant disruption to air travel. The model does not address the underlying causes of flight delays. Despite these limitations, the hybrid model shows great potential to improve airline and airport operations. More research is needed to develop more accurate models that can account for a broader range of factors and be applied to a more comprehensive range of airports and routes.

6. Conclusions

The main objective of this study was to forecast the trends of flight delays and analyze their propagation. The late arrival of an inbound flight leads to a late departure and, subsequently, to the late arrival of the next outbound flight. If an inbound flight is delayed, the outbound flight may depart late due to waiting for connection passengers. Such relationships may exhibit patterns that can be learned from historical data. Understanding this historical pattern of delays and propagation delays can help airlines anticipate future delay patterns and enable managers to reduce negative effects by better allocating resources. To capture the patterns in the historical data, we proposed a hybrid RNN model to learn the historical pattern of propagated delays so as to anticipate delay patterns in the future.
The proposed method first fits a natural smoothing spline to deal with fluctuations in the actual data. This study designed a hybrid model that combines the GRU with a dense network that feeds information to another GRU to estimate delay trends based on historical data. The proposed model first decomposes the delay into historical trends and local variations, followed by three stages of learning. First, the dense network branch learns the same-day variability in the input data. Second, GRU’s unique ability enables the second branch to learn the historical behavior of the flight. Finally, the attention mechanism within the GRU effectively learns to combine the outputs of both branches to finalize the delay modeling.
We trained the proposed hybrid model on training data and tested it on separate data. Our model led to rapid convergence, with training and validation losses dropping to close to zero. Furthermore, the model accurately predicted delays and most of the forecasts fell within the established 95% confidence band. Finally, the study indicates that PDIFs can significantly impact the ACTs of outbound flights. The impacts vary for different flights, with certain flights more strongly affected than others. These results underscore the importance of forecasting and analyzing delay propagation patterns for better airline management and efficient operations. Airlines can gain an advantage by strategically allocating flight resources in advance to mitigate the costs associated with flight delays. The results demonstrate that our historical pattern analysis can help airlines better prepare for possible delays propagating throughout flight networks by pre-allocating resources with different priorities.
In conclusion, the proposed hybrid model is a promising approach to accurately predict flight delays and estimate their impacts on downstream flights. The findings of this study can provide valuable insights for airline and airport operations, and future research should explore the generalizability of the proposed model to other airports and regions. It is important to note the limitations of this study and the need for further research to validate and expand upon the findings.

Author Contributions

Conceptualization, T.O.Y., A.-T.W., G.E., H.W. and M.G.T.; methodology, T.O.Y., A.-T.W., G.E., H.W. and M.G.T.; software, T.O.Y. and A.-T.W. All authors have read and agreed to the published version of the manuscript.

Funding

This research was funded by Copa Airlines through Copa-FSU Partnership Project.

Data Availability Statement

Data and code will be available in a publicly accessible repository after acceptance of the manuscript.

Conflicts of Interest

The authors declare no conflict of interest.

References

  1. Brueckner, J.K.; Czerny, A.I.; Gaggero, A.A. Airline delay propagation: A simple method for measuring its extent and determinants. Transp. Res. Part B Methodol. 2022, 162, 55–71. [Google Scholar] [CrossRef]
  2. Wu, C.L. Airline Operations and Delay Management: Insights from Airline Economics, Networks and Strategic Schedule Planning; Routledge: London, UK, 2016. [Google Scholar]
  3. Arora, S.D.; Mathur, S. Effect of airline choice and temporality on flight delays. J. Air Transp. Manag. 2020, 86, 101813. [Google Scholar] [CrossRef]
  4. Mazzeo, M.J. Competition and service quality in the US airline industry. Rev. Ind. Organ. 2003, 22, 275–296. [Google Scholar] [CrossRef]
  5. Peterson, E.B.; Neels, K.; Barczi, N.; Graham, T. The economic cost of airline flight delay. J. Transp. Econ. Policy 2013, 47, 107–121. [Google Scholar]
  6. Ball, M.; Barnhart, C.; Dresner, M.; Hansen, M.; Neels, K.; Odoni, A.; Peterson, E.; Sherry, L.; Trani, A.; Zou, B. Total Delay Impact Study: A Comprehensive Assessment of the Costs and Impacts of Flight Delay in the United States; University of California: Riverside, CA, USA, 2010. [Google Scholar]
  7. Ferguson, J.; Kara, A.Q.; Hoffman, K.; Sherry, L. Estimating domestic US airline cost of delay based on European model. Transp. Res. Part C Emerg. Technol. 2013, 33, 311–323. [Google Scholar] [CrossRef]
  8. Performance Review Report (PRR) of Eurocontrol. Cost of Air Transport Delay in the EU; Eurocontrol: Brussels, Belgium, 2014. [Google Scholar]
  9. Xu, J.; Wang, W.; Gao, Z.; Luo, H.; Wu, Q. A Novel Markov Model for Near-Term Railway Delay Prediction. arXiv 2022, arXiv:2205.10682. [Google Scholar] [CrossRef]
  10. Khaksar, H.; Sheikholeslami, A. Airline delay prediction by machine learning algorithms. Sci. Iran. 2019, 26, 2689–2702. [Google Scholar] [CrossRef]
  11. Venkatesh, V.; Arya, A.; Agarwal, P.; Lakshmi, S.; Balana, S. Iterative machine and deep learning approach for aviation delay prediction. In Proceedings of the 2017 4th IEEE Uttar Pradesh Section International Conference on Electrical, Computer and Electronics (UPCON), Mathura, India, 26–28 October 2017; IEEE: Piscataway, NJ, USA, 2017; pp. 562–567. [Google Scholar]
  12. Lee, H.; Malik, W.; Jung, Y.C. Taxi-out time prediction for departures at Charlotte airport using machine learning techniques. In Proceedings of the 16th AIAA Aviation Technology, Integration, and Operations Conference, Washington, DC, USA, 13–17 June 2016; p. 3910. [Google Scholar]
  13. Herrema, F.; Curran, R.; Visser, H.; Huet, D.; Lacote, R. Taxi-out time prediction model at Charles de Gaulle airport. J. Aerosp. Inf. Syst. 2018, 15, 120–130. [Google Scholar] [CrossRef]
  14. Kim, Y.J.; Choi, S.; Briceno, S.; Mavris, D. A deep learning approach to flight delay prediction. In Proceedings of the 2016 IEEE/AIAA 35th Digital Avionics Systems Conference (DASC), Sacramento, CA, USA, 25–29 September 2016; IEEE: Piscataway, NJ, USA, 2016; pp. 1–6. [Google Scholar]
  15. Ai, Y.; Pan, W.; Yang, C.; Wu, D.; Tang, J. A deep learning approach to predict the spatial and temporal distribution of flight delay in network. J. Intell. Fuzzy Syst. 2019, 37, 6029–6037. [Google Scholar] [CrossRef]
  16. Bao, J.; Yang, Z.; Zeng, W. Graph to sequence learning with attention mechanism for network-wide multi-step-ahead flight delay prediction. Transp. Res. Part C Emerg. Technol. 2021, 130, 103323. [Google Scholar] [CrossRef]
  17. Zhu, X.; Li, L. Flight time prediction for fuel loading decisions with a deep learning approach. Transp. Res. Part C Emerg. Technol. 2021, 128, 103179. [Google Scholar] [CrossRef]
  18. Gopalakrishnan, K.; Balakrishnan, H. A Comparative Analysis of Models for Predicting Delays in Air Traffic Networks; ATM Seminar: Savannah, GA, USA, 2017. [Google Scholar]
  19. Dalmau, R.; Genestier, B.; Anoraud, C.; Choroba, P.; Smith, D. A machine learning approach to predict the evolution of air traffic flow management delay. In Proceedings of the 14th ATM Research and Development Seminar, Virtual Online, 14–17 June 2021; p. 8. [Google Scholar]
  20. Kalliguddi, A.M.; Leboulluec, A.K. Predictive modeling of aircraft flight delay. Univers. J. Manag. 2017, 5, 485–491. [Google Scholar] [CrossRef]
  21. Li, X.; Chen, X.; Li, D. Simulation Research on Optimization of Airport Ground Operation. In Proceedings of the 3rd International Conference on Electromechanical Control Technology and Transportation (ICECTT 2018), Chongqing, China, 19–21 January 2018. [Google Scholar]
  22. Qin, Q.; Yu, H. A statistical analysis on the periodicity of flight delay rate of the airports in the US. Adv. Transp. Stud. 2014, 3, 93–104. [Google Scholar]
  23. Mitsokapas, E.; Schäfer, B.; Harris, R.J.; Beck, C. Statistical characterization of airplane delays. Sci. Rep. 2021, 11, 7855. [Google Scholar] [CrossRef]
  24. Yazdi, M.F.; Kamel, S.R.; Chabok, S.J.M.; Kheirabadi, M. Flight delay prediction based on deep learning and Levenberg-Marquart algorithm. J. Big Data 2020, 7, 106. [Google Scholar] [CrossRef]
  25. Esmaeilzadeh, E.; Mokhtarimousavi, S. Machine learning approach for flight departure delay prediction and analysis. Transp. Res. Rec. 2020, 2674, 145–159. [Google Scholar] [CrossRef]
  26. Qu, J.; Zhao, T.; Ye, M.; Li, J.; Liu, C. Flight delay prediction using deep convolutional neural network based on fusion of meteorological data. Neural Process. Lett. 2020, 52, 1461–1484. [Google Scholar] [CrossRef]
  27. Gui, G.; Liu, F.; Sun, J.; Yang, J.; Zhou, Z.; Zhao, D. Flight delay prediction based on aviation big data and machine learning. IEEE Trans. Veh. Technol. 2019, 69, 140–150. [Google Scholar] [CrossRef]
  28. Cai, K.; Li, Y.; Fang, Y.P.; Zhu, Y. A deep learning approach for flight delay prediction through time-evolving graphs. IEEE Trans. Intell. Transp. Syst. 2021, 23, 11397–11407. [Google Scholar] [CrossRef]
  29. Alla, H.; Moumoun, L.; Balouki, Y. A multilayer perceptron neural network with selective-data training for flight arrival delay prediction. Sci. Program. 2021, 2021, 5558918. [Google Scholar] [CrossRef]
  30. Guo, Z.; Yu, B.; Hao, M.; Wang, W.; Jiang, Y.; Zong, F. A novel hybrid method for flight departure delay prediction using Random Forest Regression and Maximal Information Coefficient. Aerosp. Sci. Technol. 2021, 116, 106822. [Google Scholar] [CrossRef]
  31. Song, W.; Fujimura, S. Capturing combination patterns of long-and short-term dependencies in multivariate time series forecasting. Neurocomputing 2021, 464, 72–82. [Google Scholar] [CrossRef]
  32. ArunKumar, K.; Kalaga, D.V.; Kumar, C.M.S.; Kawaji, M.; Brenza, T.M. Comparative analysis of Gated Recurrent Units (GRU), long Short-Term memory (LSTM) cells, autoregressive Integrated moving average (ARIMA), seasonal autoregressive Integrated moving average (SARIMA) for forecasting COVID-19 trends. Alex. Eng. J. 2022, 61, 7585–7603. [Google Scholar] [CrossRef]
  33. Runge, J.; Zmeureanu, R. A review of deep learning techniques for forecasting energy use in buildings. Energies 2021, 14, 608. [Google Scholar] [CrossRef]
  34. Boswell, S.B.; Evans, J.E. Analysis of Downstream Imports of Air Traffic Delay; Technical Report; Massachusetts Institute of Technology, Lincoln Laboratory: Lexington, MA, USA, 1997. [Google Scholar]
  35. Beatty, R.; Hsu, R.; Berry, L.; Rome, J. Preliminary evaluation of flight delay propagation through an airline schedule. Air Traffic Control Q. 1999, 7, 259–270. [Google Scholar] [CrossRef]
  36. Abdelghany, K.F.; Shah, S.S.; Raina, S.; Abdelghany, A.F. A model for projecting flight delays during irregular operation conditions. J. Air Transp. Manag. 2004, 10, 385–394. [Google Scholar] [CrossRef]
  37. Wong, J.T.; Tsai, S.C. A survival model for flight delay propagation. J. Air Transp. Manag. 2012, 23, 5–11. [Google Scholar] [CrossRef]
  38. Khan, W.A.; Ma, H.L.; Chung, S.H.; Wen, X. Hierarchical integrated machine learning model for predicting flight departure delays and duration in series. Transp. Res. Part Emerg. Technol. 2021, 129, 103225. [Google Scholar] [CrossRef]
  39. Zoutendijk, M.; Mitici, M. Probabilistic flight delay predictions using machine learning and applications to the flight-to-gate assignment problem. Aerospace 2021, 8, 152. [Google Scholar] [CrossRef]
  40. Zheng, Z.; Wei, W.; Hu, M. A Comparative analysis of delay propagation on departure and arrival flights for a Chinese case study. Aerospace 2021, 8, 212. [Google Scholar] [CrossRef]
  41. Yamak, P.T.; Yujian, L.; Gadosey, P.K. A comparison between ARIMA, LSTM, and GRU for time series forecasting. In Proceedings of the 2019 2nd International Conference on Algorithms, Computing and Artificial Intelligence, Sanya, China, 20–22 December 2019; pp. 49–55. [Google Scholar]
  42. Hyndman, R.J.; Athanasopoulos, G. Forecasting: Principles and Practice; Otexts: Melbourne, Australia, 2018. [Google Scholar]
  43. Wongsai, N.; Wongsai, S.; Huete, A.R. Annual seasonality extraction using the cubic spline function and decadal trend in temporal daytime MODIS LST data. Remote Sens. 2017, 9, 1254. [Google Scholar] [CrossRef]
  44. Thiagarajan, B.; Srinivasan, L.; Sharma, A.V.; Sreekanthan, D.; Vijayaraghavan, V. A machine learning approach for prediction of on-time performance of flights. In Proceedings of the 2017 IEEE/AIAA 36th Digital Avionics Systems Conference (DASC), St. Petersburg, FL, USA, 17–21 September 2017; IEEE: Piscataway, NJ, USA, 2017; pp. 1–6. [Google Scholar]
  45. Reddy, K.V.A.; Ambati, S.R.; Reddy, Y.S.R.; Reddy, A.N. AdaBoost for Parkinson’s Disease Detection using Robust Scaler and SFS from Acoustic Features. In Proceedings of the 2021 Smart Technologies, Communication and Robotics (STCR), Sathyamangalam, India, 9–10 October 2021; IEEE: Piscataway, NJ, USA, 2021; pp. 1–6. [Google Scholar]
  46. Cho, K.; Van Merriënboer, B.; Gulcehre, C.; Bahdanau, D.; Bougares, F.; Schwenk, H.; Bengio, Y. Learning phrase representations using RNN encoder-decoder for statistical machine translation. arXiv 2014, arXiv:1406.1078. [Google Scholar]
  47. Li, Q.; Jing, R. Flight delay prediction from spatial and temporal perspective. Expert Syst. Appl. 2022, 205, 117662. [Google Scholar] [CrossRef]
  48. Shao, W.; Prabowo, A.; Zhao, S.; Koniusz, P.; Salim, F.D. Predicting flight delay with spatio-temporal trajectory convolutional network and airport situational awareness map. Neurocomputing 2022, 472, 280–293. [Google Scholar] [CrossRef]
Figure 1. Inbound feeder routes and outbound flight demonstration in a Hub. Inbound feeders connect passengers from smaller airports to the outbound flight.
Mathematics 11 02427 g001
Figure 2. Methodological overview of the proposed approach, consisting of three stages: preprocessing, hybrid model training, and deployment. Raw data is preprocessed to extract features of a high-performing hybrid model using machine learning techniques. Finally, the model is deployed for accurate and efficient predictions.
Mathematics 11 02427 g002
Figure 3. Smoothing characteristics of a natural cubic spline to extract the delay trend (blue) from the actual oscillating data (orange). The spline method smooths the data by eliminating high frequencies and extracting the underlying trend. This figure demonstrates the effectiveness of the natural cubic spline in extracting meaningful patterns from complex time series data.
Mathematics 11 02427 g003
Figure 4. Data sequence converted to supervised learning data format (input, target) using a sliding window method. The sliding window and sliding step sizes were chosen as a size of five units and one time step, respectively, for illustrative purposes. The original sequence (blue line) is divided into subsequences of length five, and each subsequence is labeled with the value of the next time step.
Mathematics 11 02427 g004
Figure 5. The architecture of the hybrid model consists of two branches: a GRU layer and a dense layer. The input data is fed into both branches simultaneously, and the output data are concatenated before being passed through a second GRU layer. The final output is obtained by passing the output of the second GRU layer through another dense network. The hybrid model is designed to capture both sequential and non-sequential features of the input data, making it well suited to forecasting flight delays.
Mathematics 11 02427 g005
Figure 6. Internal operations of GRU: Reset gate, update gate, input, hidden state, memory state, and output. The GRU architecture efficiently captures long-term dependencies in sequential data and is widely used for time series analysis.
Mathematics 11 02427 g006
Figure 7. Displays the geographic distribution of the hub and destination airports in North, Central, and South America. The hub airport is a central location in the airline network. Flights between two destinations pass through the hub along the spokes. Such a topology is often referred to as a hub and spoke network.
Mathematics 11 02427 g007
Figure 8. The histogram displays the distribution of arrival delays at Airport D. Most flights (approximately 84.7%) recorded delays within the range of [−20, 20] min. Notably, 56.7% of flights from the hub to Airport D experienced delays between −10 and 10 min.
Mathematics 11 02427 g008
Figure 9. Comparison with dense, LSTM, and GRU Network Models. This figure shows the architecture of three different network models, connected in parallel to the same input for comparison: dense, LSTM, and GRU.
Mathematics 11 02427 g009
Figure 10. Data Visualization: This figure shows the generated departure (upper curve) and arrival delay (lower curve) trends of airport D using a natural cubic spline. The orange curve represents the noisy version of the true delay data, whereas the blue curve represents the smoothed delay trend.
Mathematics 11 02427 g010
Figure 11. The selection of training data is crucial for the performance of the model. This figure shows the training data used for destination airport D. Out of 453 flights, 181 flights were used to train the model.
Mathematics 11 02427 g011
Figure 12. Autocorrelation analysis of departure delays for Airport D: The figure shows the autocorrelation values for departure delays at different lag times. We observed a strong correlation at small lag values ( δ ), which gradually decreased as the lag time increased.
Mathematics 11 02427 g012
Figure 13. Training and validation losses over epochs during the training process.
Mathematics 11 02427 g013
Figure 14. Prediction Accuracy of the Proposed Model for Delay. This figure shows the delay prediction accuracy of the proposed model. The blue curve represents the true delay, while the orange curve represents the model prediction and the 95% confidence interval.
Mathematics 11 02427 g014
Figure 15. Prediction accuracy of the LSTM model. This figure mygedisplaysshows the delay prediction accuracy of the LSTM model. The blue curve represents the true delay, while the orange curve represents the model prediction and the 95% confidence interval.
Mathematics 11 02427 g015
Figure 16. Prediction accuracy of the GRU model. This figure shows the delay prediction accuracy of the GRU model. The blue curve represents the true delay, while the orange curve represents the model prediction along with the 95% confidence interval. The performance of the GRU model was lower than that of the proposed model, but higher than the LSTM model.
Mathematics 11 02427 g016
Figure 17. Delay prediction accuracy with the dense model. This figure shows the delay prediction accuracy of the dense model. The blue curve represents the true delay, while the orange curve represents the model prediction along with the 95% confidence interval. The performance of the dense model was the lowest among all the models we evaluated.
Mathematics 11 02427 g017
Figure 18. Arrival delay prediction of PDIFs using Hybrid RNN for next two months given 10-month training data.
Mathematics 11 02427 g018
Figure 19. Impact of PDIF arrival delays on the available connection times for outbound flights. The red bar indicates instances where the available connection time remained below the specified alarm threshold of 30 min. Flight A was the most affected by the delay, while Flight D experienced the least impact. The x-axis represents flight time steps, and the y-axis represents time in minutes.
Mathematics 11 02427 g019
Figure 20. (a) shows the impact of a PDIF on outbound flights, with different colors representing flights affected in different ways over the next two months. (b) provides statistics on the impacts of PDIFs on flights based on the interquartile of the ACT shrinkage in minutes for each outbound flight.
Mathematics 11 02427 g020
Table 1. Performance evaluation results for Hybrid RNN, LSTM, GRU, and Dense layer models. Bold represents the best result for each accuracy metric.
ModelMAEMSERMSER-Squared
Hybrid RNN1.2182.2971.5160.928
LSTM3.37017.9934.2420.438
GRU1.5883.5431.8820.889
Dense layer2.80311.6973.4200.635
Disclaimer/Publisher’s Note: The statements, opinions and data contained in all publications are solely those of the individual author(s) and contributor(s) and not of MDPI and/or the editor(s). MDPI and/or the editor(s) disclaim responsibility for any injury to people or property resulting from any ideas, methods, instructions or products referred to in the content.

