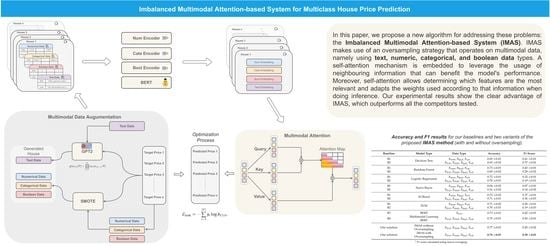
1. Introduction
The problem of predicting house prices is relevant, and solving it has the potential to benefit both individuals buying homes and house sellers. Traditional models for house price prediction use exclusively numerical attributes. These attributes contain important information for predictive models, including the number of rooms or the number of floors. However, they usually disregard other information that is nowadays more frequently available in house descriptions. In this paper, we tackle a multiclass house prediction problem by developing a solution that uses multiple modes of data.
The first key characteristic of the problem we are tackling is related to the use of multimodal data. Thus, in the first stage, we need to determine how to extract and use all the different modes of the features. Moreover, we also need to determine if all features are equally important and useful and should be considered in the model’s development. Many companies and sellers provide short descriptions of houses, making them available through advertising platforms. This text contains potentially important information that can be used together with other types of data to obtain a better prediction of the house price. As far as we know, multimodal house price prediction [
1] is limited to using satellite images and numerical data as two modalities for price prediction. However, in most cases, satellite image data are unavailable, and concatenating heterogeneous numerical types of data as the same modality fails to capture the inherent structural information of the different numerical data types. We propose a multimodal attention mechanism to explore the underlying structural information of the text data and heterogeneous numerical data, introducing a “microscopic” multimodal learning paradigm in this way.
A second important characteristic of our problem concerns the imbalance typically present in this setting. We expect that the majority of houses will have a price that is closer to the average value, with a very small number having a price that is very high or low. This imbalance in the distribution of the classes may cause severe issues for the learning algorithm, especially if our goal is to be more accurate in predicting the most or least expensive house prices. We take into consideration this challenge that is naturally present in this domain and propose an oversampling strategy that is applied to all the data modalities.
Our main goal is to solve a multiclass prediction problem with an imbalance in the target class through a multimodal attention-based framework. To achieve this, we propose the IMAS, a solution that is able to address the class imbalance problem while using multimodal data and embedding an attention mechanism to ensure the best adaptation to the multiple features used. Multiple developments have emerged with the appearance of the self-attention mechanism in the transformer architecture. In particular, important multimodal applications have appeared in the fields of vision and language (e.g., [
2,
3]) and vision and audio (e.g., [
4,
5]). However, these applications do not focus on a “microscopic multimodal view”, where not only the usage of text data and heterogeneous numeric data is considered but also numeric heterogeneous data are envisioned as different modalities. Moreover, these solutions have not yet been applied in a house price prediction context. Through an extensive experimental comparison, we compare the IMAS with several alternative solutions and show the clear advantage of our proposed system.
1.1. Problem Definition
We tackle the problem of house price prediction by using multiple feature modes, including numeric, boolean, categorical, and textual attributes. Let each one of these feature modes be represented by , where X represents the aggregated set of all features, represents the features to be extracted from the house description text, and the remaining and represent the sets of the boolean, numeric, and categorical features extracted from the houses, respectively. We consider the house price, the problem’s target variable, as a multiclass variable containing six different classes that correspond to six different ranges of house prices. We represent the target variable by Y. Our goal is to approximate an unknown function based on a training dataset . The house prices are represented by six different classes, i.e., , which means we face a multiclass problem with six classes. Moreover, the class distribution is not balanced, i.e., some classes are well represented by many examples in the available data, whereas others are scarcely represented and have a much smaller number of examples.
1.2. Intuition for our Solution
By integrating multiple features into the construction of a model, we need to take into account the fact that we may be using irrelevant features and that some features may be more important than others. Thus, to effectively use all the available information, we must focus our attention on the most relevant characteristics of the data. To achieve this, we use the self-attention mechanism.
Being the current de facto method for building associations between data, the self-attention mechanism [
6] can effectively analyze long-term sequential or structural information and dynamically assign weights from a global perspective to different data representations based on downstream task information. Accordingly, self-attention has also demonstrated advantages in more complex multimodal domains, especially in perceptual problems combining vision and text [
7,
8]. However, in some practical numerical analysis tasks, such as house price prediction, most prior works [
1,
9] only concatenate various numerical values as a “modal” to produce attention computations with other modals such as text and images and thus might not be able to capture all meaningful relationships between different types of numerical values. In addition, different numeric data types, such as boolean, discrete, and continuous variables, are inherently heterogeneous and permutation invariant. Simply concatenating different types of numerical values cannot capture the underlying structural information.
To overcome the limitations of the existing house price prediction pipeline, we propose the IMAS with multimodal attention, which introduces numerical-oriented multimodal learning that aims to explore the underlying structural information and produce a weighted fusion of different numerical values in an end-to-end fashion. In addition, we also provide a corresponding multimodal data augmentation technique that generates corresponding multimodal data based on house prices.
1.3. Main Contributions
The key aspect of our proposed IMAS is its adaptability to multimodal learning from both a macro perspective (text and numerical data) and a micro perspective (numerical, categorical, and boolean data), which are inherently heterogeneous and play different roles in house price prediction. The main contributions of this paper are as follows:
we propose the IMAS, a new system to tackle the problem of multiclass house price prediction that is capable of handling multimodal data (textual, numerical, categorical, and boolean) while dealing with the class imbalance problem;
we provide an extensive set of experiments, where we compare our proposed system with several alternative ways of dealing with the multimodal data;
we show the advantage of the proposed system on a recent and large dataset that we collected and preprocessed;
we provide an analysis of the IMAS in terms of the impact on the results of the different modes of features;
1.4. Organization
This paper is organized as follows.
Section 2 presents an overview of the most relevant literature for house price prediction, covering the classical statistical-based hedonic models, standard machine learning models, deep learning-based models, and also models using more advanced Natural Language Processing (NLP) techniques. In
Section 3, we describe our proposed IMAS system, providing details of its different components.
Section 4 provides the experimental settings and describes the dataset used and
Section 5 analyzes and discusses the results of our experiments. Finally,
Section 6 concludes the paper.
2. Literature Review
This section provides an extensive overview of the three core topics related to our work: the statistical-based hedonic price models, machine learning models, and models that specifically make use of natural language processing techniques to tackle the house price prediction problem.
2.1. Statistical-Based Hedonic Models
Research on house prices has been an important topic since the 1970s, a time when the approaches used were based on traditional statistical methods originating from the economics field. In 1974, Rosen [
10] presented the Hedonic Price Theory, a statistical method that has since become well known and widely used. This popular theory uses a set of attributes that can explain the house price for representing a house [
11]. These attributes, such as the number of bedrooms or the number of bathrooms, are not equally important for determining the house price. Instead, they are ranked depending on their impact on the utility function of a house. This model assumes that the house’s sale price is achieved through a market balance between home buyers’ and sellers’ utilities, given that both aim to maximize the house’s utility function. The initial hedonic model took into account only the house’s characteristics, disregarding other external factors [
10]. Still, the hedonic model changed and evolved, and further external factors were included in the model for representing the house price. This was motivated by the confirmation that considering solely the initial characteristics proposed was insufficient for representing the house price. In effect, other external properties, such as the house’s location, also affect the property value. Thus, given the strong relationship between the house price and its location, the hedonic price model was updated to also include the house’s location as an attribute [
12].
However, the development of a hedonic regression model has multiple constraints, which can lead to a diversity of relevant drawbacks. For instance, it requires a team of experts to manually study the data to develop a mathematical model. However, this is a time-consuming and expensive process. Moreover, this model is not able to handle nonlinearity [
11] well and it does not allow for the use of unstructured textual information such as description texts.
More recently, the extraction of visual features and their usage as a complementary source of information for the models have also been considered. Some research works have shown that using visual information to represent the scenic characteristics of a house and its neighborhood has great potential for estimating the house price (e.g., [
13,
14,
15]).
2.2. Standard Machine Learning Models
Many standard machine learning algorithms, ranging from the popular random forest algorithm to the boosting solution algorithm and support vector machine (SVM), to name a few, have been explored for predicting house prices. The majority of the proposed solutions use exclusively numerical house attributes.
SVMs were applied in the context of house price prediction for a large city in China [
16]. Both a default SVM and an SVM using particle swarm optimization (PSO) to determine the best SVM parameters were tested, with the latter producing the best overall results for the predictive task. Random forest models were compared with the hedonic model and ordinary least squares (OLS) [
17]. This comparison was carried out with house data from South Korea and showed a clear advantage of the random forest models for this task, which were able to better capture the nonlinearity of the house price prediction problem. House data from Karachi, a city in Pakistan, were used in a different study [
18] that assessed the performance of a boosting algorithm to address the house price prediction task. In this case, the extreme gradient boosting (XGBoost) algorithm provided good results. Another study [
19] compared multiple regression techniques for predicting house prices, including multiple linear regression, ridge regression, LASSO, elastic net, gradient boosting, and AdaBoost regression, on a public dataset (
https://geodacenter.github.io/data-and-lab/KingCounty-HouseSales2015/ (accessed on 28 November 2022)) containing house sale prices from King County, USA. It was found that the gradient boosting algorithm provided the best solution.
However, the development of models for house price prediction has not been constrained by standard machine learning models. Moreover, other sources of data beyond numerical data have been explored and used to solve this task. The following sections discuss both the other models and the data sources that have been used in this domain.
2.3. Models Using Deep Learning Techniques
With the increasing volume of data, deep learning models have become a popular solution, typically displaying good results. Several deep learning solutions have been tested for tackling house price prediction.
Some of the proposed deep learning solutions involve using image data as a complementary source of features for the models. For instance, Zhao et al. [
20] developed a new model that combines a convolutional neural network (CNN) and an XGBoost model. This was accomplished by replacing the CNN’s last layer with the XGBoost model. The CNN extracts features from the images and the XGBoost algorithm predicts the house price using all the processed features (from images and numerical data). The proposed solution outperformed the multilayer perceptron and k-nearest neighbor models [
20]. The system presented by Wang et al. [
1] used three sources of data (satellite images, house transaction data, and public facility data) to extract house features, which were then processed by an attention mechanism to provide a price prediction.
Some proposed systems rely on a combination of standard machine learning algorithms and neural networks. This is the case for the work proposed by Varma et al. [
21], where linear regression, random forest, and neural networks were incorporated for house price prediction. This was achieved by feeding the outputs of the linear regression and random forest models into the neural network as the input features. Other solutions exist that apply other neural networks, such as recurrent neural networks (RNNs) or long short-term memory (LSTM). For instance, Chen et al. [
22] collected numerical features from four large cities in China, which were then used to train RNN and LSTM models. The results showed that the RNN and stacked LSTM outperformed the well-known autoregressive integrated moving average (ARIMA) model.
In the field of deep learning, other authors have sought to address the imbalance problem through specialized neural networks. For instance, in [
23], a probabilistic neural network model was proposed that took into account the unbalanced representation of the problem classes to address the small sample and class imbalance problems in a medical data context. Another solution was presented in [
24] involving classification through the use of neural-like structures in the geometric transformations model. This proposal also addressed the problem of class imbalance via a specialized model based on neural structures. Still, these methods were not applied to the house price prediction problem, nor did they consider the use of multiple modalities of data.
Although some advancements have been made in the particular domain of house price prediction, this is still an application area where research is in its infancy, especially with regard to the use of more advanced models and the use of other sources of data besides traditional numerical data. In this respect, in the next section, we discuss the research carried out in this domain that uses the textual information of houses.
2.4. Models Using Natural Language Processing Techniques
Besides traditional models and models using deep learning and processing images, there is another source of information that may help in the prediction of house prices. This alternative source of information is text and it can be found on multiple platforms, such as websites advertising houses for sale. Some researchers have started to explore house price prediction by applying text mining to house description data. An example is the work of Stevens [
25] where multiple naïve Bayes, SVM, gradient boosting, and other methods were employed to solve the task of house price prediction. This researcher processed house description data using text mining techniques, including the term frequency-inverse document frequency (TF-IDF) and bag-of-words models. The results indicated a positive impact of using the information obtained from house description data, showing the potential of also using textual data for this problem.
Abdallah et al. [
26] studied house price prediction by applying text mining to the titles and descriptions in real estate classifieds. A two-stage model was proposed using the structured numerical features in the first stage and the features obtained from the titles and descriptions in the second stage. Keywords were extracted using the TF-IDF technique and the authors showed that adding this information had a positive impact on the house price prediction model. This work confirmed the potential for considering the descriptive texts associated with houses to predict their prices. Two years later, Abdallah [
27] extended the previous work by developing a system that identified the most influential keywords in real estate classifieds. Continuing the described trend of identifying relevant words for house price prediction, in 2020, Guo et al. [
28] highlighted and ranked 29 Chinese keywords as critical data that could have a great influence on house prices. Three standard learning models (the generalized linear regression model, the elastic net model, and the random forest model) were evaluated. This work confirmed previous findings related to the importance of extracting relevant keywords from unstructured text data that can have a positive impact on the performance of the model. Still, alternative frameworks such as BERT were not included in any of the described research works.
Recently, text classification using deep learning has exhibited significant growth, with the newly developed solutions surpassing standard machine learning algorithms [
29]. However, even though the new techniques have shown great potential, there is still a research gap concerning the study of these techniques in the particular application domain of house price prediction. This paper targets this gap by providing a study on alternative solutions for house price prediction that use both the more traditional numerical features and the description texts of houses. Instead of focusing on extracting relevant keywords, we seek to use the entirety of the description data from which features are extracted. Our goal is to show which techniques work better in this setting while taking into account the specificity of the domain, which includes imbalance domains.
2.5. Models Using Multimodal Data and Self-Attention
As human perception is inherently based on the multimodal environment, multimodal learning has been a fundamental step toward building comprehensive perceptual-cognitive abilities, thus contributing to more practical applications in our daily lives. Thanks to the exponential development of computation resources and over-parameterized deep learning models, the transformer established together with the self-attention mechanism has demonstrated tremendous potential in the multimodal learning domain, such as VideoBERT [
2], VisualBERT [
3], ImageBERT [
30], and CLIP [
8] in the vision and language field and AV-HuBERT [
5] and LiRA [
4] in the vision and audio field. These prior works introduced scalable multimodal fusion and translation paradigms that can robustly connect heterogeneous multimodal information based on downstream task supervision signals. To interpret the robustness of transformer architecture in multimodal learning, recent studies in the graph representation learning field [
31,
32] have shown that self-attention is intuitively a graph-style modeling, which can model arbitrary input sequences (multimodal information) as a fully-connected graph, thus helping transformers to adapt to a modality agnostic pipeline that is compatible with various modalities.
An area of research that is related to our application is the field of affective computing and sentiment analysis [
33], where emotional information is detected, which is critical for many application domains. In the case of house price prediction, the presence of emotions in the text can lead to advancements, for instance, in the personalization of recommendations or the profiling of sellers or buyers. Still, we could not find any works in the particular context of house price prediction that carried out sentiment analysis. Some works exist, such as the “sentic blending” approach [
34], which seeks to interpret the conceptual and affective information in natural language using different modalities. The authors proposed a scalable methodology for fusing multiple data modalities using a multidimensional vector space. The MuSe-Toolbox [
35] is another interesting work where a Python toolkit is presented that creates multiple continuous and discrete emotion gold standards. In this sense, this research direction is also connected with our work.
However, multimodal learning has yet to be sufficiently explored in the house price prediction domain. To the best of our knowledge, only Wang et al. [
1] have utilized the self-attention mechanism to produce multimodal learning on house price prediction. Nevertheless, their multimodal learning is based on abundant data resources from house satellite images and fails to capture the underlying structural information of the numerical data, which requires significant time and resources to collect data. In this work, we propose a generalizable multimodal attention framework to adapt the most common numerical-type data in house price prediction and provide the corresponding data augmentation techniques as a general framework for tackling house price prediction.
3. Our Proposed Solution: The IMAS Framework
In this section, we present our solution for multimodal house price prediction, the IMAS framework. We discuss the key components of the system, but first, we begin with the introduction of some of the notations we use.
Let be a set of N samples with multimodal properties, where refers to the n-th sample and refers to the corresponding house price properties or labels. We consider the existence of four different modes in our data (text, boolean, categorical, and numerical) and denote by the n-th sample of size with , where , , where , , where and , respectively. We first introduce the encoder for each modality and then present the proposed multimodal self-attention learning-based method and corresponding data augmentation techniques for dealing with the imbalance classes.
3.1. Data Representation Extraction
The multilayer perceptron (MLP) [
36] algorithm is widely adopted to encode continuous or discrete features into an informative representation through a linear or nonlinear transformation. Given a sample
, we construct
,
, and
to independently extract boolean embedding
, categorical embedding
, and numerical embedding
. As for the textual data, we leverage one of the most canonical pre-trained language models (PLM) BERT
as our text encoder to extract the sequence embedding
. Finally, our information sequence
can be represented by
We can observe this first step in the bottom left in
Figure 1.
3.2. Multimodal Self-Attention Learning
After having the encoded sequences for each modality, we apply the self-attention step. One could simply concatenate all the multimodal features to obtain a fixed multimodal representation [
37,
38]. However, we take this representation a step further by using a multihead attention. As shown in
Figure 1, we propose to model the dependencies between different types of modals with a self-attention mechanism [
6]. This way, we can leverage the importance of different modalities of data contributing to the results. Specifically, given a set of information sequences
, we would construct
to separately parameterize each attention
and project inputs
to
,
, and
. Finally, our classification head
is obtained through the following process:
where
,
c represents the model dimension,
h is the number of heads, and
is typically set to
, which indicates that each head is parameterized on a lower-dimensional space.
is produced through a residual block followed by layer normalization [
39]. Finally, our objective function is described by Equation (
5).
3.3. Data Augmentation for Imbalanced Class
To generate authentic multimodal data for an imbalanced class, we construct a generator for each modality of the data. This means that the synthetic text instances generated and the numerical, boolean, and categorical synthetic cases generated are implemented using two different strategies.
Regarding the text feature
, we utilize the auto-regressive-based model GPT2 [
40] as a text generator
to generate the house description text. Specifically, we prepend a sequence of prompts
according to the house price ranges as the initial word sequence and factorize the joint probabilities of the generated text through
where l is the length of the prompt and length T is generally determined
on the fly until the <EOS> token is generated from
.
The new synthetic cases with the numerical, boolean, and categorical features are generated using the well-known SMOTE [
41] method. This data preprocessing solution is capable of generating new cases by interpolating two cases from a given minority class and, thereby, expanding the decision border of that class. This is one of the most popular methods used for dealing with the class imbalance, mitigating the important issues of other, simpler methods such as random oversampling or random undersampling. SMOTE uses a seed example from the class of interest (a minority class) and one of its k-nearest neighbors is randomly selected. These two examples are then used to generate a new synthetic case by generating new feature values that are interpolated from the two cases’ features. Equation (
7) shows for a given feature
a, the calculation of the difference between the values of that feature in the seed case and the selected neighbor, represented by
and
, respectively. In Equation (
8), the new feature for the new case (represented by
) is generated using the feature value of
and the
value obtained in Equation (
7) to which a random value between 0 and 1 is added.
For each new case, both synthetic data generation methods are used in parallel to obtain the complete information of the new case.
4. Materials and Methods
This section presents the dataset collected and used in this paper, descriptions of the different baselines considered, and all the experimental settings of the experiments carried out.
4.1. House Price Dataset
In this paper, we used a large amount of real estate data that we extracted and processed from the website of one of Canada’s most popular real estate companies. This allowed us access to a large volume of houses containing the diversified information we needed. We selected the following five major Canadian cities: Ottawa, Toronto, Mississauga, Brampton, and Hamilton. The latter four cities are localized in the Greater Golden Horseshoe Region, a densely populated and industrialized region in Canada, containing over 20% of the Canadian population and over 54% of the population of Ontario (
https://www12.statcan.gc.ca/census-recensement/index-eng.cfm, (accessed on 29 November 2022)). All five cities we selected for this study were in the top 10 Canadian municipalities with the largest populations in 2021.
This dataset includes (i) standard numerical features such as the number of rooms and number of bathrooms; (ii) categorical features such as the type of outdoor area (balcony, skylight, etc.); (iii) boolean features such as the indication of the existence or not of a parking garage; and (iv) text describing each property. The data collection was carried out through a web crawler that we implemented for this purpose. For each house listed on the real estate website, we collected different types of attributes. This allowed us to use a recent dataset with a vast number of examples and with all the information we required for our task.
We collected the advertised house selling prices, which we then categorized into six price ranges and used as our target variable. All types of houses were considered in the five locations selected including new dwellings and second-hand houses. The web scraping was carried out on a Windows 10 laptop with a Jupyter Notebook and Python 3. All the house information was extracted between May and June of 2021.
The raw data collected was cleaned and preprocessed into categorical, numerical, boolean, and text features. Let us first discuss how the categorical, numerical, and boolean features were treated. We applied multiple cleaning and preprocessing steps to this set of features. The most important steps included removing features with more than 50% of missing values or errors in the data collected, merging features with the same information, simplifying categorical features into more consistent classes, handling synonyms in categorical features, and uniforming numeric units. After these steps, we obtained a total of 85 features, excluding the text data. These 85 attributes were decomposed as follows regarding their type: 10 were numerical, 58 were boolean, and 17 were categorical.
Regarding the textual data extracted, we converted all abbreviations, acronyms, and their full word forms to one single format and fixed all typos and misspellings.
Figure 2 shows an example of a textual description obtained for a house.
Finally, we categorized the target variable into six distinct classes.
Table 1 shows the ranges and distributions of the house price classes we considered.
4.2. Experimental Settings
This section provides an overview of our experiments, focusing on the settings. We tested the IMAS algorithm with and without oversampling and provide the parameters used in
Section 4.2.1.
Section 4.2.2 presents the parameters of the augmentation strategy embedded in the IMAS. In
Section 4.2.3, we present the details of the hardware and optimizer used in our experiments. Finally, the description of the four baselines considered, as well as the details of the different learning algorithms that each one used, are provided in
Section 4.2.4, where we also discuss the performance assessment metrics evaluated.
4.2.1. Parameters of the IMAS Models
We begin by describing the IMAS parameter settings. The remaining baselines considered, as well as their respective parameter configurations, are described in
Section 4.2.4. For testing the IMAS, we set up three independent MLPs with ReLU nonlinear activation functions as the boolean, categorical, and numerical encoders. Each output layer of these MLPs had the same number of channels (
). As for the text encoder, we leveraged the BERT-based model (with 12 layers in total), with a learnable pooling layer and the tanh activation function targeting each batch’s first <CLS> token to extract and downsample the text embeddings to the same dimension as the other features, i.e.,
. Finally, we prepend our text, boolean, categorical, and numerical features together as the final house information sequence. As for the multihead attention layer, we set the number of heads to 12 (
) and the hidden dimension as
. The overall dropout rate in the BERT model and multihead attention layer was set to 0.3.
4.2.2. Data Augmentation
We used the GPT2-small model with 12 layers in total (
) as the text generator and fine tuned the GPT2 with the house description and prompt information in
Table 2. During the inference phase, we applied the nucleus sampling to obtain the generated text with
, temperature
, and a repetition penalty of 2. As for the boolean, categorical, and numerical feature generation, we applied the SMOTE method with the number of nearest neighbors set to the default of 5. SMOTE and GPT2 were applied to the selected minority classes (Class 3, Class 4, and Class 5). Moreover, it is known that a fully balanced dataset is not always optimal. Thus, we decided to augment the cases in these classes but opted to not completely balance all the classes, leaving these three minority classes still below the frequencies observed in the remaining classes. The intuition behind this was twofold: (i) a balanced dataset can be non-optimal; and (ii) a vast increase in the frequency of very scarce classes can result in overfitting. For these reasons, we opted to only augment the three selected minority classes with 500 more cases, leaving them with a total of 600 to 900 examples, whereas the other classes had between 1000 and 6000 original examples. The results of the data augmentation per class are shown in
Table 3.
4.2.3. Hardware and Optimizer
All of our models were trained with an NVIDIA RTX 2070 GPU. In all the experiments, we utilized the Adam optimizer and set . We trained the GPT2 generator with a learning rate of and our multimodal attention-based model with a learning rate of . The learning weight decay was explicitly set on a bias term with a ratio of 0.1. All batch sizes were set to 16, the epochs to 4, and the warm-up step to 100.
4.2.4. Baselines and Performance Assessment Metrics
We implemented four competitors (B1, B2, B3, and B4), which can use all or part of the features collected to evaluate the effectiveness of the IMAS.
Figure 3 depicts the four baselines considered. The baselines selected for this study are as follows:
B1—Standard Machine Learning: We implemented non-parametric supervised learning methods, including decision tree, SVM, naïve Bayes, random forest, and XGBoost to directly predict the house price range by concatenating the numerical, categorical, and boolean data. We set the splitter to “best,” the criterion to Gini, and the minimum sample split to 2 for the decision tree. As for SVM, we used the radial basis function as the kernel function with the degree
. We set the number of estimators to 100, learning rate to 1.0, max depth to 1 for XGBoost, minimum sample split to 2 for the random forest, lbfgs solver to logistic regression, and variance smoothing factor to 1e-9 for naïve Bayes. The detailed parameter settings of each of these learning algorithms are described in
Appendix A.
B2—Multimodal Machine Learning: To utilize the text data, we implemented unsupervised learning algorithms (Word2vec) to obtain the word embeddings. Furthermore, we concatenated the word embeddings with the numerical, categorical, and boolean features and fed them into the classical machine learning models as the initial multimodal machine learning pipeline. As for the Word2vec model, we adopted the continuous skip-gram architecture and trained the model with our collected house description data. The output word embedding dimension for both skip-grams was 300.
B3—Pretrained Language Model: To fully explore the semantics of the house description data, we leveraged the pretrained BERT for sequence classification from Huggingface to directly fine tune our collected description data and infer the house price range. We applied the Adam optimizer and set the learning rate to 4e-5 and the epochs to 5 as the training hyperparameters.
B4—End2End Multimodal Learning: To leverage the multimodal feature and combine it with the pretrained language model, we concatenated the extracted sentence embedding with the multimodal feature and fed them into a stack of linear layers to make the final prediction. The training regime was identical to the BERT model.
Regarding the performance assessment, we observed the overall accuracy and the F1 score calculated through macro averaging. The macro averaging version of the F1 score allows for a correct evaluation of the performance of multiclass classification problems in an imbalanced scenario [
42]. Moreover, we also observed the accuracy to determine if an increase in the F1 would negatively impact the overall performance of the models.
5. Analysis and Discussion of Results
This section presents and discusses the main results. We also provide an analysis of the impact of the attention mechanism and present an error analysis of our model.
5.1. Main Results
We tested the four baselines (B1 and B2 with two different machine learning algorithms) and we included our proposed IMAS with and without oversampling. Our main results are displayed in
Table 4. If we compare the results of baselines B1 and B2, we observe a clear advantage for baseline B1 for all learning algorithms tested except naïve Bayes. The difference between B1 and B2 lies in the use of all textual, boolean, numerical, and categorical features on B2, whereas B1 did not use text data (cf.
Figure 3). This shows a detrimental effect on the performance when using the house description text in these scenarios. In the case of naïve Bayes, both the results of B1 and B2 were very poor, showing that this classifier was not well suited for this task.
However, if we compare any of the results of B1 and B2 with the results of B3, we see that B3 provided more advantages in both accuracy and F1-score. Because B3 only used textual data, the conclusion is that these textual data might not be useless and should not be discarded without further consideration. The last baseline B4 used all features in a multimodal framework using a pretrained language model and all the remaining features. Overall, B4 provided the best results among the baseline alternatives that we considered in terms of accuracy and F1 score.
We observed that the IMAS without oversampling provided the best accuracy and F1 score compared to all the variants of the four baselines. However, when using the IMAS with oversampling, we obtained even higher accuracy and a higher F1 score, showing that this method was able to effectively use all the features available.
5.2. Analysis of the Attention Mechanism and Standard Model’s Insights
We inspected the attention weights obtained to better understand their impact and to obtain more insights into the IMAS solution. We computed the average attention weight matrix from the multihead attention layer of the IMAS system for each class and visualized the attention weights.
Figure 4 shows the attention weight results for each of the classes per type of modal feature. As shown in this figure, we can clearly observe that the IMAS assigned the highest importance to the categorical embeddings in all cases (the lightest colored cells), which indicates that the most critical determinants of house prices in our dataset were derived from the categorical features. We also observed that the attention weights of the categorical features increased with the increase in the house price, i.e., as we moved from Class 1 (the least expensive houses) to Class 6 (the most expensive houses), the categorical features exhibited a higher weight. Moreover, the importance of the other modal features did not change significantly with the increase in price, which further illustrates the importance of the categorical features for the “high-priced” houses in our dataset. Finally, we also observed that the textual features had higher weights on lower-priced houses (Class 1), shifting slowly to a weight more similar to those of the other features as the house price increased. This shows that assigning the same importance to all features across the different house price classes is not a good option. In effect, by observing the attention map, we can clearly see that different features were more important for predicting houses with lower prices and this changed for houses with higher prices. This differentiated weighting of the features was not achieved with the standard models as they did not use the self-attention mechanism, which highlights the importance of considering this mechanism when predicting house prices. These results confirm that the attention mechanism is an important step in our solution. By assigning more attention weights to the most critical features, we can steer our IMAS system to focus on the most essential modalities, thus producing class-adapted and improved results.
Besides analyzing the attention mechanism, we also investigated the decision tree model to obtain more insights into the standard baseline models. In
Figure 5, we can observe a decision tree model built with a maximum depth of 4. We did not include here the fully grown tree developed in this study as it became overly large and was extremely difficult to understand. For this reason, we opted to represent a decision tree with a maximum depth of 4. We can see that the features related to the characteristics of the bathrooms of the house were among the top features used in this model. Moreover, we also observed that the garage, bedrooms, type of finishing, laundry, city, heating, cooling, and type of house also appear in the features used in this tree. It is interesting to confirm that some classes never appeared in this model (Class 3), whereas other classes were represented in leaf nodes with a very small number of examples. For instance, Class 5, which was initially represented by 72 examples, ended up being classified on the right-most leaf node, where only 12 examples of that class were present. This confirms the difficulties of classifying some classes of our problem. Still, we must highlight that this is not the model learned in our study but a simplified model with limited depth that enables visualization of the tree.
5.3. Error Analysis
We further analyzed the errors made by our model by observing the confusion matrix results of the IMAS on the test set, as shown in
Figure 6. We verified that most of the errors mainly originated from Classes 1, 4, and 6, where the model misclassified a large number of Class 1 cases as Class 2; a large number of Class 4 cases as Class 3; and many Class 6 cases as Classes 5 and 4. We speculated that the problem was caused by the insufficient sample size and the close price range. However, we also observed that the majority of the errors were made in neighboring classes and thus huge mistakes, such as misclassifying a Class 1 case as a Class 6, were very rare. This confusion matrix also showed that further improvements may be possible and should directly target the fragilities observed in this matrix. We discuss these future developments in the following section.
6. Conclusions
In this paper, we study solutions to deal with the multimodal problem of predicting house price classes. We implement several baseline alternatives, as well as a new algorithm, which we named the IMAS, which is able to effectively deal with this predictive problem while tackling the class imbalance issue. Our proposed solution comprises an oversampling strategy for multimodal data. Then, it goes a step further with the utilization of the four available modalities of features by using a self-attention mechanism to weight the different features, building an adapted solution that uses the features in a more efficient way.
Our results demonstrate that the proposed IMAS solution outperforms all the alternatives tested, showing a clear advantage in this context. The IMAS was able to achieve 78% accuracy and an F1 score of 50%, whereas the best alternative method obtained 75% accuracy and an F1 score of 43%. This shows that the IMAS is able to improve not only the overall accuracy of the model but also its performance in the more difficult and minority classes. Frequently, the improvement of the performance of the minority class is achieved at the cost of degrading the overall performance. Notably, our proposed IMAS is able to increase both results. This is a very interesting result that was achieved by making more intelligent use of the available data through the IMAS. Although the simple concatenation of different modalities is non-optimum, allowing the loss of important information, we show that the IMAS is able to leverage the most relevant features of the multiple modalities to obtain the best performance for each of the classes in the problem. We also provide an analysis of the weights obtained by our self-attention mechanism, showing that it provides adapted weights to the different classes and features. This is indeed a useful solution that allows for the consideration of the neighboring information in cases when inference is performed.
Using multiple modalities of data provides a useful solution that achieves high performance. However, the IMAS has limitations that should be taken into account, namely our proposed system requires more computational power and time to train. This can represent a limitation for end users that have lower computational resources. Another important aspect concerns the potential usage of even more modalities, such as house images, which we did not consider in this work.
We believe that building multimodal models for house price prediction is a promising avenue for future work, namely we consider that exploring the use of other oversampling strategies could bring advantages to the model by making it focus on the classes with higher misclassification errors. This is relevant because the underlying distribution of our target, the house price, was not balanced. Thus, exploring special-purpose methods to deal with this problem is important. Another interesting avenue is related to the decoupling of the representation and learning phases. Several works have shown that this can provide good results for long-tailed distributions (e.g., [
43]), but so far, no work has studied this for house price prediction with the type of multimodal data that we used. This direction can become even more relevant if images are also included in the available data. Finally, embedding reinforcement learning into the IMAS framework could also be worth trying as an alternative solution. In effect, some work has been conducted in other application domains where multimodal data are used and reinforcement learning is able to help in building an improved model (e.g., [
44]). Finally, we will also consider tackling this problem as a regression problem to observe the impact on the models of the different modalities and the self-attention mechanism.


