
Playful Probes for Design Interaction with Machine Learning: A Tool for Aircraft Condition-Based Maintenance Planning and Visualisation

 , , ,
, , ,  ,
,  and
and
Abstract
:1. Introduction
2. Background
3. Related Work
4. Design Case
5. Method
- 1.
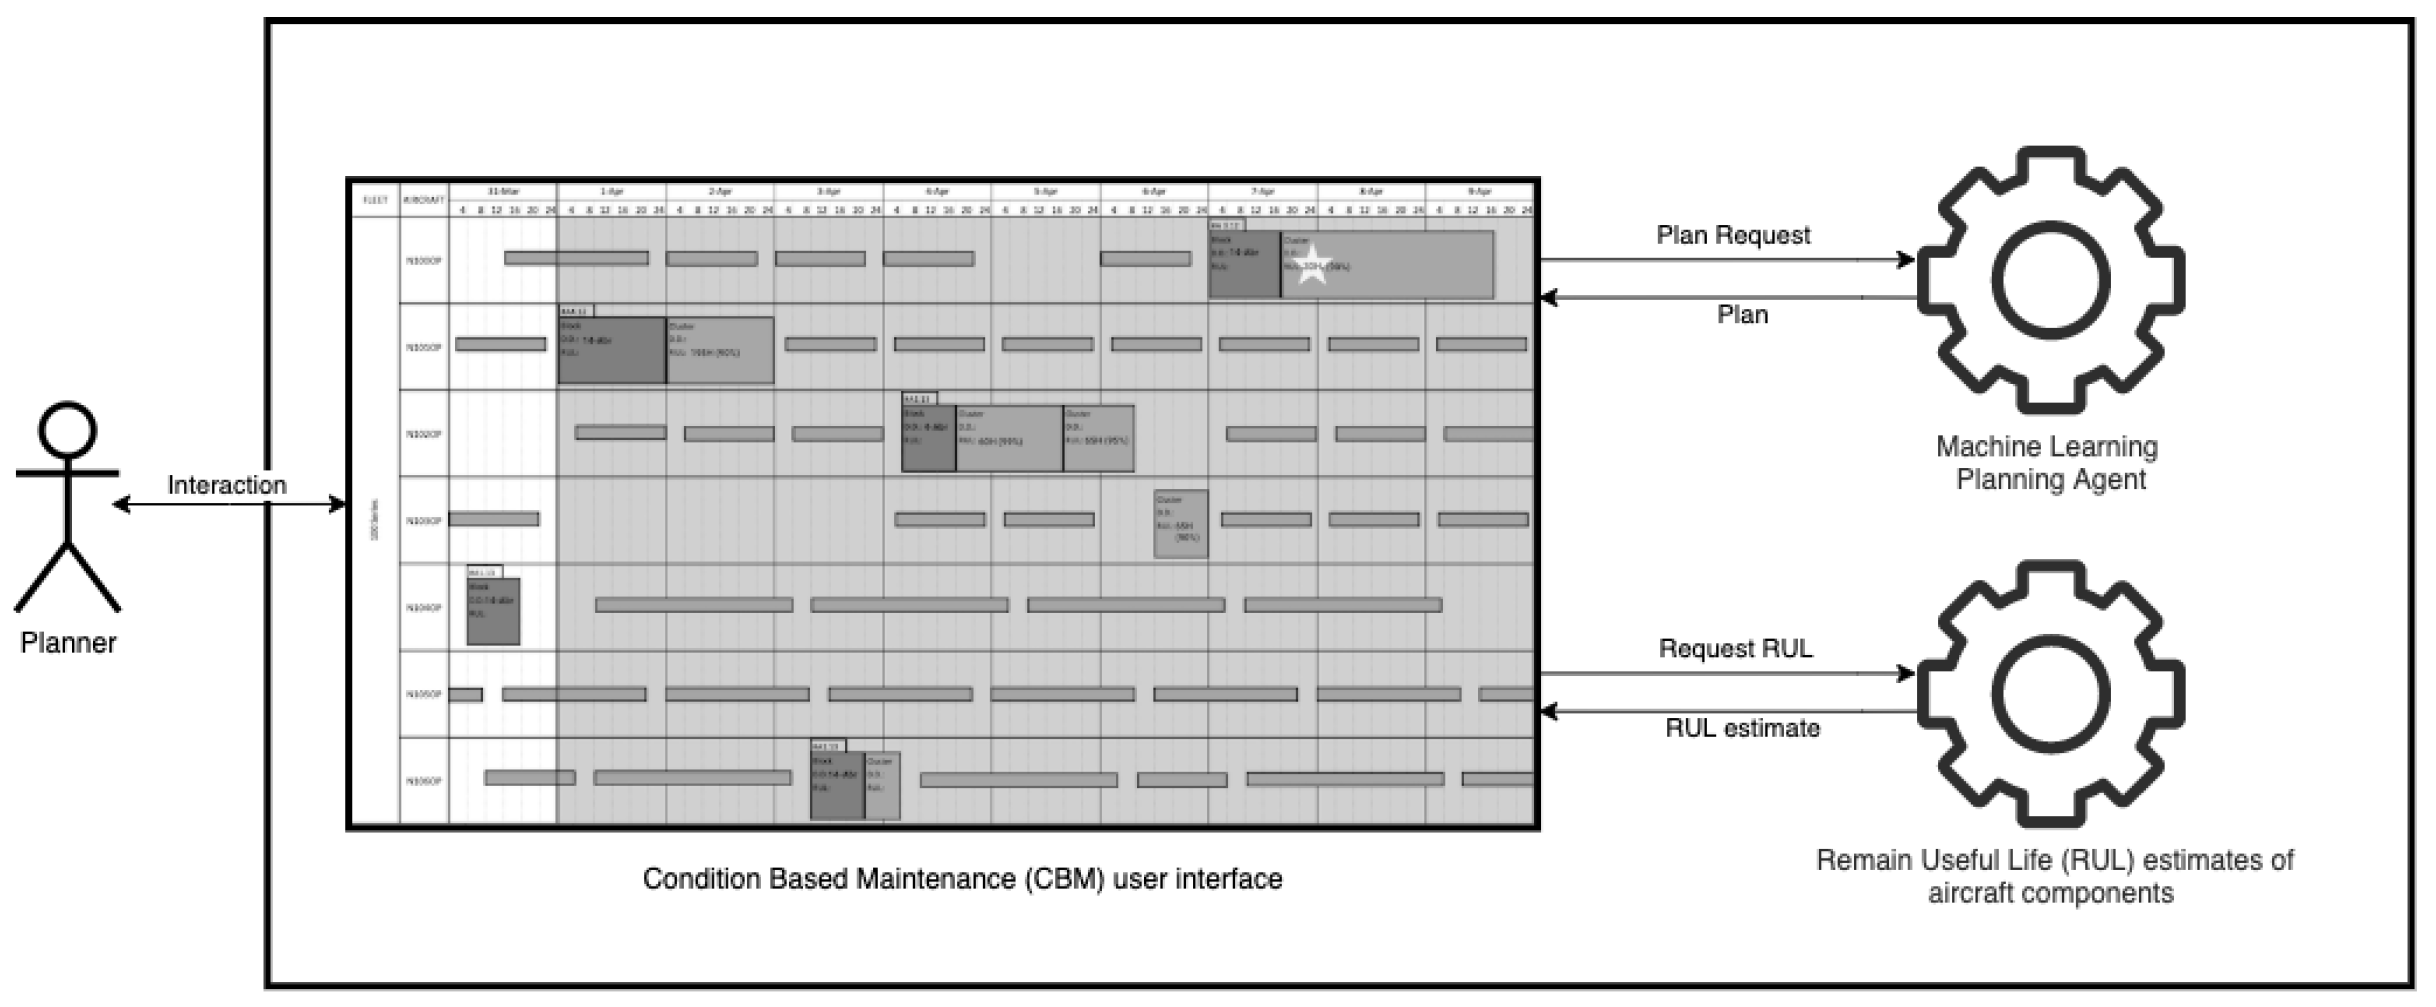
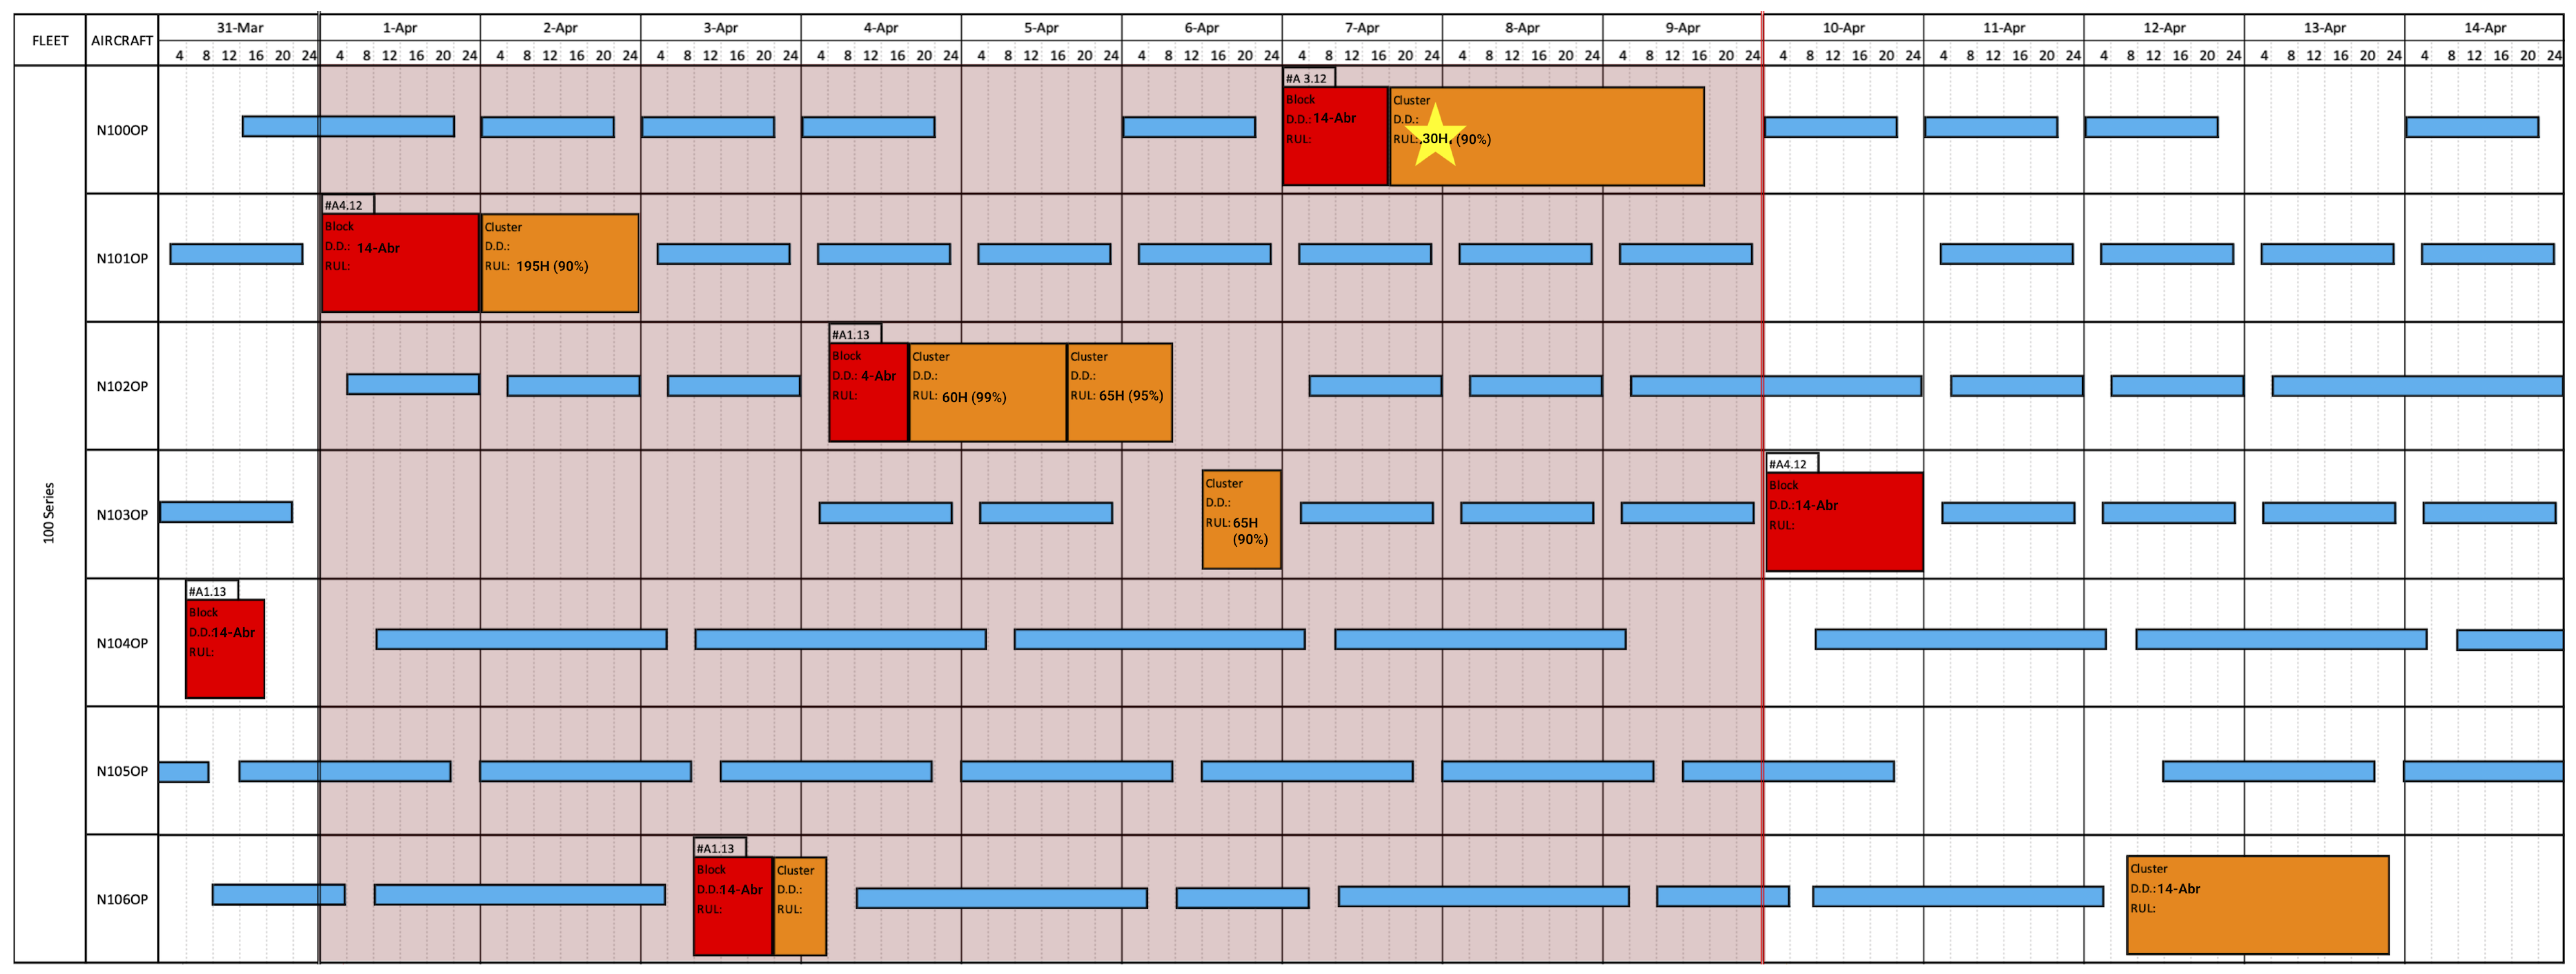
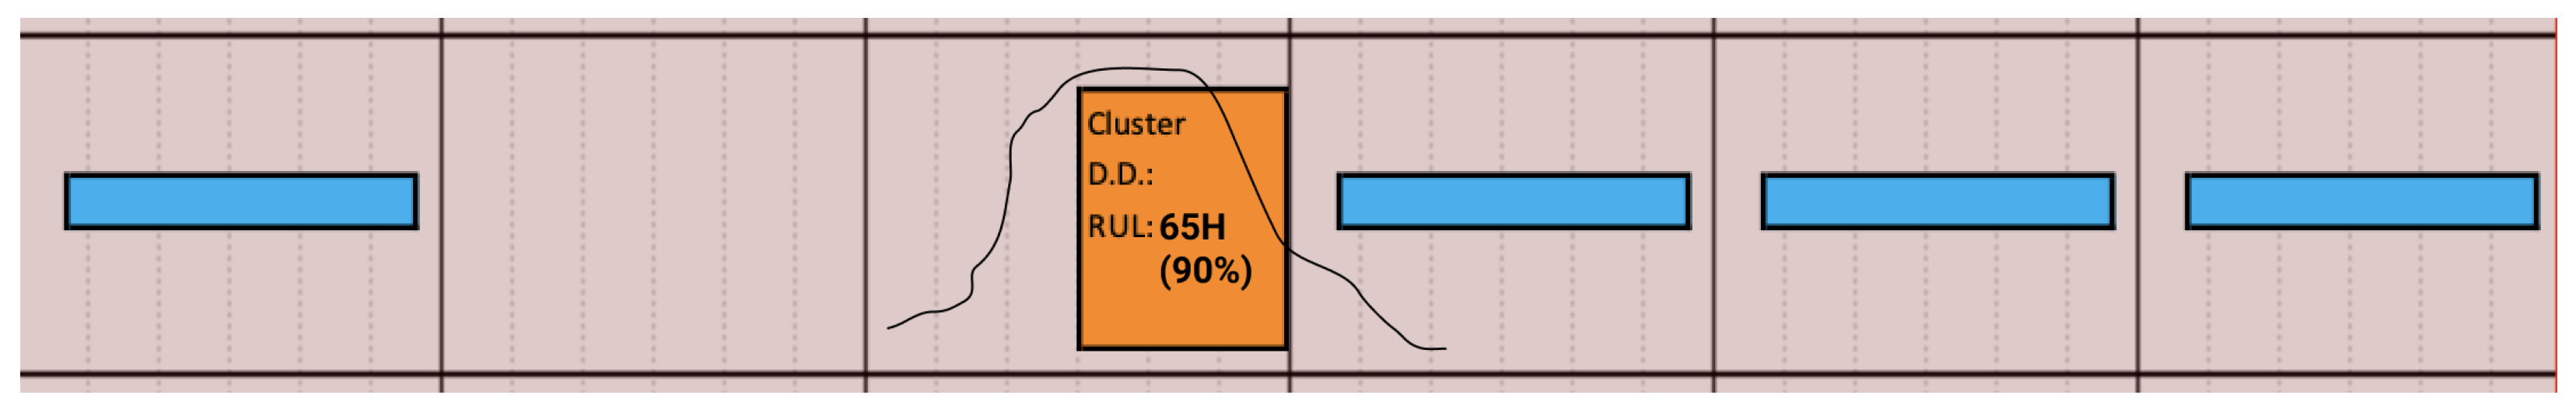
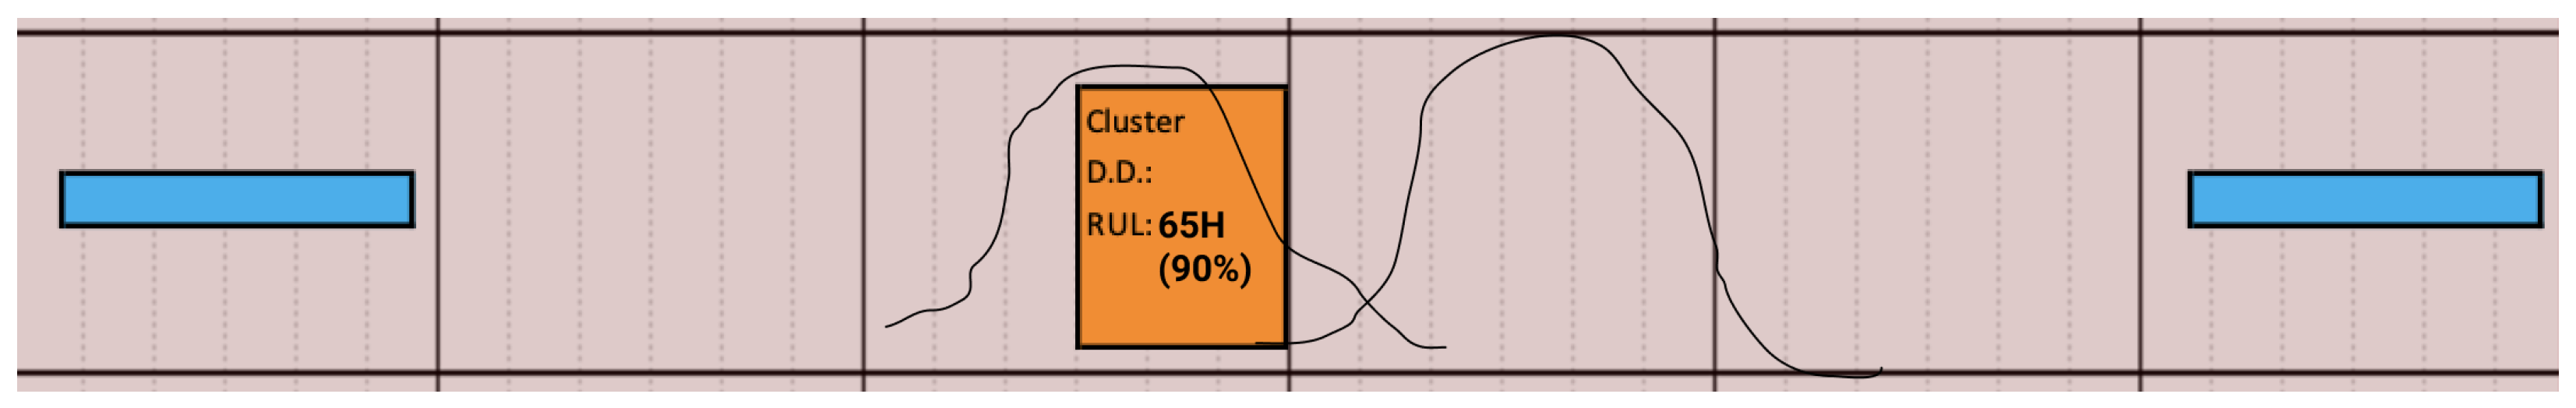
- Materials. The basic elements of a maintenance schedule (Figure 2):Flight: blue ribbons represent flights that some aircraft (row) can do at some time.Block: A predefined routine maintenance (A-checks).Cluster: A non-routine maintenance composed by other tasks not included in Blocks. This could have Due Date, RUL, both, or none.Canvas: The “background” of all artefacts, the scenario with information about the fleet, time representations and restrictions.
- 2.
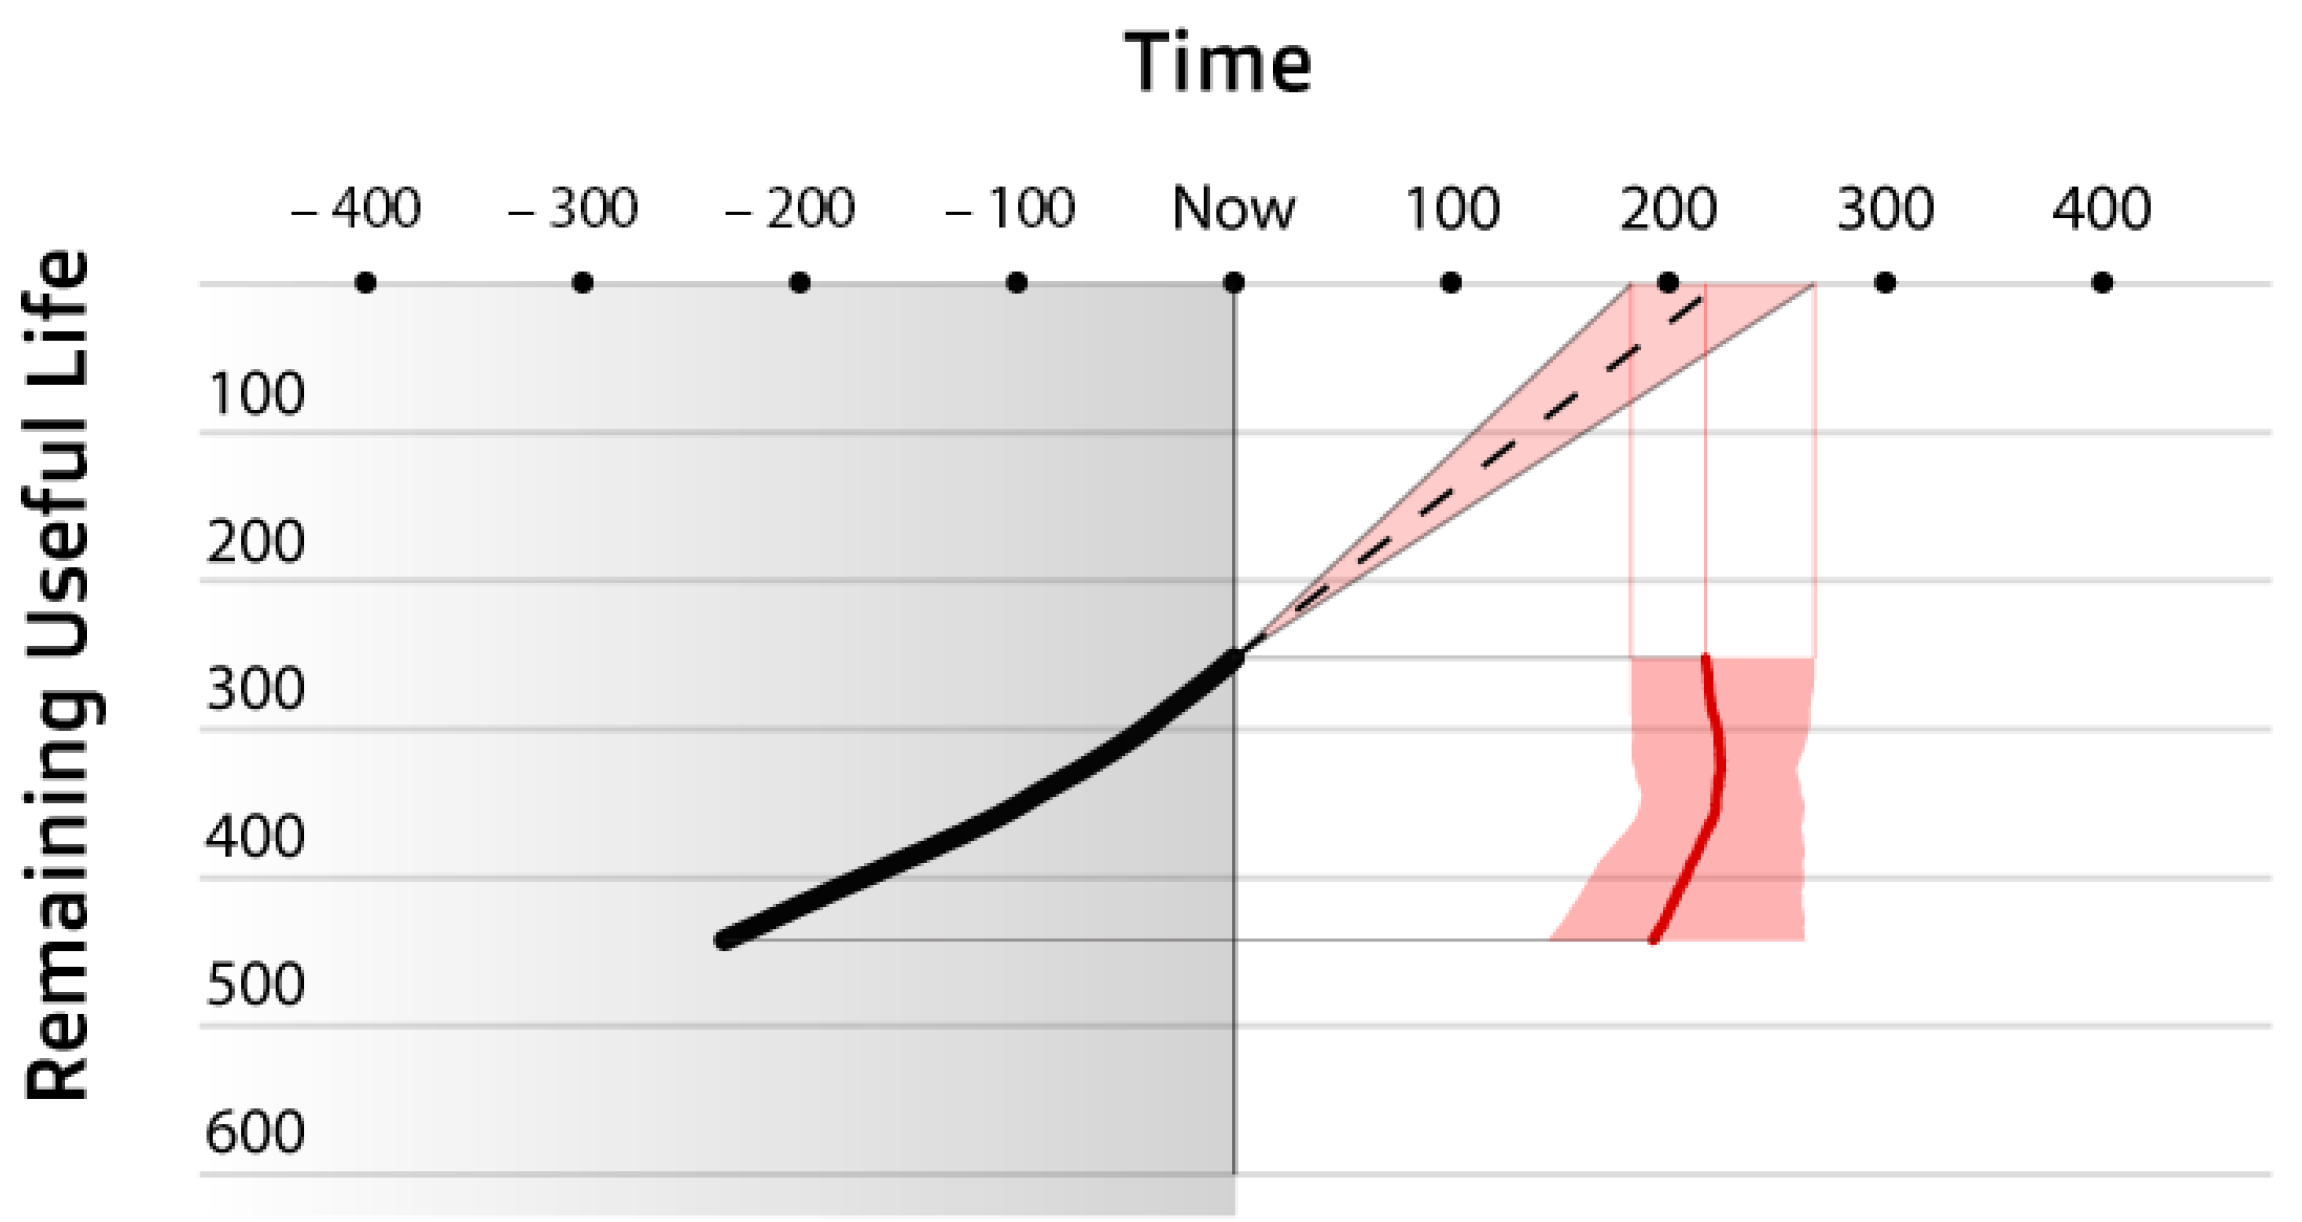
- Solving the Problem Path. The beginning of the resolution was linear, only possible in one direction. Participants would be faced with the simplest concepts of the flight plan and maintenance. Subsequently, the resolution would lead to a path where users would necessarily be faced with more complex issues such as conflicting conditions and 90% confidence RUL.This probe was instrumented by placing visual artefacts RUL estimates with 90% confidence to confront participants with situations that could lead to debate and the generation of insights. The questions that we want to be raised by the participants are: Does it make sense to have a large degree of uncertainty? How do we represent it to enable decisions?
- 3.
- Test specification. To prepare the workshop, all artefacts were designed digitally but printed and pre-tested manually as in a common paper prototype exercise. After testing multiple approaches to instrument the probes with visual artefacts, and adjustments in size and complexity, the exercise was migrated to a digital collaboration tool (Figure 2).
- 4.
- Briefing. In an initial part of the experiment/workshop, an introduction was made explaining what the basic maintenance elements of the game were and demonstrating how to solve a simple problem.
- 5.
- Playful procedure. In this part of the experimental session, artifacts were presented to participants with a non-trivial maintenance scheduling problem to be solved, i.e., a problem that needs several plays both in the artifacts of the maintenance and artifacts of flights to respect the new RUL (Figure 2). The participant’s voice and the collaborative canvas were recorded presenting their ideas and playing with the representations to solve the maintenance problem. The facilitator answered participants’ questions about whether they could take a certain action or not. Furthermore, he alerted when they were ignoring some important conditions while trying to explore the problem.
- 6.
- Debriefing. After participants solved the scheduling problem, a wider discussion space opened, namely on the role of RUL visualisation and the use of an ML planning agent in the planning process.
- 7.
- Email Interview. After viewing the recording, some questions were sent to the participants. The intention was to clarify or deepen the reflections that they expressed during phases 5 and 6.
6. Workshop Results
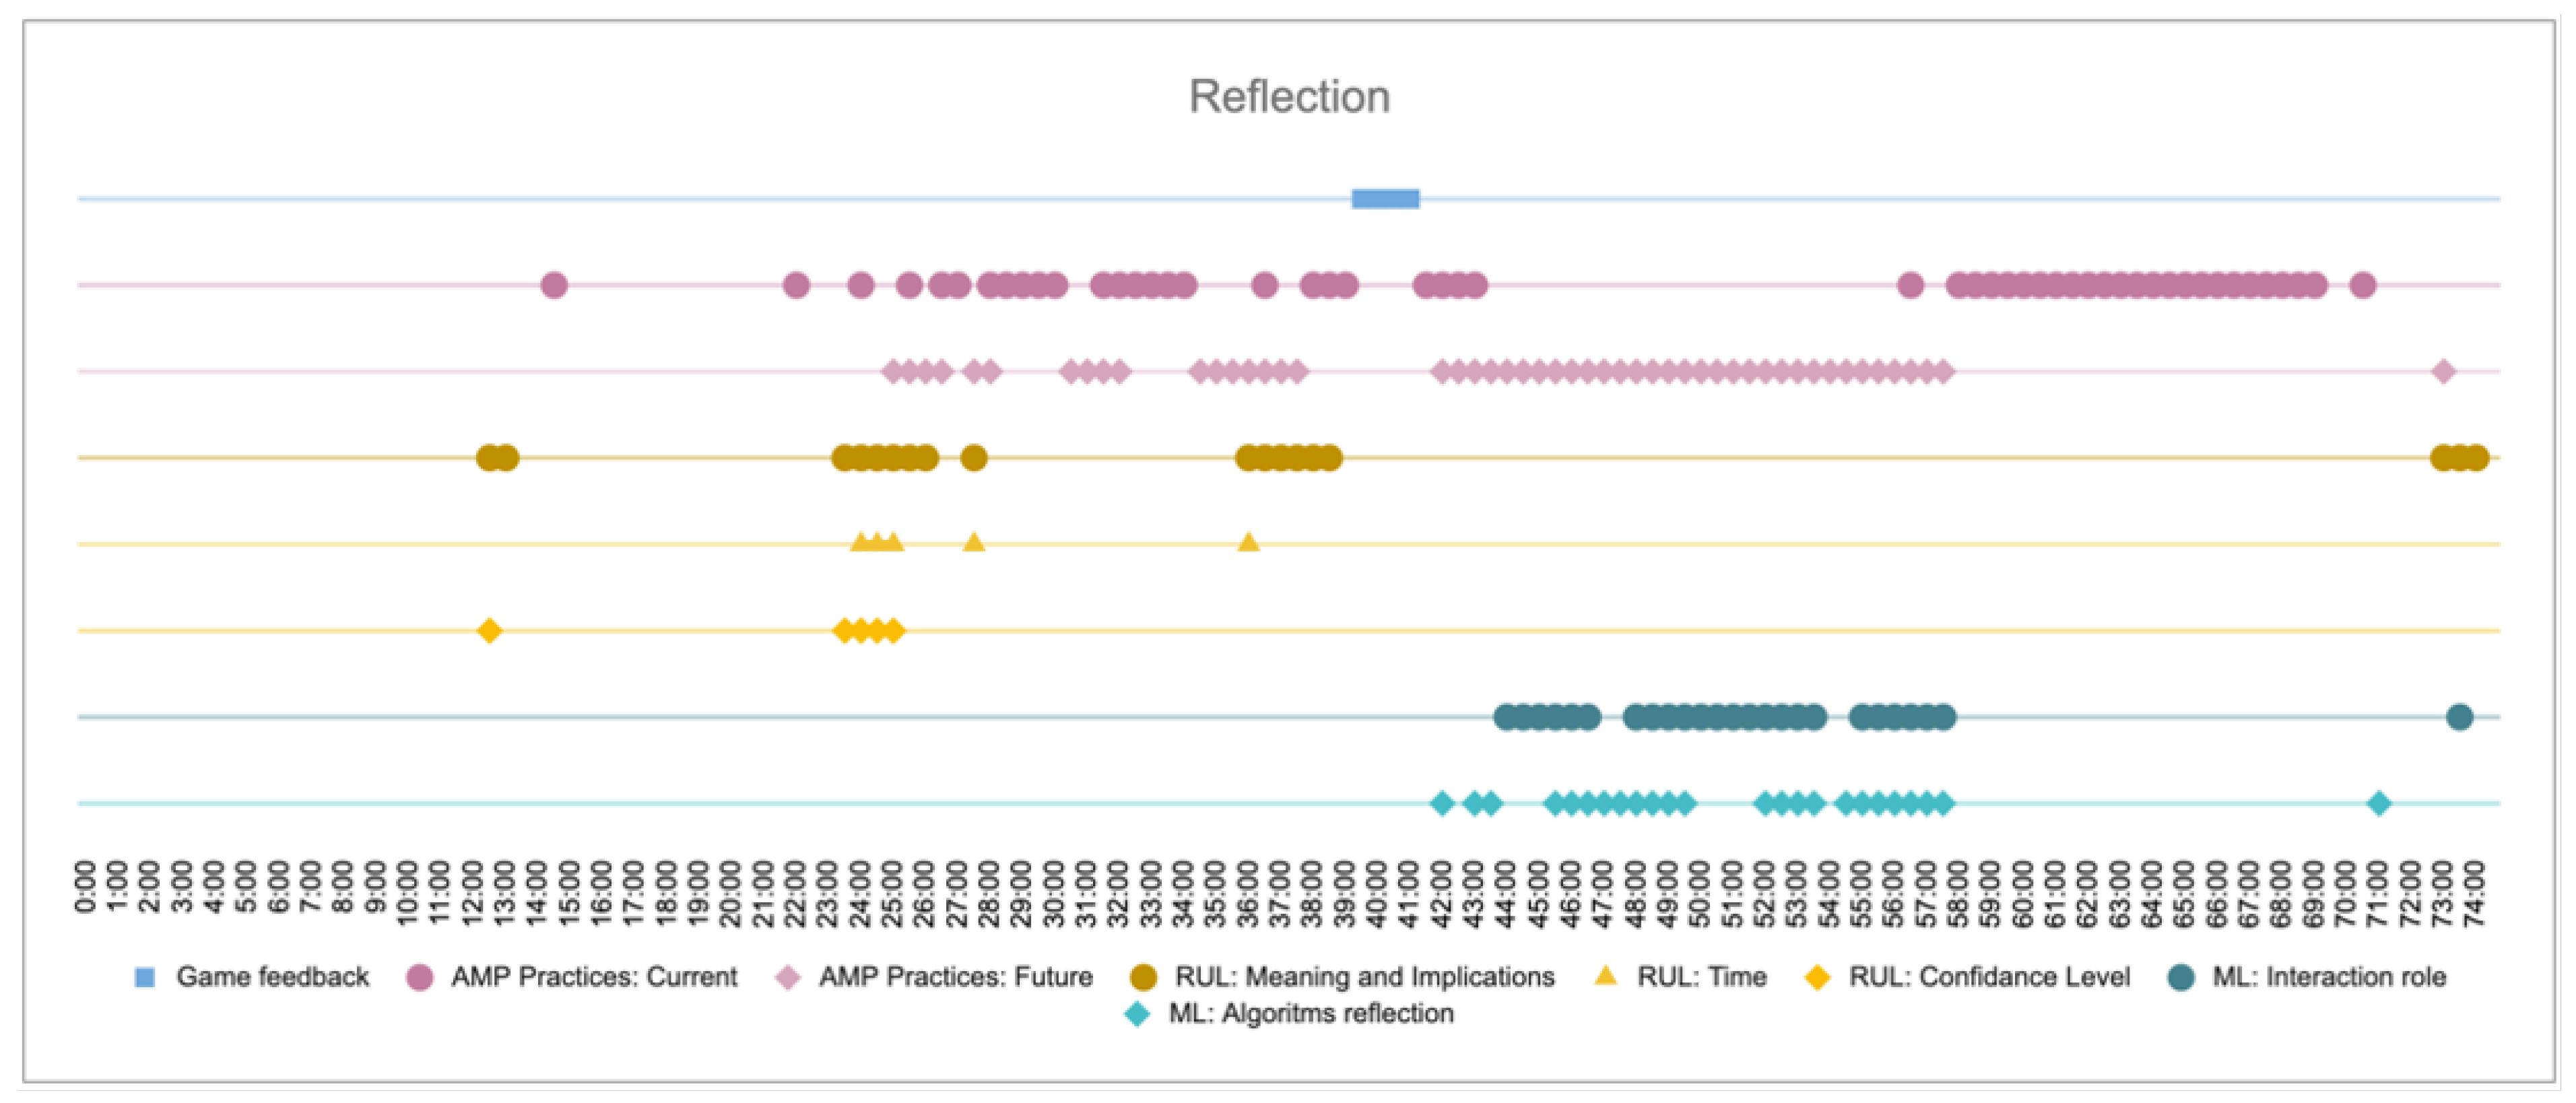
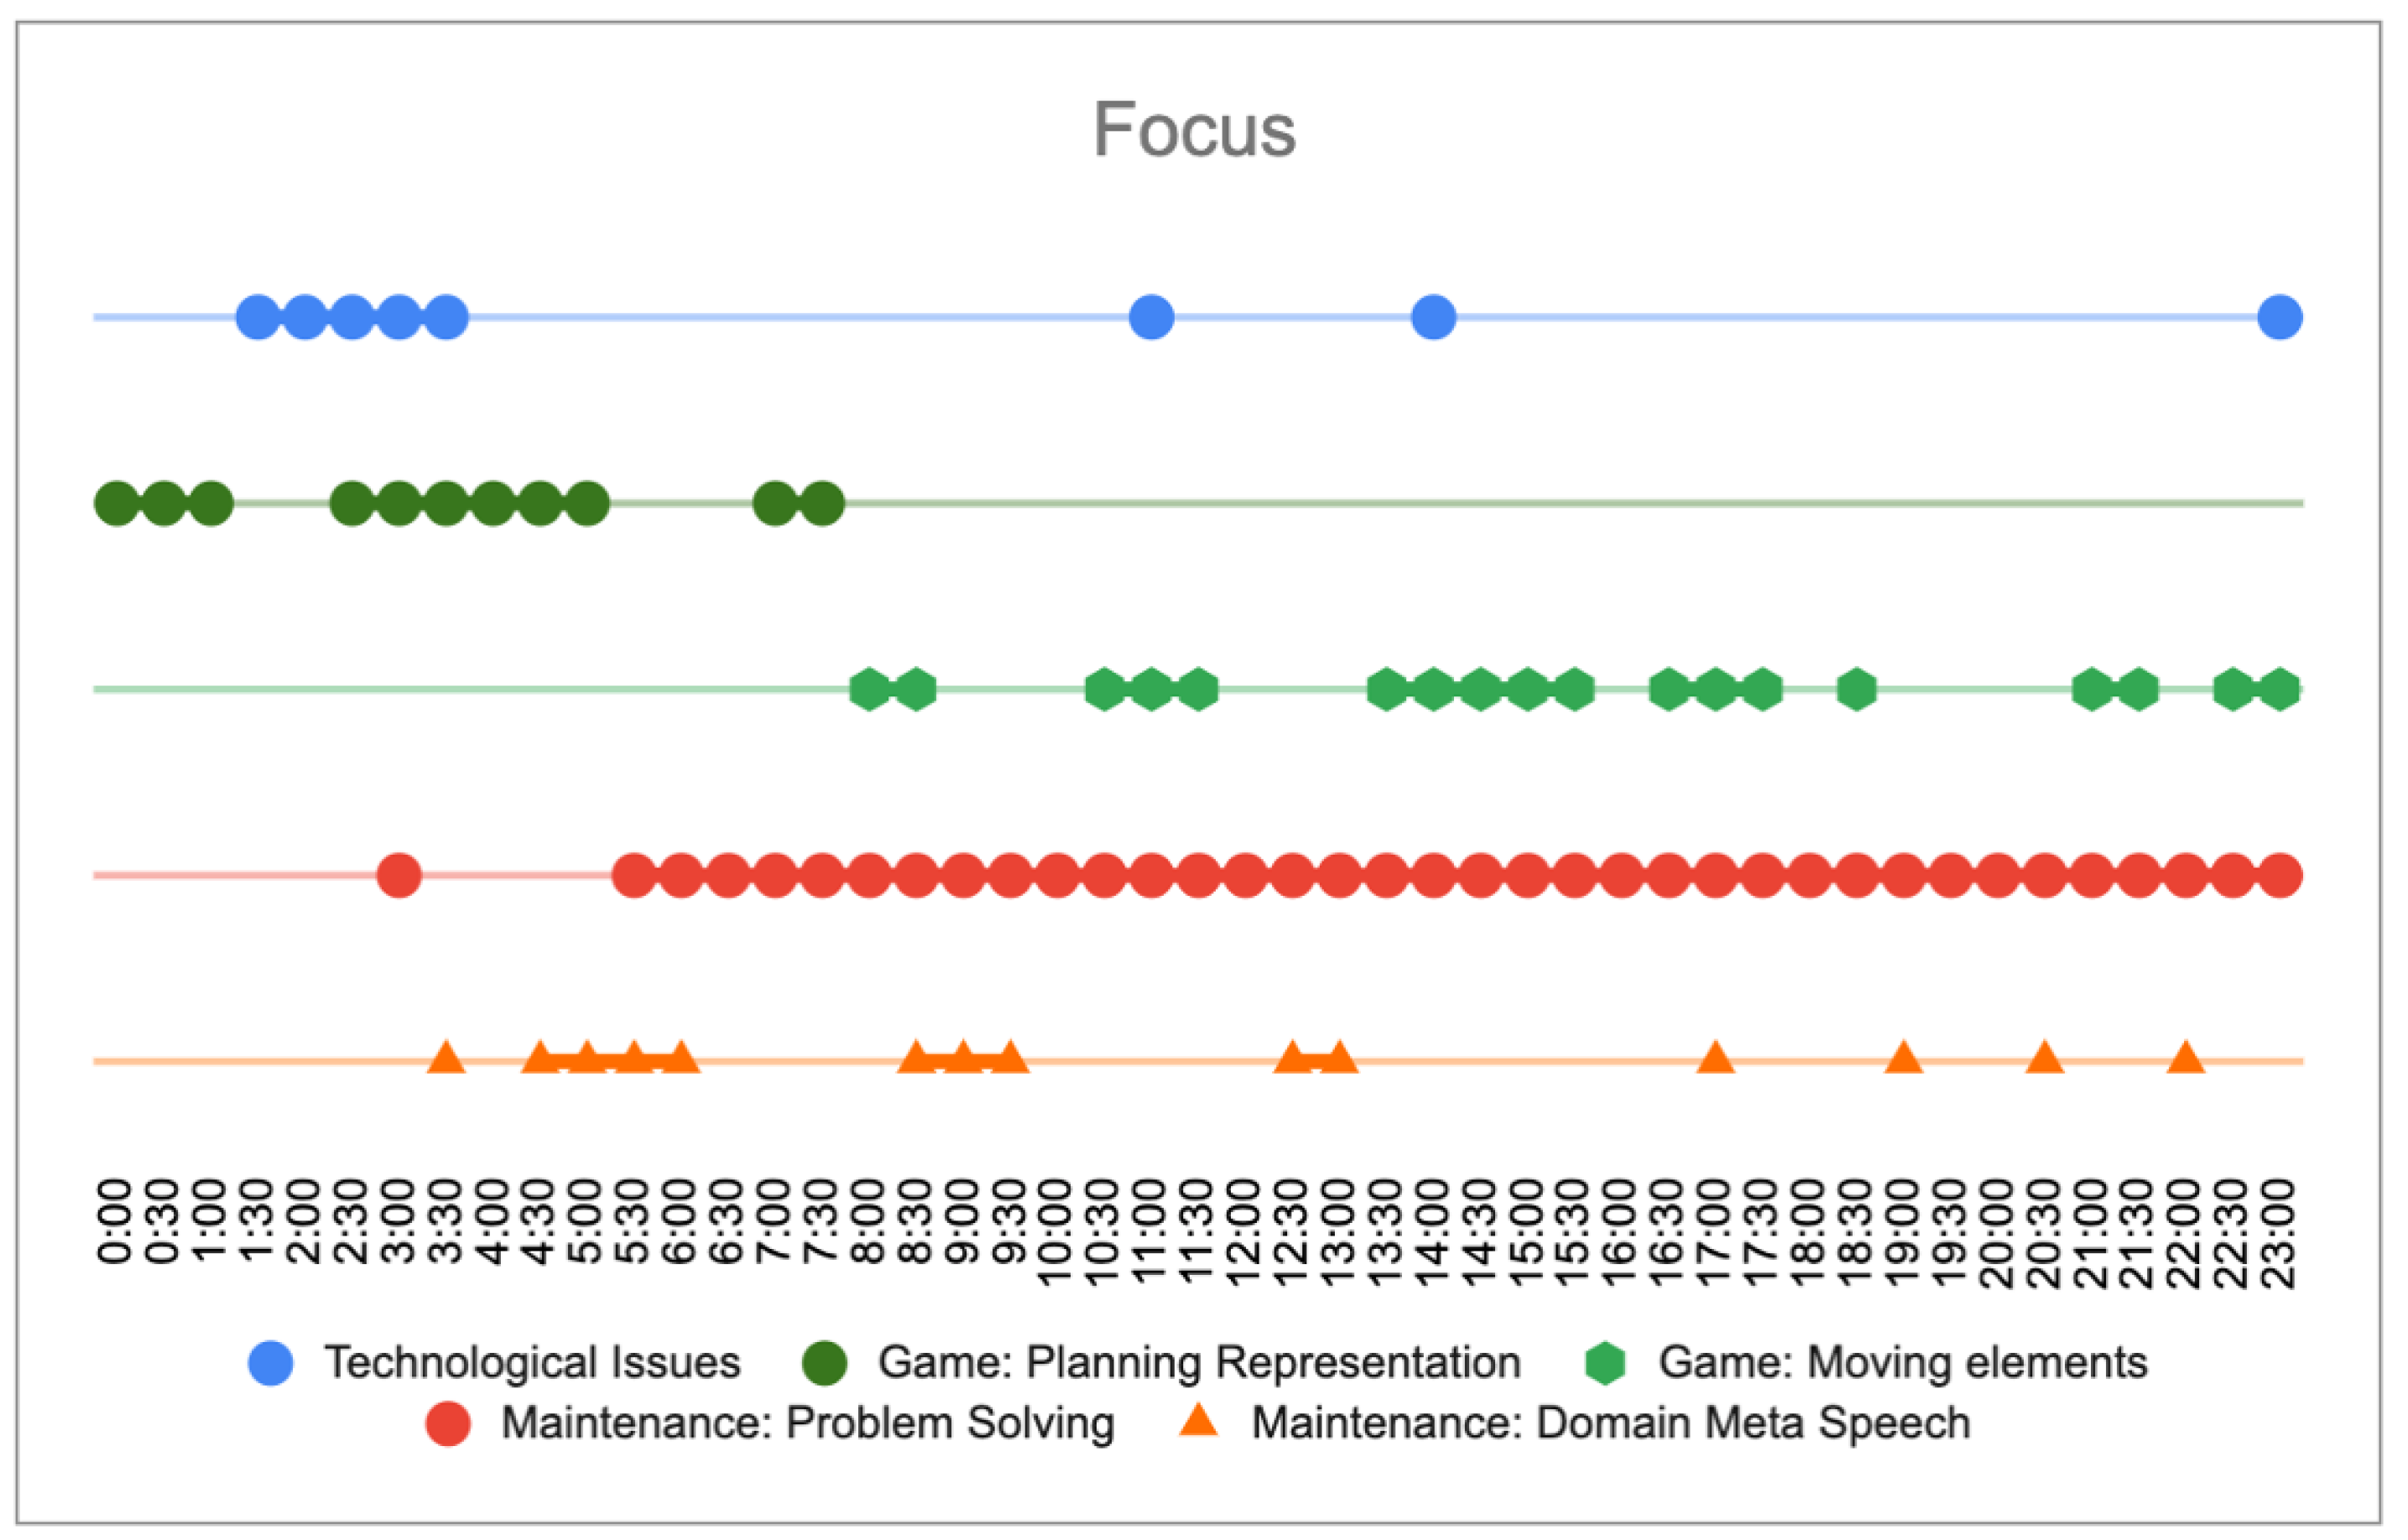
6.1. Content Coding
6.2. Conversation Analysis
7. Design Outcomes
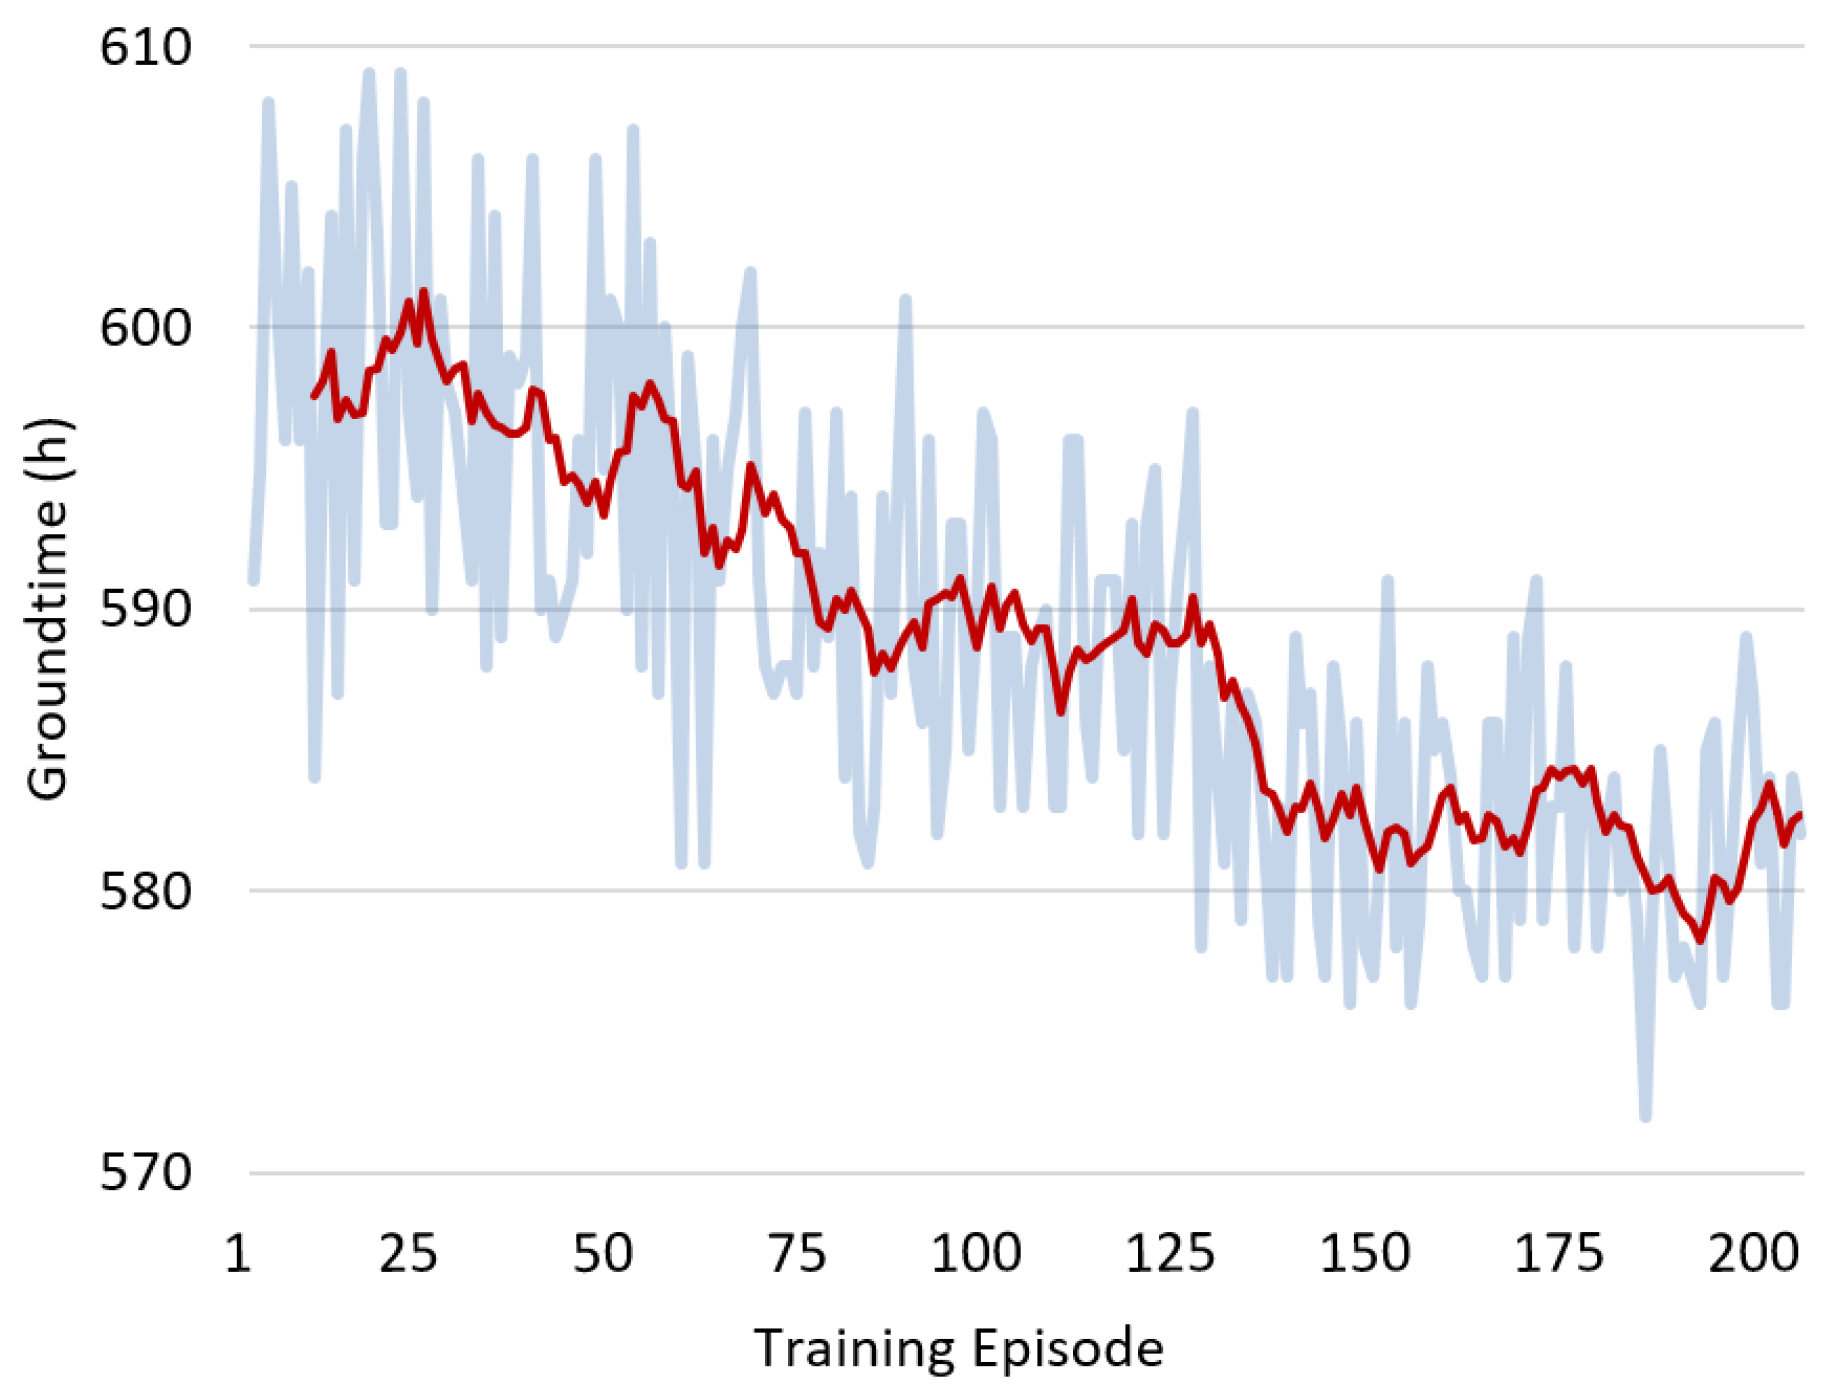
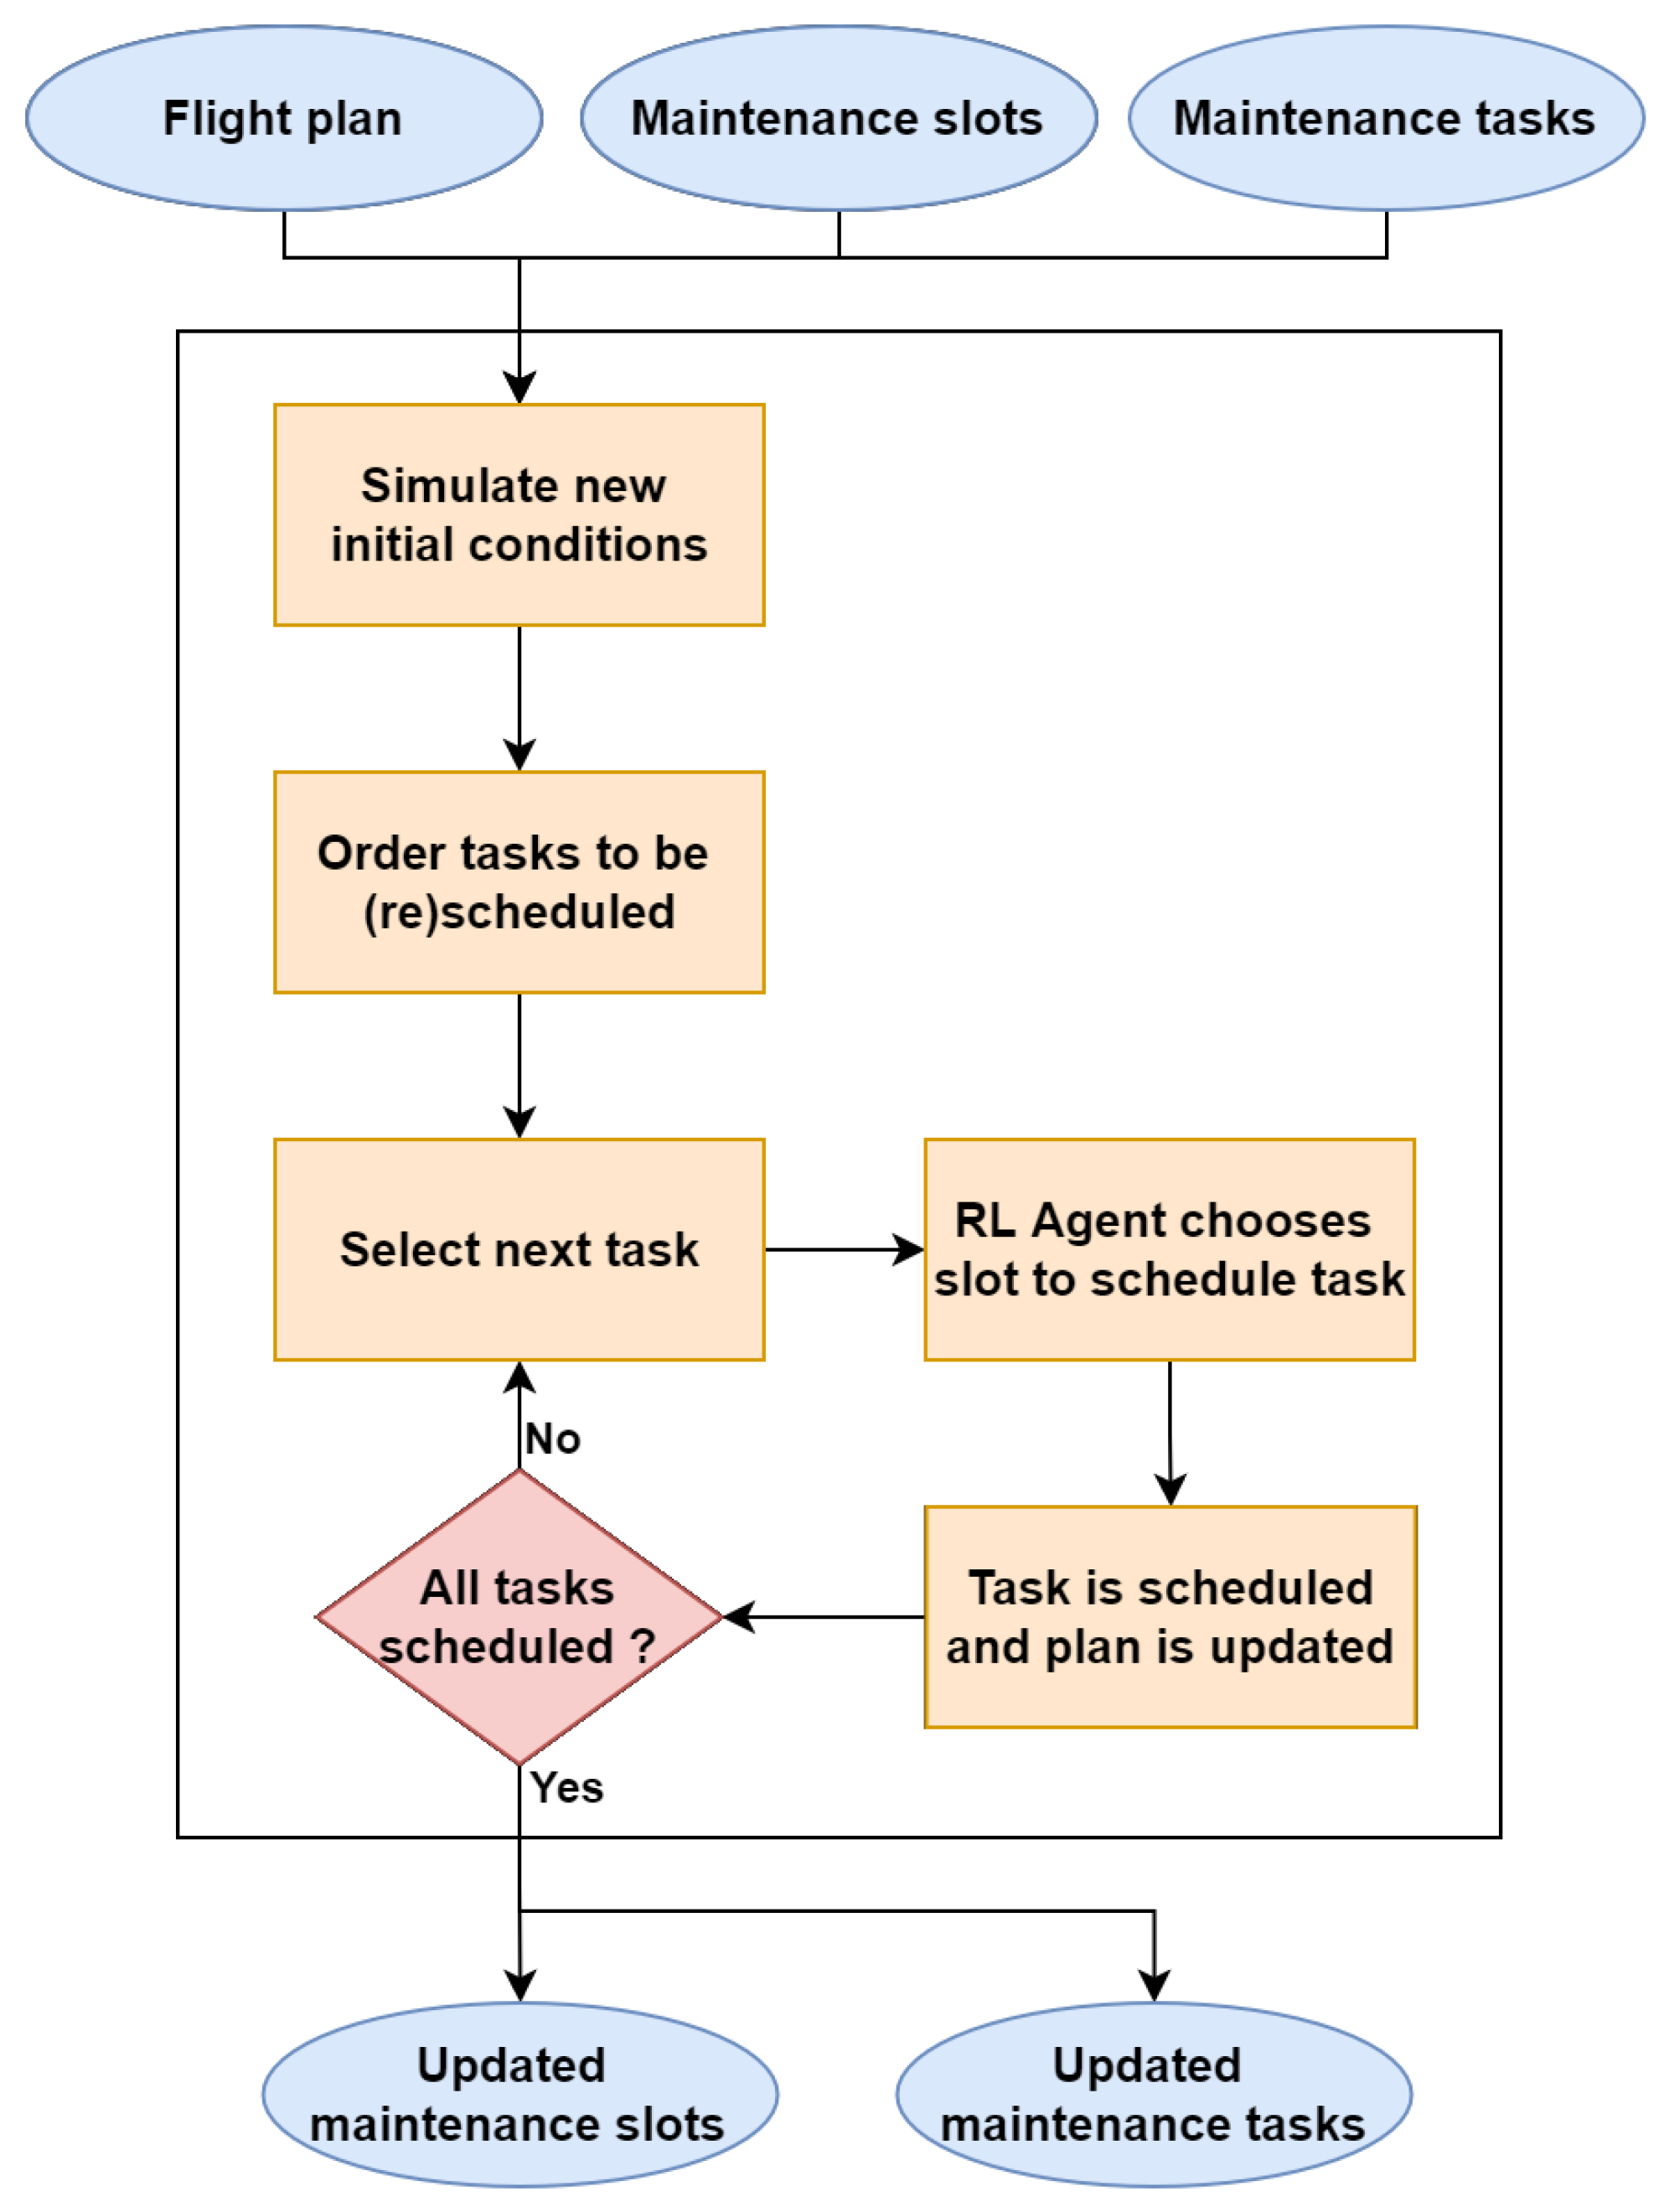
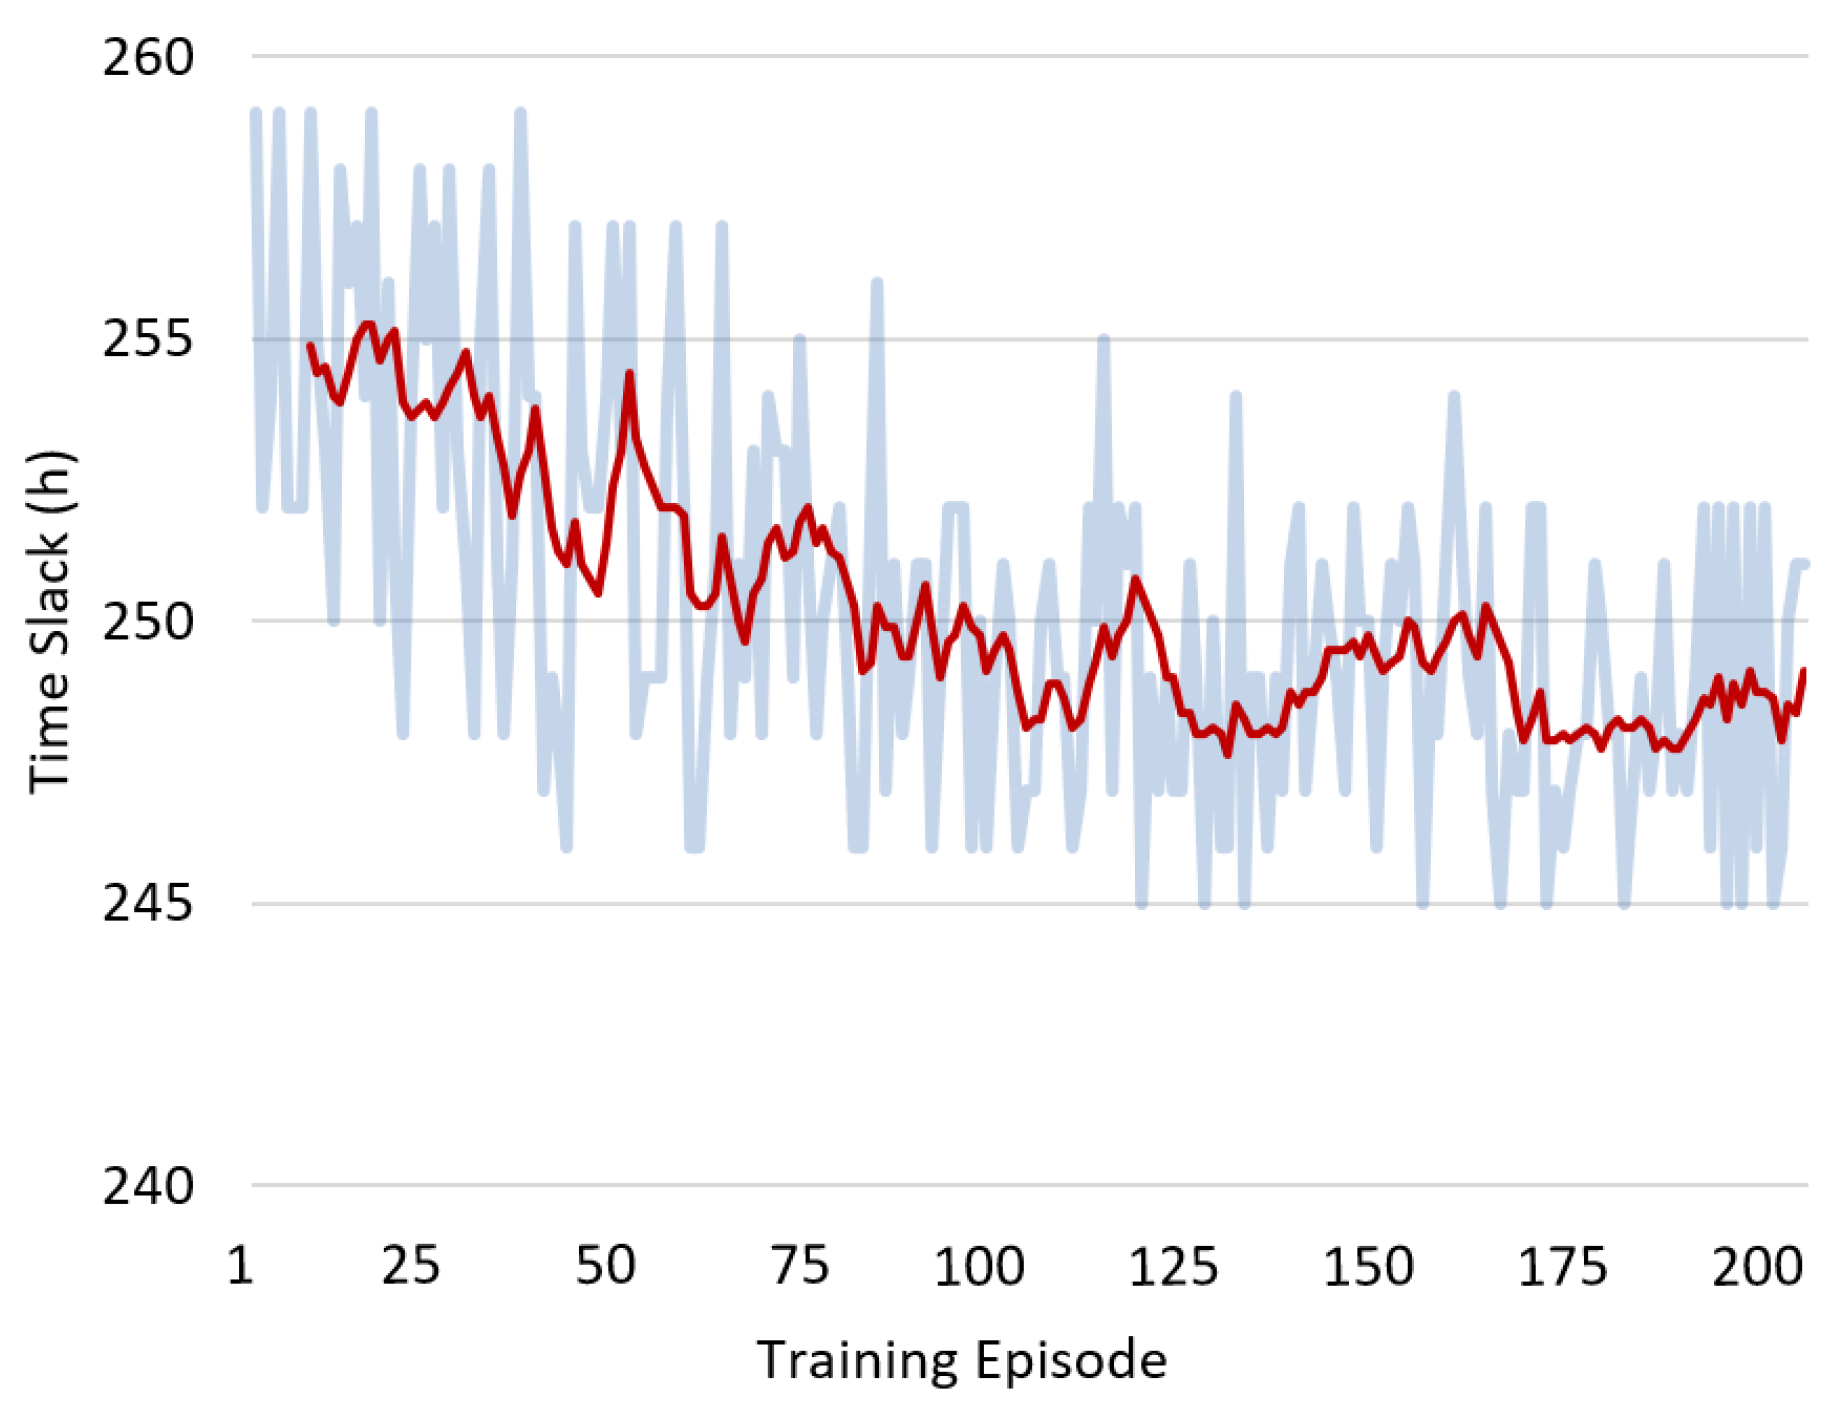
7.1. Automatic Planning Agent
- Category A: No standard interval is specified. However, items in this category shall be repaired within the time interval specified in the “Remarks and Exceptions” column of the operator’s approved MMEL.
- Category B: Items in this category shall be rectified within 3 calendar days (excluding the day of discovery).
- Category C: Items in this category shall be rectified within 10 calendar days (excluding the day of discovery).
- Category D: Items in this category shall be rectified within 120 calendar days (excluding the day of discovery).
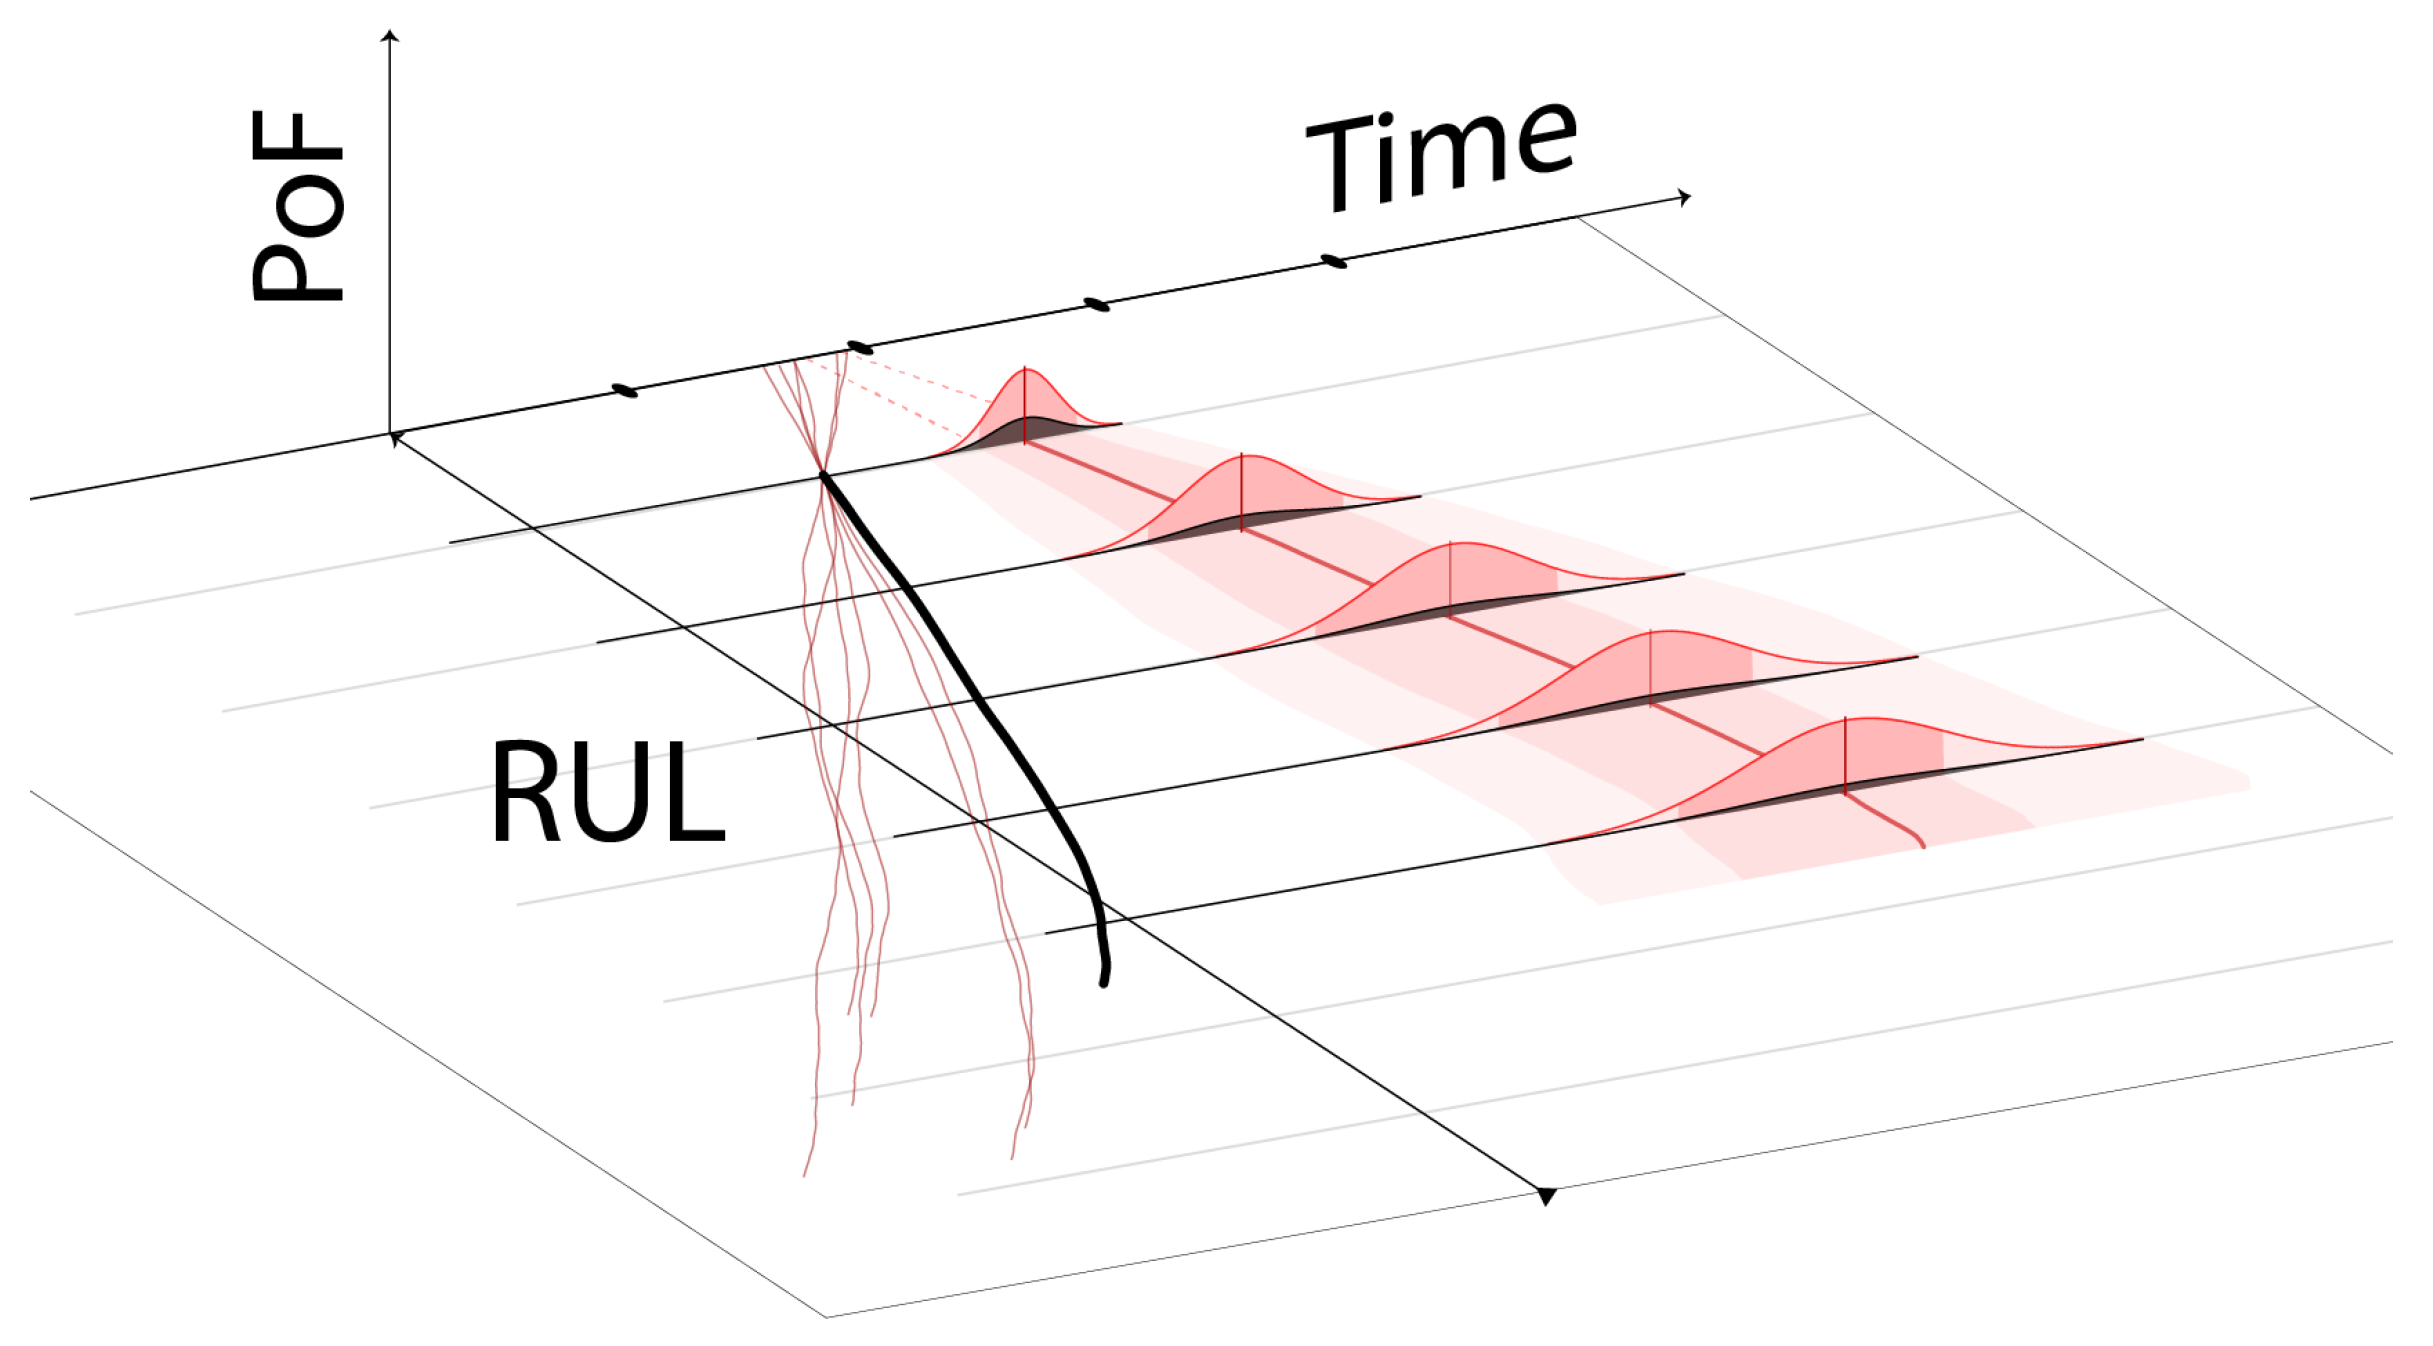
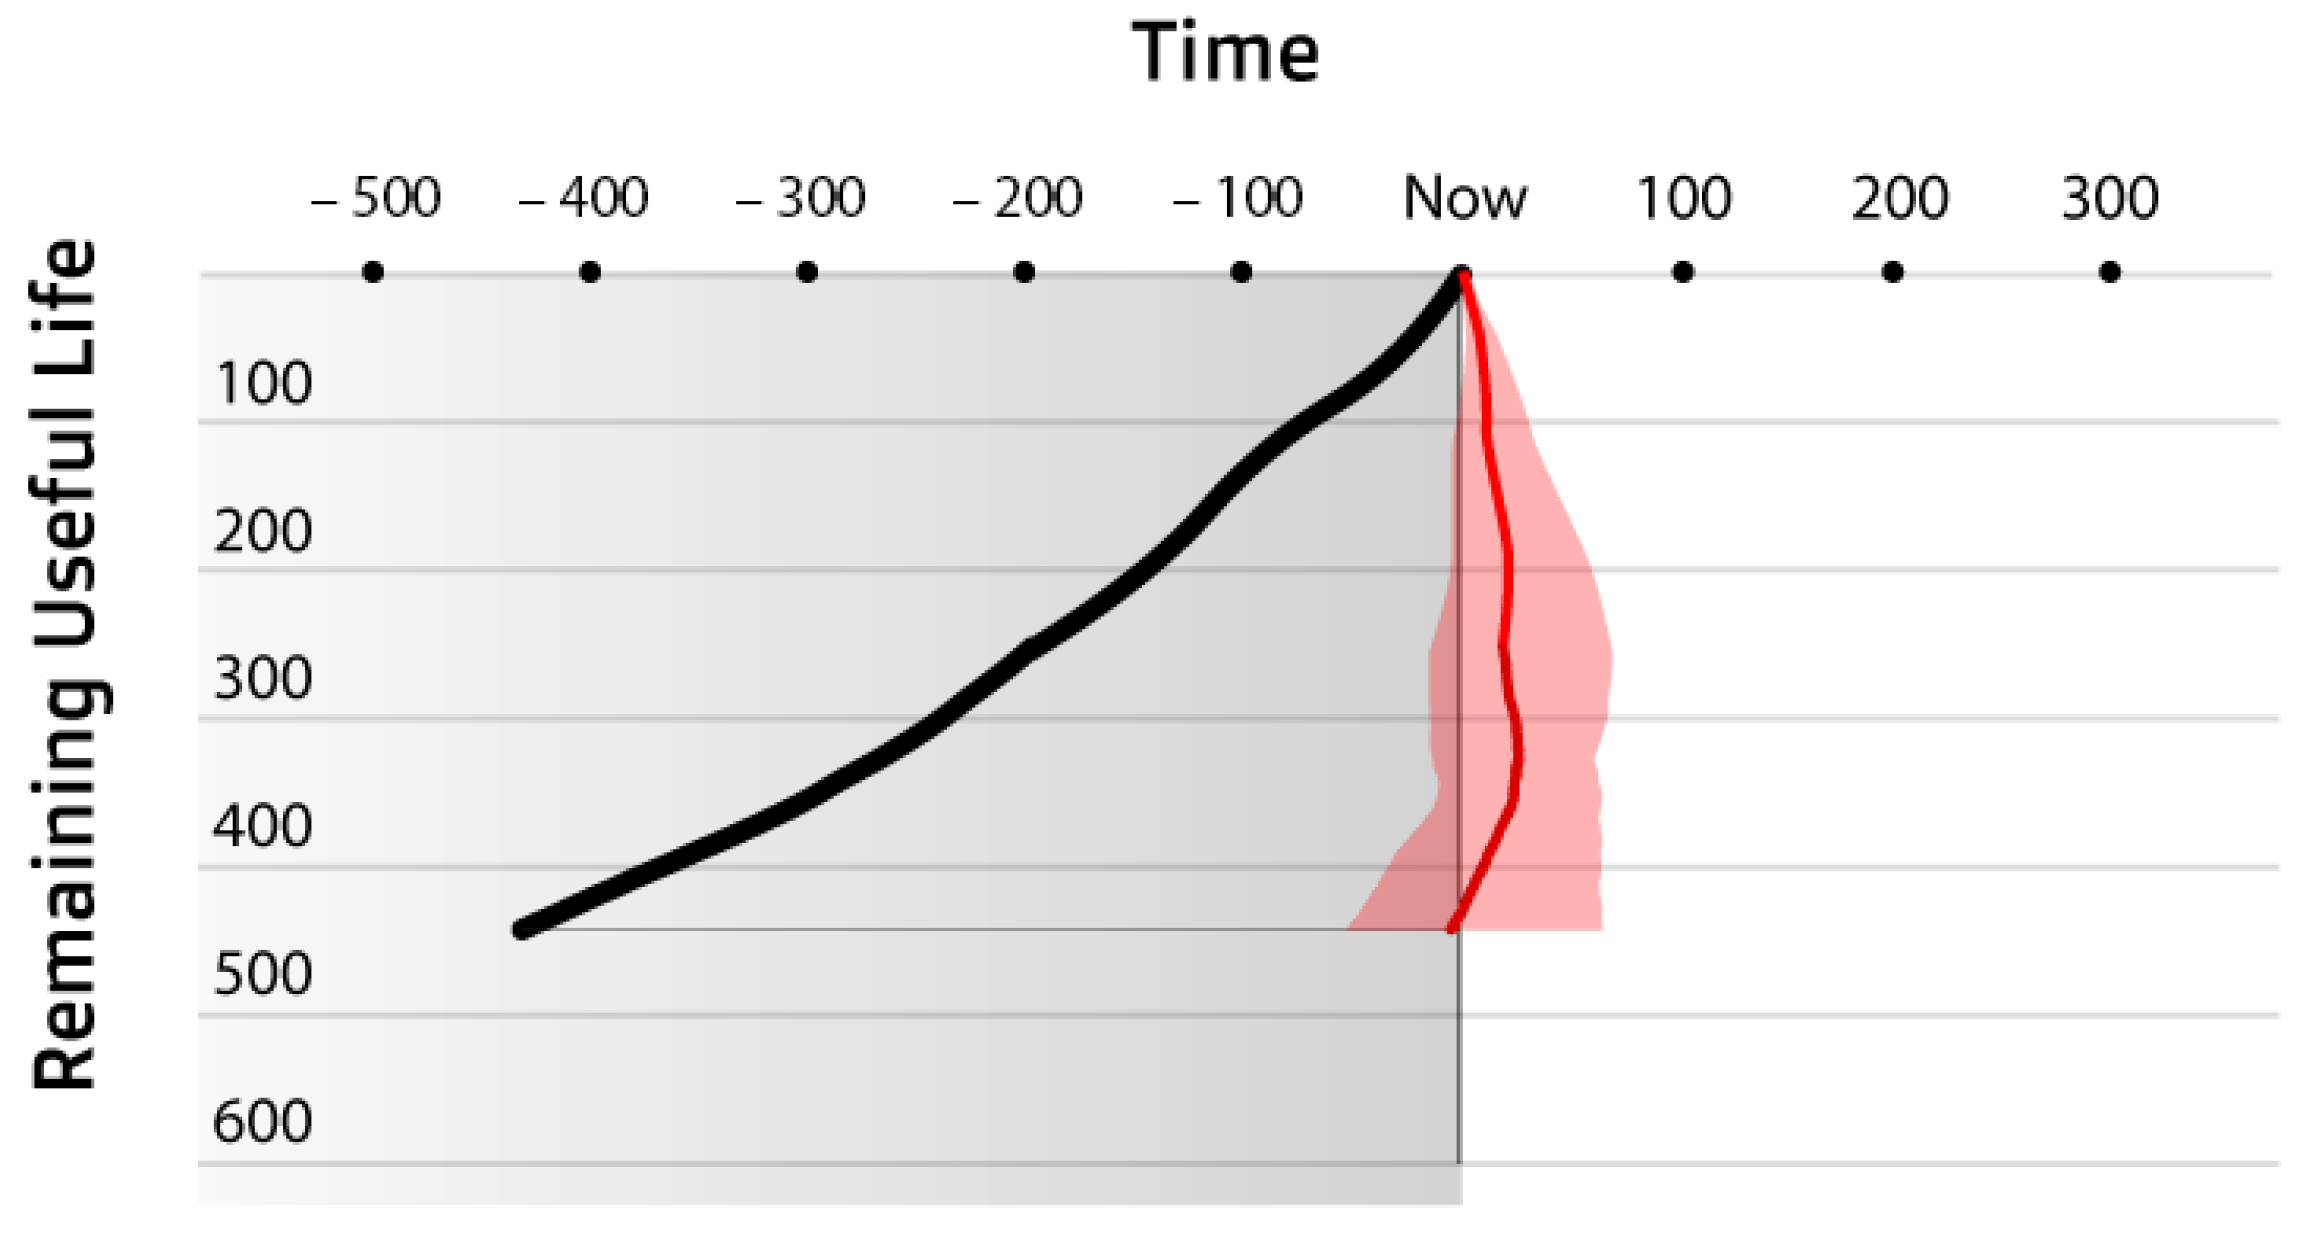
7.2. RUL Visualisation
8. Discussion and Reflection
Author Contributions
Funding
Institutional Review Board Statement
Informed Consent Statement
Data Availability Statement
Conflicts of Interest
References
- Andrade, P.; Silva, C.; Ribeiro, B.; Santos, B.F. Aircraft maintenance check scheduling using reinforcement learning. Aerospace 2021, 8, 113. [Google Scholar] [CrossRef]
- Bødker, S.; Kyng, M. Participatory design that matters—Facing the big issues. ACM Trans. Comput. Hum. Interact. 2018, 25, 1–31. [Google Scholar] [CrossRef] [Green Version]
- Bødker, S.; Roque, L.; Larsen-Ledet, I.; Thomas, V. Taming a Run-Away Object: How to Maintain and Extend Human Control in Human-Computer Interaction? 2018. Available online: https://pure.au.dk/ws/files/135965176/bodker_taming_a_runaway_object.pdf (accessed on 15 March 2022).
- Aigner, W.; Miksch, S.; Schumann, H.; Al, E. Visualization of Time-Oriented Data; Springer: London, UK, 2011. [Google Scholar]
- Munzner, T. Visualization Analysis & Design; CRC Press, Taylor & Francis Group: Boca Raton, FL, USA, 2015. [Google Scholar]
- Amershi, S.; Inkpen, K.; Teevan, J.; Kikin-Gil, R.; Horvitz, E.; Weld, D.; Vorvoreanu, M.; Fourney, A.; Nushi, B.; Collisson, P.; et al. Guidelines for Human-AI Interaction. In Proceedings of the 2019 CHI Conference on Human Factors in Computing Systems—CHI ’19, Glasgow, UK, 4–9 May 2019; ACM Press: New York, NY, USA, 2019; pp. 1–13. [Google Scholar] [CrossRef]
- Holbrook, J. Human-Centered Machine Learning. 2020. Available online: https://medium.com/google-design/human-centered-machine-learning-a770d10562cd (accessed on 16 April 2020).
- Wright, A.P.; Wang, Z.J.; Park, H.; Guo, G.; Sperrle, F.; El-Assady, M.; Endert, A.; Keim, D.; Chau, D.H. A Comparative Analysis of Industry Human-AI Interaction Guidelines. 2020. Available online: http://xxx.lanl.gov/abs/2010.11761 (accessed on 22 October 2020).
- Guzdial, M.; Liao, N.; Chen, J.; Chen, S.Y.; Shah, S.; Shah, V.; Reno, J.; Smith, G.; Riedl, M.O. Friend, collaborator, student, manager: How design of an AI-driven game level editor affects creators. In Proceedings of the Conference on Human Factors in Computing Systems—Proceedings, Glasgow, UK, 4–9 May 2019; pp. 1–13. Available online: http://xxx.lanl.gov/abs/1901.06417 (accessed on 24 March 2020). [CrossRef] [Green Version]
- Abdul, A.; Vermeulen, J.; Wang, D.; Lim, B.Y.; Kankanhalli, M. Trends and trajectories for explainable, accountable and intelligible systems: An HCI research agenda. In Proceedings of the Conference on Human Factors in Computing Systems, Montreal, QC, Canada, 21–26 April 2018. [Google Scholar] [CrossRef]
- Wang, D.; Yang, Q.; Abdul, A.; Lim, B.Y.; States, U. Designing Theory-Driven User-Centric Explainable AI. In Proceedings of the 2019 CHI Conference on Human Factors in Computing Systems, Glasgow, UK, 4–9 May 2019; pp. 1–15. [Google Scholar]
- Zhou, J.; Gandomi, A.H.; Chen, F.; Holzinger, A. Evaluating the quality of machine learning explanations: A survey on methods and metrics. Electronics 2021, 10, 593. [Google Scholar] [CrossRef]
- Linardatos, P.; Papastefanopoulos, V.; Kotsiantis, S. Explainable ai: A review of machine learning interpretability methods. Entropy 2021, 23, 18. [Google Scholar] [CrossRef]
- Bhatt, U.; Xiang, A.; Sharma, S.; Weller, A.; Taly, A.; Jia, Y.; Ghosh, J.; Puri, R.; Moura, J.M.; Eckersley, P. Explainable machine learning in deployment. In Proceedings of the 2020 Conference on Fairness, Accountability, and Transparency, Barcelona, Spain, 27–30 January 2020; pp. 648–657. Available online: http://xxx.lanl.gov/abs/1909.06342 (accessed on 1 February 2022). [CrossRef]
- Knowles, M.; Baglee, D.; Wermter, S. Reinforcement Learning for Scheduling of Maintenance. In Research and Development in Intelligent Systems XXVII; Bramer, M., Petridis, M., Hopgood, A., Eds.; Springer: London, UK, 2011; pp. 409–422. [Google Scholar] [CrossRef] [Green Version]
- Wang, X.; Wang, H.; Qi, C. Multi-agent reinforcement learning based maintenance policy for a resource constrained flow line system. J. Intell. Manuf. 2016, 27, 325–333. [Google Scholar] [CrossRef]
- Barde, S.R.A.; Yacout, S.; Shin, H. Optimal preventive maintenance policy based on reinforcement learning of a fleet of military trucks. J. Intell. Manuf. 2019, 30, 147–161. [Google Scholar] [CrossRef]
- Hu, Y.; Miao, X.; Zhang, J.; Liu, J.; Pan, E. Reinforcement learning-driven maintenance strategy: A novel solution for long-term aircraft maintenance decision optimization. Comput. Ind. Eng. 2021, 153, 107056. [Google Scholar] [CrossRef]
- Mattelmaki, T.; Korkeakoulu, T. Design Probes; University of Art and Design: Helsinki, Finland, 2008. [Google Scholar]
- Gaver, W.W.; Boucher, A.; Pennington, S.; Walker, B. Cultural probes and the value of uncertainty. Interactions 2004, 11, 53. [Google Scholar] [CrossRef]
- Wallace, J.; McCarthy, J.; Wright, P.C.; Olivier, P. Making design probes work. In Proceedings of the Conference on Human Factors in Computing Systems, Paris, France, 27 April–2 May 2013; pp. 3441–3450. [Google Scholar] [CrossRef] [Green Version]
- Celikoglu, O.M.; Ogut, S.T.; Krippendorff, K. How Do User Stories Inspire Design? A Study of Cultural Probes. Des. Issues 2017, 33, 84–98. [Google Scholar] [CrossRef]
- Lange-Nielsen, F.; Lafont, X.V.; Cassar, B.; Khaled, R. Involving players earlier in the game design process using cultural probes. In Proceedings of the 4th International Conference on Fun and Games, Toulouse, France, 4–6 September 2012; ACM Press: New York, NY, USA, 2012; pp. 45–54. [Google Scholar] [CrossRef]
- Hutchinson, H.; Mackay, W.; Westerlund, B.; Bederson, B.B.; Druin, A.; Plaisant, C.; Beaudouin-Lafon, M.; Conversy, S.; Evans, H.; Hansen, H.; et al. Technology probes: Inspiring design for and with families. In Proceedings of the Conference on Human Factors in Computing Systems, Ft. Lauderdale, FL, USA, 5–10 April 2003; pp. 17–24. [Google Scholar]
- Huizinga, J. Homo Ludens: A Study of the Play-Element in Culture; Angelico Press: Brooklyn, NY, USA, 2016. [Google Scholar]
- Bernhaupt, R.; Weiss, A.; Obrist, M.; Tscheligi, M. Playful probing: Making probing more fun. In Lecture Notes in Computer Science (Including Subseries Lecture Notes in Artificial Intelligence and Lecture Notes in Bioinformatics); 4662 LNCS; Springer: Berlin/Heidelberg, Germany, 2007; pp. 606–619. [Google Scholar] [CrossRef] [Green Version]
- Sjovoll, V.; Gulden, T. Play probes—As a productive space and source for information. In Proceedings of the 18th International Conference on Engineering and Product Design Education, Design Education: Collaboration and Cross-Disciplinarity, Aalborg, Denmark, 8–9 September 2016; The Design Society: Copenhagen, Denmark, 2016; pp. 342–347. [Google Scholar]
- Gaver, B.; Dunne, T.; Pacenti, E. Design: Cultural probes. Interactions 1999, 6, 21–29. [Google Scholar] [CrossRef]
- Ribeiro, J.; Roque, L. Playfully probing practice-automation dialectics in designing new ML-tools. In Proceedings of the VideoJogos 2020: 12th International Conference on Videogame Sciences and Arts, Mirandela, Portugal, 26–28 November 2020; pp. 1–9. [Google Scholar]
- Vaishnavi, V.K.; Purao, S. (Eds.) DESRIST ’09: Design Science Research in Information Systems and Technologies. In Proceedings of the 4th International Conference on Design Science Research in Information Systems and Technology, Philadelphia, PA, USA, 7–8 May 2009. [Google Scholar]
- Figma. Where Teams Design Together. 2020. Available online: https://www.figma.com (accessed on 13 July 2020).
- Nielsen, J. The Usability Engineering Life Cycle. Computer 1992, 25, 12–22. [Google Scholar] [CrossRef]
- Goebel, K.; Saxena, A.; Daigle, M.; Celaya, J.; Roychoudhury, I.; Clements, S. Introduction to prognostics. In Proceedings of the European PHM Conference, Dresden, Germany, 3–5 July 2012. [Google Scholar]
- EASA. Certification Specifications and Guidance Material for Master Minimum Equipment List (CS-MMEL). 2021. Available online: https://www.easa.europa.eu/document-library/certification-specifications/cs-mmel-issue-3 (accessed on 1 May 2022).


| Design Outcomes | Automatic Planning Scheduling | RUL Visualisation |
|---|---|---|
| RUL only applies to short-term maintenance. | x | x |
| Different RUL should have the same confidence level. | x | x |
| RUL should be visualised as a distribution of probabilities instead of fixed value or Boxplot. | x | |
| RUL estimates should be flexible (not mandatory as due dates). | x | x |
| It should be possible to plan maintenances after RUL estimates. | x | |
| The planned schedule should take into account maintenance opportunities. | x | |
| The planned schedule should take into account the global state of the fleet. | x | |
| The planned schedule should take into account the impact of every maintenance necessary (operation/costs). | x | |
| The planner is not responsible for taking decision related to the technical state of the plane. | x |
Publisher’s Note: MDPI stays neutral with regard to jurisdictional claims in published maps and institutional affiliations. |
© 2022 by the authors. Licensee MDPI, Basel, Switzerland. This article is an open access article distributed under the terms and conditions of the Creative Commons Attribution (CC BY) license (https://creativecommons.org/licenses/by/4.0/).
Share and Cite
Ribeiro, J.; Andrade, P.; Carvalho, M.; Silva, C.; Ribeiro, B.; Roque, L. Playful Probes for Design Interaction with Machine Learning: A Tool for Aircraft Condition-Based Maintenance Planning and Visualisation. Mathematics 2022, 10, 1604. https://doi.org/10.3390/math10091604
Ribeiro J, Andrade P, Carvalho M, Silva C, Ribeiro B, Roque L. Playful Probes for Design Interaction with Machine Learning: A Tool for Aircraft Condition-Based Maintenance Planning and Visualisation. Mathematics. 2022; 10(9):1604. https://doi.org/10.3390/math10091604
Chicago/Turabian StyleRibeiro, Jorge, Pedro Andrade, Manuel Carvalho, Catarina Silva, Bernardete Ribeiro, and Licínio Roque. 2022. "Playful Probes for Design Interaction with Machine Learning: A Tool for Aircraft Condition-Based Maintenance Planning and Visualisation" Mathematics 10, no. 9: 1604. https://doi.org/10.3390/math10091604
APA StyleRibeiro, J., Andrade, P., Carvalho, M., Silva, C., Ribeiro, B., & Roque, L. (2022). Playful Probes for Design Interaction with Machine Learning: A Tool for Aircraft Condition-Based Maintenance Planning and Visualisation. Mathematics, 10(9), 1604. https://doi.org/10.3390/math10091604