Review

A Review of Energy and Sustainability KPI-Based Monitoring and Control Methodologies on WWTPs

1
Institute of Systems and Robotics, Department of Electrical and Computer Engineering, University of Coimbra, Pólo II, 3030-290 Coimbra, Portugal
2
INEGI-Instituto de Ciência e Inovação em Engenharia Mecânica e Engenharia Industrial, Campus da FEUP, Rua Dr. Roberto Frias 400, 4200-465 Porto, Portugal
*
Author to whom correspondence should be addressed.
These authors contributed equally to this work.
Mathematics 2023, 11(1), 173; https://doi.org/10.3390/math11010173
Submission received: 7 December 2022 / Revised: 22 December 2022 / Accepted: 23 December 2022 / Published: 29 December 2022

Abstract

:
Humanity faces serious problems related to water supply, which will be aggravated by population growth. The water used in human activities must be treated to make it available again without posing risks to human health and the environment. In this context, Wastewater Treatment Plants (WWTPs) have gained importance. The treatment process in WWTPs is complex, consisting of several stages, which consume considerable amounts of resources, mainly electrical energy. Minimizing such energy consumption while satisfying quality and environmental requirements is essential, but it is a challenging task due to the complexity of the processes carried out in WWTPs. One form of evaluating the performance of WWTPs is through the well-known Key Performance Indicators (KPIs). The KPIs are numerical indicators of process performance, being a simple and common way to assess the efficiency and eco-efficiency of a process. By applying KPIs to WWTPs, techniques for monitoring, predicting, controlling, and optimizing the efficiency and eco-efficiency of WWTPs can be created or improved. However, the use of computational methodologies that use KPIs (KPIs-based methodologies) is still limited. This paper provides a literature review of the current state-of-the-art of KPI-based methodologies to monitor, control and optimize energy efficiency and eco-efficiency in WWTPs. In this paper, studies presented on 21 papers are identified, assessed and synthesized, 12 being related to monitoring and predicting problems, and 9 related to control and optimization problems. Future research directions relating to unresolved problems are also identified and discussed.

1. Introduction

The industry has significantly increased their processes’ complexity. The growth in competitiveness, the demand for higher quality, lower costs, and minimal production time, combined with stricter restrictions in environmental legislation, as well as the need for improving the sustainability and circular economy, and several other factors have contributed to this increase in complexity [1,2]. These changes, under an “Industry 4.0” strategy, increased the need to measure the efficiency and performance of industrial processes. In this way, advanced industrial monitorization, control and optimization solutions of high efficiency and reliability are increasingly required. For this purpose, the industry has been using the well-known Key Performance Indicators (KPIs), which are performance indicators for assessment and performance measurement.
KPIs are metrics that give a numerical value on the success of a system and indicate what can be carried out to achieve established goals [3]. KPIs are an important instrument that allows managers and operators to infer the state of performance of a process or system, detect flaws and identify potential opportunities for improvement in a clear and transparent way. KPIs can be determined to reflect the performance of a process in a holistic perspective, or in relation to different layers or subsystems. Thus, they are often used for monitoring, in order to identify the area that needs more attention intending to improve performance. However, for KPIs to be effective, the measures they are based on must be properly selected. Therefore, it is essential to clearly define the operational success factors. The origin and context of a KPI should be transparent, since its selection depends entirely on the expert management perspective.
Related to the typical process industry, KPIs are present in the entire well-known automation pyramid represented by the five levels of automation: Management Decision Making, Planning Level, Supervisory Control (SCADA), Control (PLCs) level, and Factory floor (sensors, actuators, communication) [4]. There are several types of KPIs, namely: financial, energy, operational, equipment, environmental, and many others. Financial KPIs [5] are based on the monetary costs derived from an activity or set of activities. Energy KPIs are obtained through the ratio between energy output and energy input or between the energy input and produced output. Environmental KPIs reflect the environmental performance of a system in terms of environmental targets [6]. Operational KPIs take into account the overall effectiveness of processes or equipment (e.g., percentage of full quality products of the production, over a time period). Equipment KPIs are used to indicate the condition of equipment and in some cases predict when maintenance will be required [7]. Thus, KPIs are powerful tools to support decision-making for managers and operators of a process or set of processes, even in very complex environments such as wastewater treatment plants.
The economic and social progress of the last decades has led to an increase in water consumption and demand quality standards. Wastewater treatment plants (WWTPs) are essential for the sustainable use of water, but ensuring the efficiency of a WWTP can be challenging. Generally, WWTPs are complex plants, consisting of multivariable and large-scale nonlinear processes, composed of miscellaneous interconnected control units [8,9,10,11]. The inlet wastewater undergoes significant variations in flow rate and composition. In addition, the processes have varying dynamics and are associated with several disturbances such as temperature and weather profile events [12,13,14]. In this way, ensuring the quality of effluent water and increasing energy efficiency, while complying with environmental regulations, makes determining the optimal control strategy in WWTPs a very complex task [15,16,17,18,19,20]. Moreover, as reported by several studies [21,22,23,24], most of the WWTP are inefficient, using more resources than necessary, which causes them to be less eco-efficient. For example, in [21], it was verified that most of the WWTPs’ efficiency was very low; with the plant size, quantity of organic matter removed, and type of bioreactor aeration being significant variables in explaining the differences in energy efficiency. In [22], the eco-efficiency was evaluated through the integration of economic cost, energy consumption, contaminant removal, and global warming effect for 736 sample plants, it was verified that most of the WWTPs were not stably efficient, being plant size, overcapacity and climate type influent variables on the resulting efficiency.
In recent years, the control efficiency in WWTPs has been the focus of experts’ attention. Advanced controllers, such as Model Predictive Control, controllers based on Artificial Neural Networks, and Fuzzy Logic Control techniques have emerged [25]. The Model Predictive Control (MPC) is able to consider multiple input and output variables and deal with several constraints. For such reasons and for being able to handle linear and nonlinear models, MPC is commonly used for dissolved oxygen, ammonium or nitrate control at WWTPs which are nonlinear processes [26,27,28]. Additionally, it has also been successful in several linear WWTP applications [29,30,31]. Artificial Neural Networks (ANNs) are an attractive technique for WWTP control and performance evaluation due to their ability to predict nonlinear and complex processes in which there is no predictive model [32,33]. A Fuzzy Logic Controller (FLC) is designed using linguistic rules defined by IF-THEN statements fuzzy rules, being an attractive alternative, due to its ability to handle processes nonlinearity, and to consider the knowledge of human operators [34,35,36]. There are many applications of FLC in WWTP for dissolved oxygen ( D O ) control [37,38], as energy saving and efficiency improvement [39,40], aeration control [41] and minimization of nitrous oxide emissions [42].
This paper presents the state-of-the-art of KPI-based methodologies for monitoring and control of WWTPs, with a major focus on monitoring and control methodologies that use KPIs related to energy efficiency and eco-efficiency to optimize the WWTP. Experts have been looking at KPIs as a possible solution for evaluating and optimizing the performance of WWTPs. There are several works about the choice and use of KPIs to monitor, failure prediction, optimization, and control the performance of WWTP processes. However, despite the recent recognition of numerous applications and advantages of using KPIs in WWTPs, there is still not much work in this direction. In this way, the review performed in this paper contributes to identifying which KPIs are used, what KPI-based methods for monitoring and control are used, how they were tested, and which simulators or real plants were used. Moreover, the methodologies presented in the selected papers are discussed and unresolved problems and proposals for future work are pointed out.
The paper is divided up as follows: Section 2 presents the methodology of the systematic literature review. Section 3 discusses the methodologies found in the literature for monitoring, control, and optimization based on KPIs, towards energy efficiency and sustainability of WWTPs. The discussion is presented in Section 4, and final remarks and conclusions are presented in Section 5.

2. Materials and Methods

This section describes the procedure used to conduct the literature review presented in this paper. The goal is to build a solid review of methodologies based on KPIs for monitoring, control, and optimization of WWTPs. The procedures were based on the Systematic Literature Review (SLR) method [43].

2.1. Problem Formulation

Many methodologies have already been used in WWTPs in order to make them more efficient. These methodologies essentially use data from variables provided mainly by sensors and actuators ( x 1 , x 2 , , x n ), i.e., a dataset D S (offline or online). The literature review presented in this work aims to present and discuss monitoring, control, and optimization methodologies ( M ( · ) ) that, in addition to using data from process variables ( D S = { x 1 , x 2 , , x n } ), use KPIs related to energy efficiency and eco-efficiency to provide some output(s) ( u ) in order to improve the process. In this way, the selection of works for the literature review was made according to Equation (1) and Figure 1, where M ( · ) is a method for monitoring, control, or optimization that provides an output(s) u that is based on defined KPIs given by KPIs . D S is a set of data from the process (e.g., sensor and actuators), and Θ represents the hyper-parameters of the method M:
u = M ( KPIs , D S , Θ ) .

2.2. Literature Review Planning Protocol

The following aspects were considered regarding KPI-based monitoring, control, and optimization methodologies for WWTPs:
  • Search questions:
    • Which KPIs are used?
    • Which KPI-based methods for monitoring, control, or optimization are used?
    • How were these KPI-based methods tested and which simulators were used?
    • What is the performance of these KPI-based methods?
  • Exclusion criteria:
    • Monitoring, control, and optimization works whose methodologies are not based on a KPI or any efficiency index;
    • Works that have not been tested in real or simulated WWTPs;
    • Works dated before the year 2012;
  • Quality criterion:
    • Works based on KPI or efficiency index tested in real or simulated WWTPs.
    • Works that compare its techniques with others.

2.3. Search Process

Specific keywords were defined and used on the databases ScienceDirect (http://www.sciencedirect.com), IEEE Xplore (https://ieeexplore.ieee.org), Springer Link (https://link.springer.com), and MDPI (https://www.mdpi.com). Lastly, the references of the papers of interest, such as the ones that cited them (backward/forward snowballing) were also analyzed. An exhaustive search was made because the subject in this review is relatively new and there is no fixed definition of the term. Therefore, the main query was defined as (“index” or “indicator” or “KPI”) AND (“efficiency” OR “environmental”) AND (“WWTP”) AND (“control” or “monitoring” or “optimization” or “evaluation”). A total of 21 papers were selected.

2.4. Publications over the Years

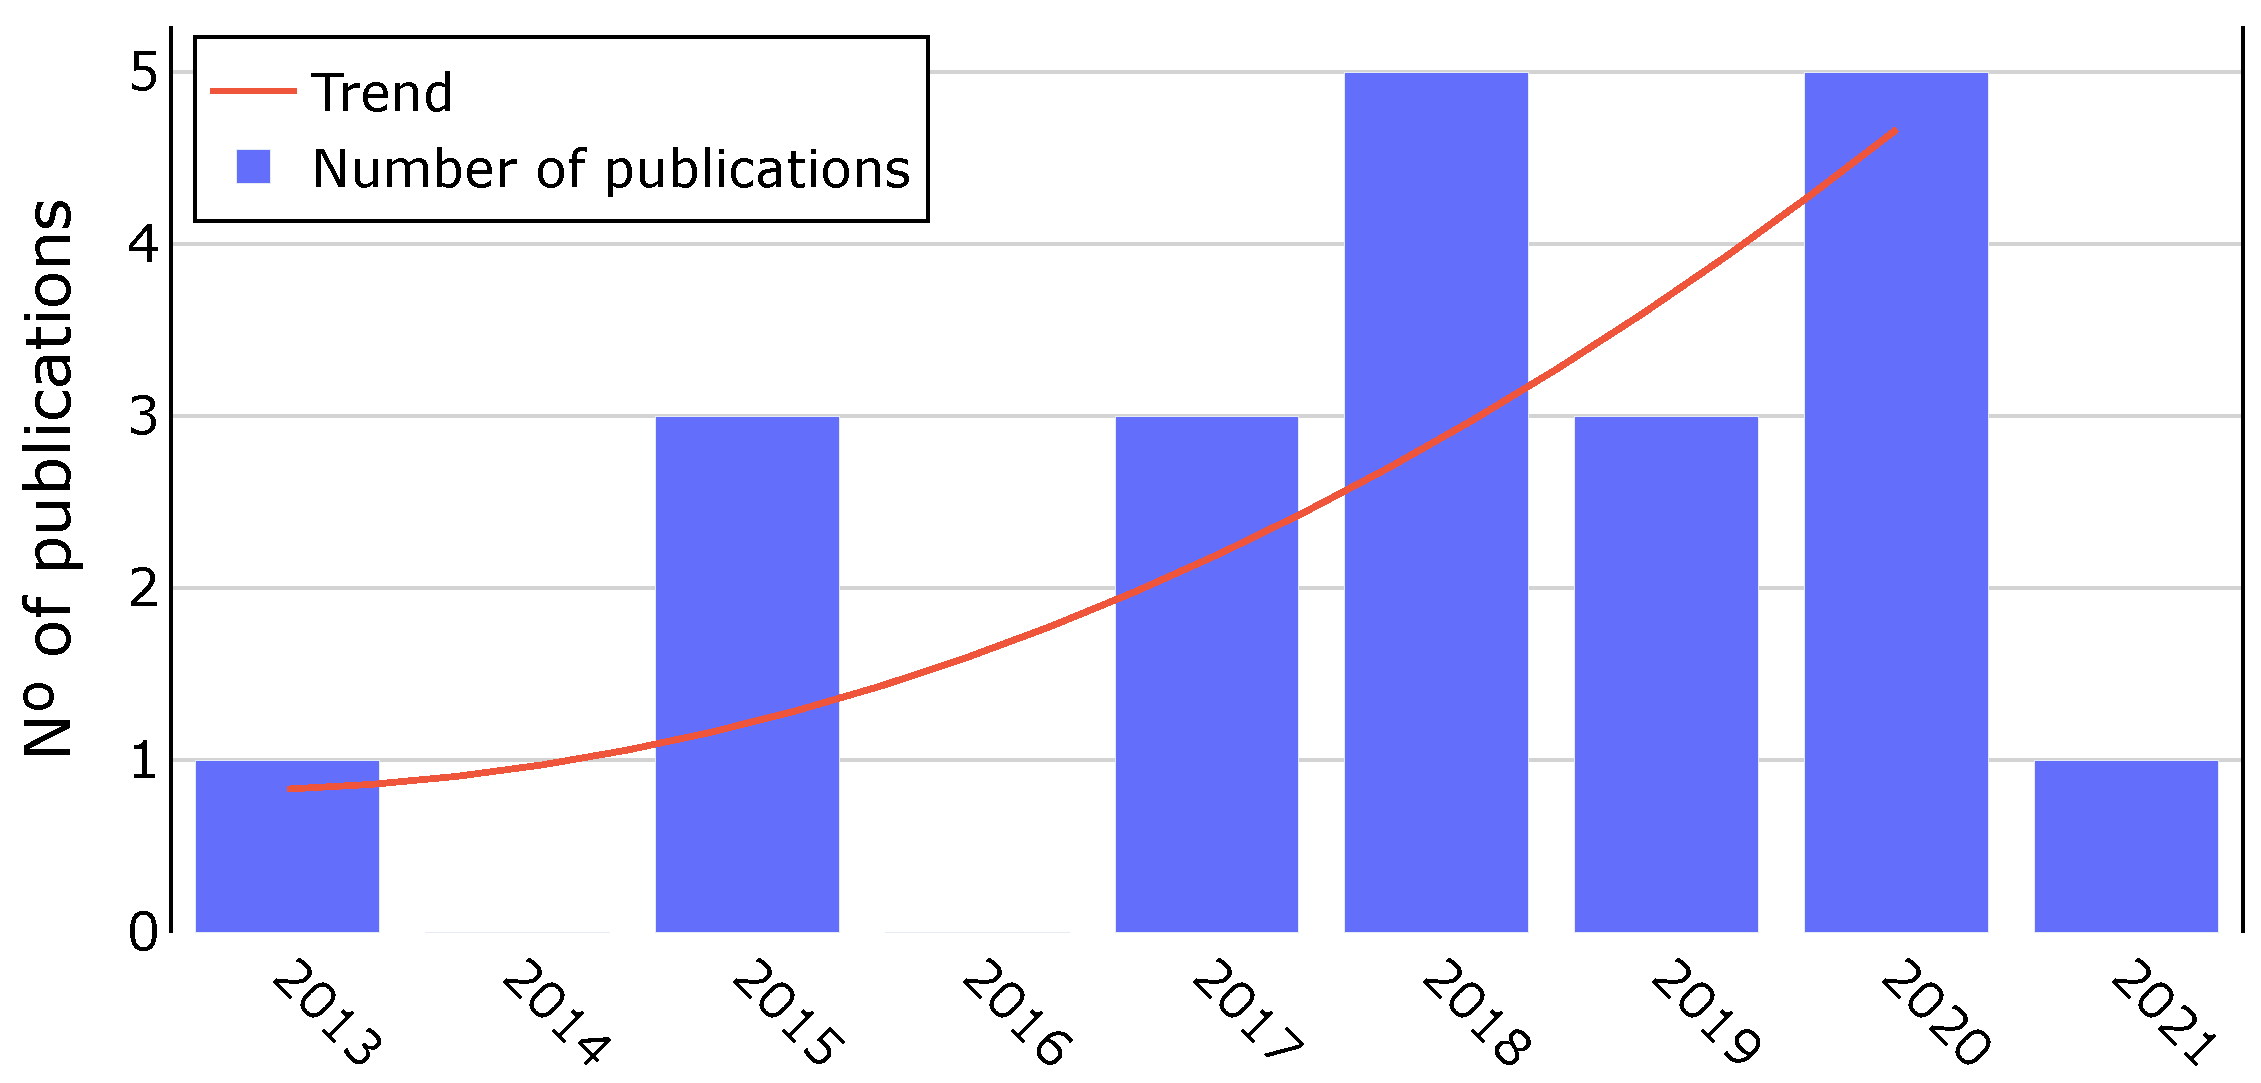
Figure 2 presents the distribution of the selected publications, related to energy efficiency and eco-efficiency KPI-based methodologies, in the years between 2012 and 2022, although no papers were found in the years 2012 and 2022. The increased number of publications related to WWTP performance evaluation metrics over the years reflects the growing concern with KPI-based methodologies. Traditional KPIs continue to be used, but new metrics related to energy efficiency and eco-efficiency are gaining prominence.

3. Results

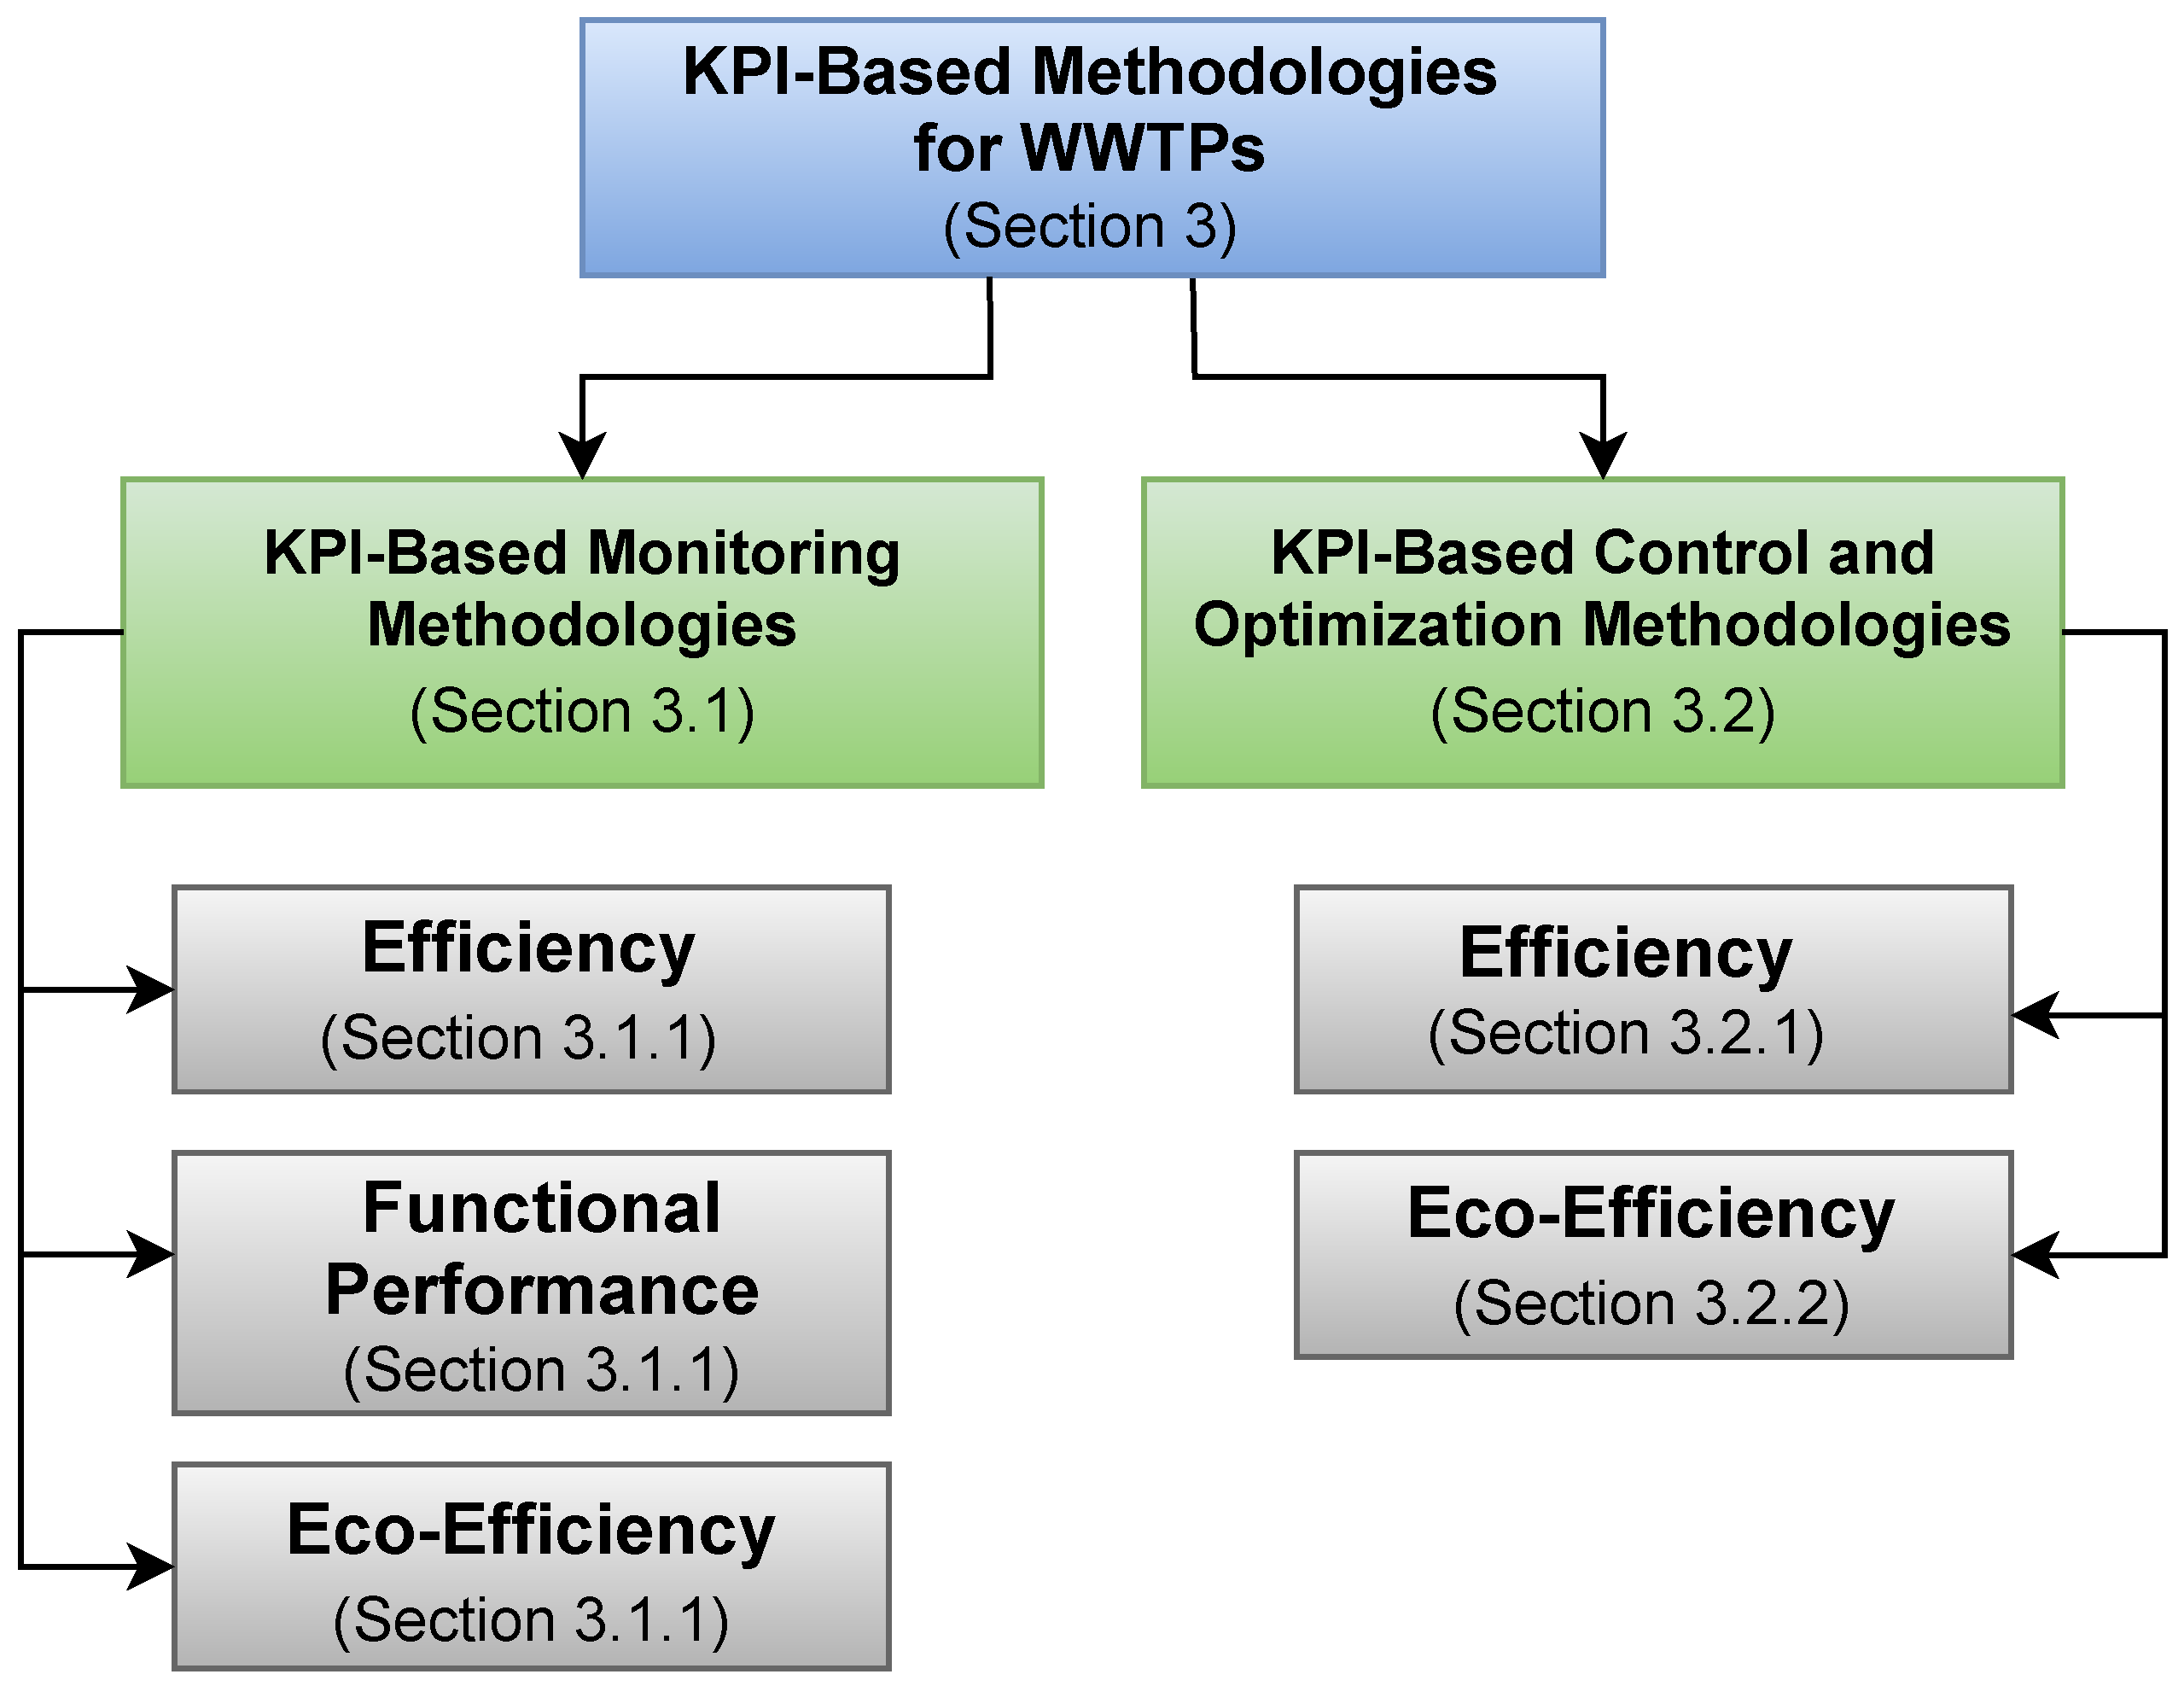
This section describes and discusses the proposed methodologies found in the literature for monitoring and controlling efficiency and eco-efficiency using KPIs for wastewater treatment plants. A diagram with an overview of the organization of Section 3 is presented in Figure 3. The presentation of methodologies found in the literature is divided into two sub-sections, one focused on monitoring techniques (Section 3.1) and the other focused on control and optimization techniques (Section 3.2). In addition, each section is divided taking into account the nature of the used KPI, namely efficiency and eco-efficiency KPIs, or functional KPIs.

3.1. Energy and Sustainability KPI-Based Monitoring

This section firstly presents the strategies found in the literature for monitoring and predicting WWTP’s efficiency based on KPIs, related to its energy consumption (Section 3.1.1). Then, methodologies that are based on environmental efficiency KPIs, which only take into account the environmental impact of the WWTP operation, are presented (Section 3.1.3).

3.1.1. Monitoring of Efficiency

In the work of [44], a methodology for WWTP energy performance evaluation, classification, and benchmarking is proposed, based on data related to energy use and operation parameters. Ten Italian WWTPs are evaluated, classified, and benchmarked using the energy performance index called the Global Energetic Index ( G E I ), given by Equation (2), being derived from three commonly used KPIs given by Equations (3)–(5), where E E is the electric energy consumed, V i n is the volume of wastewater to treat, P E e q is population equivalent, C O D r e m is the mass of chemical oxygen demand (COD) removed, and w i are the weights derived by Factorial Analysis:
G E I = i = 1 3 w i K P I i
K P I 1 = E E / V i n [ kWh / m 3 ]
K P I 2 = E E / P E e q [ kWh / PE ]
K P I 3 = E E / C O D r e m [ kWh / kgCO D r e m ]
The Global Energetic Index, given by Equation (2), summarizes in a single index the information contained in the three KPIs, taking into account their relative relevance from the weights w i ( i = 1 , 2 , 3 ). This index is widely used [45,46] as it facilitates the comparison and classification of different WWTPs. Factor Analysis, which is a multivariate analysis technique [47], is used to obtain relationships between different variables under study (observable variables) with new variables (factors) in order to define w i .
There is no generally accepted procedure to assess the energy performance of wastewater treatment, but, in [48], a new method was developed to assess the energy performance of urban WWTPs using simple Energy Performance Indicators (EPIs), it being easy to be calculated with commonly available data. New EPIs are defined to relate the overall WWTP electrical energy consumption to a specific parameter associated with a wastewater or sludge characteristic. Then, the EPI is coupled with the removal efficiency ( η ) of that parameter allowing the introduction of classes to evaluate the energy performance of the plant. Four performance classes are considered (A, B, C, and D), defined by intervals of values of EPIs and relative η of WWTPs. The proposed EPIs ( E P I B O D , E P I T N , E P I S L , and E P I S L & T r ) are identified and briefly explained below.
E P I B O D is the EPI that determines the overall electrical energy consumption per kg of inlet total amount of Biological Oxygen Demand (BOD) [mg/L], the B O D i n . E P I B O D is given by Equation (6). E P I B O D is relevant since the biological stage responsible for removing organic matter significantly increases the energy consumption of WWTPs. The respective removal efficiency is η B O D (Equation (7)), where B O D i n and B O D o u t are the total amount of B O D in the inlet and in the outlet, respectively:
E P I B O D = E E B O D i n [ kWh kg B O D i n ]
η B O D = B O D i n B O D o u t B O D i n
The energy consumption can also be related to the Total Nitrogen [mg/L] content ( T N ) because nutrients removal has a significant effect on electric energy consumption due to the aeration demand of the processes, with E P I T N and η T N being given by Equations (8) and (9), respectively, where T N i n and T N o u t are the Total Nitrogen [mg/L] in the inlet and in the outlet, respectively:
E P I T N = E E T N i n [ kWh kg T N i n ]
η T N = T N i n T N o u t T N i n
The amount of energy spent on sludge treatment tends to increase as advanced treatment methods are used to reduce the volume of sludge produced. The sludge treatments aim to reduce the final water content of outlet sludge ( W C o u t ). E P I S L is an indicator for sludge ( S L ) treatment performance given by Equation (10), where E E S L is the energy demand in the sludge line, and T S i n is the amount of total solids in the influent:
E P I S L = E E S L W C o u t T S i n [ kWh kg T S i n ]
The last EPI is E P I S L & T r and aims to relate the E E S L and the energy demand in the transportation ( E E T r ) to T S i n and is defined by Equation (11):
E P I S L & T r = E E S L + E E T r T S i n [ kWh kg T S i n ] .
In such work, the energy performance assessment is based on calculating the percentiles of each of the EPIs ( E P I B O D , E P I T N , E P I S L , and E P I S L & T r ) and pollutants’ removal efficiencies of 300 WWTPs and on its partition in classes of performance. The most representative indicator was E P I B O D , which relates energy consumption to the influent BOD, being the process presented in Figure 4.
In [45], the ENERWATER methodology is proposed to define, evaluate and diagnose energy efficiency in WWTPs. The main steps of ENERWATER methodology are the energy measurement and estimation, the definition of indicators, the determination of the Water Treatment Energy Index (WTEI), and based on previous steps, the assignment of an energy label (A, B, C, ) for ease of communication to a broad public and the diagnostics of inefficient processes [49]. The Rapid Audit method is used to quickly estimate the WTEI based on existing information obtained by routine analyses, being a rapid tool to compare a given WWTP performance with other plants. The Decision Support provides a detailed calculation of WTEI, requiring intensive monitoring of the energy use and the water quality parameters, as well as a detailed calculation of the WTEI for each WWTP. The aim is the diagnosis of the functions/equipment to investigate the origin of inefficiency and develop targeted energy-saving strategies.
Focusing on the Rapid Audit Methodology, the used KPIs are the so-called K P I 1 , K P I 3 , K P I 4 and K P I 5 that are the ratio between the electrical energy consumption in the plant and a plant function parameter corresponding to different stages of treatment: the volume of treated wastewater, amount of pollutants removed, amount of pathogens removed, and total solids processed, respectively. The methodology starts with the quantification of the E P I i , which are obtained by comparing the value of each corresponding K P I i with its database distribution function, so that the EPIs are normalized indicators of performance corresponding to the percentiles for each KPI. Then, the EPIs are aggregated into a single index WTEI using relative weights, as presented in Equation (12), where each EPI has a weight used to emphasize its contribution over other EPIs in terms of energy consumption. The weights ( w n o r m , i ) were estimated based on the relative contribution of each function/section of the WWTP related KPI to the overall energy consumption. Using W T E I values, it is possible to use percentile as an indicator of the energy efficiency performance of several WWTPs. Thus, it is possible to obtain and share standardized and comparable information about WWTP energy efficiency.
W T E I = i = 1 , i 2 5 w n o r m , i E P I i
Later, in [49], the ENERWATER methodology proposed in [45] is improved, in which it is proposed a composite index to measure energy efficiency in a WWTP, from individual sub-indicators to the assignation of an energy label.
In [50], the objective was to monitor and detect failures in efficiency. The approach based on fuzzy system [1] supports plant managers with detailed information about pump performance. Based on fuzzy rules and the daily value of five KPIs, a score was obtained for each day. The KPIs used as inputs of the fuzzy system are the following:
  • Daily value of the efficiency of the pump system ( η );
  • Efficiency trend ( η t ) calculated using a rolling window median for the previous 90 days;
  • Fluctuation in the trend η f = η t η ;
  • Ageing of the pump ( τ );
  • Potential of new failures (Z) that is equal to 0 if the system registers 15 consecutive days with η f < 0 , otherwise Z = 1 .
To score the performance of the pump system, the following fuzzy rules were defined:
R 1 : IF η t is High AND η f is Positive , THEN S c o r e = H i g h , R 2 : IF η t is High AND η f is Negative , THEN S c o r e = M e d i u m , R 3 : IF η t is Low AND η f is Positive , THEN S c o r e = M e d i u m , R 4 : IF η t is Low AND η f is Positive , THEN S c o r e = L o w , R 5 : IF τ is Low , THEN S c o r e = L o w , R 6 : IF τ is Medium , THEN S c o r e = M e d i u m , R 7 : IF τ is High , THEN S c o r e = H i g h , R 8 : IF Z is Low , THEN S c o r e = L o w , R 9 : IF Z is High , THEN S c o r e = H i g h .
A failure is indicated by a certain number (defined by the user) of consecutive negative fluctuations ( η f ). The method was tested with data from a WWTP. There are three blocks of complementary rules: R 1 R 4 , R 5 R 7 , and R 8 R 9 . The first block analyzes pump conditions on the day of analysis, the second block monitors long-term phenomena related to pump degradation, and the third block reports potential failures.

3.1.2. Functional Performance Monitoring

This subsection presents a summary of the papers on efficiency monitoring in WWTPs based on a functional KPI and the COD in the effluent and/or influent, which reflects the functional performance of the WWTPs.
The methodology proposed in [51] consists of a data-driven scheme based on the left coprime factorization applied to the WWTP for KPI prediction and related fault detection, when the KPI is measurable and unmeasurable (i.e., KPI is not online measurable). The KPI is the COD in the effluent flow, and the approach was tested in the Benchmark Simulation Model No. 1 (BSM1) plant [52]. The algorithm consists of a KPI predictor and threshold setting of residual evaluation for fault-related detection. The residual signal is the difference between KPI measured values and their estimated value, when the indicator is measurable, or between COD prediction and its mean value, when it is not measurable. The threshold setting for fault-related detection is defined by Equation (13), where χ ( l ) stands for χ 2 -distribution with l degrees of freedom and, associated with it, prob( χ 2 > χ α 2 ( l ) ) = α . α stands for the significance level:
J t h , θ = χ α 2 ( l )
The work [53] also intends to predict the COD in the effluent as an alternative for real time measurements of the KPI. This prediction approach uses the partial least squares (PLS) model and its kernel version. Wavelet transform is used to carry out multi-scale kernel partial least squares (KPLS). Multi-scale process monitoring algorithms decompose data into deterministic and stochastic components so the process can be better interpreted. The input variables are the 13 components’ concentration at the entrance and the influent flow rate, and the output is the prediction of COD concentration in the effluent. This methodology was tested in the BSM1 plant.
The paper [54] employed the fuzzy clustering method to categorize the sample data of WWTP and analyzed the relationship between energy consumption and the influence factors in different categories. The COD concentration is studied as a performance indicator. A Radial Basis Function (RBF) neural network was used to forecast energy consumption. Using these methods and after training the model with data from the set and categories, they were able to obtain energy consumption through the three KPIs.
The amount of sludge produced during WWTP operation reflects WWTP’s environmental and operational performances, and large amounts of sludge lead to large economic and environmental consequences. Ref. [55] presents a method to monitor the operational and environmental performance of a WWTP through the prediction of an index called Sludge volume index ( S V I ) to quantify sludge bulking. The prediction of S V I is performed by using a hierarchical radial basis function (HRBF) neural network, in which the training of HRBF is achieved using an Extended Extreme Learning Machine (EELM). S V I is related to the variables’ D O concentration, p H , C O D and B O D . The first three variables are measured with online sensors, and B O D is predicted by the EELM-HRBF method from D O concentration, p H , C O D and T N .

3.1.3. Eco-Efficiency Monitoring

This subsection discusses eco-efficiency monitoring methods based on KPIs that take into account energy consumption and the environmental impact of WWTPs.
The work proposed in [56] intended to measure the eco-efficiency of 30 Spanish WWTPs under data uncertainty, integrating several performance indicators into a single index (Eco-efficiency Index). To ensure it, DEA and uncertainties analysis was used. In DEA, an objective or efficiency function is built in a way that takes into consideration the values of the parameters, and the fact that they are desirable or undesirable. The DEA-tolerance model was applied to compute the eco-efficiency scores for 729 scenarios for each WWTP tested for identifying the best and worst-cases scenarios. In this methodology, the relative position between the WWTPs is represented by the Eco-efficiency Index ranging from zero to one. Uncertainty is considered by using intervals for input and output data values, considering several scenarios for each WWTP eco-efficiency.
The work of [57] intended to develop a novel methodology of eco-efficiency fault detection in WWTPs. This methodology is based on a combination of Environmental Life Cycle Assessment (LCA) and DEA in order to monitor the potential deterioration of the WWTP eco-efficiency. LCA serves to select which inputs have the most environmental impact and which will constitute one of the inputs for DEA. Through DEA analysis, an efficiency index is calculated, based on the following inputs and outputs. The inputs of DEA (to minimize) are:
  • Energy per population equivalent [kWh/PE];
  • Waste sludge production per population equivalent [kg/PE];
  • Environmental impacts of chemicals (from LCA method) [mPt/PE];
and, the outputs of DEA (to maximize) are:
  • COD removed [kg/PE];
  • Methane production per population equivalent. [l/PE].
In stable systems, fluctuations of the performance index have a normal distribution with an average equal to zero. In degrading systems, the average of fluctuations is negative. With Student-t test analysis, it is established if this average can be considered equal to zero or not, within a certain confidence interval. Therefore, this methodology is able to identify shifts in the WWTP’s global performance and enables the identification of the sources of the shift regime, applying the same procedure to single inputs and outputs of the DEA. Performing a multi-directional efficiency analysis that associates the potential improvement to each input and to each Decision-Making Unit (DMU), a suggested direction for improvements can be obtained. The proposed methodology was tested on Sewage Treatment Operation and Analysis over Time (STOAT) simulator.
The work [58] proposes a KPI based only on environmental factors. In this work, a new overall indicator was developed in order to quantify the performance of a WWTP under study, in environmental terms. It is called Green Index ( G I ), which for a particular case, is given by Equation (14), where W C is the Water consumption [kg/h], E C is the Electricity consumption [kWh/h], C D is the Carbon Dioxide emission [kg/h], A C is the Air consumption [kg/h], N is the Nitrogen emission [kg/h], N T is the Nitrate concentration [mg/L], B O D is the Biochemical Oxygen Demand concentration [mg/L], and C O D is the Chemical Oxygen Demand concentration [mg/L].
G I = A B , A = 0.165 W C t + 0.928 E C t + 0.925 C D t + 0.921 N t 0.686 N T t 0.667 B O D t 0.667 C O D t , B = 0.165 W C o + 0.928 E C o + 0.925 C D o + 0.921 A C o 0.686 N T o 0.667 B O D o 0.667 C O D o .
The subscript o refers to the base case where there is not any nitrogen removal process, and subscript t refers to the case where a nitrogen removal process is applied as the Ludzack–Ettinger process or Bardenpho process. The weights of each term of G I (14) are part of the index calculation, and it depends on each case study. Weights are calculated by applying factor analysis methods to the data of green elements. The output result of factor analysis is the factor loading of each observed variable (green elements) in relation to the observed variables and the correlation of the unobserved variables with the observed variables.

3.2. KPI-Based Control and Optimization Methodologies

This subsection discusses methods found in the literature to control and optimize the efficiency and eco-efficiency of WWTPs based on KPIs. Section 3.2.1 focuses on control methods related to energy and total cost spent in the process (efficiency control), and Section 3.2.2 is based on KPIs that take into account environmental factors in addition to energy factors (eco-efficiency control).

3.2.1. Efficiency Control and Optimization

The control of WWTPs efficiency can be reached by the determination of optimal values (setpoints) for control variables, followed by the change of manipulated variables that act directly on the process. Finding the optimal setpoints for key variables in the treatment process and implementing control techniques, the energy efficiency and eco-efficiency of WWTPs can be improved.
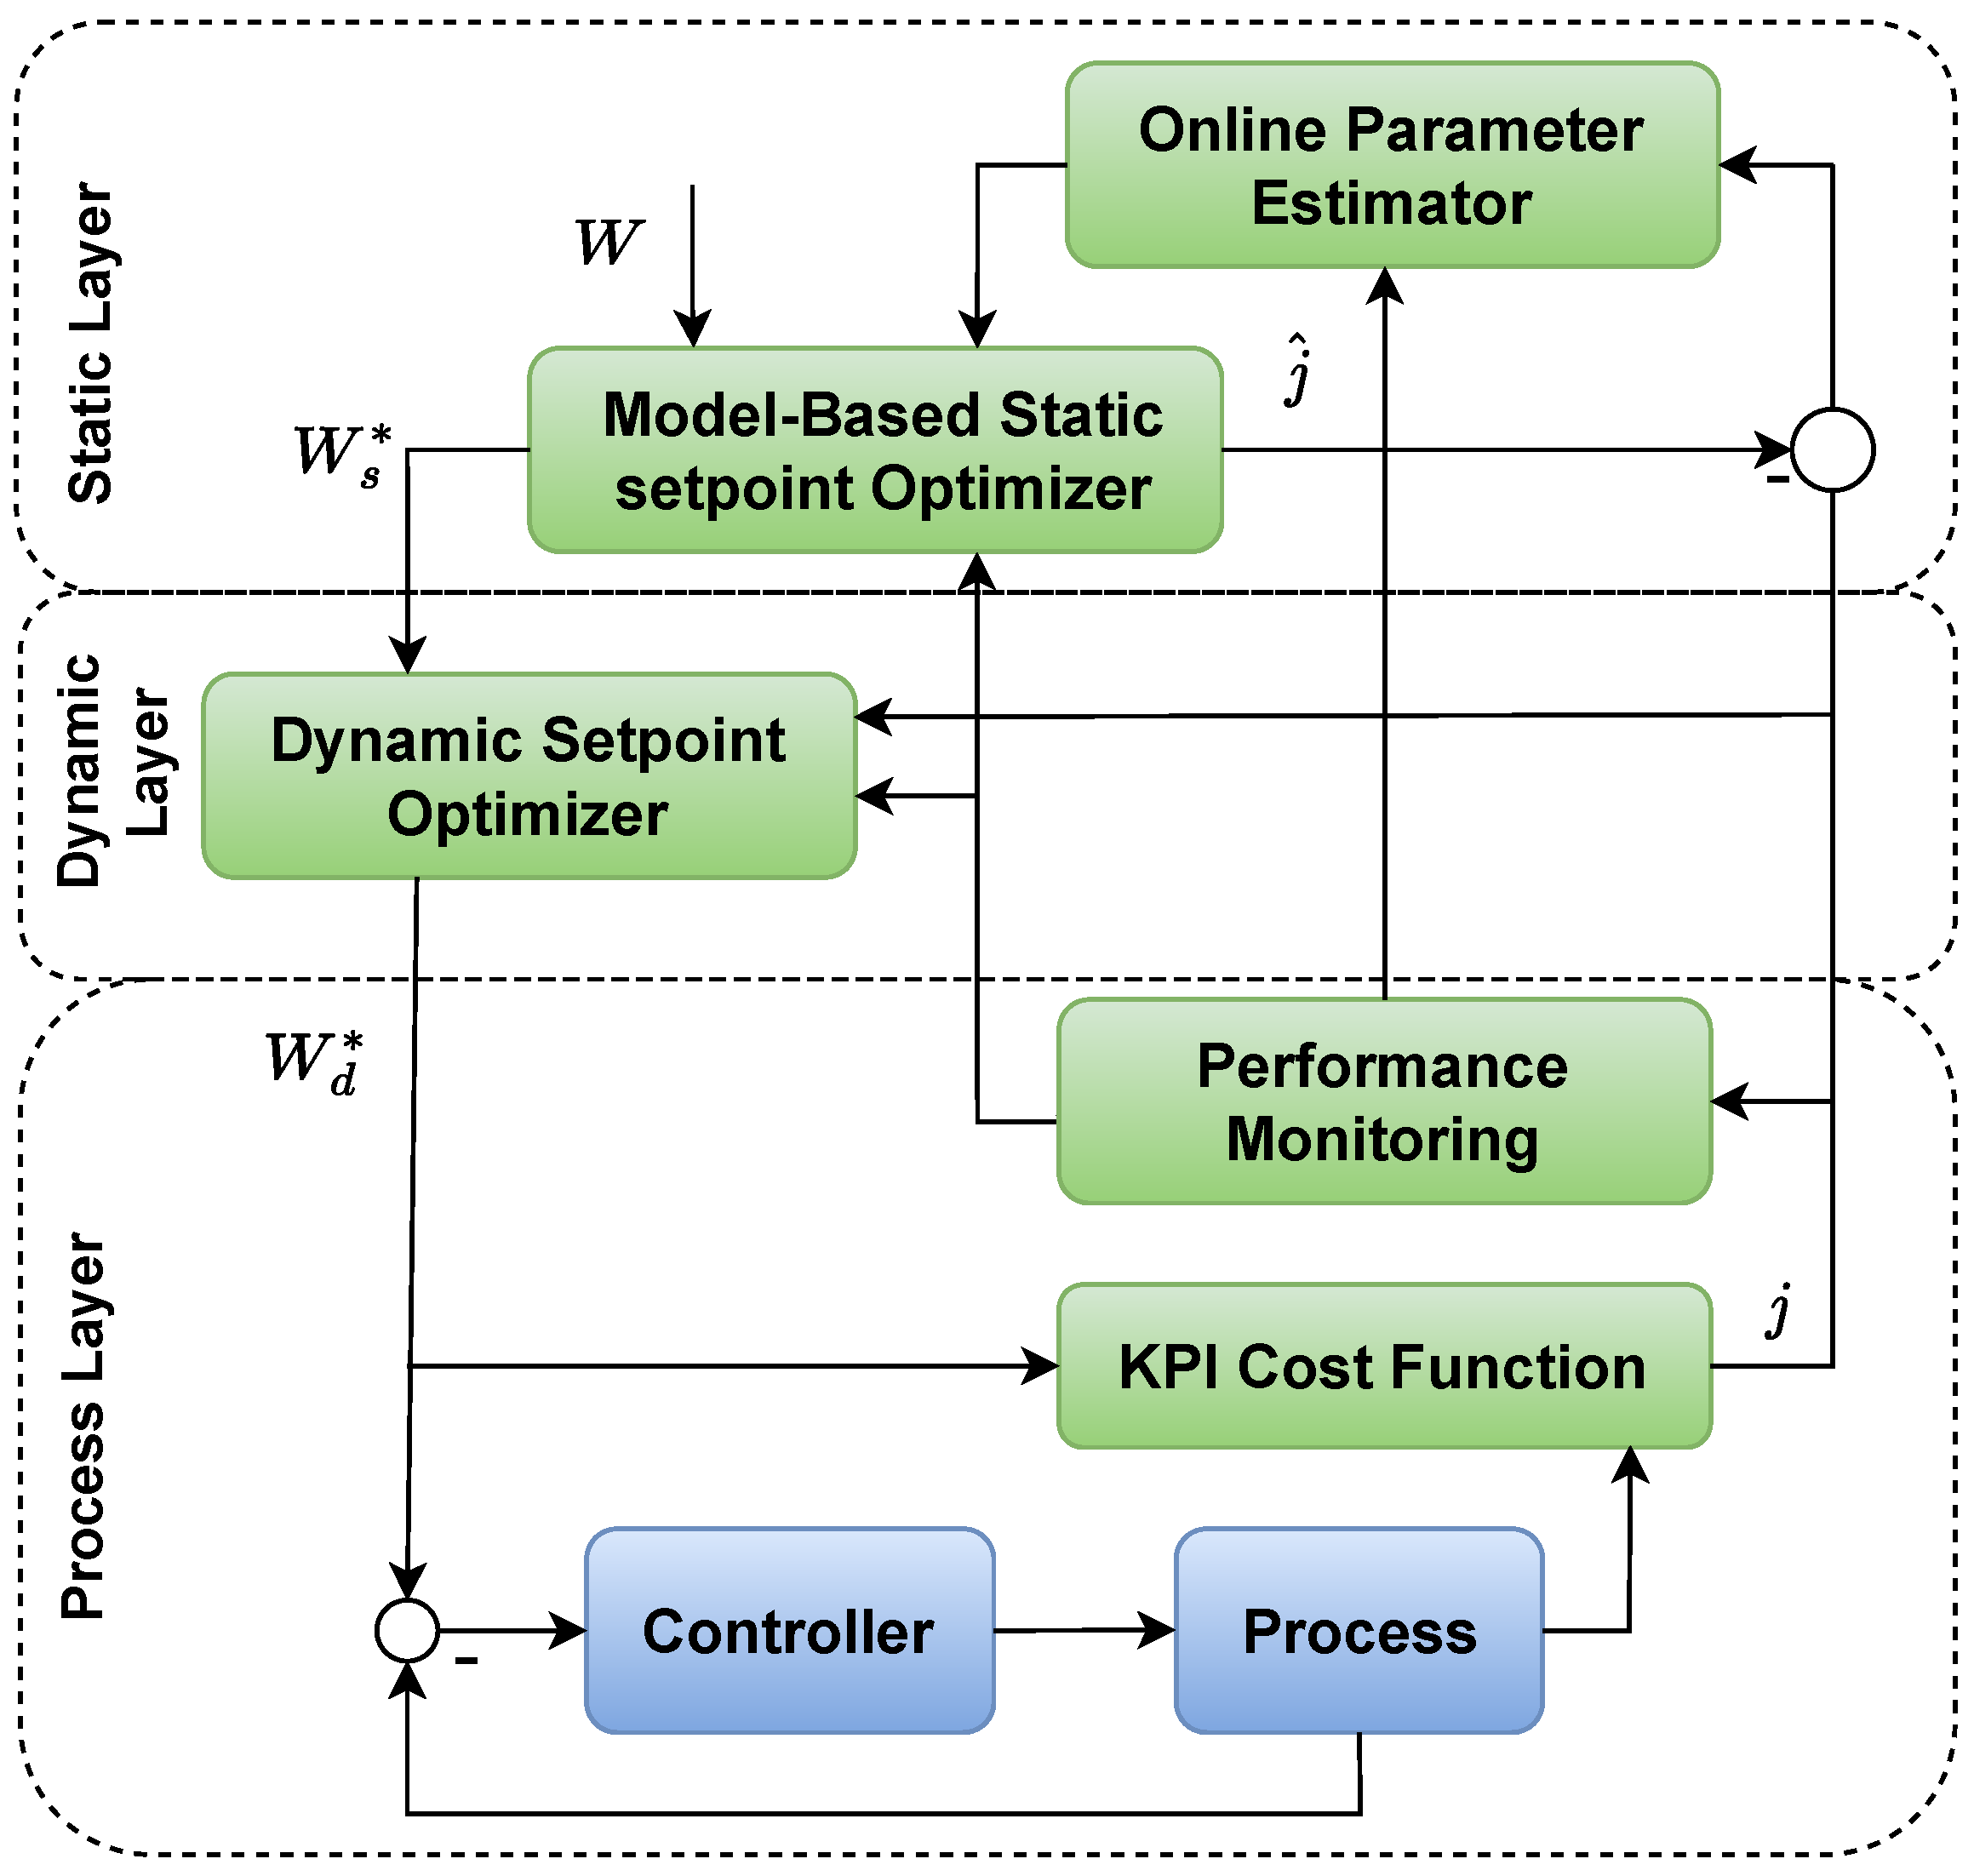
In [59], an optimization algorithm was developed to control and optimize the energy consumption of a WWTP. The proposed performance control strategy is applied on BSM1 that optimizes the setpoint trajectories for oxygen ( O 2 ) or nitric oxide ( N O ) concentration in order to minimize a KPI cost function defined by the overall cost index (OCI). The control strategy is based on two control steps: static (offline) and dynamic (online), as presented in Figure 5.
The static step is based on a data-driven model and optimizes the setpoint (of O 2 or N O concentration) to estimate a minimized KPI OCI ( j ^ ). The static model is updated based on model imperfections or slow process changes, detected using a threshold to the differences between the measured j and the estimated (predicted) value of j ^ . In the dynamic optimization ( W d * ), the setpoint ( W s * ) determined from the static optimization is used as the initial conditions, and it is simply adjusted according to the current values of the KPI cost function J.
The static component and optimization method for the dynamic component is carried out using a method called BILIMOD. BILIMOD is a data-driven bilinear function model that combines two popular methods: (1) Neural Networks, and (2) Local Linear Model Tree [60]. Comparing the desired value of OCI with its current value, the static parameters are adjusted for each time step. Therefore, the proposed methodology considers modeling errors, unexpected disturbances and process changes. Then, a process controller acts in the process, based on the setpoints given by the dynamic optimizer ( W d * ).
In order to deal with dynamic multiple conflicting criteria, Ref. [61] proposes a dynamic multiobjective controller, based on a dynamic multiobjective particle swarm optimization (DMOPSO) algorithm, tested on the BSM1 simulator and implemented in a real WWTP. The proposed DMOPSO algorithm, with an adaptive global best selection mechanism, aims to obtain the reliable optimal dissolved oxygen concentration of biological reactor ( S O ) and ammonium nitrogen concentration of effluent water ( S N O ) setpoints. The ultimate goal of DMOPSO is to minimize the proposed data-driven indicators: A E (Aeration Energy), P E (Pump Energy), and E Q (Effluent Quality) models. These models constitute objective functions which are based on the regression kernel functions composed of the following input variables: ammonia nitrogen concentration of effluent water ( S N H ), the mixed liquor suspended solids concentration of effluent water ( M L S S ), the dissolved oxygen concentration of biological reactor ( S O ) and nitrate concentration of biological reactor ( S N O ). In the end, the optimal setpoints are applied to the Proportional–Integral–Derivative (PID) controller. The manipulated variables are the Internal recycle flow rate ( Q a ) and the Oxygen transfer coefficient ( K L a ).
The method presented in [62] intended to optimize the performance of a WWTP based on a model MPC, including an economic approach (energy consumption), and was implemented in the BSM1 plant. The measured variables are nitrates and nitrites concentration on the second anoxic reactor ( S N O 1 ) and dissolved oxygen concentration on the fifth aerobic reactor ( S O 2 ), which are compared with its setpoint S N O 1 _ s p and S O 2 _ s p –fixed values. The manipulated variables are, one more time, Q a and K L a . The MPC cost function is given by a performance index consisting of a weighted sum of two different indices: J N M P C , a standard MPC cost function, and J E C O (15) that it is defined by the OCI which depends on pumping energy, and Equation (15). Being w 1 and w 2 cost factors, Q a internal recycle flow, K L a the oxygen transfer coefficient, Q e the effluent flow, S O , s a t oxygen saturation concentration and S N H , 5 the N H 4 + + N H 3 concentration in reactor 5:
J E C O = w 1 1 T ( t 0 t f 0.004 Q a ( t ) d t + S O , s a t 1800 t 0 t f V 2 K L a ( t ) d t ) + w 2 8.2 1000 t 0 t f m a x ( 0 , S N H , 5 ( t ) N H m a x ) Q e ( t ) d t .
Depending on the values of the weights of the index installments, the control takes into account operating profits or expenses ( J E C O ) or the deviation part to setpoints and other deviations ( J N M P C ). In such work, strategies that used different weights were tested, and the results were analyzed in terms of economics and removal efficiency.
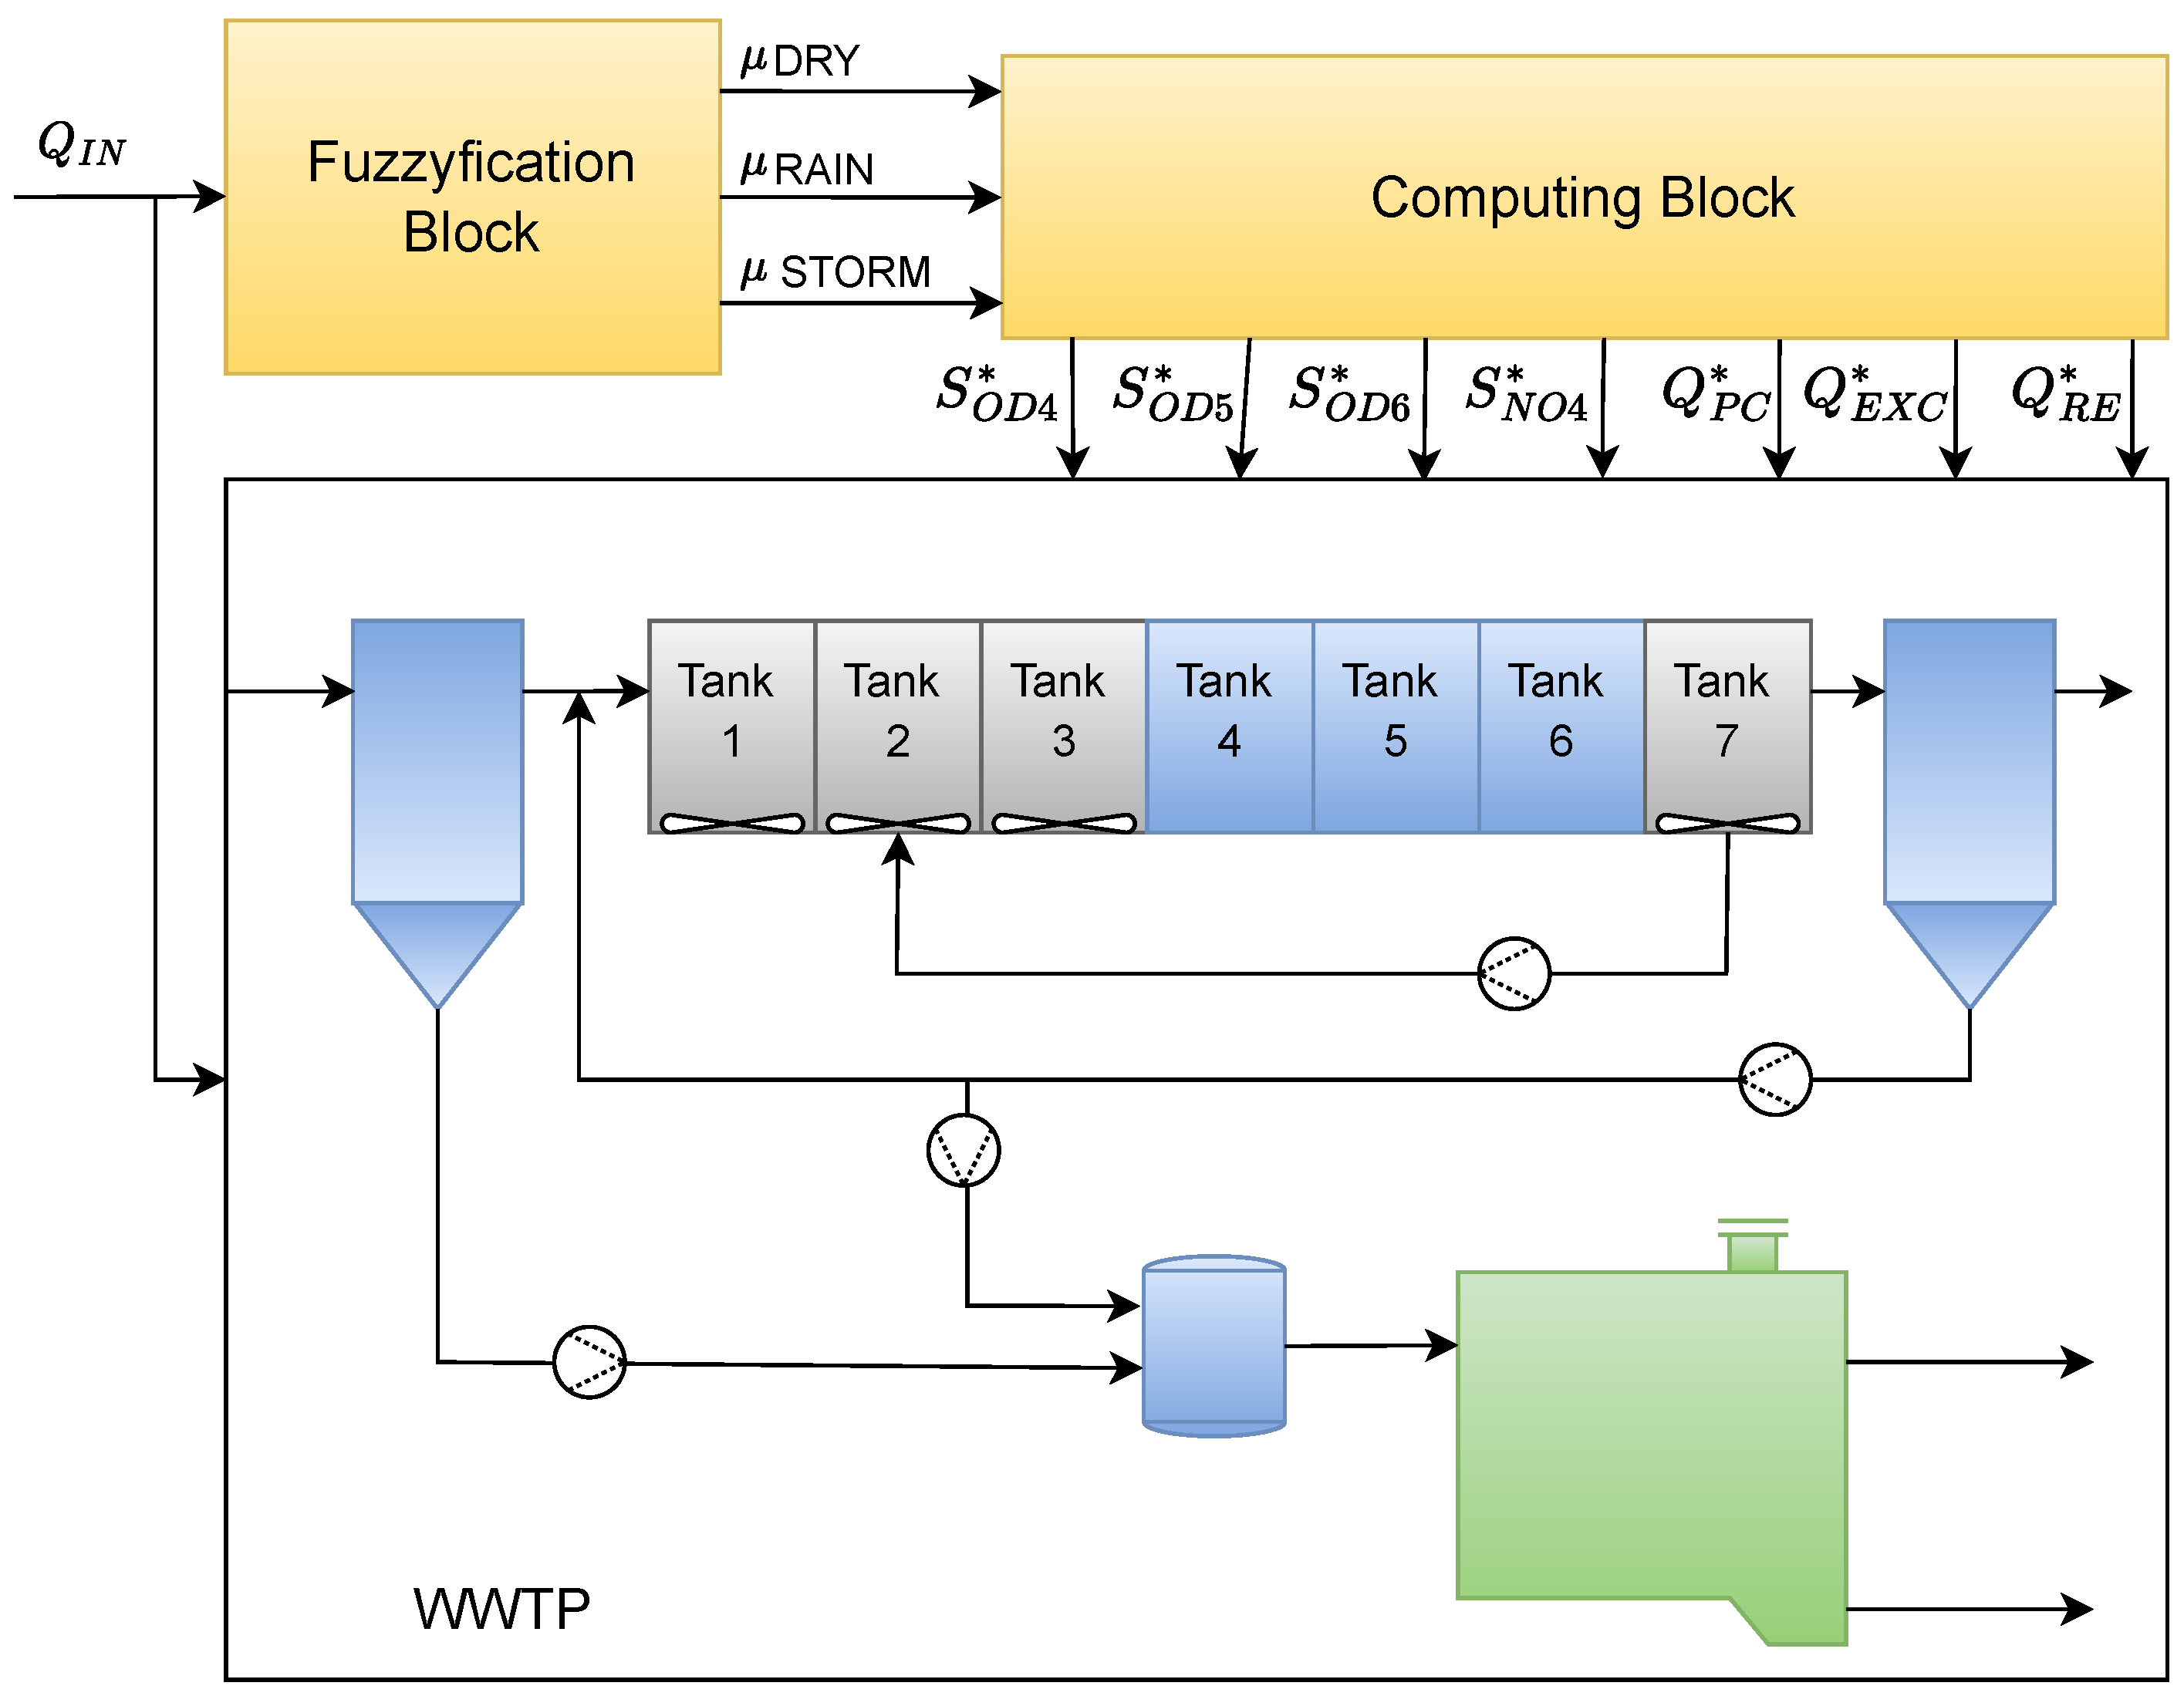
The work developed in [63] proposes an optimal-setpoint-based control strategy that aims to optimize the functioning of a WWTP in Galati, Romania. The proposed methodology to define the optimal setpoints sought to reduce the levels of nitrogenous compounds in the treated wastewater, and reduce the energy consumption of the plant. The control algorithm was carried out in two parts. In the first phase, the setpoints for the operating regimes were computed, and then, in the second phase, the setpoints were obtained for the current operating regime, and in cases of transition between the regimes, the setpoints were obtained with a fuzzy system. Each membership function is associated with an operating regime, namely dry, rain and storm. For each weather condition considered, the vector V * of the optimal setpoints is calculated using Equation (16):
V * = [ S O D 4 * , S O D 5 * , S O D 6 * , S N O 4 * , Q R E * , Q P C * , Q R E , i * , Q E X C * ] ,
where S O D 4 * , S O D 5 * a n d S O D 6 * are setpoints of the dissolved oxygen concentration in the tanks 4 , 5 and 6, respectively. S N O 4 * is the setpoint of the nitrate concentration in the tank 4, Q R E * is the external recirculation flow, Q P C * is the sludge flow from the primary clarifier, and Q E X C * represents the excess sludge flow from the secondary clarifier. The setpoint vector is obtained through a Genetic Algorithm [64]. The determination of the setpoint values that will be applied to the transition periods is carried out according to the fuzzy rules that are associated with each operating regime. The functioning scheme can be seen in Figure 6, where the setpoints are computed by the “Computing Block”, and the transitions between operating regimes are made with the aid of the “Fuzzification Block”. The evaluation metrics of the proposed optimization are effluent quality index (EQI), OCI, and the percentage of times that the pollutant levels exceed the legal limits, within 28 days, which is the evaluation period considered. The proposed optimization was able to reduce the levels of pollutants by 10 times in relation to the values verified at the WWTP entry.

3.2.2. Eco-Efficiency Optimization

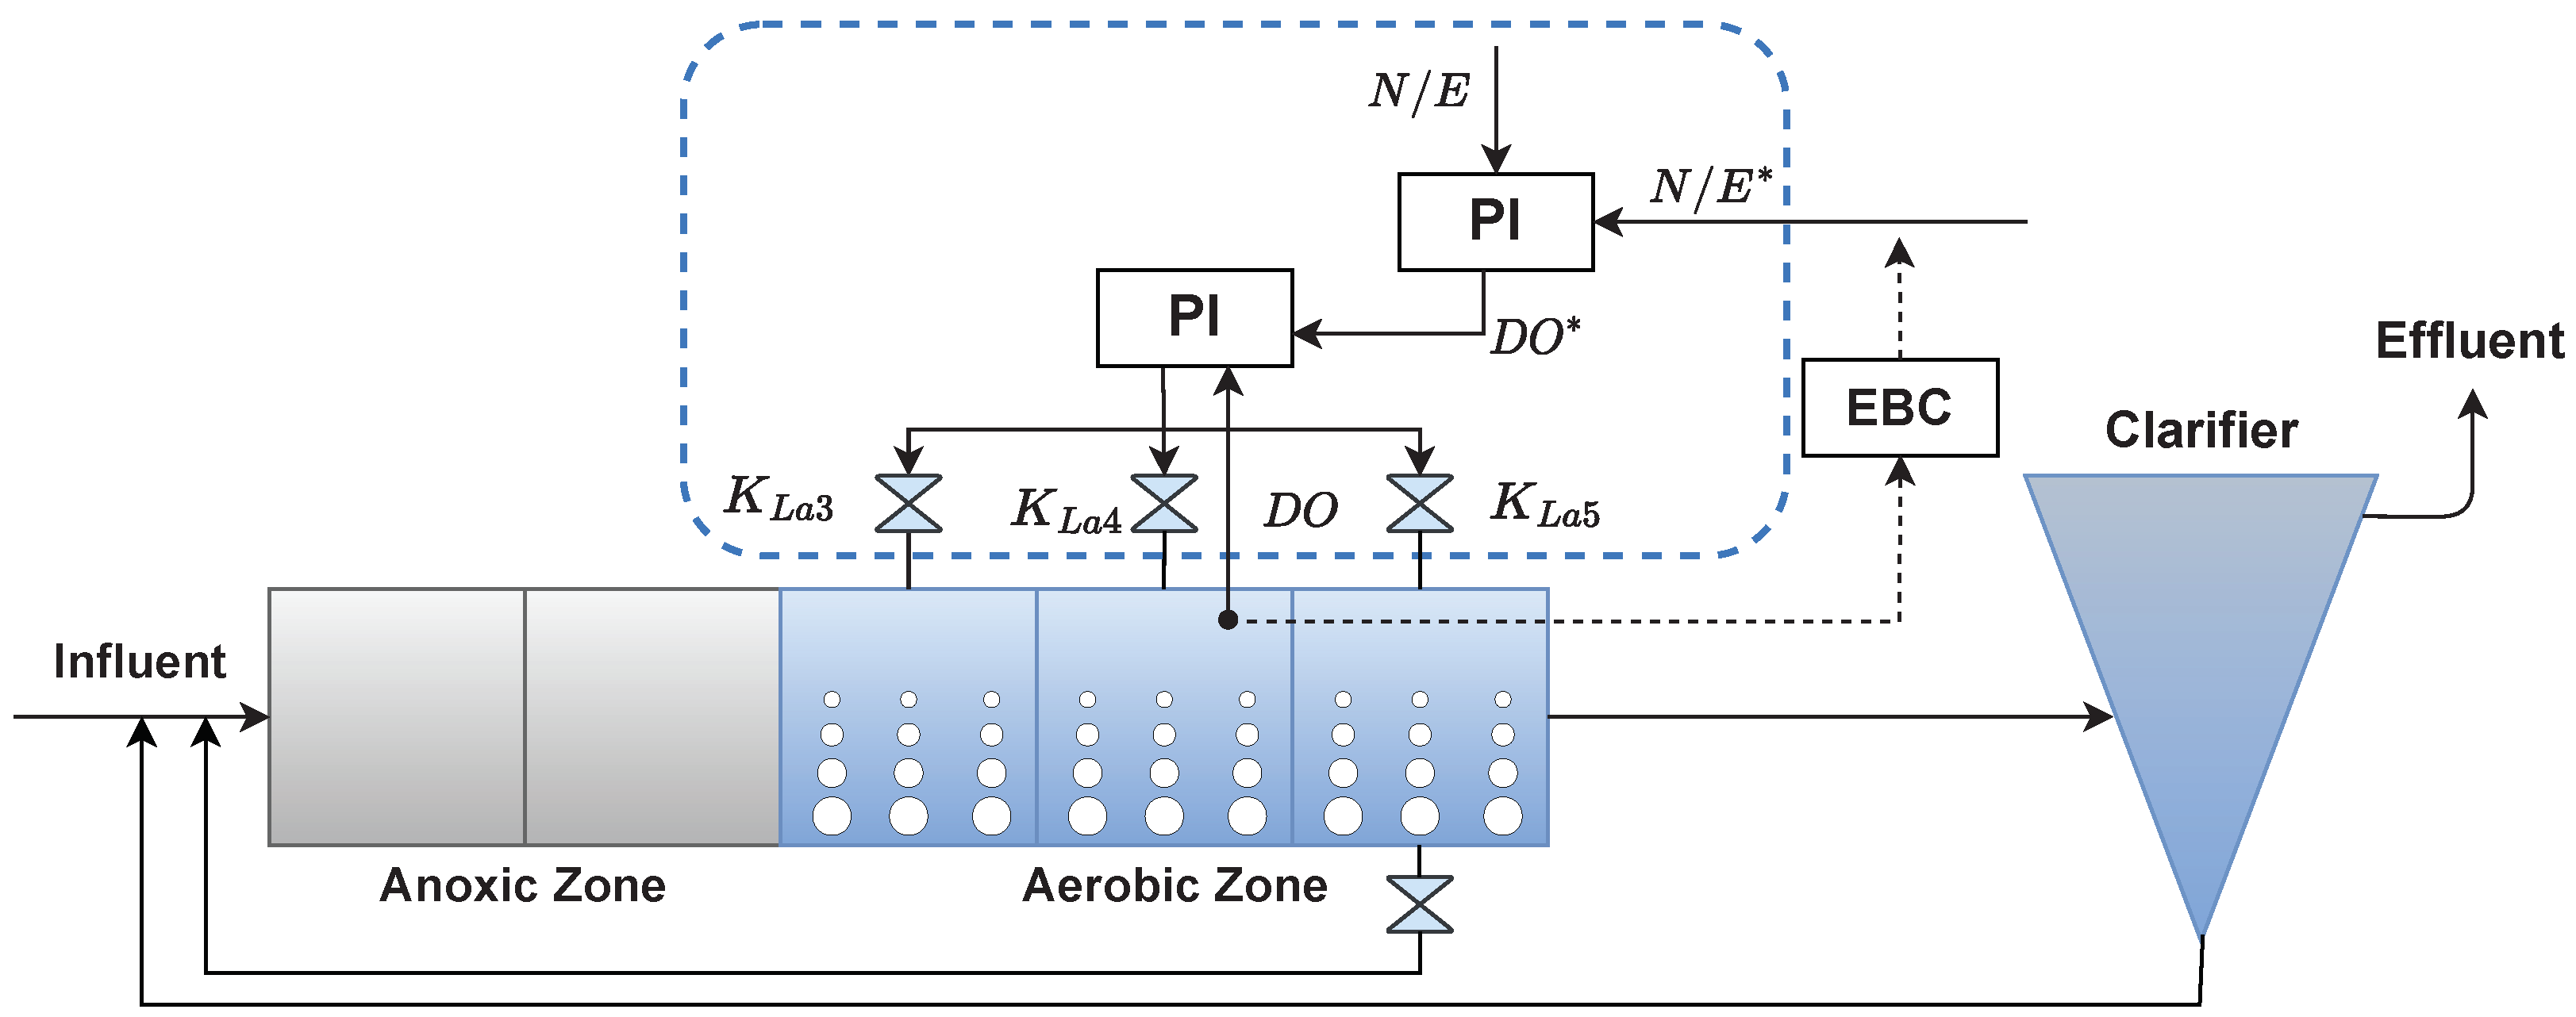
In the work [65], a PID based hierarchical control structure is proposed to improve the overall WWTP performance, in terms of energy consumed and quality of the effluent. The global efficiency index considered is called N / E index, as calculated by Equation (17), which measures the ratio between the amount of nitrogenated compounds eliminated in the activated sludge process [kgN] and the required energy [kWh]. It constitutes a link between pollution elimination and energy consumption in the whole plant, where A E is the energy used for aeration in the ASP; P E is the energy used for pumping in the whole plant; M E is Mixing Energy consumed in the whole plant, and the heating energy ( H E ) quantifies the energy required to maintain a temperature of 35 °C in the anaerobic digester. I Q N and E Q N are the influent and effluent quality indices regarding nitrogenated compounds:
N / E = ( I Q N E Q N ) / ( A E + P E + M E + H E ) .
A schematic representation of the proposed control strategy is presented in Figure 7. The N / E index is the controlled variable for an upper-level Proportional–Integral (PI) controller. This upper PI controller receives the fixed value of N / E index setpoint N / E * and the value of the N / E index computed with the measured variables, and returns the D O concentration setpoint D O * that minimizes the difference between the two inputs. Then, a lower-level PI controls the oxygen transfer coefficients ( K L a ) of the three reactors that comprise the aeration zone ( K L a 3 , K L a 4 , and K L a 5 ), in order to achieve D O * .
As an evolution of [65], the works [66,67] aim to avoid excessively low values of D O concentrations, which can lead to unreachable N / E index setpoint values ( N / E * ). In these cases, nitrogen elimination can be negatively affected. Therefore, in these works, an event-based controller (EBC) was added (see the “EBC” block in Figure 7), to achieve realistic values of N / E * , preventing D O concentration to be below the lower bound of its admissible values.
The operation of the event-based controller is based on the following principle: the value of N / E * should be reduced once the D O concentration achieves its lower limit, and N / E index should be increased when D O concentration leaves this critical operating zone. If this operation was followed in a continuous way, the N / E index would be following the D O dynamics, and it would be continuously moving. Instead, the following event-based approach is used, with T s being the sampling time at which the event-based detector will operate, D O l o w is the lower value for the D O that should be avoided, Δ is the increment on N / E * that should be performed at each event, and N / E m a x , N / E m i n are the maximum and minimum values for the N / E index. This is to be executed every T s . N / E * will therefore remain constant during the T s time interval:
if ( D O < D O l o w ) N / E * = min ( N / E m i n , N / E * Δ ) else N / E * = min ( N / E m a x , N / E * + Δ )
In [68], a method to create a model of energy consumption in WWTP to optimize its environmental impact is presented. This method starts by selecting the best conditions of WWTP energy consumption (through data previously measured) based on different KPIs related to environmental aspects, and then uses this information to design a deep neural network.
The procedure for selecting the best conditions for WWTP energy consumption is divided into two steps. The first step consists of a selection of previous experiences, defined by data usually measured in WWTP, in which values of effluent quality are near the design values corresponding to environmental standards. To select these experiences, the KPI Global Treatment Yield ( G T ) is used and compared with its standardized version Standardizes Global Treatment Yield ( S G T ) calculated by Equations (18) and (19). T i is the Treatment Yield that measures the efficiency of the WWTP to remove the i-th pollutant of the influent, and S T i is the Standardized Treatment Yield. X i , i n and X i , e are the concentrations of the i-th pollutant of the influent and effluent of WWTP [mg/L] and N is the number of pollution parameters ( S S - B O D 5 - C O D - N H 4 ). N i , e is the standard concentration of the i-th parameter of the effluent [mg/L]:
T i = 1 X i , e X i , i n , G T = i = 1 N T i N ,
S T i = 1 N i , e X i , i n , S G T = i = 1 N S T i 2 N .
The second step consists of a selection of the data with optimal energy consumption using three pollution indicators (KPIs), choosing the experiences corresponding to the least value of energy consumed for the same values of a certain KPI. The KPIs used to obtain the optimal energy consumption are Pollution Index ( P L I ), Global Abatement ( G P A B ), Water Quality Index ( W Q I ) and Pollution Index calculated with W Q I ( P L I W Q I ). These KPIs take into consideration the influent and effluent pollutants concentration, pollution parameters standard values and WWTP parameters, and are defined in Equations (20)–(25). P A B i is the abatement degree of the i-th pollutant, Q the flow entering the WWTP [m 3 ], Q d the design value of the flow entering the WWTP [m 3 ], and where I i is the sub-index of the W Q I , w i is the weight relative to each sub-index, and P L I W Q I is the Pollution Index calculated with WQI:
G P = i = 1 N X i , i n 2 N , P L I = G P m a x ( G P ) ,
P A B i = ( X i , i n X i , e ) Q ( D X i , i n ) Q d ,
G A P B = i = 1 N P A B i 2 N ,
I i = 1 X i , i n N i , e m a x ( X i , i n N i , e ) ,
W Q I = i = 1 N I i w i ,
P L I W Q I = 1 W Q I .
In [69], a multi-agent deep reinforcement learning (MADRL) methodology, is proposed to optimize the setpoints of D O levels and the dosage of chemical reagents used in wastewater treatment, with the aim of improving sustainability indicators. Factors such as costs, energy consumption, greenhouse gas emissions, and eutrophication potential were considered. The optimization is performed by a Reinforcement Learning method, using as an actor–critic algorithm the Deep Deterministic Policy Gradient (DDPG). The adopted cost function (reward function) is composed of factors related to the life cycle cost analysis (LCCA) of the treatment process, and by environmental LCA mid-point indicators. The LCCA, given by Equation (26), is composed of the following six factors: costs with E E ( C E E ) and chemical ( C c ) products, costs of transporting ( C t ) and disposing ( C s ) the sludge, biogas production ( C b i o ), and miscellaneous ( C m i s ) costs:
L C C A = C E E + C t + C c + C s + C m i s C b i o .
The environmental indicators considered are energy consumption, eutrophication potential and greenhouse gas emissions. In this study, using the GPS-X (http://www.hydromantis.com) simulator, five scenarios were evaluated, with the baseline scenario being the WWTP with static control for D O levels and dosage of chemical reagents. The other scenarios consider combinations with the optimizations based on treatment costs and analysis of the LCA. The control strategy based on the LCA presents lower environmental impacts while the cost-oriented control improves cost indicators at the expense of environmental indicators. The results demonstrate that optimization strategies that are evaluated by metrics related to sustainability, such as LCA analysis, in addition to cost assessments, have great potential to improve the efficiency and sustainability of WWTPs.

4. Discussion

This section discusses and presents the main conclusions related to the presented literature review. First, the discussion highlights the analyzed papers related to KPI-based WWTP monitoring and prediction techniques (Section 3.1), and then to KPI-based WWTP control and optimization techniques (Section 3.2). Finally, unresolved problems and proposals for future work are pointed out.

4.1. KPI-Based Monitoring Methodologies

The analyzed papers related to WWTP efficiency monitoring, which were described in Section 3.1, are summarized in Table 1.
A common approach to monitoring the performance of WWTPs found in the literature is the use of KPI COD, which is an operational KPI used to ensure that the WWTP functionality is fulfilled. In the analyzed papers, COD is obtained by QR factorization [51], through substances concentration in the effluent [53] or daily records of a municipal WWTP [54]. COD in the effluent or COD removal is a KPI related to one specific function (subsystem) of WWTP (reduction of COD from the influent). Other examples of KPIs related to one WWTP subsystem are the pump efficiency, used in [50], and the S V I used in [55]. However, the use of one single KPI is not enough when the aim is to obtain information on the overall efficiency of the plant or to take into account several factors of the WWTP characteristics. In this context, among the WWTP performance monitoring papers, four of them [44,45,48,49] use energy indices or performance classes obtained by combining/coupling different performance indicators related to energy consumption and substances’ removal parameters.
Of the selected monitoring papers, three of them use eco-efficiency indexes, which take into account environmental aspects. In one of the papers, the eco-efficiency is obtained through DEA [56], while, in [57], it is determined by combining DEA with LCA. Ref. [58] presents an environmental index called Green Index (GI), reflecting the environmental impacts of WWTP operation. However, the online monitorization methodologies for WWTPs in a holistic way, considering different types of KPIs, such as those related to treatment costs, quality of treated effluent, sustainability, and circular economy, are still limited. Regarding the KPI-based monitorization and prediction methods on WWTPs, the main limitations founded on the presented literature review are: (1) a deeper understanding of the variability of KPIs in a WWTP operation system, i.e., why and which parameters/variables affect the efficiency and eco-efficiency; (2) knowing, in real-time, the effects of changes in the variables of the WWTP on performance evaluation metrics, and (3) predicting, with the help of computational intelligence, the behavior of KPIs’ performance according to the interventions made in the optimization process.

4.2. KPI-Based Control and Optimization Methodologies

Concerning the papers about KPI-based control and optimization WWTP performance techniques, which were described in Section 3.2, the respective selected papers are summarized in Table 2.
One important control KPI is the OCI, a KPI cost function that must be minimized [59,63], and that is easily obtained from the energy consumption of several WWTP subsystems. Other objective functions to be minimized are widely used to control energy cost efficiency [61,62]. The factors of the function vary with the objective of the optimization. From [62], J N M P C is the control performance index that takes into account the deviation of certain operation parameters from the setpoints, and J E C O is the economic performance index that takes into account energies and costs. In [61], the objective functions are based on A E , P E and E Q , which are models based on regression kernel functions.
To optimize the environmental impact, as well as the energy consumption of a WWTP, Ref. [68] proposes pollution KPIs to select data that respect environmental requirements: Global Treatment Yield ( G T ), Standardizes Global Treatment Yield ( S G T ) and KPIs to select the optimized energy consumption: P L I , Global Abatement ( G P A B ), and W Q I . In order to improve the overall efficiency of a WWTP performance in a holistic perspective, the global performance indicator N / E index is used at [65,66,67]. N / E index measures the ratio between the amount of nitrogenated compounds eliminated [ k g N ] and the required energy [ k W h ]. In [63], the proposed optimization method, besides the effluent quality index and OCI, uses the percentage of times that the pollutant levels exceed the legal limits. In addition, in [69], the setpoint optimization is based on LCA and LCCA. The LCA is obtained by combining energy consumption, eutrophication potential and greenhouse gas emission. The LCCA is obtained by the costs with energy ( C E E ) and chemical ( C c ) products, costs of transporting ( C t ) and disposing ( C s ) the sludge, biogas production ( C b i o ), and miscellaneous ( C m i s ) costs.
The analysis of the selected works reveals a temporal evolution of control and optimization methods regarding efficiency and eco-efficiency. The methodologies are mainly concerned with reducing energy consumption in WWTPs. More recent works, and in smaller numbers, treat WWTPs holistically by trying to optimize the complete performance of the structure considering, in addition to traditional objectives, sustainability, and circular economy concepts. Related to the KPI-based control and optimization methods on WWTPs, the main limitations founded on the presented literature review are the existence of few works that study the online multiobjective optimization of WWTPs towards sustainability in order to optimize the evaluation metrics (KPIs) by adapting the parameters/variables/setpoints.

4.3. BSM Simulators

Due to the complexity of WWTPs, mathematical and biological modeling is very useful in process design and optimization. From the research papers referred to in the literature review, BSM1 and BSM2 simulators are the most commonly used. A review of modeling WWTPs was presented by [70], in which the previous models that have originated this simulator can be founded [71,72,73,74,75].
The BSM1 plant is composed of a five-compartment activated sludge reactor consisting of two anoxic tanks followed by three aerobic tanks and a clarifier (settler), being a configuration commonly used for biological nitrogen removal in full-scale plants [76]. The first two reactors are two anoxic tanks where the predenitrification process occurs, which is affected by the internal recirculation that transfers nitrates from the aerobic zone to anoxic tanks. In addition, the last three reactors are aerated to promote the nitrification [76,77]. Then, after the secondary clarifier, the clean effluent is discharged, and the wastage flow is discharged and partly recycled to the anoxic zone (external recycle flow). There is also the external carbon dosage to keep the levels of biodegradable substrate required by heterotrophs for denitrification [77].
Later, the BSM2 was developed [78,79]. BSM2 plant includes the BSM1 structure for the biological treatment of wastewater, and also includes the water line and the sludge line for sludge treatment of a WWTP [77]. The water line includes a primary clarifier, activated sludge reactors and a secondary clarifier. The sludge line includes thickening units, an anaerobic digester, dewatering units and a storage tank for the rejected water [77].
The above description of BSM models justifies the choice of these simulators in order to test computational intelligence methodologies based on KPIs.

5. Conclusions

As presented in the review developed in this paper, several efforts have been made in recent years to develop techniques for the monitoring and control of efficiency and eco-efficiency in WWTPs based on KPIs and indexes. However, there is no abundant literature on the subject yet. The research on control and optimization methods is limited, and no research work has been conducted on decision systems to control the efficiency and eco-efficiency of WWTPs based on KPI. Regarding monitoring methods, there are few studies about the prediction of KPIs that could be useful for future works on control and decision systems.
As future research directions on KPI-based methodologies on WWTPs, it can be concluded based on the presented literature review that there is a necessity of methodologies to identify, in an online way, the reasons for the degradation of efficiency and eco-efficiency KPIs; to perform an online multiobjective optimization of WWTPs towards sustainability in order to optimize the KPIs by adapting the parameters of the WWTP; and to predict the behavior of the KPIs when the WWTP parameters are updated by the optimization process.

Author Contributions

Conceptualization, methodology, formal analysis: B.d.M., J.M., A.J.B. and P.M.; writing–original draft preparation: B.d.M. and R.S.; validation, writing—review and editing, J.M., J.R.G., A.J.B. and P.M. All authors have read and agreed to the published version of the manuscript.

Funding

This work was carried out under the project Eco-Healing-Intelligent Eco-controller with self-healing capability, supported by OE-national funds of FCT/MCTES (PIDDAC) under project UIDB/00048/2020.

Conflicts of Interest

The authors declare no conflict of interest.

Abbreviations

The following abbreviations are used in this manuscript:
AEAeration Energy
ANNArtificial Neural Network
BODBiological Oxygen Demand
BSM1Benchmark Simulation Model No. 1
BSM2Benchmark Simulation Model No. 2
CODChemical Oxygen Demand
DEAData Envelopment Analysis
DMOPSODynamic Multiobjective Particle Swarm Optimization
DODissolved Oxygen
EEElectrical Energy
EPIEnergy Performance Indicator
EQEffluent Quality
EQIEffluent Quality Index
FLCFuzzy Logic Controller
GIGreen Index
HRBFHierarchical Radial Basis Function
KPIKey Performance Indicator
LCALife Cycle Assessment
LCCALife Cycle Cost Analysis
MPCModel Predictive Control
NONitric Oxide
OCIOverall Cost Index
PEPump Energy
PIProportional–Integral
PIDProportional–Integral–Derivative
PLCProgrammable Logic Controller
PLIPollution Index
SCADASupervisory Control and Data Acquisition
SLRSystematic Literature Review
STOATSewage Treatment Operation and Analysis over Time
SVISludge Volume Index
TNTotal Nitrogen
WQIWater Quality Index
WTEIWater Treatment Energy Index
WWTPWastewater Treatment Plant

References

  1. Mendes, J.; Maia, R.; Araújo, R.; Souza, F.A.A. Self-Evolving Fuzzy Controller Composed of Univariate Fuzzy Control Rules. Appl. Sci. 2020, 10, 5836. [Google Scholar] [CrossRef]
  2. Mendes, J.; Araújo, R.; Souza, F. Adaptive Fuzzy Identification and Predictive Control for Industrial Processes. Expert Syst. Appl. 2013, 40, 6964–6975. [Google Scholar] [CrossRef]
  3. Parmenter, D. Key Performance Indicators: Developing, Implementing, and Using Winning KPIs; John Wiley & Sons: Hoboken, NJ, USA, 2015. [Google Scholar] [CrossRef]
  4. Körner, M.F.; Bauer, D.; Keller, R.; Rösch, M.; Schlereth, A.; Simon, P.; Bauernhansl, T.; Fridgen, G.; Reinhart, G. Extending the automation pyramid for industrial demand response. Procedia CIRP 2019, 81, 998–1003. [Google Scholar] [CrossRef]
  5. Strelnik, E.; Usanova, D.; Khairullin, I. Key performance indicators in corporate finance. Asian Soc. Sci. 2015, 11, 369. [Google Scholar] [CrossRef] [Green Version]
  6. Hřebíček, J.; Misařová, P.; Hyršlová, J. Environmental key performance indicators and corporate reporting. In Proceedings of the International Conference EA-SDI, Prague, The Czech Republic, 23–25 May 2007; pp. 147–155. [Google Scholar]
  7. Lindberg, C.F.; Tan, S.; Yan, J.; Starfelt, F. Key performance indicators improve industrial performance. Energy Procedia 2015, 75, 1785–1790. [Google Scholar] [CrossRef] [Green Version]
  8. Belanche, L.A.; Valdés, J.J.; Comas, J.; Roda, I.R.; Poch, M. Towards a model of input–output behaviour of wastewater treatment plants using soft computing techniques. Environ. Model. Softw. 1999, 14, 409–419. [Google Scholar] [CrossRef] [Green Version]
  9. Beraud, B.; Steyer, J.P.; Lemoine, C.; Latrille, E. Optimization of WWTP control by means of multi-objective genetic algorithms and sensitivity analysis. In 18th European Symposium on Computer Aided Process Engineering; Computer Aided Chemical Engineering; Braunschweig, B., Joulia, X., Eds.; Elsevier: Amsterdam, The Netherlands, 2008; Volume 25, pp. 539–544. [Google Scholar] [CrossRef]
  10. Dairi, A.; Cheng, T.; Harrou, F.; Sun, Y.; Leiknes, T. Deep learning approach for sustainable WWTP operation: A case study on data-driven influent conditions monitoring. Sustain. Cities Soc. 2019, 50, 101670. [Google Scholar] [CrossRef]
  11. Salles, R.; Mendes, J.; Araújo, R.; Melo, C.; Moura, P. Prediction of Key Variables in Wastewater Treatment Plants Using Machine Learning Models. In Proceedings of the 2022 IEEE International Joint Conference on Neural Networks (IJCNN 2022), at the 2022 World Congress on Coomputational Intelligence (WCCI 2022), Padua, Italy, 18–23 July 2022; IEEE: Padova, Italy, 2022; pp. 1–9. [Google Scholar] [CrossRef]
  12. Gernaey, K.V.; Flores-Alsina, X.; Rosen, C.; Benedetti, L.; Jeppsson, U. Dynamic influent pollutant disturbance scenario generation using a phenomenological modelling approach. Environ. Model. Softw. 2011, 26, 1255–1267. [Google Scholar] [CrossRef]
  13. del Olmo, F.H.; Gaudioso, E.; Duro, N.; Dormido, R. Machine learning weather soft-sensor for advanced control of wastewater treatment plants. Sensors 2019, 19, 3139. [Google Scholar] [CrossRef] [Green Version]
  14. Salles, R.; Mendes, J.; Antunes, C.H.; Moura, P.; Dias, J. Dynamic Setpoint Optimization Using Metaheuristic Algorithms for Wastewater Treatment Plants. In Proceedings of the 48th Annual Conference of the IEEE Industrial Electronics Society (IECON 2022), Brussels, Belgium, 17–20 October 2022; pp. 1–6. [Google Scholar] [CrossRef]
  15. Xu, C.M.; Zhang, J.S.; Kong, L.Q.; Jin, X.B.; Kong, J.L.; Bai, Y.T.; Su, T.L.; Ma, H.J.; Chakrabarti, P. Prediction Model of Wastewater Pollutant Indicators Based on Combined Normalized Codec. Mathematics 2022, 10, 4283. [Google Scholar] [CrossRef]
  16. Wang, D.; Ha, M.; Qiao, J. Data-Driven Iterative Adaptive Critic Control Toward an Urban Wastewater Treatment Plant. IEEE Trans. Ind. Electron. 2021, 68, 7362–7369. [Google Scholar] [CrossRef]
  17. Rastegar, S.; Araújo, R.; Mendes, J. A New Approach for Online T-S Fuzzy Identification and Model Predictive Control of Nonlinear Systems. J. Vib. Control 2016, 22, 1820–1837. [Google Scholar] [CrossRef]
  18. Rastegar, S.; Araújo, R.; Mendes, J.; Matias, T.; Emami, A. Self-Adaptive Takagi-Sugeno Model Identification Methodology For Industrial Control Processes. In Proceedings of the 40th Annual Conference of the IEEE Industrial Electronics Society (IECON 2014), Dallas, TX, USA, 29 October–1 November 2014; IEEE: Dallas, TX, USA, 2014; pp. 281–287. [Google Scholar] [CrossRef]
  19. Sweetapple, C.; Fu, G.; Butler, D. Multi-objective optimisation of wastewater treatment plant control to reduce greenhouse gas emissions. Water Res. 2014, 55, 52–62. [Google Scholar] [CrossRef] [PubMed] [Green Version]
  20. Mendes, J.; Araújo, R.; Matias, T.; Seco, R.; Belchior, C. Evolutionary Learning of a Fuzzy Controller for Industrial Processes. In Proceedings of the 40th Annual Conference of the IEEE Industrial Electronics Society (IECON 2014), Dallas, TX, USA, 29 October–1 November 2014; IEEE: Dallas, TX, USA, 2014; pp. 139–145. [Google Scholar] [CrossRef]
  21. Hernández-Sancho, F.; Molinos-Senante, M.; Sala-Garrido, R. Energy efficiency in Spanish wastewater treatment plants: A non-radial DEA approach. Sci. Total. Environ. 2011, 409, 2693–2699. [Google Scholar] [CrossRef]
  22. Dong, X.; Zhang, X.; Zeng, S. Measuring and explaining eco-efficiencies of wastewater treatment plants in China: An uncertainty analysis perspective. Water Res. 2017, 112, 195–207. [Google Scholar] [CrossRef]
  23. Alizadeh, S.; Zafari-Koloukhi, H.; Rostami, F.; Rouhbakhsh, M.; Avami, A. The eco-efficiency assessment of wastewater treatment plants in the city of Mashhad using emergy and life cycle analyses. J. Clean. Prod. 2020, 249, 119327. [Google Scholar] [CrossRef]
  24. Lorenzo-Toja, Y.; Vázquez-Rowe, I.; Amores, M.J.; Termes-Rifé, M.; Marín-Navarro, D.; Moreira, M.T.; Feijoo, G. Benchmarking wastewater treatment plants under an eco-efficiency perspective. Sci. Total. Environ. 2016, 566–567, 468–479. [Google Scholar] [CrossRef]
  25. Chen, X.; Al, R.; Behera, C.R.; Sin, G. Process Synthesis, Design, and Control of Wastewater Treatment Plants. In Reference Module in Chemistry, Molecular Sciences and Chemical Engineering; Elsevier: Amsterdam, The Netherlands, 2018; pp. 1–14. [Google Scholar] [CrossRef]
  26. Sanchez, A.; Katebi, M. Predictive control of dissolved oxygen in an activatedsludge wastewater treatment plant. In Proceedings of the 2003 European Control Conference (ECC), Cambridge, UK, 1–4 September 2003; pp. 2424–2429. [Google Scholar] [CrossRef]
  27. Grochowski, M.; Rutkowski, T.A. Supervised model predictive control of wastewater treatment plant. In Proceedings of the 2016 21st International Conference on Methods and Models in Automation and Robotics (MMAR), Miedzyzdroje, Poland, 29 August–1 September 2016; pp. 613–618. [Google Scholar] [CrossRef]
  28. Alex, J.; Tschepetzki, R.; Jumar, U. Predictive control of nitrogen removal in WWTPs using parsimonious models. IFAC Proc. Vol. 2002, 35, 405–410. [Google Scholar] [CrossRef] [Green Version]
  29. Steffens, M.A.; Lant, P. Multivariable control of nutrient-removing activated sludge systems. Water Res. 1999, 33, 2864–2878. [Google Scholar] [CrossRef]
  30. SotomayoR, O.A.; Park, S.W.; Garcia, C. MPC control of a predenitrification plant using linear subspace models. In Computer Aided Chemical Engineering; Elsevier: Amsterdam, The Netherlands, 2002; Volume 10, pp. 553–558. [Google Scholar] [CrossRef]
  31. Charef, A.; Ghauch, A.; Martin-Bouyer, M. An adaptive and predictive control strategy for an activated sludge process. Bioprocess Eng. 2000, 23, 529–534. [Google Scholar] [CrossRef]
  32. Pisa, I.; Morell, A.; Vicario, J.L.; Vilanova, R. Denoising Autoencoders and LSTM-Based Artificial Neural Networks Data Processing for Its Application to Internal Model Control in Industrial Environments—The Wastewater Treatment Plant Control Case. Sensors 2020, 20, 3743. [Google Scholar] [CrossRef]
  33. Yu, R.F.; Chen, H.W.; Cheng, W.P.; Shen, Y.C. Dynamic control of disinfection for wastewater reuse applying ORP/pH monitoring and artificial neural networks. Resour. Conserv. Recycl. 2008, 52, 1015–1021. [Google Scholar] [CrossRef]
  34. Lee, C. Fuzzy logic in control systems: Fuzzy logic controller. I. IEEE Trans. Syst. Man Cybern. 1990, 20, 404–418. [Google Scholar] [CrossRef] [Green Version]
  35. Pedrycz, W. Fuzzy Control and Fuzzy Systems; Research Studies Press Ltd.: Somerset, UK, 1993. [Google Scholar]
  36. Hájek, P. Metamathematics of Fuzzy Logic; Springer Science & Business Media: Berlin/Heidelberg, Germany, 2013; Volume 4. [Google Scholar] [CrossRef]
  37. Mendes, J.; Araújo, R.; Matias, T.; Seco, R.; Belchior, C. Automatic Extraction of the Fuzzy Control System by a Hierarchical Genetic Algorithm. Eng. Appl. Artif. Intell. 2014, 29, 70–78. [Google Scholar] [CrossRef]
  38. Zawadzki, A.; Piotrowski, R. Nonlinear fuzzy control of the dissolved oxygen in activated sludge processes. In Proceedings of the 2012 IEEE 17th International Conference on Emerging Technologies Factory Automation (ETFA 2012), Krakow, Poland, 17–21 September 2012; pp. 1–7. [Google Scholar] [CrossRef]
  39. Fiter, M.; Güell, D.; Comas, J.; Colprim, J.; Poch, M.; Rodríguez-Roda, I. Energy saving in a wastewater treatment process: An application of fuzzy logic control. Environ. Technol. 2005, 26, 1263–1270. [Google Scholar] [CrossRef]
  40. Bongards, M. Improving the efficiency of a wastewater treatment plant by fuzzy control and neural networks. Water Sci. Technol. 2001, 43, 189–196. [Google Scholar] [CrossRef] [PubMed]
  41. Kalker, T.; Goor, C.V.; Roeleveld, P.; Ruland, M.; Babuška, R. Fuzzy control of aeration in an activated sludge wastewater treatment plant: Design, simulation and evaluation. Water Sci. Technol. 1999, 39, 71–78. [Google Scholar] [CrossRef]
  42. Boiocchi, R.; Gernaey, K.V.; Sin, G. A novel fuzzy-logic control strategy minimizing N2O emissions. Water Res. 2017, 123, 479–494. [Google Scholar] [CrossRef]
  43. Kitchenham, B. Procedures for performing systematic reviews. Keele UK Keele Univ. 2004, 33, 1–26. [Google Scholar]
  44. Sabia, G.; Luigi, P.; Avolio, F.; Caporossi, E. Energy saving in wastewater treatment plants: A methodology based on common key performance indicators for the evaluation of plant energy performance, classification and benchmarking. Energy Convers. Manag. 2020, 220, 113067. [Google Scholar] [CrossRef]
  45. Longo, S.; Mauricio-Iglesias, M.; Soares, A.; Campo, P.; Fatone, F.; Eusebi, A.L.; Akkersdijk, E.; Stefani, L.; Hospido, A. ENERWATER–A standard method for assessing and improving the energy efficiency of wastewater treatment plants. Appl. Energy 2019, 242, 897–910. [Google Scholar] [CrossRef] [Green Version]
  46. Molinos-Senante, M.; Hernandez-Sancho, F.; Sala-Garrido, R. Benchmarking in wastewater treatment plants: A tool to save operational costs. Clean Technol. Environ. Policy 2014, 16, 149–161. [Google Scholar] [CrossRef]
  47. Reyment, R.A.; Jvreskog, K. Applied Factor Analysis in the Natural Sciences; Cambridge University Press: Cambridge, UK, 1996. [Google Scholar] [CrossRef]
  48. Fraia, S.D.; Massarotti, N.; Vanoli, L. A novel energy assessment of urban wastewater treatment plants. Energy Convers. Manag. 2018, 163, 304–313. [Google Scholar] [CrossRef]
  49. Mauricio-Iglesias, M.; Longo, S.; Hospido, A. Designing a robust index for WWTP energy efficiency: The ENERWATER water treatment energy index. Sci. Total. Environ. 2020, 713, 136642. [Google Scholar] [CrossRef] [PubMed]
  50. Torregrossa, D.; Hansen, J.; Hernández-Sancho, F.; Cornelissen, A.; Schutz, G.; Leopold, U. A data-driven methodology to support pump performance analysis and energy efficiency optimization in Waste Water Treatment Plants. Appl. Energy 2017, 208, 1430–1440. [Google Scholar] [CrossRef]
  51. Krueger, M.; Luo, H.; Ding, S.X.; Dominic, S.; Yin, S. Data-driven approach of KPI monitoring and prediction with application to wastewater treatment process. IFAC-PapersOnLine 2015, 48, 627–632. [Google Scholar] [CrossRef]
  52. Jeppsson, U.; Pons, M.N.; Nopens, I.; Alex, J.; Copp, J.; Gernaey, K.; Rosén, C.; Steyer, J.P.; Vanrolleghem, P. Benchmark simulation model no 2: General protocol and exploratory case studies. Water Sci. Technol. 2007, 56, 67–78. [Google Scholar] [CrossRef]
  53. Ju, H.; Yin, S.; Gao, H.; Kaynak, O. A data-based KPI prediction approach for wastewater treatment processes. In Proceedings of the 2015 International Conference on Man and Machine Interfacing (MAMI), Bhubaneswar, India, 17–19 December 2015; pp. 1–6. [Google Scholar] [CrossRef]
  54. Li, Z.; Zou, Z.; Wang, L. Analysis and forecasting of the energy consumption in wastewater treatment plant. Math. Probl. Eng. 2019, 2019, 8690898. [Google Scholar] [CrossRef] [Green Version]
  55. Han, H.; Qiao, J. Hierarchical Neural Network Modeling Approach to Predict Sludge Volume Index of Wastewater Treatment Process. IEEE Trans. Control. Syst. Technol. 2013, 21, 2423–2431. [Google Scholar] [CrossRef]
  56. Gómez, T.; Gémar, G.; Molinos-Senante, M.; Sala-Garrido, R.; Caballero, R. Measuring the eco-efficiency of wastewater treatment plants under data uncertainty. J. Environ. Manag. 2018, 226, 484–492. [Google Scholar] [CrossRef]
  57. Torregrossa, D.; Marvuglia, A.; Leopold, U. A novel methodology based on LCA+ DEA to detect eco-efficiency shifts in wastewater treatment plants. Ecol. Indic. 2018, 94, 7–15. [Google Scholar] [CrossRef]
  58. Mustapha, M.A.; Manan, Z.A.; Alwi, S.R.W. A new quantitative overall environmental performance indicator for a wastewater treatment plant. J. Clean. Prod. 2017, 167, 815–823. [Google Scholar] [CrossRef]
  59. Dominic, S.; Shardt, Y.A.; Ding, S.X.; Luo, H. An adaptive, advanced control strategy for KPI-based optimization of industrial processes. IEEE Trans. Ind. Electron. 2015, 63, 3252–3260. [Google Scholar] [CrossRef]
  60. Nelles, O. Nonlinear System Identification: From Classical Approaches to Neural Networks, Fuzzy Models, and Gaussian Processes; Springer Nature: Berlin/Heidelberg, Germany, 2020. [Google Scholar]
  61. Han, H.G.; Liu, Z.; Lu, W.; Hou, Y.; Qiao, J.F. Dynamic MOPSO-based optimal control for wastewater treatment process. IEEE Trans. Cybern. 2019, 51, 2518–2528. [Google Scholar] [CrossRef] [PubMed]
  62. Silvana, R.; Pastora, V.; Ramón, V.; Mario, F. Optimal control of wastewater treatment plants using economic-oriented model predictive dynamic strategies. Appl. Sci. 2017, 7, 813. [Google Scholar] [CrossRef]
  63. Caraman, S.; Luca, L.; Vasiliev, I.; Barbu, M. Optimal-Setpoint-Based Control Strategy of a Wastewater Treatment Process. Processes 2020, 8, 1203. [Google Scholar] [CrossRef]
  64. Pereira, J.; Mendes, J.; Júnior, J.S.S.; Viegas, C.; Paulo, J.R. A Review of Genetic Algorithm Approaches for Wildfire Spread Prediction Calibration. Mathematics 2022, 10, 300. [Google Scholar] [CrossRef]
  65. Revollar, S.; Vilanova, R.; Francisco, M.; Vega, P. PI Dissolved Oxygen control in wastewater treatment plants for plantwide nitrogen removal efficiency. IFAC-PapersOnLine 2018, 51, 450–455. [Google Scholar] [CrossRef]
  66. Revollar, S.; Vega, P.; Francisco, M.; Vilanova, R. A hierachical Plant wide operation in wastewater treatment plants: Overall efficiency index control and event-based reference management. In Proceedings of the 2018 22nd International Conference on System Theory, Control and Computing (ICSTCC), Sinaia, Romania, 10–12 October 2018; pp. 201–206. [Google Scholar]
  67. Revollar, S.; Vilanova, R.; Vega, P.; Francisco, M.; Meneses, M. Wastewater treatment plant operation: Simple control schemes with a holistic perspective. Sustainability 2020, 12, 768. [Google Scholar] [CrossRef] [Green Version]
  68. Oulebsir, R.; Lefkir, A.; Safri, A.; Bermad, A. Optimization of the energy consumption in activated sludge process using deep learning selective modeling. Biomass Bioenergy 2020, 132, 105420. [Google Scholar] [CrossRef]
  69. Chen, K.; Wang, H.; Valverde-Pérez, B.; Zhai, S.; Vezzaro, L.; Wang, A. Optimal control towards sustainable wastewater treatment plants based on multi-agent reinforcement learning. Chemosphere 2021, 279, 130498. [Google Scholar] [CrossRef] [PubMed]
  70. Pereira, S.F. Modelling of a wastewater treatment plant using GPS-X. Ph.D. Thesis, Faculdade de Ciências e Tecnologia, Departamento de Química, Universidade NOVA de Lisboa, Lisbon, Portugal, 2014. [Google Scholar]
  71. Henze, M.; Jr, C.L.G.; Gujer, W.; Marais, G.; Matsuo, T. Activated Sludge Model No. 1. IAWQ Scientific and Technical Report No. 1 IAWQ; IAWPRC: London, UK, 1987. [Google Scholar]
  72. Henze, M.; Gujer, W.; Mino, T.; Matsuo, T.; Wentzel, M.; Marais, G. Activated sludge model No. 2 (ASM2). IWA Scientific and Technical Report No. 3, IAWQ: London 1995.
  73. Henze, M.; Gujer, W.; Mino, T.; Matsuo, T.; Marais, G.V.R.; Marais, G.; Van Loosdrecht, M.C. Activated sludge model No.2D, ASM2D. Water Sci. Technol. 1999, 39, 165–182. [Google Scholar] [CrossRef]
  74. Gujer, W.; Henze, M.; Mino, T.; van Loosdrecht, M. Activated sludge model No. 3. Water Sci. Technol. 1999, 39, 183–193. [Google Scholar] [CrossRef]
  75. van Veldhuizen, H.; van Loosdrecht, M.; Heijnen, J. Modelling biological phosphorus and nitrogen removal in a full scale activated sludge process. Water Res. 1999, 33, 3459–3468. [Google Scholar] [CrossRef]
  76. Alex, J.; Benedetti, L.; Copp, J.; Gernaey, K.; Jeppsson, U.; Nopens, I.; Pons, M.; Rieger, L.; Rosen, C.; Steyer, J.; et al. Benchmark simulation model no. 1 (BSM1). In Report by the IWA Taskgroup on Benchmarking of Control Strategies for WWTPs; Department of Industrial Electrical Engineering and Automation, Lund University: Lund, Sweden, 2008; pp. 19–20. [Google Scholar]
  77. Revollar, S.; Meneses, M.; Vilanova, R.; Vega, P.; Francisco, M. Eco-Efficiency Assessment of Control Actions in Wastewater Treatment Plants. Water 2021, 13, 612. [Google Scholar] [CrossRef]
  78. Jeppsson, U.; Rosen, C.; Alex, J.; Copp, J.; Gernaey, K.; Pons, M.N.; Vanrolleghem, P. Towards a benchmark simulation model for plant-wide control strategy performance evaluation of WWTPs. Water Sci. Technol. 2006, 53, 287–295. [Google Scholar] [CrossRef]
  79. Gernaey, K.V.; Jeppsson, U. Benchmarking of Control Strategies for Wastewater Treatment Plants; IWA publishing: London, UK, 2014. [Google Scholar]
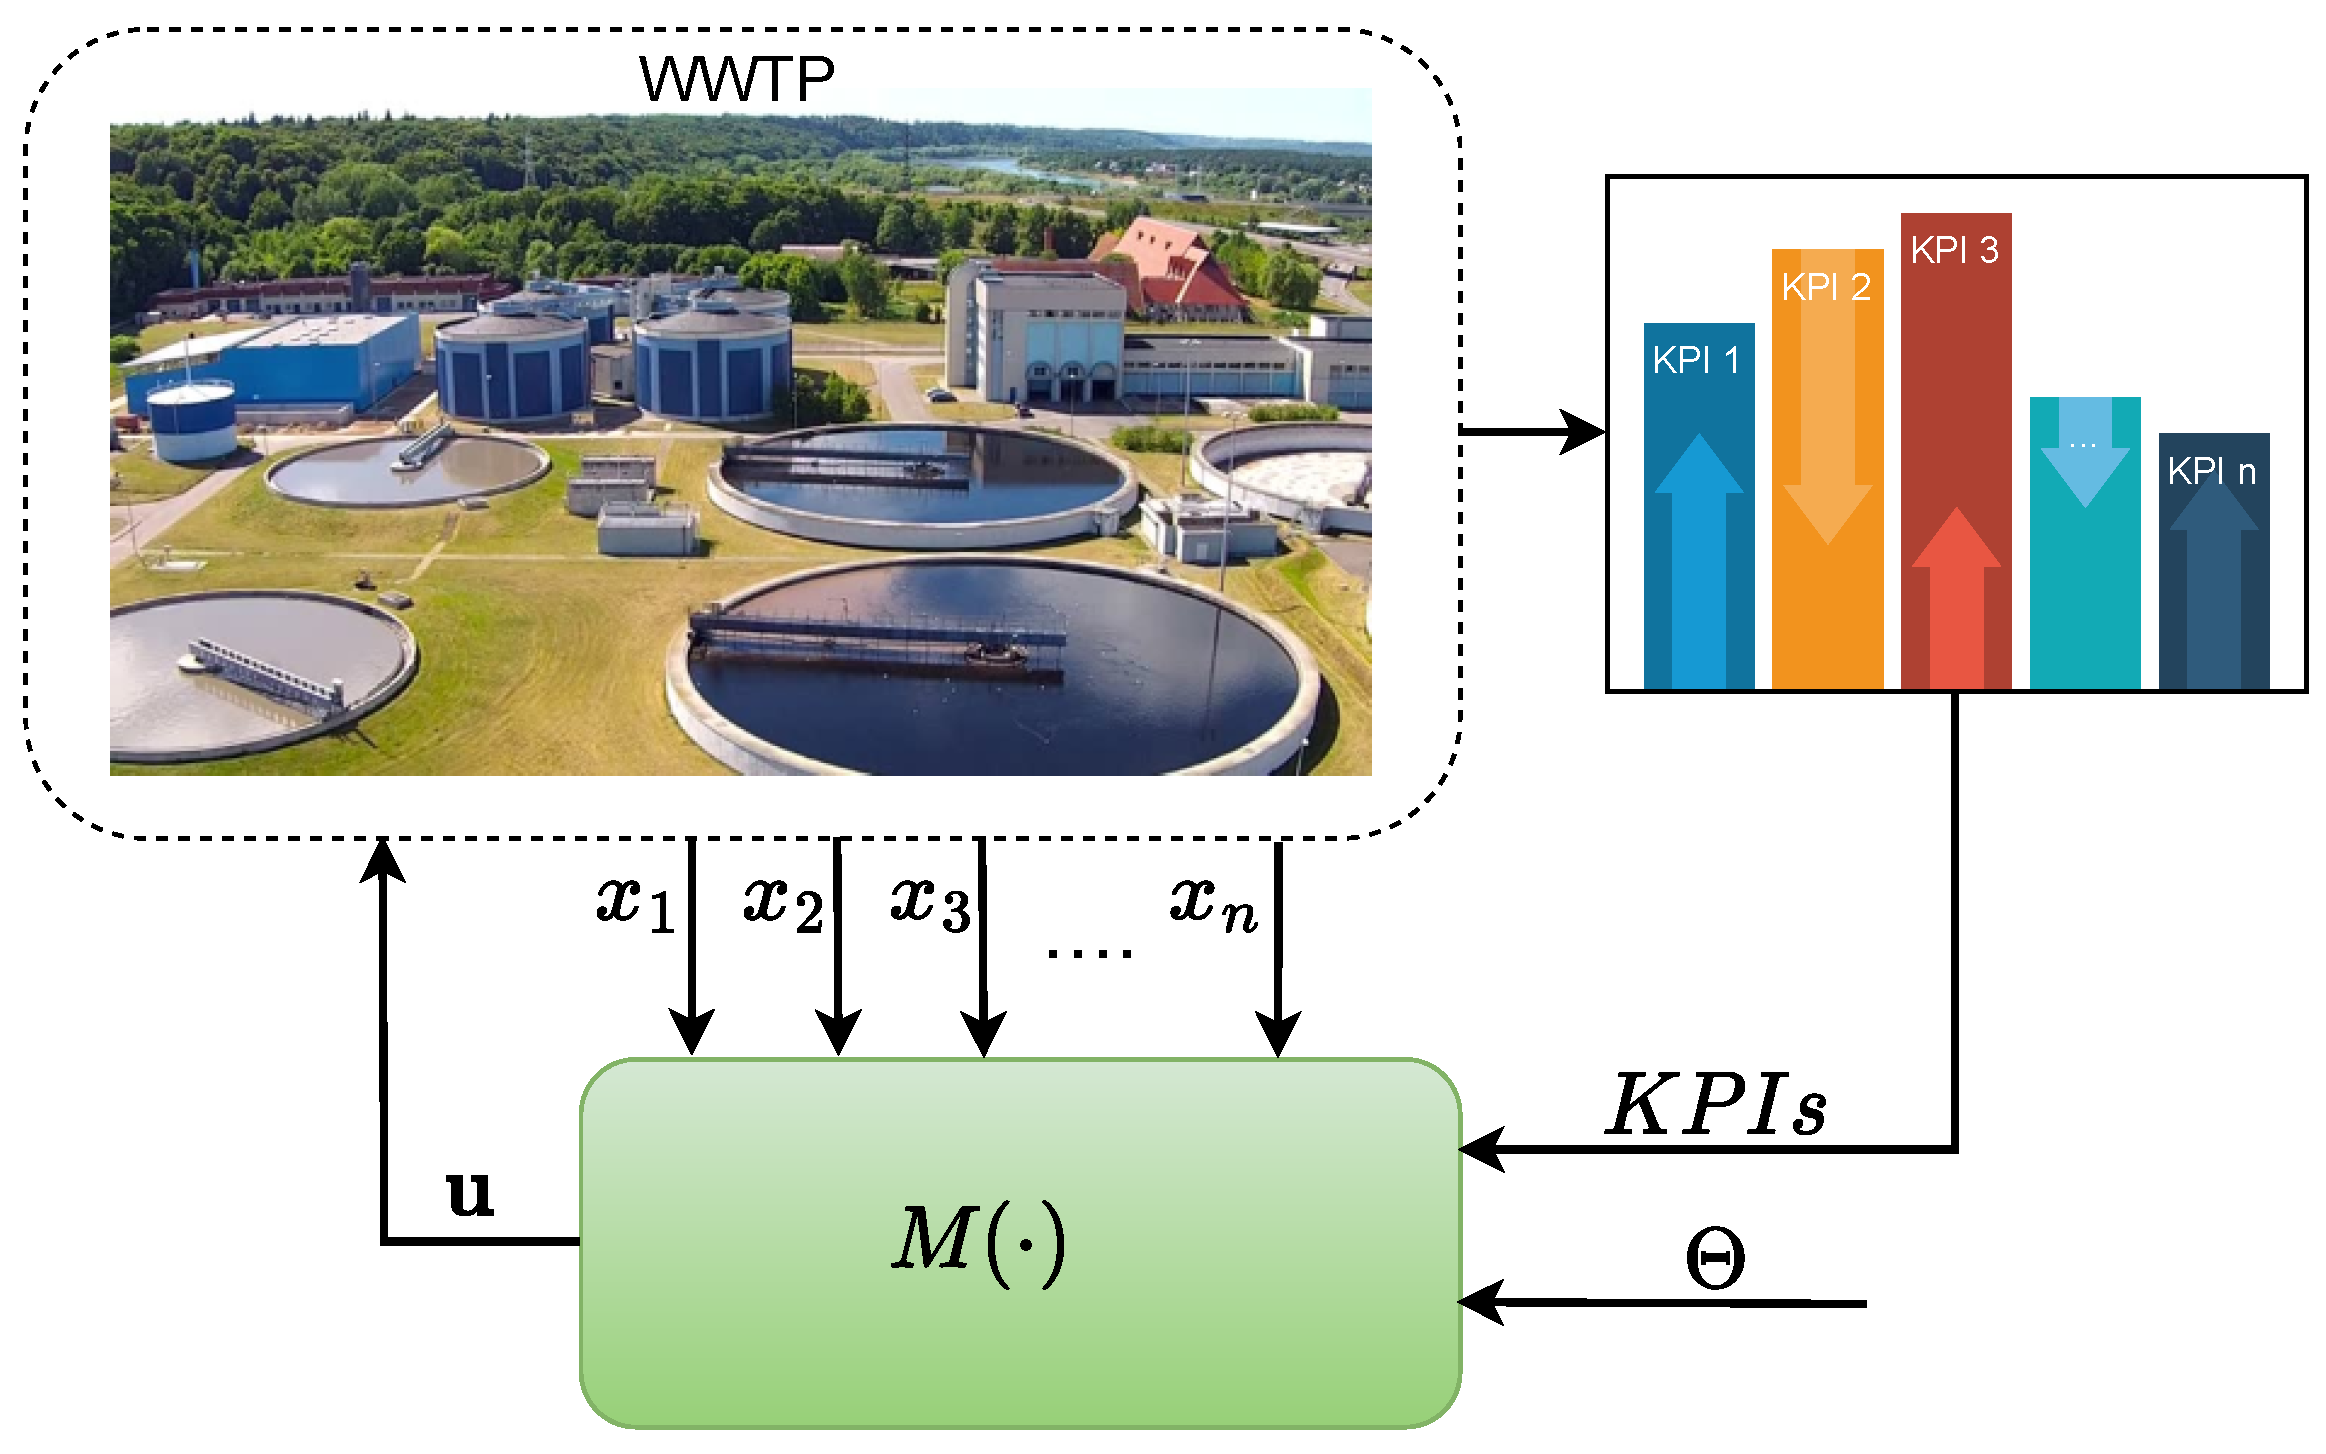
Figure 1. A generic example of a monitoring, control or optimization method ( M ( · ) ) that uses data from process variables ( x 1 , x 2 , , x n ) and KPIs to provide some output(s) ( u ) to optimize the WWTP. Θ are the hyper-parameters of M ( · ) .
Mathematics 11 00173 g001
Figure 2. Publications’ distribution over the years between 2012 and 2022, related to KPI-based methodologies for WWTPs. No papers were found in the years 2012 and 2022 that fit the objectives of this review.
Mathematics 11 00173 g002
Figure 3. Overview of the organization of Section 3.
Mathematics 11 00173 g003
Figure 4. Diagram illustrating the proposed procedure in [48].
Mathematics 11 00173 g004
Figure 5. Diagram illustrating the proposed method in [59].
Mathematics 11 00173 g005
Figure 6. Diagram illustrating the proposed method in [63].
Mathematics 11 00173 g006
Figure 7. Diagram illustrating the proposed methods in from [65,66].
Mathematics 11 00173 g007
Table 1. Resume of the selected papers related to WWTP KPI-based efficiency monitoring.
ReferenceKPI TypeKPI(s)Plant
[51]Operational C O D in the effluent.BSM
[53]Operational C O D in the effluentBSM
[54]OperationalEnergy consumption obtained from C O D and T N r e m o v a l performance indicators.BSM
[50]EnergyEfficiency based on fuzzy rules and the daily value of 5 KPIs.Real WWTP
[55]Operational S V I obtained
[45,49]EnergyWTEI (12)Real WWTP
[44]EnergyGlobal Energetic Index (GEI) (2)Real WWTP
[48]EnergyEnergy Performance Indicators: E P I B O D , E P I T N , E P I S L and E P I S L & T r Real WWTP
[57]EcoThrough DEA and LCA. Outputs: C O D r e m o v e d , M E T p r o d STOAT simulator
[56]EcoEco-efficiency θ obtained by DEA from resources consumed (costs), desirable outputs (TSS and COD) and undesirable output (indirect green-house gases)Real WWTP
[58]Eco G I (14)SuperPro Designer 8.5
Table 2. Resume of the selected papers related to WWTP KPI-based control and optimization.
ReferenceKPI TypeKPI(s)Plant
[62]EnergyModel Predictive Control that takes into account the economic performance index (energies and costs), J E C O (15)BSM
[61]EnergyObjective functions based on A E , P E and E Q that are models based on regression kernel functionsBSM/Real
[59]EnergyOCIBSM
[68]Eco EnergyKPIs, (18) to (25), to select data that respect to: environmental requirements, Global Treatment Yield ( G T ) and Standardizes G T ( S G T ); and to optimized energy consumption, P L I , Global Abatement ( G P A B ) and W Q I Real
[65,66,67]Eco Energy N / E Index, ration between the amount of nitrogenated compounds eliminated and the energy consumedBSM
[63]Eco EnergyOCI, EQI and the percentage of times that the pollutant levels exceed the legal limitsSIMBA/Benchmark Simulation Model No. 2 (BSM2) Real
[69]Eco EnergyLCCA (based on costs with energy ( C e ) and chemical ( C c ) products, costs of transporting ( C t ) and disposing ( C s ) the sludge, biogas production ( C b i o ), and miscellaneous ( C m i s ) costs) and LCA (based on energy consumption, eutrophication potential and greenhouse gas emission)GPS-X
Disclaimer/Publisher’s Note: The statements, opinions and data contained in all publications are solely those of the individual author(s) and contributor(s) and not of MDPI and/or the editor(s). MDPI and/or the editor(s) disclaim responsibility for any injury to people or property resulting from any ideas, methods, instructions or products referred to in the content.