Article

Numerical Modeling and Investigation of Fault-Induced Water Inrush Hazard under Different Mining Advancing Directions

1
MOE Key Laboratory of Deep Coal Resource Mining, School of Mines, China University of Mining & Technology, Xuzhou 221116, China
2
Jiangsu Laboratory of Mine Earthquake Monitoring and Prevention, China University of Mining & Technology, Xuzhou 221116, China
*
Author to whom correspondence should be addressed.
Mathematics 2022, 10(9), 1561; https://doi.org/10.3390/math10091561
Submission received: 20 February 2022 / Revised: 30 March 2022 / Accepted: 14 April 2022 / Published: 5 May 2022

Abstract

:
Evaluations of the risk of fault-induced water inrush hazard is an important issue for mining engineering applications. According to the characteristics of the seam floor during mining advancing, a mechanical model of fault activation is built to obtain the equations of normal stress and shear stress on the surface of fault, as well as the mechanics criterion of fault activation. Furthermore, using FLAC3D numerical software, the stress variation on the surface of fault under two different mining advancing directions are numerically simulated, and the distribution characteristics of the plastic failure zone of the roof and floor near the fault are obtained. The results show that: (1) When mining advances from the hanging wall, the normal stress increases more greatly than that from the foot wall, the shear stress distribution changes drastically with a large peak, and it is more likely to cause fault activation. (2) When mining advances from the hanging wall and approaches the fault, the normal stress and shear stress within the fault first increases, and then decreases suddenly. When mining advances from the foot wall, the normal stress and shear stress increases constantly, and the fault zone stays in the compaction state where the hanging wall and foot wall are squeezed together, which is unfavorable for water inrush hazard. (3) When mining advances from the hanging wall, the deep-seated fault under the floor is damaged first, and the plastic failure zone of the floor increases obviously. When mining advances from the foot wall, the shallow fault under the floor is damaged first, and the plastic failure zone of roof increases obviously. (4) For a water-conducting fault, the waterproof coal pillar size of the mining advancing from the hanging wall should be larger than that from the foot wall. (5) The in-situ monitoring results are in agreement with the simulation results, which proves the effectiveness of the simulation.

1. Introduction

Mining-induced water inrush is one of the main kinds of mine water hazards in China, especially in northern China where water inrush hazards from the floor frequently occur [1,2]. According to the statistics, more than 55% of the mine water hazards are caused from the floor, of which about 80% of the water inrush is related with a fault [3,4,5,6,7,8].
It is of importance to know how water inrush could develop during mining advances [1,5,9,10,11,12,13]. As shown in Figure 1a, intact rock mass has good mechanical properties with smaller permeability, but small fractures in the floor are caused by mining [14,15,16,17]. However, fault not only changes the mechanical properties of rock mass [18,19,20,21], but also reduces the intensity and modulus of deformation and seriously affects the permeability properties of rock mass, as shown in Figure 1b. The water in the fault produces the physical, chemical reaction with the rock mass, and the change of hydraulic stress will cause the change of stress distribution in rock mass [22]; meanwhile, the stress change causes a change in the rock pores [23,24,25,26,27], which in turn affects the groundwater flow and water pressure. In this way, the water in the fault and rock mass are mutually influenced. If there is a fault in the practical project, we need to consider the influence that mining pressure brings to fault activation, especially the inrush problems of fault, or it will cause property loss and casualties [21,28,29]. Fault is an important water inrush channel due to the crushed rocks in it. At present, the study on water inrush mechanism is mainly concentrated on either damage of floor strata or reactivation of fault [30,31,32,33,34,35,36]. They did not consider the mining advance direction on failure analysis of the surrounding rocks near faults. In particular, the stress variation and failure characteristics with the formation of water inrush channel adjacent to faults in floor strata are not completely understood.
This paper aims to analyze the stress variation and failure characteristics of the rock surrounding the fault by advancing in different directions. It focuses on the variation of normal stress and shear stress on the fault plane, as well as failure characteristics of the roof and floor by mechanical model and numerical simulation in the process of mining advancing. The influence that mining advance direction brings to fault activation is obtained, and a certain theoretical basis is provided to the design of a waterproof coal pillar. Finally, in-situ monitoring is conducted to verify the effectiveness of simulation results.

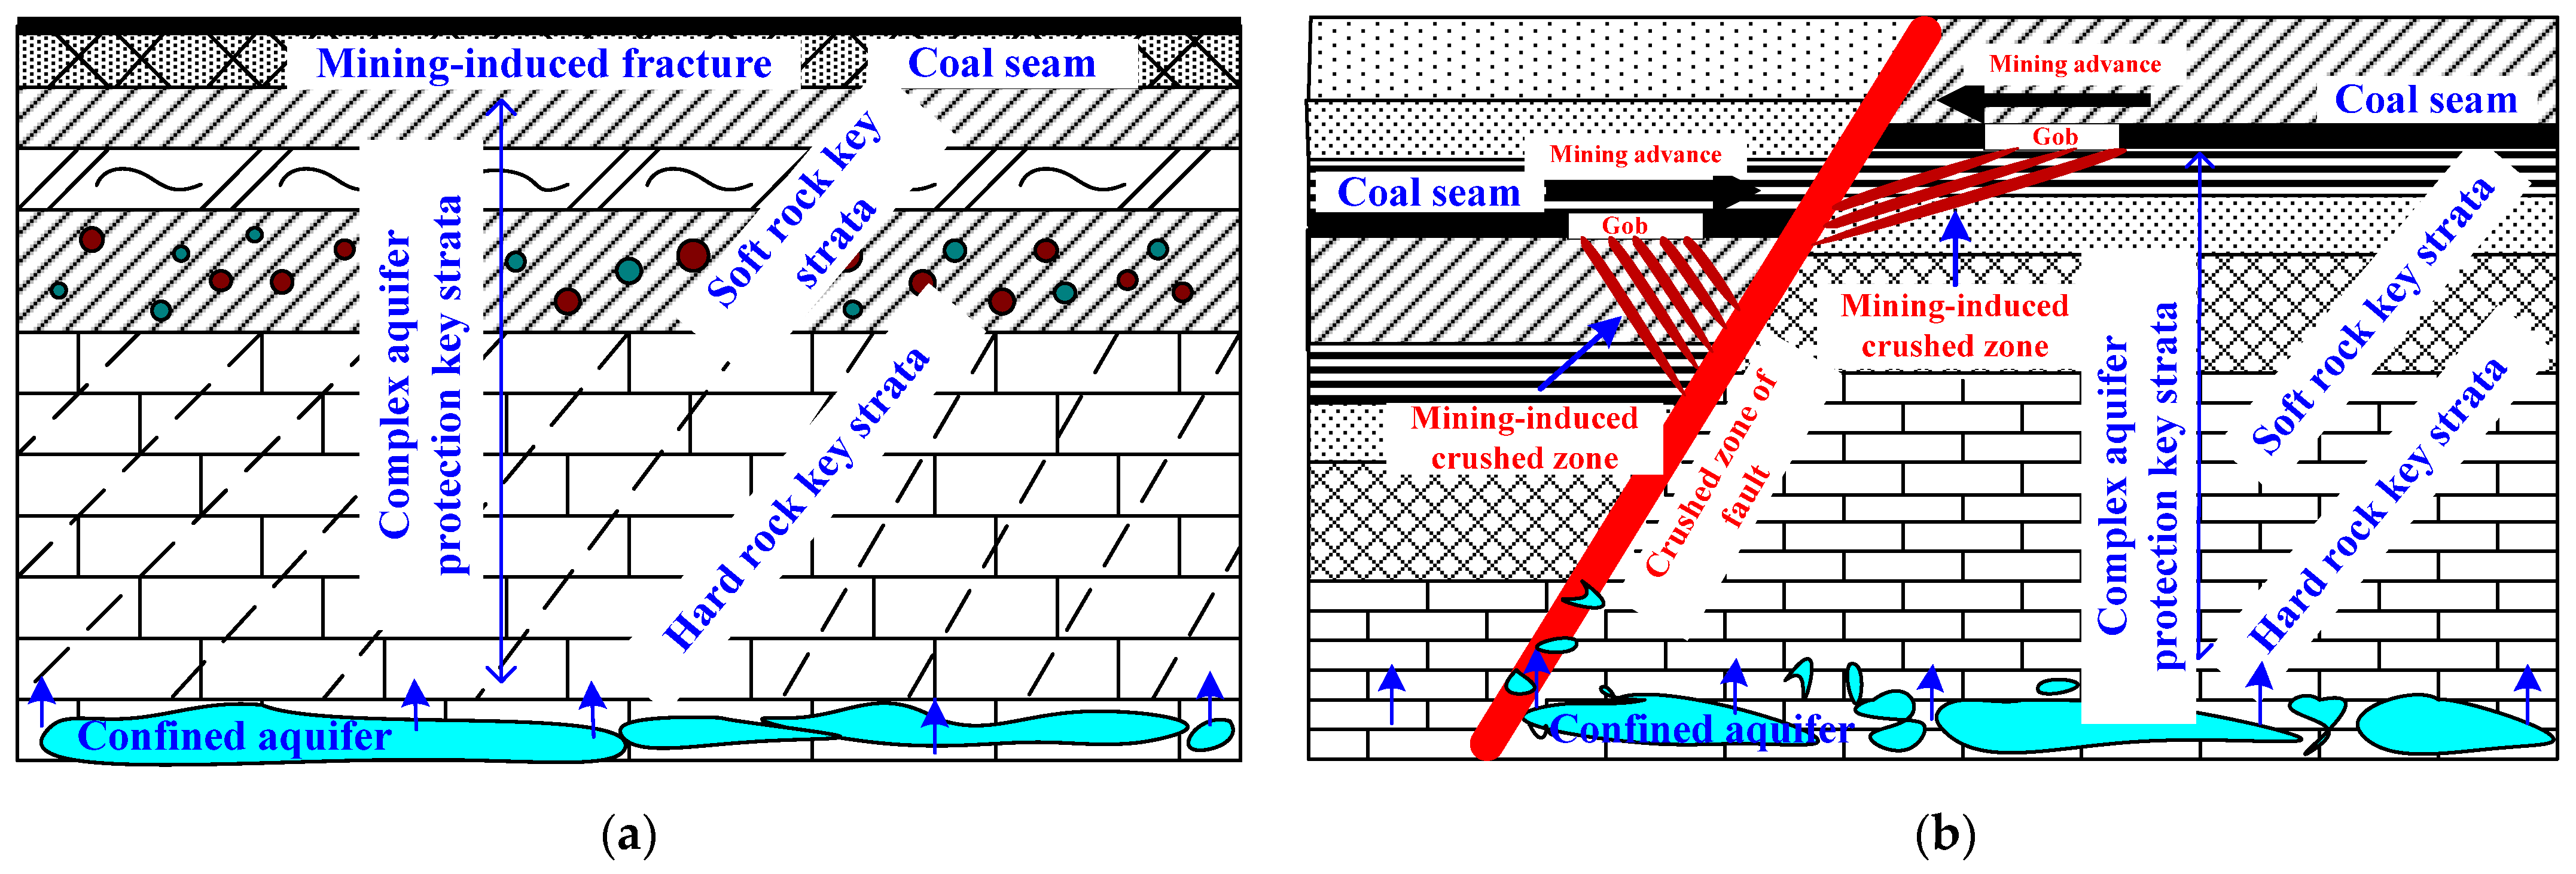
2. Mechanical Behavior of Mining Advancing Direction on Fault Activation

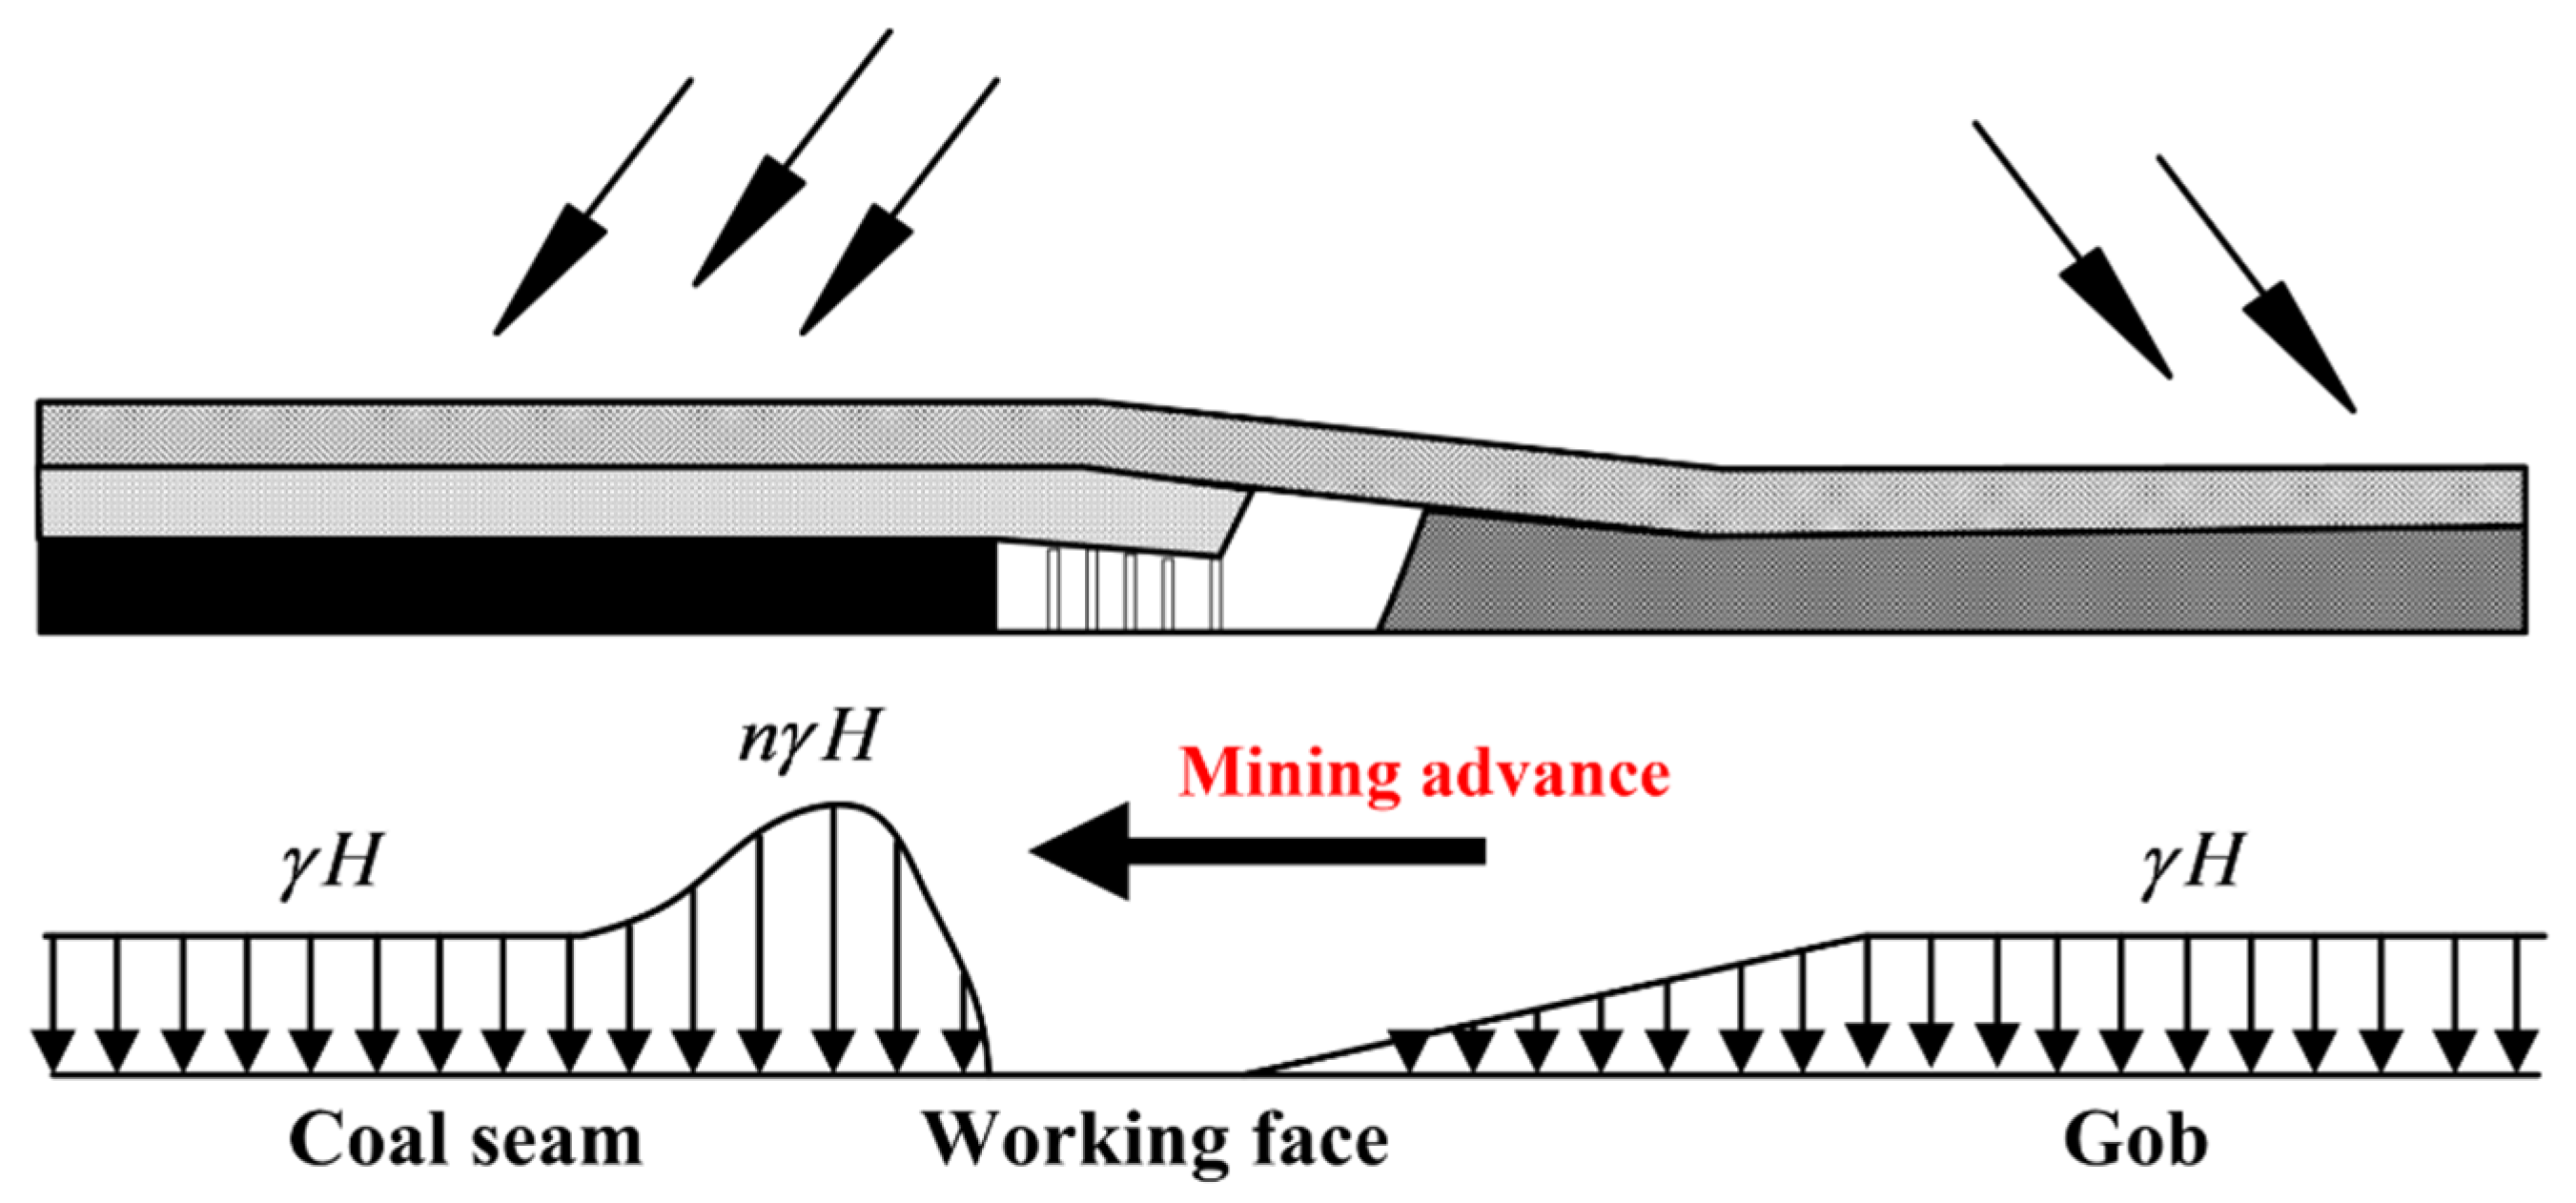
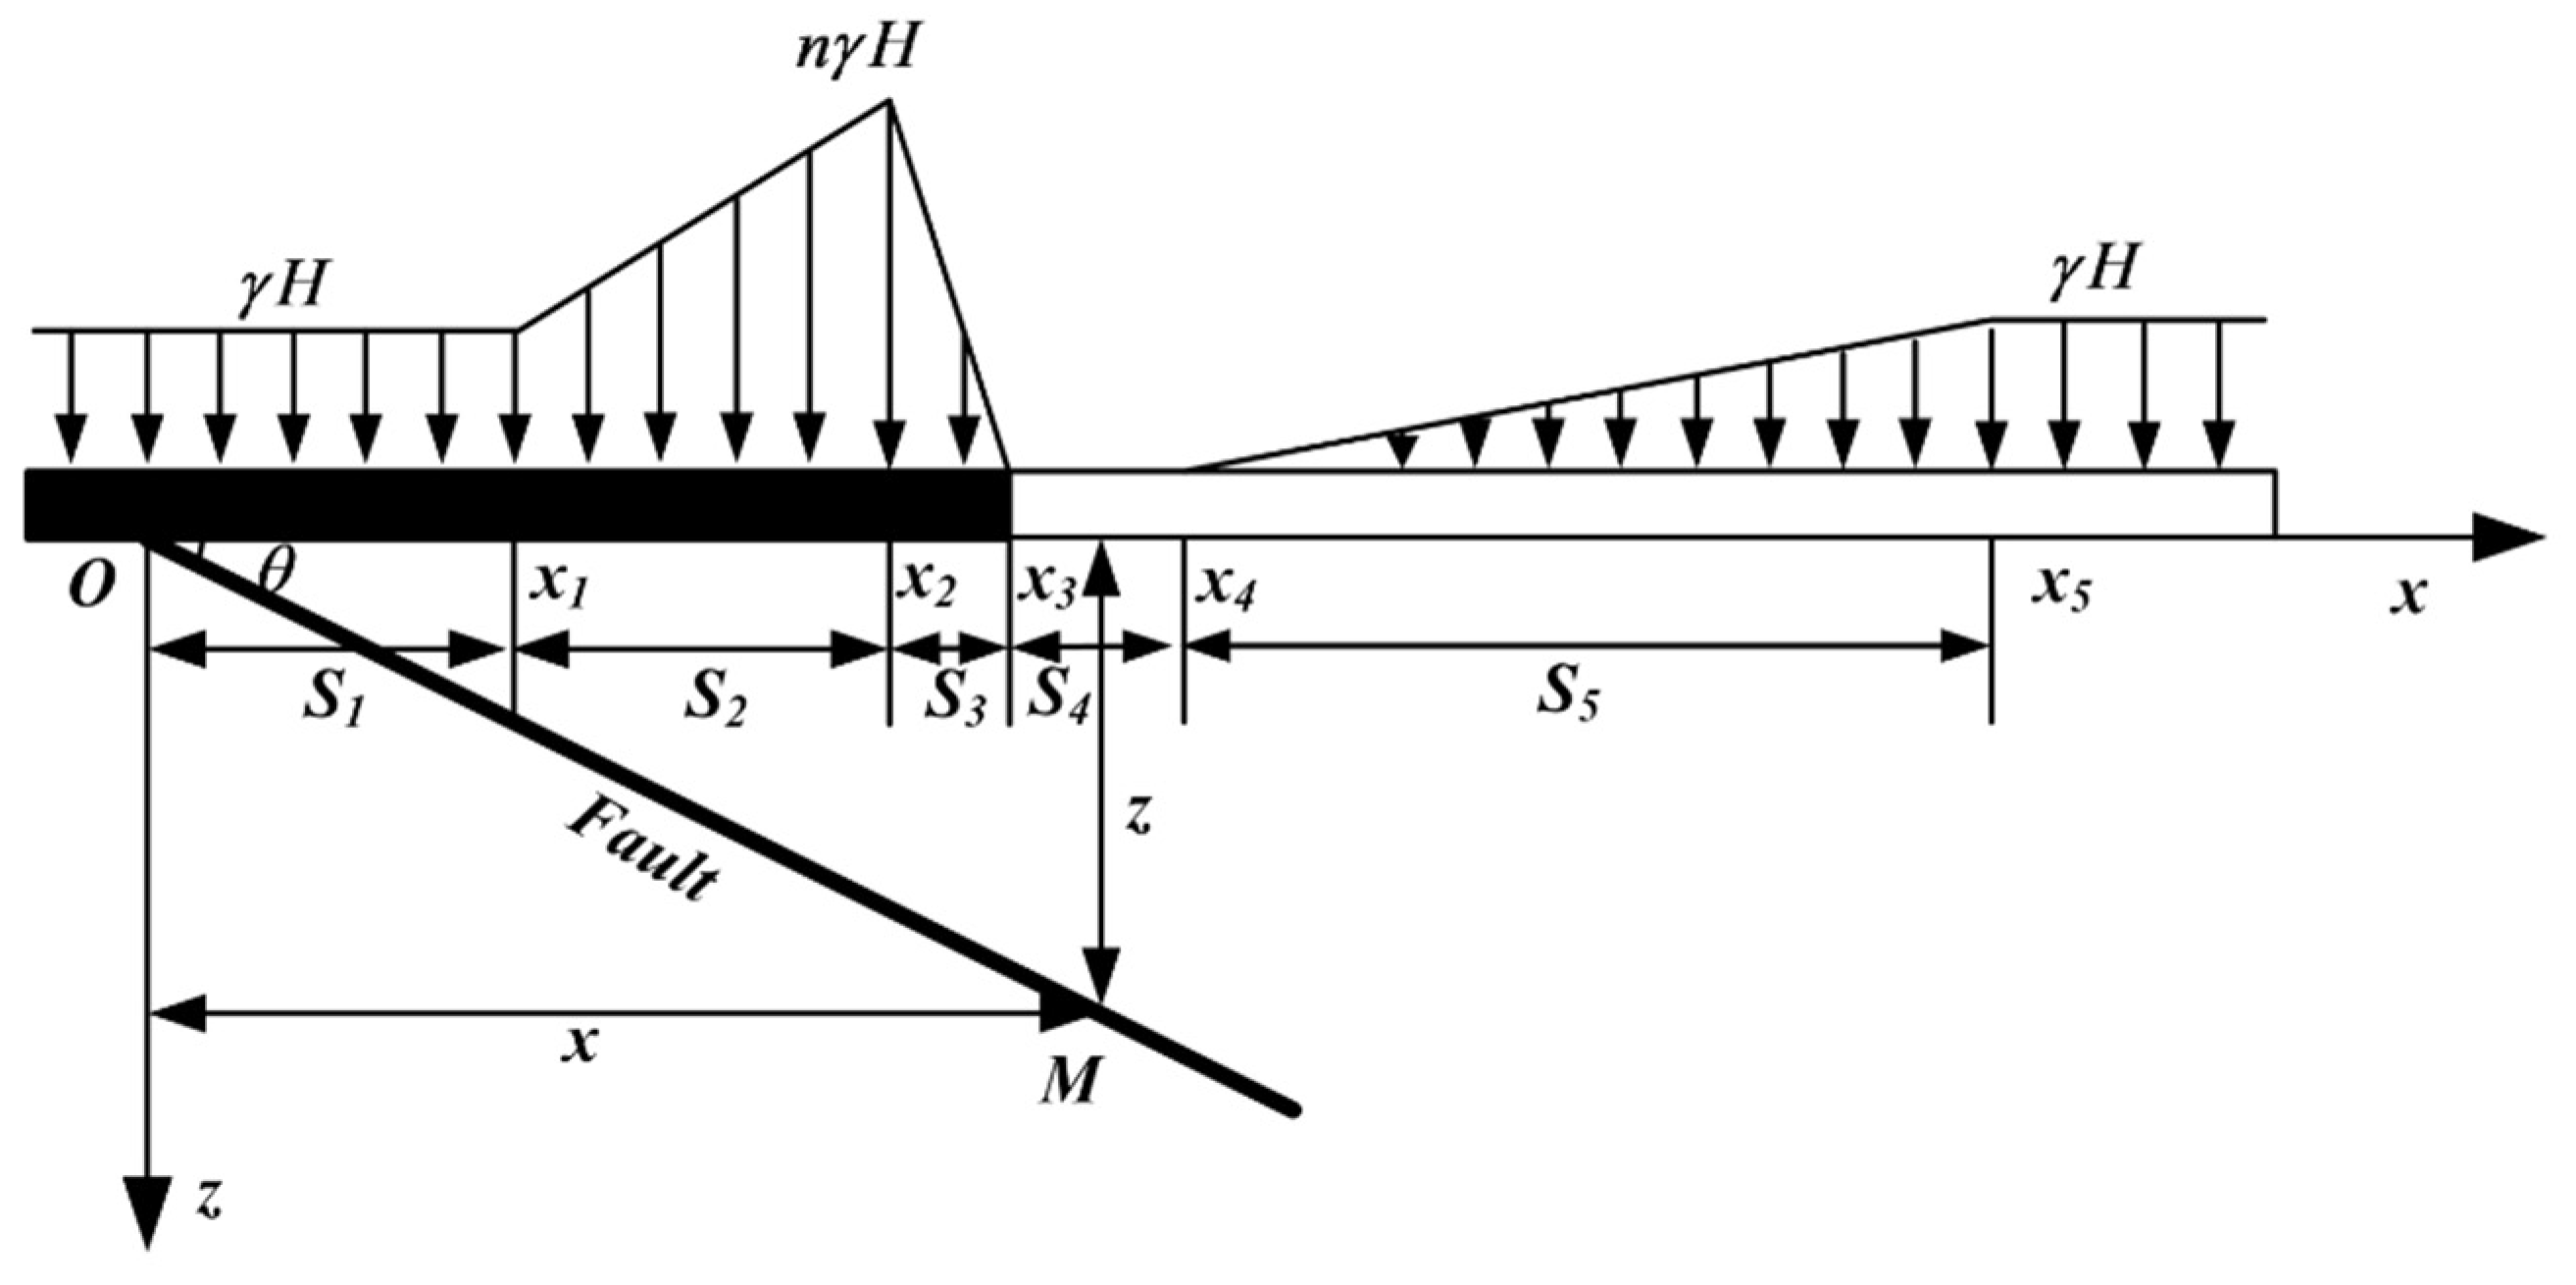
2.1. Mechanical Analysis of Fault Activation

As shown in Figure 2, before coal mining, the stress of the rock mass stays in the original equilibrium, while the rock stress will redistribute after mining. According to the theory of mining pressure control [37,38], in the mining advancing direction, the peak abutment pressure of coal floor nγH appeared in the working face within a certain distance to the coal wall. Because the floor of the gob is compacted by roof caving rocks, the abutment pressure gradually recovers to the original stress γH, where γ is the bulk density of the rock, H is the depth of the buried coal seam, and n is the stress concentration factor.
In order to study the influence that the mining advancing direction brings to fault activation, according to the above-mentioned abutment pressure distribution law of mining advance direction, we take the surrounding rock mass along the mining advancing direction of the working face in the central field as the research object in longwall mining. Here it can be treated as a plane strain problem. Assume that the floor rock mass is elastic; abutment pressure applied on the floor is simplified as a linear distribution load; the original rock stress as a uniform distribution load; the stress in stress-concentrated area as linear increase; the stress in stress-relaxed area as linear decrease; and the stress concentration factor ahead of the working face is n. Therefore, the mechanical model is established as Figure 3.
According to stress analysis of the boundary half plane applied by normal stress in elastic mechanics theory [33], the stress equations of σx, σz and τxz of any point on the fault are obtained as Equation (1).
{ σ x = 2 γ H π { x 1 z ( x ξ ) 2 d ξ [ z 2 + ( x ξ ) 2 ] 2 + x 1 x 2 [ ( n 1 ) ( ξ x 1 ) + S 2 ] z ( x ξ ) 2 d ξ S 2 [ z 2 + ( x ξ ) 2 ] 2 + x 2 x 3 n ( x 3 ξ ) z ( x ξ ) 2 d ξ S 3 [ z 2 + ( x ξ ) 2 ] 2 + x 4 x 5 ( ξ x 4 ) z ( x ξ ) 2 d ξ S 5 [ z 2 + ( x ξ ) 2 ] 2 + x 5 x + z ( x ξ ) 2 d ξ [ z 2 + ( x ξ ) 2 ] 2 } σ z = 2 γ H π { x 1 z 3 d ξ [ z 2 + ( x ξ ) 2 ] 2 + x 1 x 2 [ ( n 1 ) ( ξ x 1 ) + S 2 ] z 3 d ξ S 2 [ z 2 + ( x ξ ) 2 ] 2 + x 2 x 3 n ( x 3 ξ ) z 3 d ξ S 3 [ z 2 + ( x ξ ) 2 ] 2 + x 4 x 5 ( ξ x 4 ) z 3 d ξ S 5 [ z 2 + ( x ξ ) 2 ] 2 + x 5 x + z 3 d ξ [ z 2 + ( x ξ ) 2 ] 2 } τ x z = 2 γ H π { x 1 z 2 ( x ξ ) d ξ [ z 2 + ( x ξ ) 2 ] 2 + x 1 x 2 [ ( n 1 ) ( ξ x 1 ) + S 2 ] z 2 ( x ξ ) d ξ S 2 [ z 2 + ( x ξ ) 2 ] 2 + x 2 x 3 n ( x 3 ξ ) z 2 ( x ξ ) d ξ S 3 [ z 2 + ( x ξ ) 2 ] 2 + x 4 x 5 ( ξ x 4 ) z 2 ( x ξ ) d ξ S 5 [ z 2 + ( x ξ ) 2 ] 2 + x 5 x + z 2 ( x ξ ) d ξ [ z 2 + ( x ξ ) 2 ] 2 }
According to the stress equation on the oblique section in elastic mechanics, the normal stress and shear stress equations on the fault planes under the abutment pressure are obtained as Equation (2).
{ σ N = σ x sin 2 θ + σ z cos 2 θ + 2 τ x z sin θ cos θ τ N = sin θ cos θ ( σ z σ x ) + ( sin 2 θ cos 2 θ ) τ x z
Considering the Mohr–Coulomb criterion, the shear strength of fault plane is available:
τ f = c + σ N tan φ
and the condition of fault activation is:
τ N τ f
Combined with Equation (3), the mechanics criterion of fault activation after mining is obtained as:
τ N c + σ N tan φ
where c is the cohesive force of the rock, and φ is the internal friction angle of the rock.

2.2. Effect of Mining Advancing Direction to Fault Activation

Due to the difficult simplification of Equation (1) substituted into Equation (2), numerical analysis therefore is adopted to these equations. Considering the actual situation, S1 = 20 m, S2 = 25 m, S3 = 5 m, S4 = 10 m, S5 = 100 m, n = 2.5, H = 400 m, γ = 2.5 × 10⁴ N/m3, the distance between the working face to the fault is 50 m. When the mining advances from the hanging wall, then θ = 60°; when the working face advances from the foot wall, then θ = 120°. The normal stress and shear stress distribution can be obtained by Equation (2) when the distance between the working face to the fault is 50 m, as seen in Figure 4 and Figure 5.
It can be seen from Figure 4 and Figure 5 that when the working face is 50 m apart from the fault, the normal stress on a fault below the floor range of 0~40 m has the largest change, which brings the largest disturbance to fault; when the depth is more than 40 m, the normal stress on a fault keeps a certain value, the hanging wall advance stays around 6.5 MPa, and the foot wall advance stays around 2.0 MPa. The normal stress on the fault advancing from the hanging wall, which causes larger disturbance, is always greater than that from the foot wall. The variation range of shear stress distribution on a fault advancing from the hanging wall is larger than that from the foot wall, i.e., −0.35~0.36 MPa from the hanging wall, and −0.17~0.09 MPa from the foot wall, respectively. With the increase of depth, the shear stress appears to be stable from foot wall advance. Before the mining advances to a fault, hanging wall advance is easier to cause the fault activation, because there are dramatic changes of the shear stress distribution, large peak values, and wide ranges of influence on the fault.

3. Numerical Simulations

To understand the stress variation on faults and the distribution characteristics of floor and roof plastic failure near the fault, the simulation software of FLAC3D is applied in this study for further numerical work. FLAC3D is a finite difference numerical simulation software. There are twelve elastic and plastic constitutive models and five calculation modes built in the software, which can realize the coupling between different modes. In addition, the built-in FISH program language can obtain the coordinates, displacement, stress, strain and other parameters of nodes and units in the calculation process. It can well simulate geological materials’ mechanical behaviors, such as plastic flow or damage, when they reach the yield limit or strength limit. Besides, it can also analyze the gradual damage and instability, and track the gradual failure of materials. Therefore, this software has been widely used in the field of geotechnical engineering.

3.1. Engineering Background

Buliangou coal mine is located in the northeast of Zhungeer coalfield in Inner Mongolia, China. The development of a fault in the minefield brings a great challenge to mining safety. According to the preliminary exploration, a normal fault goes through the middle of the F6210 working face. The F6210 is buried at a depth of 398–405 m, and the thickness of the coal seam is about 4 m. The fault has a strike of N46°E, a dip of N51°W, a dip angle of 55–65°, a zone width of 2.2–3.5 m, and an average drop of 4.0 m. To reduce the risk of water inrush hazard, as well as improve the mining efficiency, the mining advanced from the hanging wall and foot wall of the fault, respectively, and advanced from far and near to the fault fracture zone.

3.2. Numerical Calculation Model

Through the proper and effective simplification, the geometric model is built with the size of 300 m × 200 m × 200 m (length × width × height), with 98,400 divided units and 105,493 nodes. The coal seam is buried at a depth of 400 m and with a thickness of 4 m. A fault with a drop of 4 m, an inclination angle of 60°, and a fault zone width of 3 m is selected in this study. There is horizontal displacement constraint on the sides of the model, vertical displacement constraints on the bottom, and the upper surface is treated as free surface. Overlying rock applies about 10 MPa of uniform loading on the upper surface. Mining advances from far and near, and gradually advances to the fault with an advancing step of 10 m. At the advancing interval, artificial filling is made to simulate the mining caving for the last advancing step. A numerical calculation model is established as Figure 6, the meshing model as Figure 7, and the rock physical and mechanical parameters are shown in Table 1.

3.3. Results and Analysis of Numerical Simulation

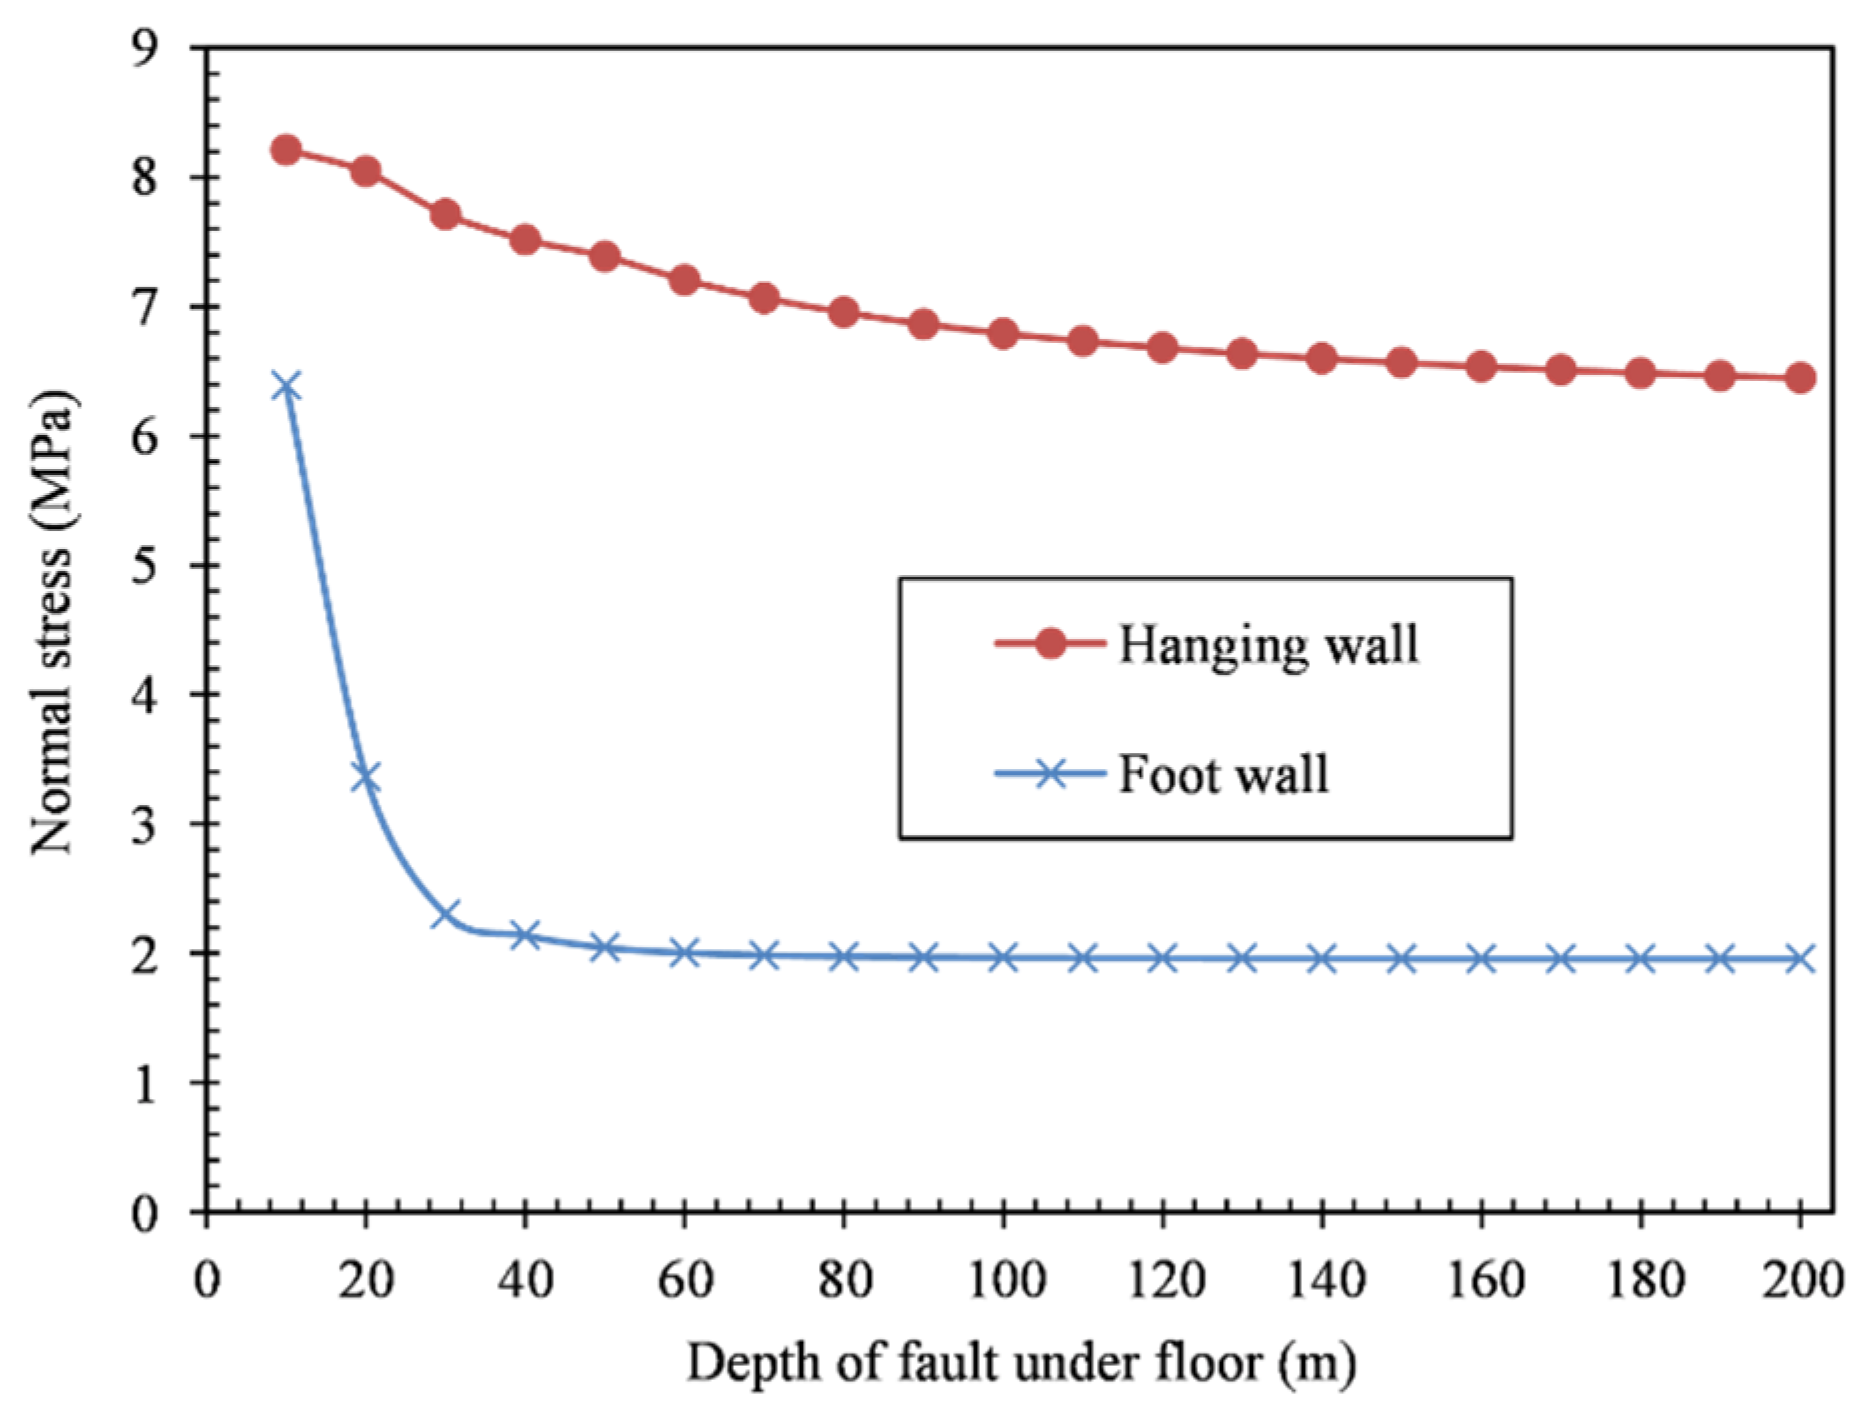
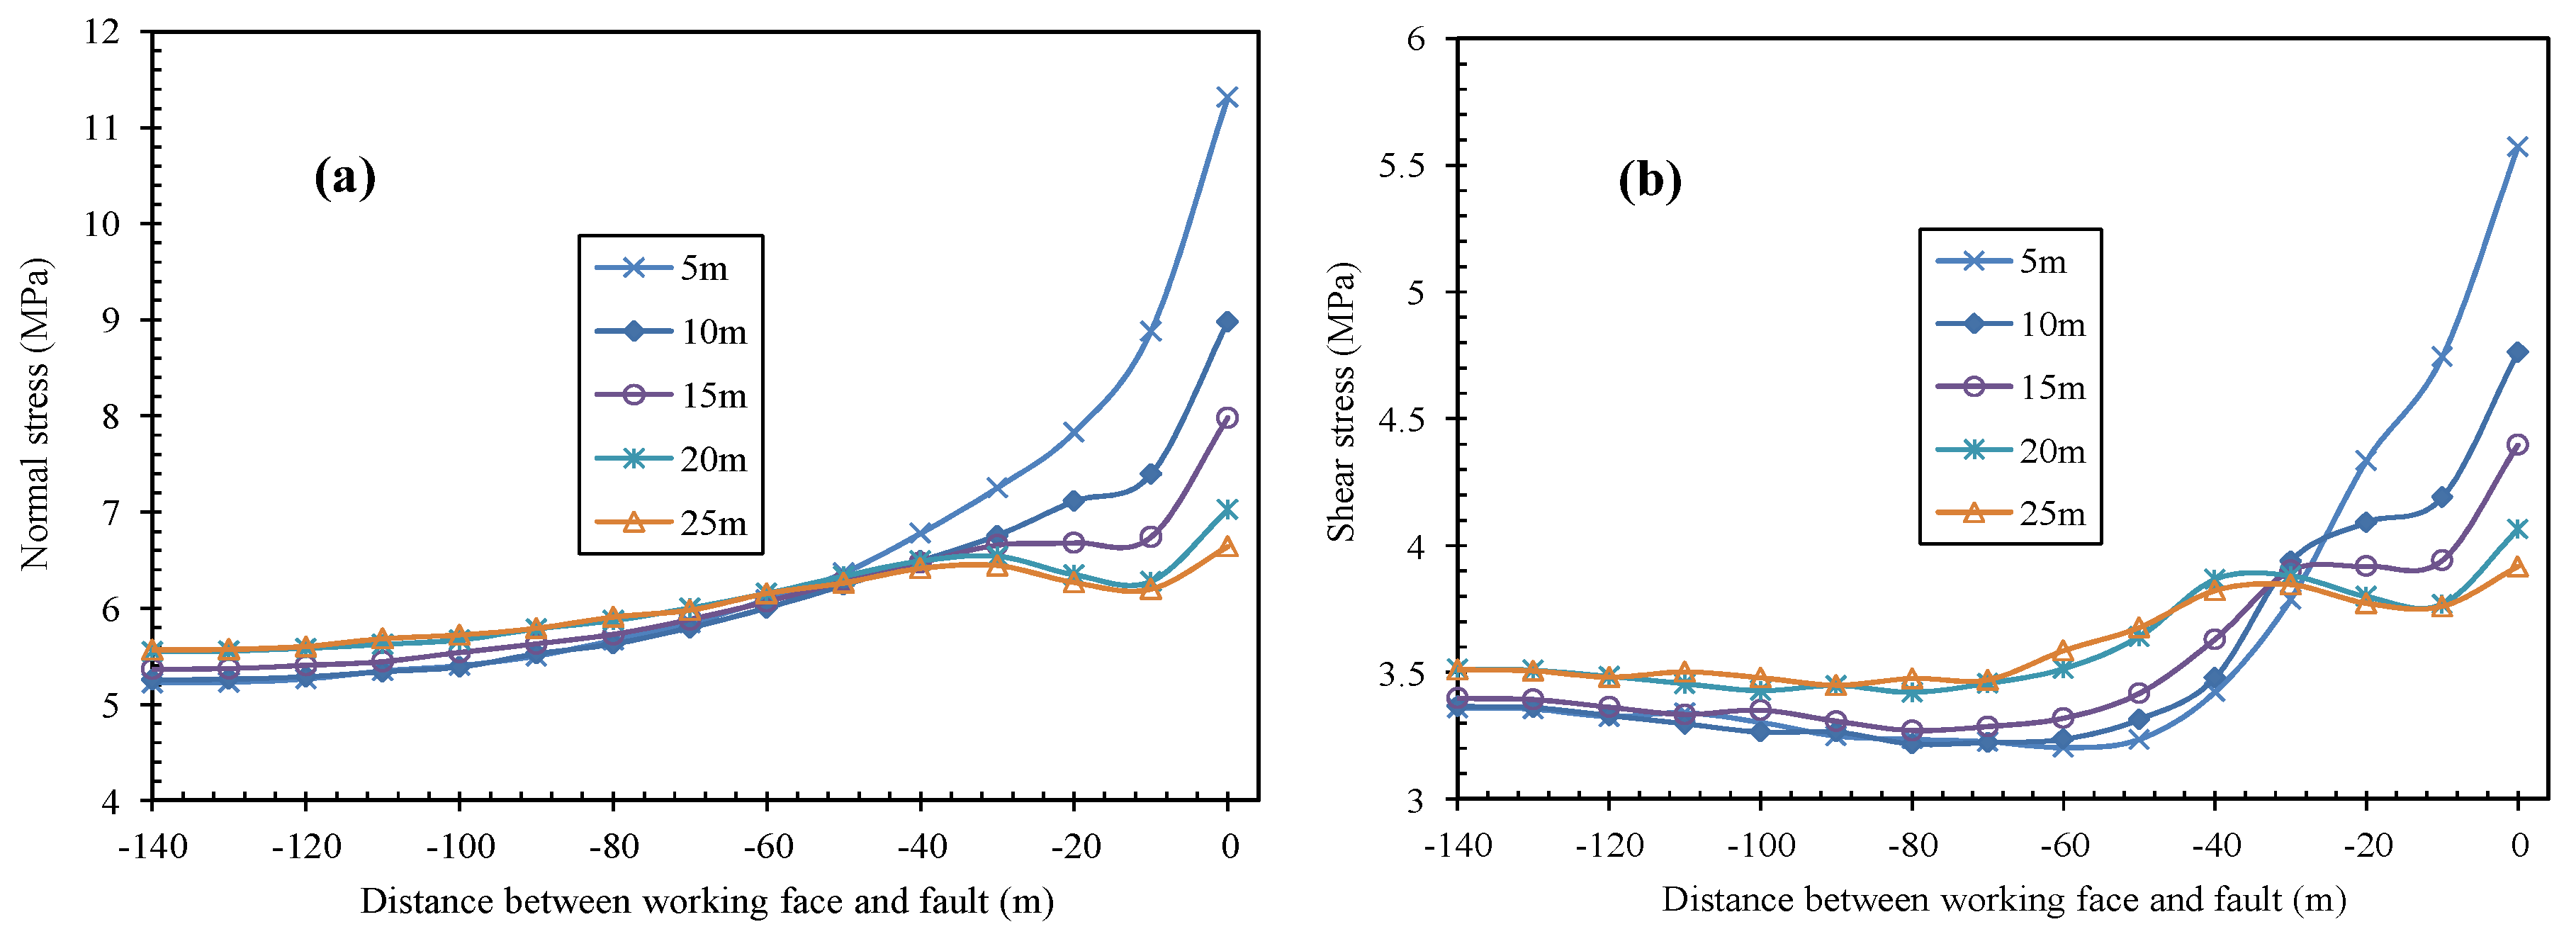
3.3.1. Stress Distribution Characteristics on the Fault

The monitoring points are put in the fault zone that lies about 5 m below the coal seam, 10 m, 15 m, 20 m and 25 m, respectively, in this simulation displayed as the white dots in Figure 7, which are listed as A, B, C, D and E, respectively. As the mining working face approaches to the fault, the normal stress and shear stress change curves of monitoring points are shown as Figure 8 and Figure 9, respectively.
As is shown in Figure 8 and Figure 9:
When mining advances from the hanging wall, the normal stress and shear stress within the fault zone under the floor first increases and then decreases. When the working face is more than 10 m apart to fault, the normal stress within the fault zone that is 5 m under the floor always increases, from 5.2 MPa to 10.7 MPa, an increase of 5.5 MPa; as the working face advances to the fault continuously, the normal stress starts to decrease, and eventually reduces to 3.7 MPa. The change law of shear stress in the fault zone is similar to that of normal stress. The shear stress in the fault zone that is 5 m below the floor increases from 3.4 MPa to 5.4 MPa, an increase of 2.0 MPa, after which the shear stress decreases. The increased range of the shear stress is less than that of normal stress, so the working face advance brings a larger disturbance to normal stress in the fault zone. The normal stress and shear stress on the fault that is 25 m below the floor starts to decrease when it is 50 m away from the working face, which indicates that the fault under the floor and far away from the mining layer is disturbed first.
When mining advances from the foot wall, the normal stress and shear stress within the fault zone under the floor increases gradually. The normal stress within the fault zone that is 5 m under the floor increases from 5.2 MPa to 11.3 MPa, while the shear stress increases from 3.4 MPa to 5.6 MPa. When the mining working face is 0~20 m apart from the fault, there is the largest increase and the largest disturbance to the fault. Comparing the stress change of 5 m and 25 m below the floor within the fault zone, it can be seen that the fault under the floor and closest to the mining layer is disturbed first when the working face advances. Similarly, with the mining advance from the hanging wall, the change range of shear stress is less than that of normal stress within the fault zone.
Comparing the working face advance from the hanging wall and the foot wall, we can find that there is an obvious difference in stress change within the fault zone. When mining advances from the hanging wall, the stress first increases, after which it decreases; the instantaneous release of stress tends to cause the fault activation. When the working face advances from the foot wall, the fault zone stays in the compaction state where the hanging wall and foot wall are squeezed together, which is unfavorable for water inrush.

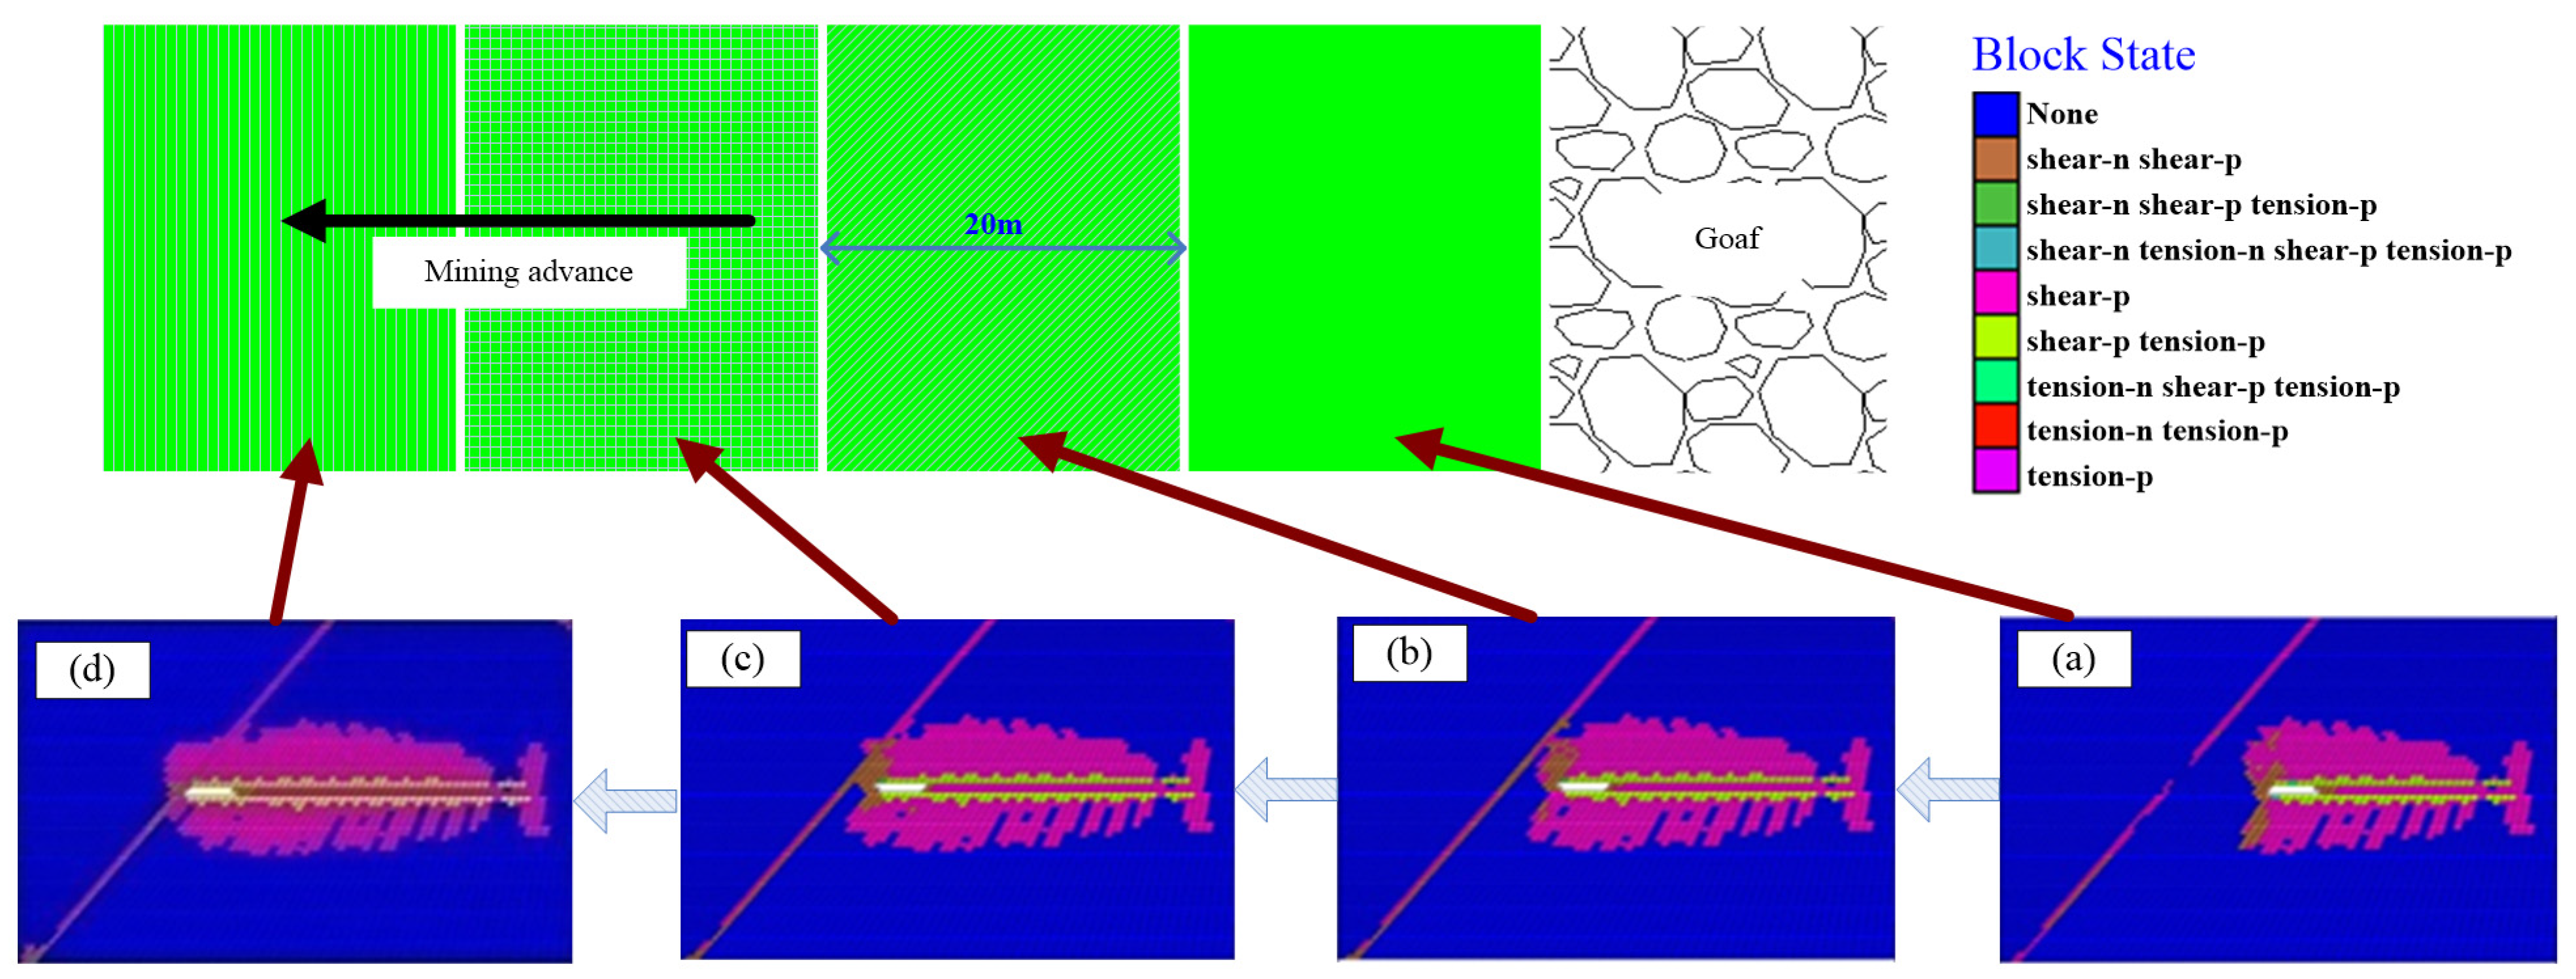
3.3.2. Plastic Failure Characteristics of Roof and Floor

Affected by mining, plastic failure can occur in the surrounding rock of the working face. When the plastic failure zone is linked with the plastic zone near the fault, there is a hidden water inrush in the water-conductive fault. Figure 10 and Figure 11, respectively, show the plastic failure distribution zone that occurs when the working face advances from the hanging wall and the foot wall.
As is shown in Figure 10 and Figure 11:
When mining advances in the initial stage, the plastic zone that is caused by mining is relatively small and far from the fault; with the advance of the working face, the distance between the plastic failure zone and the fault becomes small. As for the hanging wall, when the working face is 60 m apart from the fault, the plastic failure zone caused by mining will be linked with the plastic zone near the fault; as for the foot wall, when the working face is 40 m away from the fault, the plastic failure zone caused by mining will be linked to the plastic zone near the fault. If the fault is conducted with an aquifer, a water-conductive canal is easily formed, which will lead to water inrush. Therefore, a waterproof coal pillar should be reserved. In this simulation study, the size of the waterproof coal pillar for the hanging wall is no less than 40 m, and for the foot wall it is no less than 20 m.
When mining advances from the hanging wall, the plastic failure zone caused by the floor is linked with the plastic zone near the fault first; on the other hand, when mining advances from the foot wall, the plastic failure zone caused by the roof is linked first. Therefore, when the working face approaches to the fault, plastic failure in the floor is largely affected by the hanging wall advance, and plastic failure in the roof is largely affected by the foot wall advance.

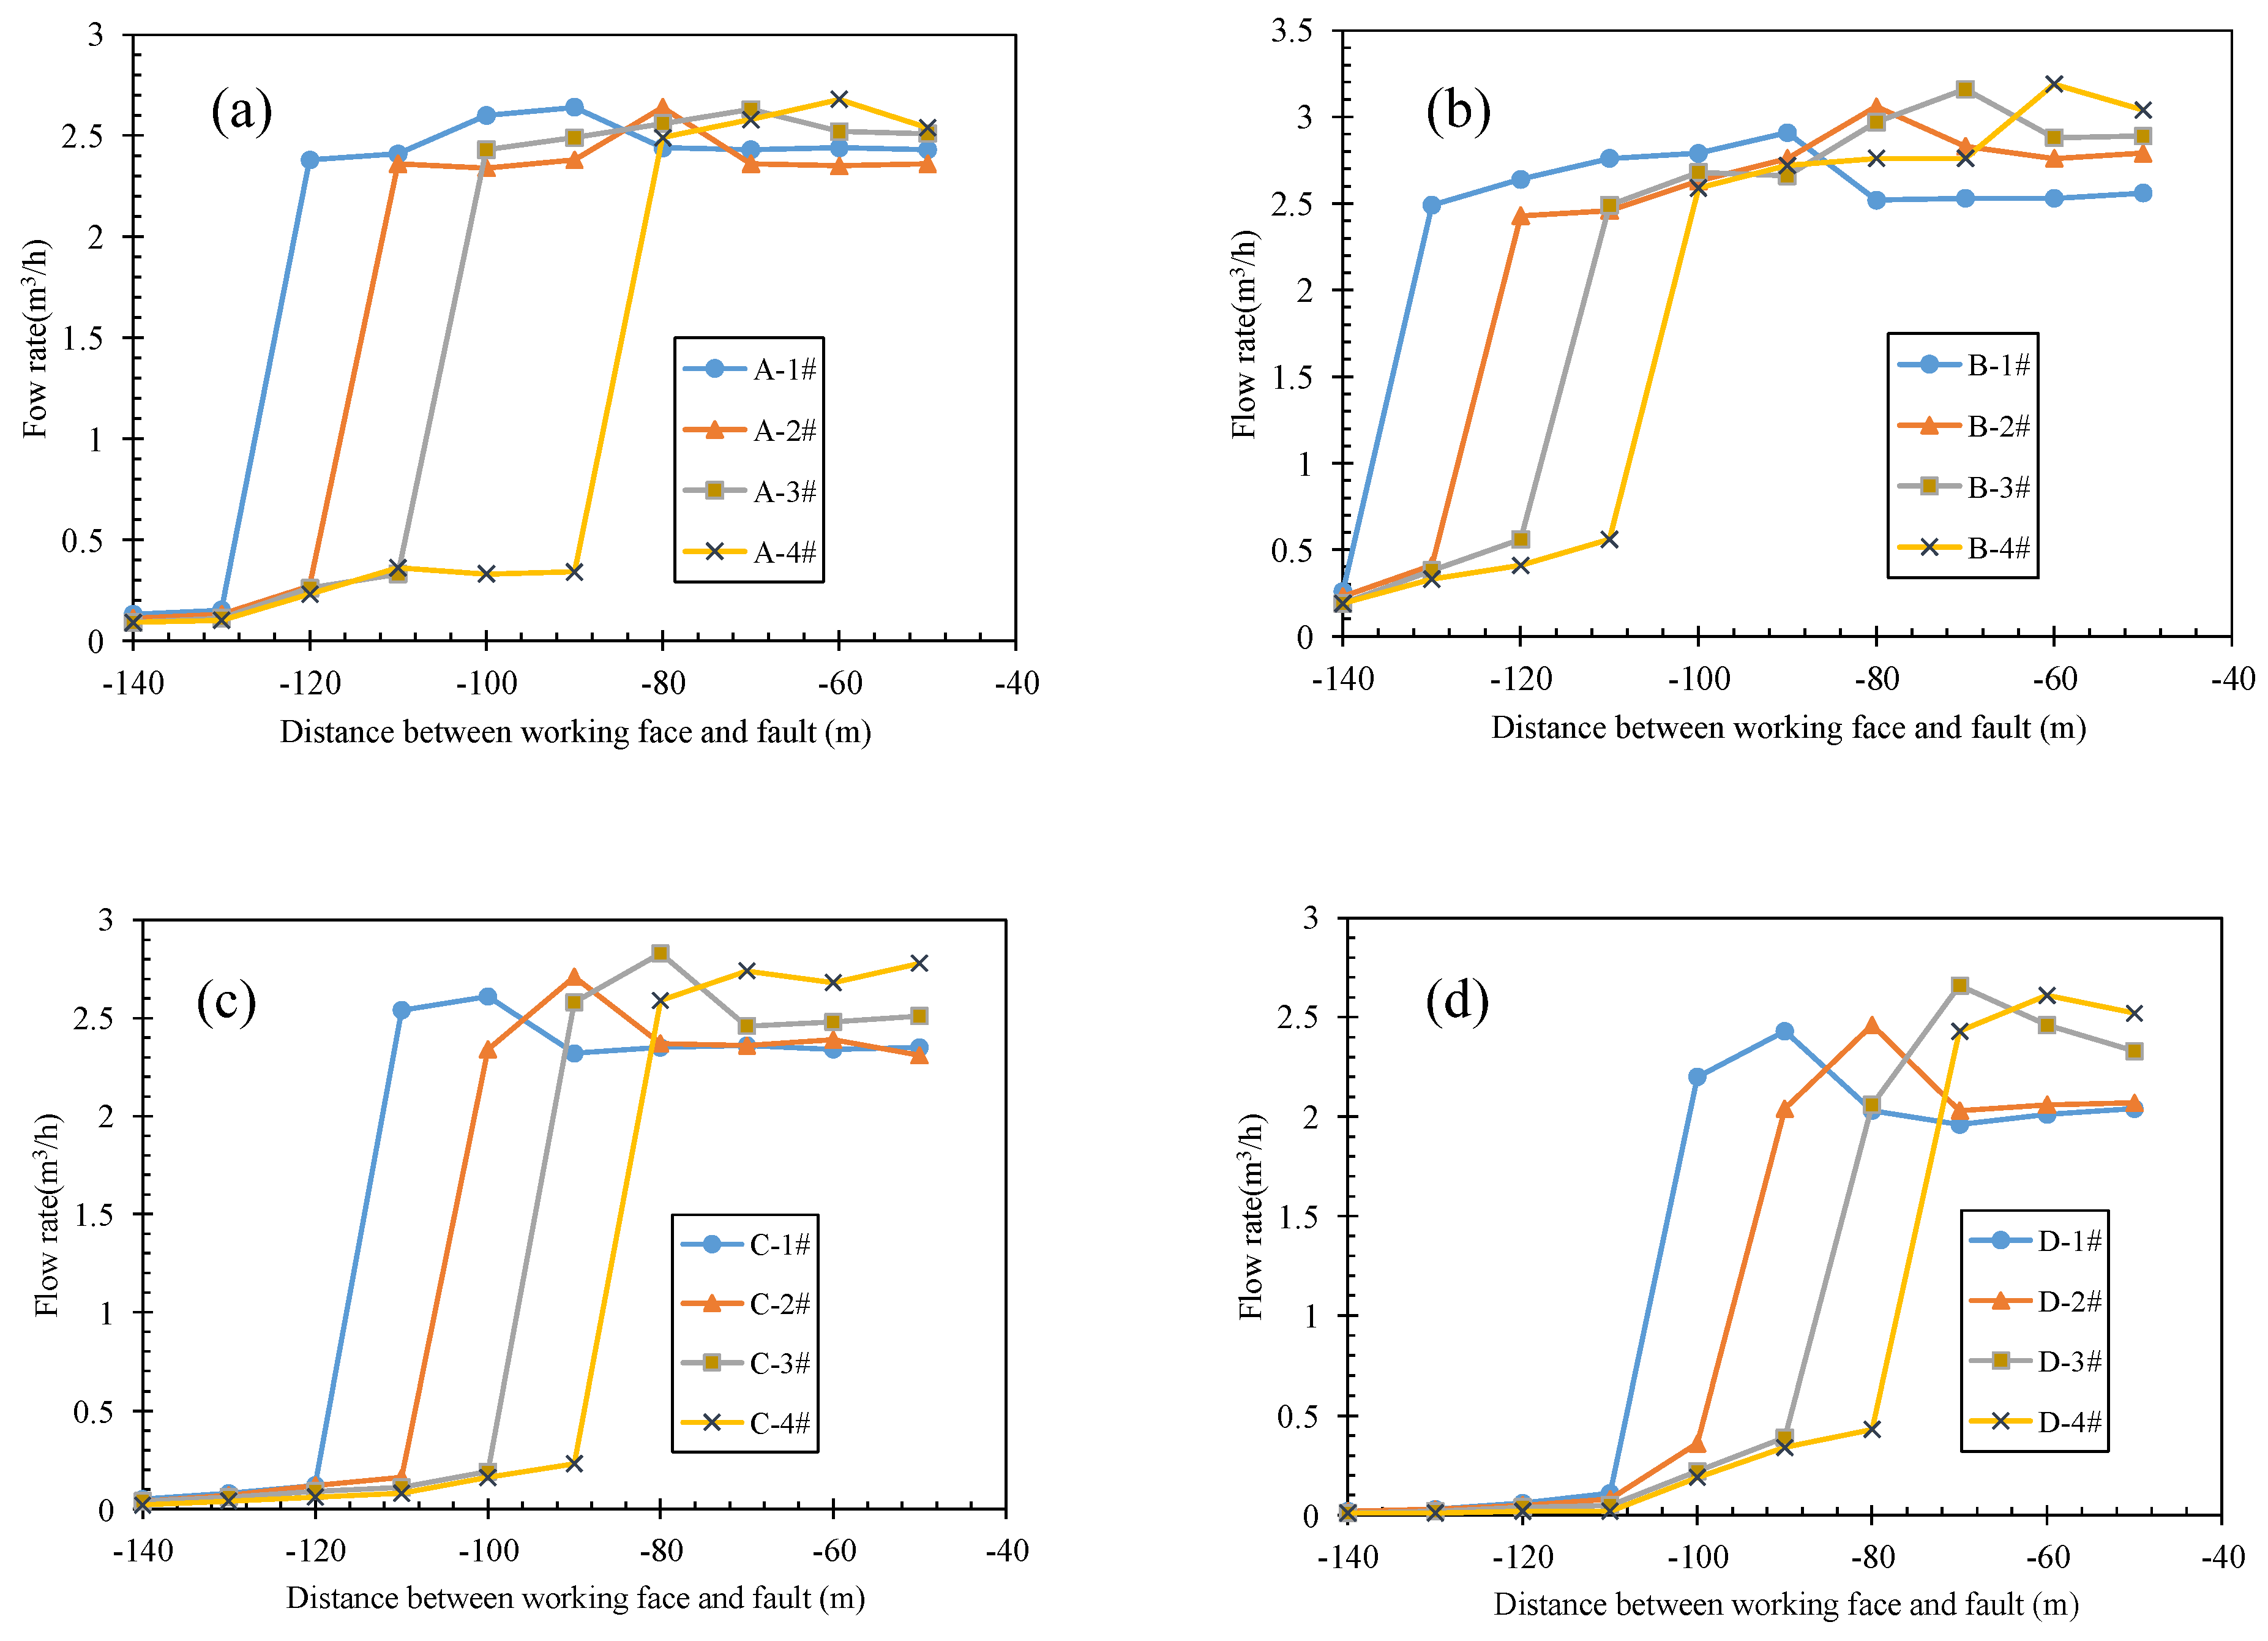
3.4. Verification by In-Situ Monitoring

To verify the validity of simulation results, the water injection leak detection method [39] is designed to observe the development of the plastic zone during the mining advancement. In this method, a higher flow rate of leakage means more severe plastic damage to the borehole, and the rapid increase in flow rate represents the connection of fractures near the borehole. As shown in Figure 12, Points A, B, C and D are set to monitor the plastic zone development in both roof and floor of the hanging wall and foot wall 60 m apart from the fault. In each monitoring point, four boreholes for different minoring depths were arranged, numbered 1#, 2#, 3# and 4#, respectively. The horizontal distance between the boreholes was 2 m, and the vertical distance was 5 m.
As is shown in Figure 13, with the advancement of the working face in the hanging wall, the size of the plastic zone increases gradually. As shown in Figure 13a, when the working face is 120 m apart from the fault, the flow rate of the A-1# borehole increases to 2.38 m3/h, while the data in A-2# stays at a low value, which means the height of the plastic zone is 10–15 m. When the working face is 70 m apart from the fault, the height of the plastic zone is more than 25 m. Similarly, as shown in Figure 13b, the flow rate of the B-1# borehole increases to 2.49 m3/h when the working face is 130 m apart from the fault, which proves that the plastic zone depth is 10–15 m. When the working face is 100 m apart from the fault, the plastic zone depth is more than 25 m. By comparing Figure 13a,b, the plasticas zone height in the floor is larger than the plastic zone depth in the roof at the same advancing distance; that is, the advance in the hanging wall has a more significant influence on the floor. This monitoring result is consistent with that of simulation.
As the working face advances in the foot wall, the size of the plastic zone in the roof and floor also increases. As shown in Figure 13c, when the working face is 110 m apart from the fault, the flow rate of the C-1# borehole increases to 1.18 m3/h, which indicates that the height of the plastic zone in the roof is 10–15 m. When the working face is 80 m apart from the fault, the height of the plastic zone is more than 25 m. Similarly, as shown in Figure 13d, the plastic zone depth is 10–15 m when the working face advances 100 m apart from the fault. When the working face is 70 m apart from the fault, the depth of the plastic zone in the roof reaches 25 m. In the comparison of Figure 13c,d, the advance from the foot wall had a greater impact on the roof, which corresponds with the simulation results.
Comparing Figure 13a,c, when the distance between the working face and fault is −100 m, the height of the plastic zone in the hanging wall is 20–25 m, while that in the foot wall is 15–20 m. In the comparison of Figure 13b,d, when the working face advances to 100 m away from the fault, the depth of the plastic zone in the hanging wall (more than 25 m) is much larger than that in the foot wall (5–10 m). It is concluded that, at the same advancing distance, the height and depth of the plastic zone in the hanging wall is larger than that in the foot wall, which is also in line with the simulation results.
To sum up, the in-situ monitoring results are in good agreement with the simulation results, which verifies the validity of the numerical simulation.

4. Conclusions

To analyze the effect of mining advancing direction of the working face on fault activation, a mechanical model of fault activation is built, and FLAC3D numerical software is used to simulate the stress variation on the surface of fault under two different mining advancing directions, and the distribution characteristics of a plastic failure zone of the roof and floor near the fault are obtained. According to the mechanical behavior analysis, when the working face advances from the hanging wall, the normal stress has a large increase in the fault zone, and the shear stress distribution changes drastically with a large peak. Advancing from the foot wall more easily causes fault activation. Based on the numerical results, as the working face gets close to the fault from the hanging wall, the normal stress and shear stress increase first and then decrease, the instantaneous release of stress easily increases the risk of fault activation; from the foot wall, the normal stress and shear stress always increase, then the hanging wall and foot wall are squeezed together, which is unfavorable for water inrush in the fault zone. When the working face advances from the hanging wall, the floor is largely affected, while the roof is largely affected by the foot wall advance. In this simulation study, the size of the waterproof coal pillar for the hanging wall is no less than 40 m, and for the foot wall no less than 20 m. The size of the waterproof coal pillar for the hanging wall should be larger than that of the foot wall. The in-situ monitoring results in Buliangou coal mine show good consistency with the simulation results.

Author Contributions

C.L. conceived and designed the numerical model; Z.X. performed the numerical simulation; C.L. and Z.X. analyzed the data and wrote the paper. All authors have read and agreed to the published version of the manuscript.

Funding

This work was supported by the National Natural Science Foundation of China (51874277).

Institutional Review Board Statement

Not applicable.

Informed Consent Statement

Not applicable.

Data Availability Statement

Not applicable.

Acknowledgments

The authors would like to thank the numerical assistance from China University of Mining and Technology.

Conflicts of Interest

The authors declare no conflict of interest.

References

  1. Wang, J.A.; Park, H.D. Coal mining above a confined aquifer. Int. J. Rock Mech. Min. Sci. 2003, 40, 537–551. [Google Scholar] [CrossRef]
  2. Ma, D.; Duan, H.; Zhang, J. Solid grain migration on hydraulic properties of fault rocks in underground mining tunnel: Radial seepage experiments and verification of permeability prediction. Tunn. Undergr. Sp. Tech. 2022, 125, 104525. [Google Scholar] [CrossRef]
  3. Zhou, Q.; Herrera-Herbert, J.; Hidalgo, A. Predicting the risk of fault-induced water inrush using the adaptive neuro-fuzzy inference system. Minerals 2017, 7, 55. [Google Scholar] [CrossRef]
  4. Zhang, R.; Jiang, Z.; Zhou, H.; Yang, C.; Xiao, S. Groundwater outbursts from faults above a confined aquifer in the coal mining. Nat. Hazards 2013, 71, 1861–1872. [Google Scholar] [CrossRef]
  5. Wu, Q.; Wang, M.; Wu, X. Investigations of groundwater bursting into coal mine seam floors from fault zones. Int. J. Rock Mech. Min. Sci. 2004, 41, 557–571. [Google Scholar] [CrossRef]
  6. Li, L.; Yang, T.; Liang, Z.; Zhu, W.; Tang, C. Numerical investigation of groundwater outbursts near faults in underground coal mines. Int. J. Coal Geol. 2011, 85, 276–288. [Google Scholar] [CrossRef]
  7. Huang, Z. Analytical and experimental study of water seepage propagation behavior in the fault. Acta Geodyn. Geomater. 2014, 11, 361–370. [Google Scholar] [CrossRef] [Green Version]
  8. Ma, D.; Duan, H.; Zhang, J.; Feng, X.; Huang, Y. Experimental investigation of creep-erosion coupling mechanical properties of water inrush hazards in fault fracture rock masses. Chin. J. Rock Mech. Eng. 2021, 40, 1751–1763. [Google Scholar]
  9. Zhang, J.C.; Shen, B.H. Coal mining under aquifers in China: A case study. Int. J. Rock Mech. Min. Sci. 2004, 41, 629–639. [Google Scholar] [CrossRef]
  10. Yang, T.H.; Tham, L.G.; Tang, C.A.; Liang, Z.Z.; Tsui, Y. Influence of heterogeneity of mechanical properties on hydraulic fracturing in permeable rocks. Rock Mech. Rock Eng. 2004, 37, 251–275. [Google Scholar] [CrossRef]
  11. Yang, T.H.; Liu, J.; Zhu, W.C.; Elsworth, D.; Tham, L.G.; Tang, C.A. A coupled flow-stress-damage model for groundwater outbursts from an underlying aquifer into mining excavations. Int. J. Rock Mech. Min. Sci. 2007, 44, 87–97. [Google Scholar] [CrossRef]
  12. Donnelly, L.J. A review of coal mining induced fault reactivation in Great Britain. Q. J. Eng. Geol. Hydrogeol. 2006, 39, 5–50. [Google Scholar] [CrossRef]
  13. Ma, D.; Duan, H.; Liu, W.; Ma, X.; Tao, M. Water–Sediment Two-Phase Flow Inrush Hazard in Rock Fractures of Overburden Strata During Coal Mining. Mine Water Environ. 2020, 39, 308–319. [Google Scholar] [CrossRef]
  14. Liang, D.-X.; Jiang, Z.-Q.; Zhu, S.-Y.; Sun, Q.; Qian, Z.-W. Experimental research on water inrush in tunnel construction. Nat. Hazards 2015, 81, 467–480. [Google Scholar] [CrossRef]
  15. Dou, L.; Yang, K.; Chi, X. Fracture behavior and acoustic emission characteristics of sandstone samples with inclined precracks. Int. J. Coal Sci. Technol. 2021, 8, 77–87. [Google Scholar] [CrossRef]
  16. Huang, Z.; Jiang, Z.; Tang, X.; Wu, X.; Guo, D.; Yue, Z. In situ Measurement of Hydraulic Properties of the Fractured Zone of Coal Mines. Rock Mech. Rock Eng. 2015, 49, 603–609. [Google Scholar] [CrossRef]
  17. Huang, Z.; Jiang, Z.; Fu, J.; Cao, D. Experimental measurement on the hydraulic conductivity of deep low-permeability rock. Arab. J. Geosci. 2014, 8, 5389–5396. [Google Scholar] [CrossRef]
  18. Ma, D.; Zhang, J.; Duan, H.; Huang, Y.; Li, M.; Sun, Q.; Zhou, N. Reutilization of gangue wastes in underground backfilling mining: Overburden aquifer protection. Chemosphere 2021, 264, 128400. [Google Scholar] [CrossRef]
  19. Liang, D.-X.; Jiang, Z.-Q.; Guan, Y.-Z. Field Research: Measuring Water Pressure Resistance in a Fault-Induced Fracture Zone. Mine Water Environ. 2014, 34, 320–328. [Google Scholar] [CrossRef]
  20. Zhang, S.; Lu, L.; Wang, Z.; Wang, S. A physical model study of surrounding rock failure near a fault under the influence of footwall coal mining. Int. J. Coal Sci. Technol. 2021, 8, 626–640. [Google Scholar] [CrossRef]
  21. Islam, M.R.; Shinjo, R. Mining-induced fault reactivation associated with the main conveyor belt roadway and safety of the Barapukuria Coal Mine in Bangladesh: Constraints from BEM simulations. Int. J. Coal Geol. 2009, 79, 115–130. [Google Scholar] [CrossRef]
  22. Ma, D.; Kong, S.; Li, Z.; Zhang, Q.; Wang, Z.; Zhou, Z. Effect of wetting-drying cycle on hydraulic and mechanical properties of cemented paste backfill of the recycled solid wastes. Chemosphere 2021, 282, 131163. [Google Scholar] [CrossRef] [PubMed]
  23. Si, G.; Cai, W.; Wang, S.; Li, X. Prediction of Relatively High-Energy Seismic Events Using Spatial–Temporal Parametrisation of Mining-Induced Seismicity. Rock Mech. Rock Eng. 2020, 53, 5111–5132. [Google Scholar] [CrossRef]
  24. Ma, D.; Wang, J.; Cai, X.; Ma, X.; Zhang, J.; Zhou, Z.; Tao, M. Effects of height/diameter ratio on failure and damage properties of granite under coupled bending and splitting deformation. Eng. Fract. Mech. 2019, 220, 106640. [Google Scholar] [CrossRef]
  25. Xue, D.; Zhou, J.; Liu, Y.; Gao, L. On the excavation-induced stress drop in damaged coal considering a coupled yield and failure criterion. Int. J. Coal Sci. Technol. 2020, 7, 58–67. [Google Scholar] [CrossRef] [Green Version]
  26. Wang, S.; Li, X.; Yao, J.; Gong, F.; Li, X.; Du, K.; Tao, M.; Huang, L.; Du, S. Experimental investigation of rock breakage by a conical pick and its application to non-explosive mechanized mining in deep hard rock. Int. J. Rock Mech. Min. Sci. 2019, 122, 104063. [Google Scholar] [CrossRef]
  27. Wang, J.; Ma, D.; Li, Z.; Huang, Y.; Du, F. Experimental investigation of damage evolution and failure criterion on hollow cylindrical rock samples with different bore diameters. Eng. Fract. Mech. 2022, 260, 108182. [Google Scholar] [CrossRef]
  28. Cao, Y.X.; He, D.D.; Glick, D.C. Coal and gas outbursts in footwalls of reverse faults. Int. J. Coal Geol. 2001, 48, 47–63. [Google Scholar] [CrossRef]
  29. Ma, D.; Duan, H.; Zhang, J.; Liu, X.; Li, Z. Numerical simulation of water-silt inrush hazard of fault rock: A three-phase flow model. Rock Mech. Rock Eng. 2022, in press. [Google Scholar]
  30. McLellan, J.G.; Oliver, N.H.S.; Schaubs, P.M. Fluid flow in extensional environments; numerical modelling with an application to Hamersley iron ores. J. Struct. Geol. 2004, 26, 1157–1171. [Google Scholar] [CrossRef]
  31. Gudmundsson, A.; Berg, S.S.; Lyslo, K.B.; Skurtveit, E. Fracture networks and fluid transport in active fault zones. J. Struct. Geol. 2001, 23, 343–353. [Google Scholar] [CrossRef]
  32. Evans, J.P.; Forster, C.B.; Goddard, J.V. Permeability of fault-related rocks, and implications for hydraulic structure of fault zones. J. Struct. Geol. 1997, 19, 1393–1404. [Google Scholar] [CrossRef]
  33. Barton, C.A.; Zoback, M.D.; Moos, D. Fluid-flow along potentially active faults in crystalline rock. Geology 1995, 23, 683–686. [Google Scholar] [CrossRef]
  34. Babiker, M.; Gudmundsson, A. The effects of dykes and faults on groundwater flow in an arid land: The Red Sea Hills, Sudan. J. Hydrol. 2004, 297, 256–273. [Google Scholar] [CrossRef]
  35. Wong, T.F.; David, C.; Zhu, W.L. The transition from brittle faulting to cataclastic flow in porous sandstones: Mechanical deformation. J. Geophys. Res.-Solid Earth 1997, 102, 3009–3025. [Google Scholar] [CrossRef]
  36. Wang, S.; Sun, L.; Li, X.; Wang, S.; Du, K.; Li, X.; Feng, F. Experimental Investigation of Cuttability Improvement for Hard Rock Fragmentation Using Conical Cutter. Int. J. Geomech. 2021, 21, 06020039. [Google Scholar] [CrossRef]
  37. Ma, D.; Duan, H.; Zhang, Q.; Zhang, J.; Li, W.; Zhou, Z.; Liu, W. A Numerical Gas Fracturing Model of Coupled Thermal, Flowing and Mechanical Effects. Comput. Mater. Contin. 2020, 65, 2123–2141. [Google Scholar] [CrossRef]
  38. Si, G.; Belle, B. Performance analysis of vertical goaf gas drainage holes using gas indicators in Australian coal mines. Int. J. Coal Geol. 2019, 216, 103301. [Google Scholar] [CrossRef]
  39. Yin, S.; Zhang, J.; Liu, D. A study of mine water inrushes by measurements of in situ stress and rock failures. Nat. Hazards 2015, 79, 1961–1979. [Google Scholar] [CrossRef]
Figure 1. Sketch of mining-induced crushed zone development. (a) Intact rock strata. (b) Floor within fault.
Mathematics 10 01561 g001
Figure 2. Distribution of abutment pressure in floor.
Mathematics 10 01561 g002
Figure 3. Mechanical model of fault activation.
Mathematics 10 01561 g003
Figure 4. Distribution of normal stress on fault.
Mathematics 10 01561 g004
Figure 5. Distribution of shear stress on fault.
Mathematics 10 01561 g005
Figure 6. Mechanical model of the numerical simulation.
Mathematics 10 01561 g006
Figure 7. Sketch of the FLAC3D mesh of the fault.
Mathematics 10 01561 g007
Figure 8. Stress change curves of the fault when mining advances along the hanging wall: (a) normal stress; (b) shear stress.
Mathematics 10 01561 g008
Figure 9. Stress change curves of the fault when mining advances along the foot wall: (a) normal stress; (b) shear stress.
Mathematics 10 01561 g009
Figure 10. Distribution of plastic zone with mining advance along the hanging wall. Distance between working face and the fault: (a) 60 m; (b) 40 m; (c) 20 m; (d) 0 m.
Mathematics 10 01561 g010
Figure 11. Distribution of plastic zone with mining advance along the foot wall. Distance between working face and the fault: (a) 60 m; (b) 40 m; (c) 20 m; (d) 0 m.
Mathematics 10 01561 g011
Figure 12. Layout of plastic zone monitoring of working face F6210 in Buliangou coal mine.
Mathematics 10 01561 g012
Figure 13. In-situ monitoring results of mining-induced plastic zone in different monitoring points: (a) Point A; (b) Point B; (c) Point C; (d) Point D.
Mathematics 10 01561 g013
Table 1. Physical and mechanical parameters of rock strata.
Rock PropertyThickness
h (m)
Bulk
Modulus K (GPa)
Shear
Modulus G (GPa)
Internal Friction
Angle φ (°)
Cohesion
c (MPa)
Tensile Strength σc (MPa)Density
ρ (kg·m−3)
Sandstone2015.39.2363.53.52550
Main roof2216.710.0353.62.02500
Immediate roof1515.98.2292.52.52450
Coal seam39.23.7251.51.11500
Immediate floor1417.49.0322.92.42500
Main floor1612.38.1353.32.32580
Mudstone1212.69.1332.61.82500
Limestone1819.09.8383.93.52550
Fault~8.33.0180.50.51900
Publisher’s Note: MDPI stays neutral with regard to jurisdictional claims in published maps and institutional affiliations.

