Article

Graph Network Techniques to Model and Analyze Emergency Department Patient Flow

1
Industrial Engineering & Management, Ariel University, Ariel 40700, Israel
2
Management Information Systems, Kansas State University, Manhattan, KS 66506, USA
3
Information Technology and Operations Management, Florida Atlantic University, Boca Raton, FL 33431, USA
4
Data Analytics, Kansas State University, Manhattan, KS 66506, USA
5
Beilinson Hospital, Rabin Medical Center, Petah Tikva 4941492, Israel
*
Author to whom correspondence should be addressed.
Mathematics 2022, 10(9), 1526; https://doi.org/10.3390/math10091526
Submission received: 24 March 2022 / Revised: 27 April 2022 / Accepted: 28 April 2022 / Published: 2 May 2022

Abstract

:
This article moves beyond analysis methods related to a traditional relational database or network analysis and offers a novel graph network technique to yield insights from a hospital’s emergency department work model. The modeled data were saved in a Neo4j graphing database as a time-varying graph (TVG), and related metrics, including degree centrality and shortest paths, were calculated and used to obtain time-related insights from the overall system. This study demonstrated the value of using a TVG method to model patient flows during emergency department stays. It illustrated dynamic relationships among hospital and consulting units that could not be shown with traditional analyses. The TVG approach augments traditional network analysis with temporal-related outcomes including time-related patient flows, temporal congestion points details, and periodic resource constraints. The TVG approach is crucial in health analytics to understand both general factors and unique influences that define relationships between time-influenced events. The resulting insights are useful to administrators for making decisions related to resource allocation and offer promise for understanding impacts of physicians and nurses engaged in specific patient emergency department experiences. We also analyzed customer ratings and reviews to better understand overall patient satisfaction during their journey through the emergency department.

1. Introduction

In this paper, we introduce a novel method for modeling, storing, and analyzing patient journeys through the emergency department (ED) in a hospital. This study is based on real-world data and uses a TVG (time-varying graph) method to gain insights. It is framed using the paradigm of patient experiences in the ED. This focus of interest is part of a global tendency towards patient-centered care. Improving patient experiences is related not only to their satisfaction but also to delivering better clinical outcomes [1]. Overall, a patient-centered approach in EDs was shown to improve flow and thereby utility [2]. However, analyzing patient journeys in the chaotic environment of EDs to identify specific domains for improvement is challenging [3,4]. This study addresses the challenge using a TVG approach.

1.1. New Contribution

Evolutionary graph analytics are used to explore various network types including web citation and co-authorship networks [5,6,7], online social networks [8,9,10,11,12,13], biology and disease networks [14,15,16,17], education networks [18], communication networks [19,20,21,22,23,24], and others [25]. Likewise, graph techniques have proven useful in understanding healthcare facility dynamics. Brunson et al. [26] conducted a systematic review of network-based studies conducted in healthcare facilities. Among these were patient transfer or sharing networks which used a network flow approach to describe the movement of information and resources between internal and external care providers. Several other studies viewed patient transfers as potential vectors for intra-hospital disease spread from network perspectives [27]. Others used static models to view health care from an economic or structural perspective [28,29]. Most dynamic network models used an epidemiological perspective [30,31]. Bean et al. [32] moved outside epidemiology and utilized dynamic weighted directed graph theory to investigate intra-hospital patient transfers. Our study expands this use into hospital emergency department applications [33,34]. To better understand needs and resource use in an emergency department, additionally, the current study proposes a model based on TVG, which represents a framework for evolutionary graph analytics of fast-evolving real-world networks [35]. This framework suggests network structures evolve in space and time. This evolution manifests as changes in connectivity and adjacency relationships among nodes. In the current study, changes to the network represent different steps undertaken by patients in their journey through the emergency department, with time as a central attribute.

1.2. Medical Knowledge Graphs

Medical knowledge graphs (KG) have attracted attention from both academics and healthcare researchers due to their inherent capability to contribute to intelligent healthcare applications [36]. Knowledge graphs are used in medical domains both for diagnosis and treatment [37,38,39,40] and have been described as valuable in patient diagnosis through evaluation of health conditions by symptomology [41,42].

1.3. Graph Databases

Graph databases are NoSQL databases where data are represented as nodes and the relationships between them as edges. Both nodes and edges have properties, resulting in graphs of interconnected key-value pairings. Traditionally, graph databases use nodes to represent static entities. For instance, nodes may be a person or a service. Each entity can have attached labels which describe the role(s) of an entity in the database. Relationships describe how the entities relate to each other. A relation always has a start node, end node, direction, and type. Relationships also have properties that express quantitative measures such as weights, costs, distances, ratings, or strengths. Nodes can share any number or type of relationships without sacrificing performance [43]. New information and relations can be added continuously and updated without much effort. This leads to easier adaptation to schema evolution and the ability to capture ad hoc relationships continuously [44].
Using network analysis to represent an ED is helpful for understanding its general structure and where process improvements can be implemented [29]. However, EDs are not static structures. This means that traditional network analysis approaches may be improved using temporal attributes to capture dynamic relationships and allow representation of a network that changes over time. As Maduako et al. [45] suggest, in transit network studies, when models are based on static graphs and the movement patterns are dynamic, additional attributes must be considered. Adding temporal attributes to relationships provides the means to model dynamic changes over time. The time-varying graph (TVG) approach provides the mechanism to consider temporal aspects of network models.
In this study, we are interested in learning about the patient flow through different caregiver patterns. In this instance, graph databases have the advantage of keeping all information about an entity in a single node and showing the entity relationships with others through edges. This makes the data more natural and understandable for users.

1.4. Implementation of Knowledge Graph in Emergency Department

In most cases, patients arriving at an ED are seen by a triage nurse who categorizes them according to the severity level of their complaint. We propose to measure and improve patient flow in EDs using graph database techniques to reflect the dynamic and complex natures of this process and provide high-value improvements, particularly to the patients with higher needs. This contrasts with previous studies which used simulation techniques to analyze risk factors and support strategic flow decisions [46]. In other recent studies, focus was placed more on patient experience and satisfaction in the process rather than flow. This makes sense as the unique environment in ED can be chaotic, rushed, have little or no privacy, and indeed be difficult for patients [47,48]. The ability of patients to accurately describe their experience of care can be compromised by this often-stressful environment, which can result in patients experiencing anxiety, fear, and uncertainty [47,49,50]. The often noisy and unpredictable nature of the ED environment might also limit healthcare professionals’ abilities to assess patients’ experiences [51,52]. Therefore, we propose to move in a new direction and use a more objective method to analyze patient experience based on a knowledge graph representation of patients and their relationships with different units of EDs. This approach promises to add a new dimension to patient care capabilities in EDs.

1.5. Contributions

The current research utilizes TVG for modeling dynamic relationships in ED settings. The TVG model augments traditional network analysis in ED settings. It still provides topological structural computations within the ED, including good insight into structural components of the process flows (e.g., most important points of patient interaction, busiest departments, and structural flow characteristics of patient visits due to various diagnoses). In addition, use of a time-tree graph database implemented in Neo4j provides additional, temporal-related outcomes in the ED including patient flows, congestion points, and resource constraints from a network perspective.

2. Methods

2.1. Graph Network Modeling

The basic data model in graph network modeling comprises nodes, relationships, and attributes. Nodes represent an object instance and are connected by various relationships. The attributes of nodes and relationships can be defined as a key-value. This research examines use of a graph network model, implemented to represent the management of patient paths in the ED of Hillel Yaffe Medical Center in Hadera, Israel. The structure is presented in Figure 1. The data contain log events for different steps a patient goes through in his or her visit to the ED. The proposed TVG model consists of a set of nodes (network entities), edges (network relationships), and time instances (time-tree).
Event types in the model are temporal nodes that have timestamps and a leaf node connected to a time-tree. The time-tree consists of time nodes present as a hierarchical tree structure, where the root node is followed by year nodes, month nodes, day nodes, hour nodes, and minutes nodes [45]. The hierarchical temporal indexing structure utilizes time-dependent graph queries to return results quickly. A time-dependent query first arrives at the time-instant node or range of time-instant nodes of the query and then traverses to all linked events or nodes without having to scan through the larger graph. Administrative reception, nurse triage end, nurse examination end, doctor examination end, ordering laboratory tests, consultation order, consultation perform, ordering imaging tests, imaging test perform, hospitalization, ward update, discharge, left before completion, passed away, transfer, home hospitalization, and refusal of admission are the event nodes present in our graph model.
All ‘Event’ nodes related to a specific patient are connected to a ‘Case’ node which has a unique number as an identifier for a specific patient visit via the ‘RELATED_TO’ relationship. The ‘Case’ node is linked via the ‘START_AT’ relationship with the first event in the patient’s visit path and the ‘ENDS_AT’ relationship with the last event in the patient visit path. Any event listed above can exist between the first and the last event in the path. The connectivity between event nodes is represented by the ‘NEXT_EVENT’ relationship when moving between sequential events during the visit. The ‘NEXT_EVENT’ relationship contains a duration attribute which represents the number of minutes required for tasks to move from one event to another.
‘Consulting_Unit’ nodes are linked to ‘Consultation Order’, ‘Consultation Perform’, ‘Ordering Imaging Tests’, ‘Imaging Test Perform’, and ‘Ordering Laboratory Tests’ event nodes. This represents a relationship to the units in the hospital which provide the consultation or imaging/laboratory service during a patient’s visit. The same holds for ‘Hospital_Unit’ nodes. ‘Nurse Triage End’, ‘Hospitalization’, ‘Ward update’, and ‘Transfer’ event type nodes are linked with a relationship to the ‘Hospital_Unit’ node, which represents the hospital unit related to patient’s treatments, hospitalization, or transfer. Figure 2 provides an example.

2.2. Graph Network Metrics

An advantage of modeling the patient path as a graph network relates to its inherent ability to capture information about the network’s evolution, topology, and attributes. This information provides useful insight and tools for performance management of patients’ paths in the ED. In this study, we used the following graph metrics to describe evolving centrality in a dynamic situation [11] using time dimensions of the graph based on timestamp attributes of the developing nodes and edges.

2.2.1. Degree Centrality and Weighted Degree Centrality

Degree centrality utilizes the in or out degree of a node and provides information about the total number of edges a node has with other nodes in the network. The higher the number of connections, the more influence the node has in the network. In this study, degree centrality can be used to retrieve the busiest hospital units/consulting units, the number of hospitalizations, and the number of completed consultation orders over time in the patient flow network.
Weighted degree centrality computes the total number of edges connected to a node, taking attributes defined in a relevant relationship into consideration. In the current study, this would include calculating the weighted degree for an event node, considering duration attributes to provide information about the average minutes required to move from one event to the next.

2.2.2. Path Analysis

The average path length is a robust measure of network topology [53]. A path in a graph is simply a sequence of nodes with the property that each consecutive pair in the sequence is connected by a weighted or unweighted edge. This metric indicates the efficiency of travel in the network. Moreover, the evolution of this value is observed over time. In our study, this allows us to find the duration of patients’ journeys through the ED. Furthermore, depending on our interest, we can specify the nodes along the path length to be queried. For example, this could be a sequence of events before hospitalization, discharge, or transfer.

2.3. Approach

The TVG model was implemented in the Neo4j graph database system. Neo4j is a popular, native graph database widely used for data management and analytics. The language used to build and process graphs in Neo4j is called Cypher, which we have used to construct the nodes and edges continuously into the graph and to encode graph metrics for evolutionary graph analytics. In general, Cypher is a declarative graph query language that allows expressive and efficient querying and updating of the graph store. Complicated database queries can be expressed using Cypher. Since Cypher is a declarative language, it focuses on expression clarity, making retrieval from a graph the goal rather than requiring the analyst to focus on the retrieval process mechanics.

Dataset

The dataset used in this experiment was obtained from a hospital in Central Israel: the Hillel Yaffe Medical Center. It is a public academic general hospital, owned by the Israeli Ministry of Health and accredited by the Joint Commission International. The hospital’s bed capacity is 515 and it averages approximately 90,000 annual ED visits. The data contain log information about different patient events during visits to the ED. The dataset contains the following information: job load time, case number, event ID, event name, consulting unit, hospital unit. Each row in the table represents a specific event in a specific case, with each case representing a patient visit in the emergency department. The data are completely anonymized to keep patient identity confidential. Overall, the 64,866 cases contained a total of 536,893 events from 7 May 2020 to 25 March 2021. The number of occurrences of each event type is described in Table 1.
The dataset went through data pre-processing and transformation pipelines before using TVG to model the patient journey network. When fully loaded, a total of 601,857 nodes with 1,426,108 relationships were created. The data loading used the following steps:
Step 1: Import Case nodes: ‘Case’ nodes were created for each unique case number. For a specific case, the first event node was connected to its ‘Case’ node with the ‘START_AT’ edge and the last event node was connected to the ‘Case’ node with the ‘ENDS_AT’ edge.
Step 2: Import Events nodes: Event logs from the dataset were used to create ‘Event’ nodes with their respective properties. The ‘NEXT_EVENT’ edge connects consecutive events related to the same case. The ‘RELATED _TO’ edges connect each event node to the ‘Case’ node.
Step 3: Import Consult Units nodes: A total of 50 ‘Consulting_Unit’ nodes were created for unique consulting units in the dataset. ‘ORDER_BY’ edges connect events initiating the consulting stage and laboratory/imaging test orders with ‘Consulting_Unit’ nodes, and DONE_BY edges connect completion status of those events with ‘Consulting_Unit’ nodes.
Step 4: Import Hospital Units nodes: A total of 49 ‘Hospital_Unit’ nodes were created for unique hospital units in the dataset. ‘TO’ and ‘FROM’ edges connect the events with the ‘Hospital_Unit’ node relevant to patient movement related to hospital units.
Step 5: Build time-tree: All the time instances of patients’ event logs in the dataset from 7 May 2020 to 25 March 2021 were included in the time-tree.
Step 6: Build relationships between Events nodes and Leaf nodes in the time-tree: Finally, the event nodes were connected with ‘HAPPENED_AT’ edges to ‘Minute’ nodes from the time-tree nodes based on event occurrence.
The model provides information on patient transfer times from one unit to another in their journey through the ED. A visualization of the entire set of events for each patient’s journey, including all related units, is available as well. This enables an analyst to learn and understand more about required interactions that impact patients’ journeys from a high level, and also permits drilling down into a specific patient’s experience.

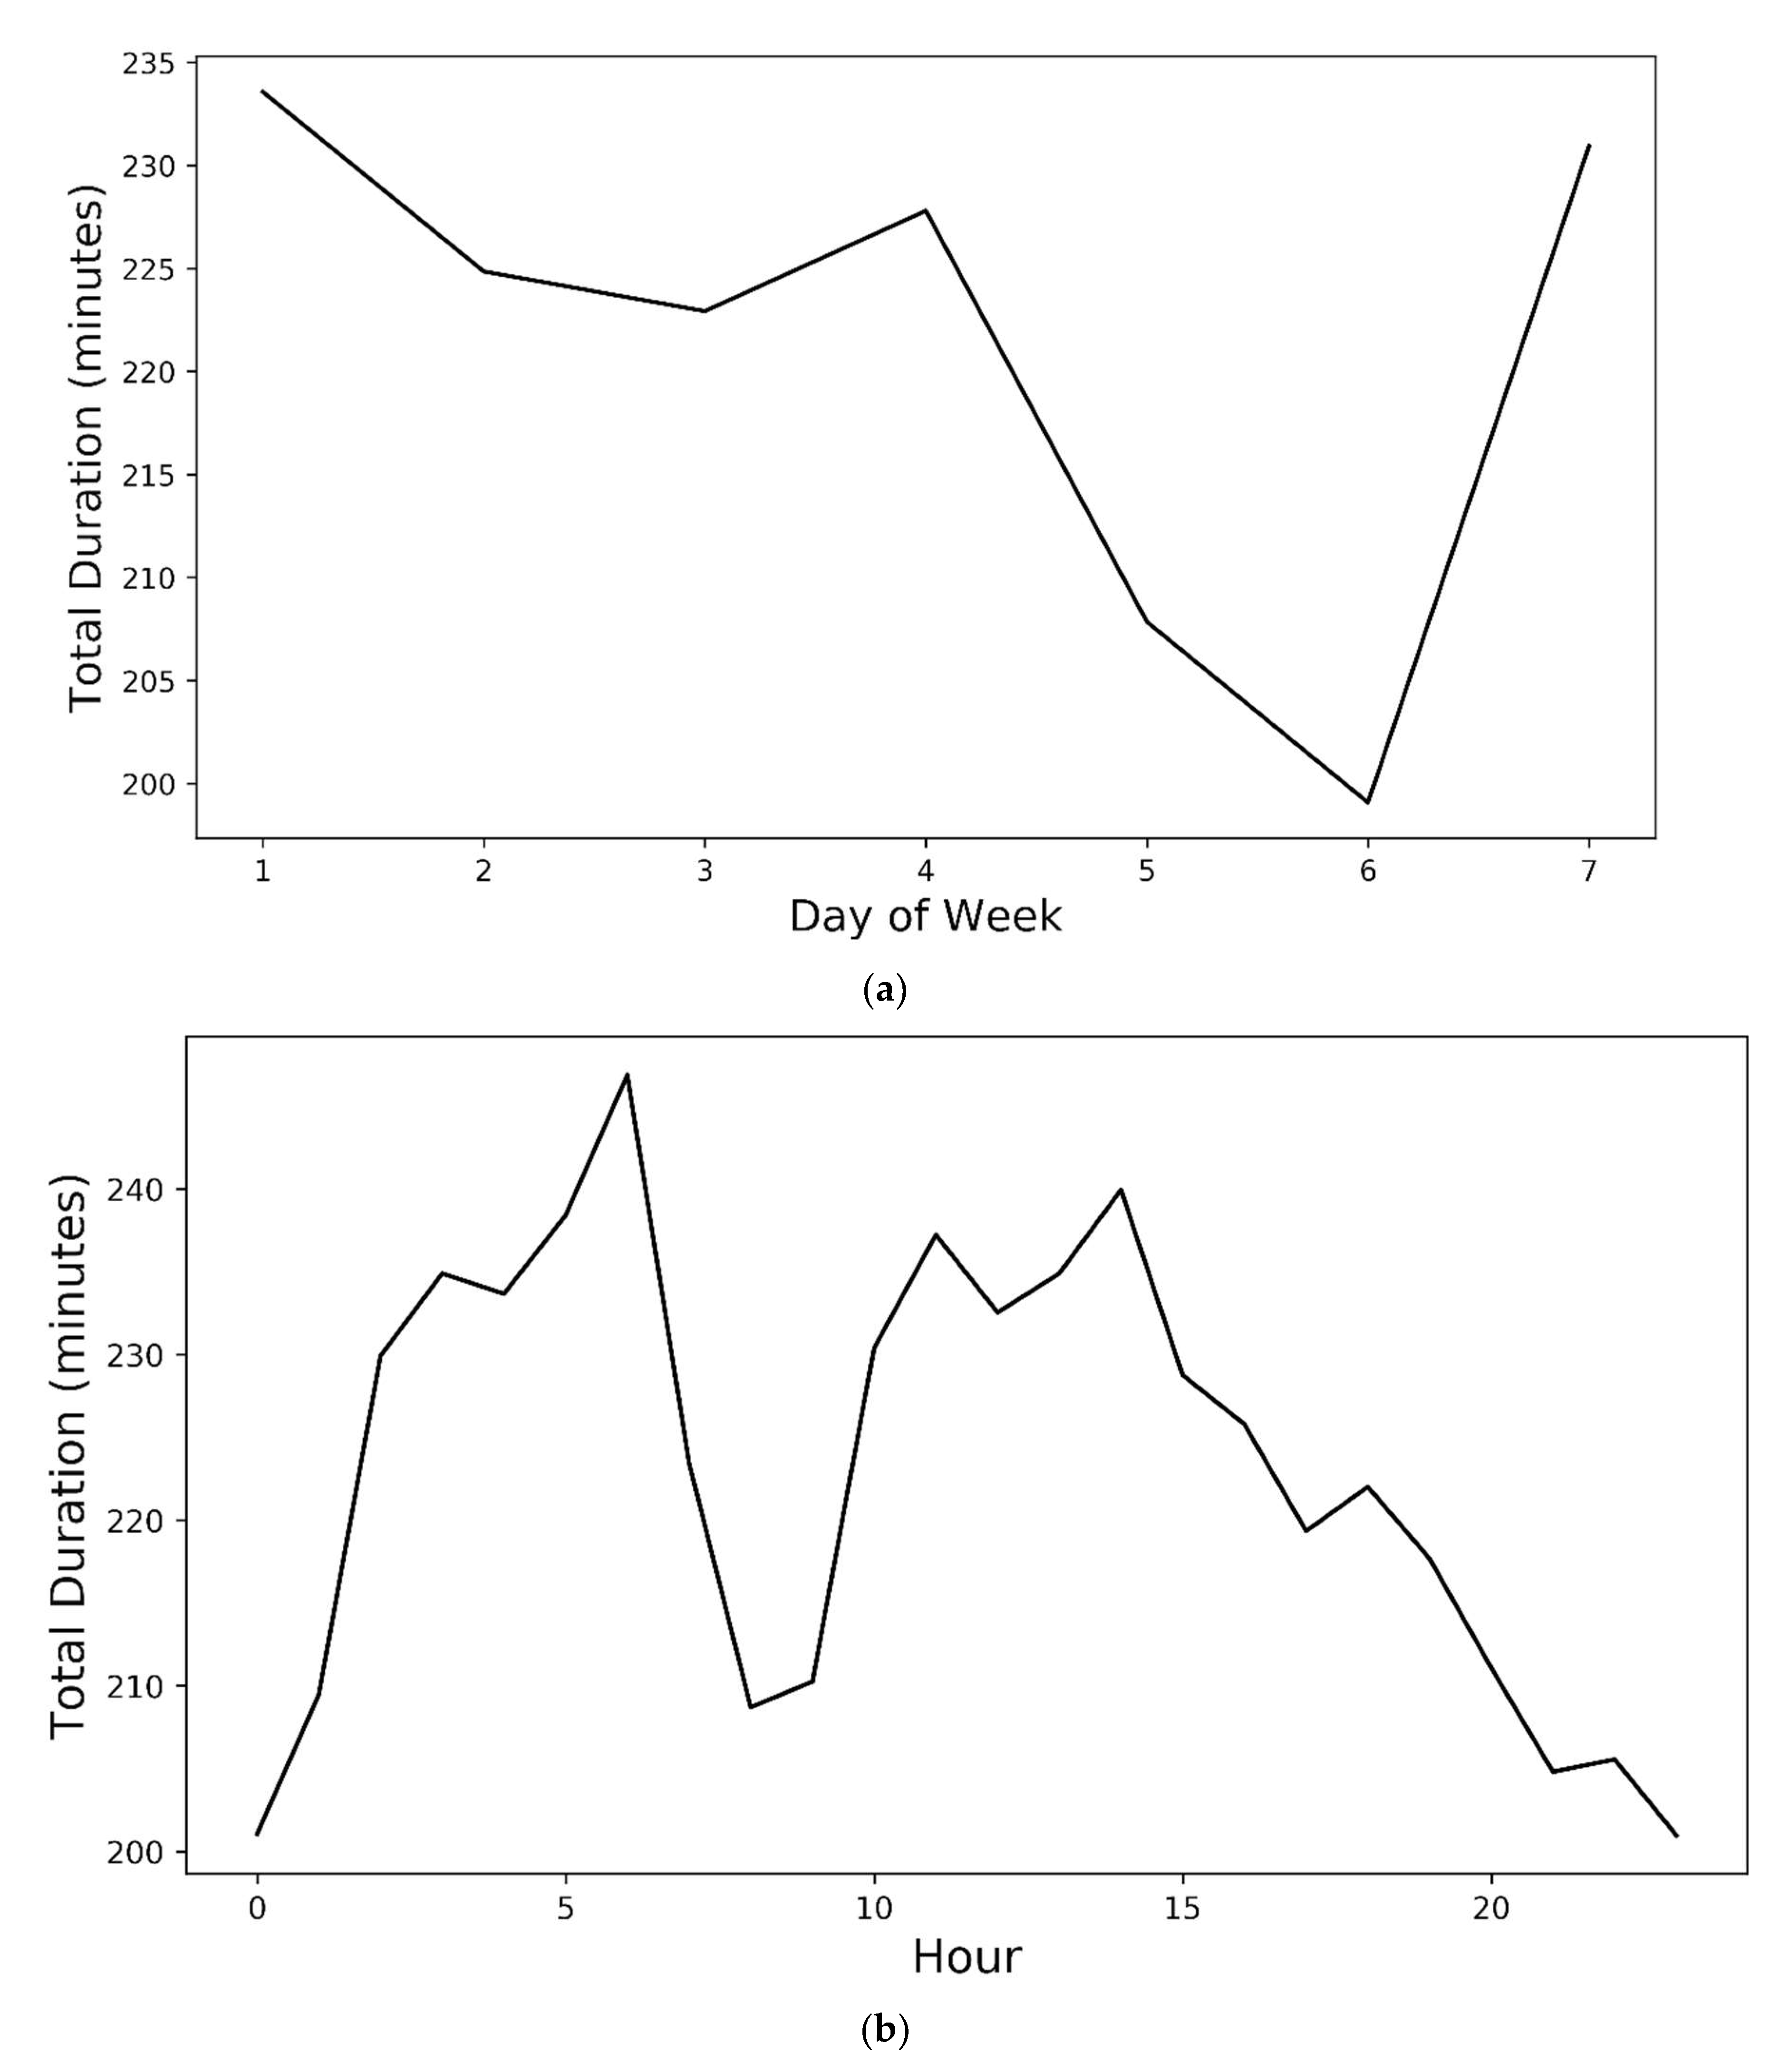
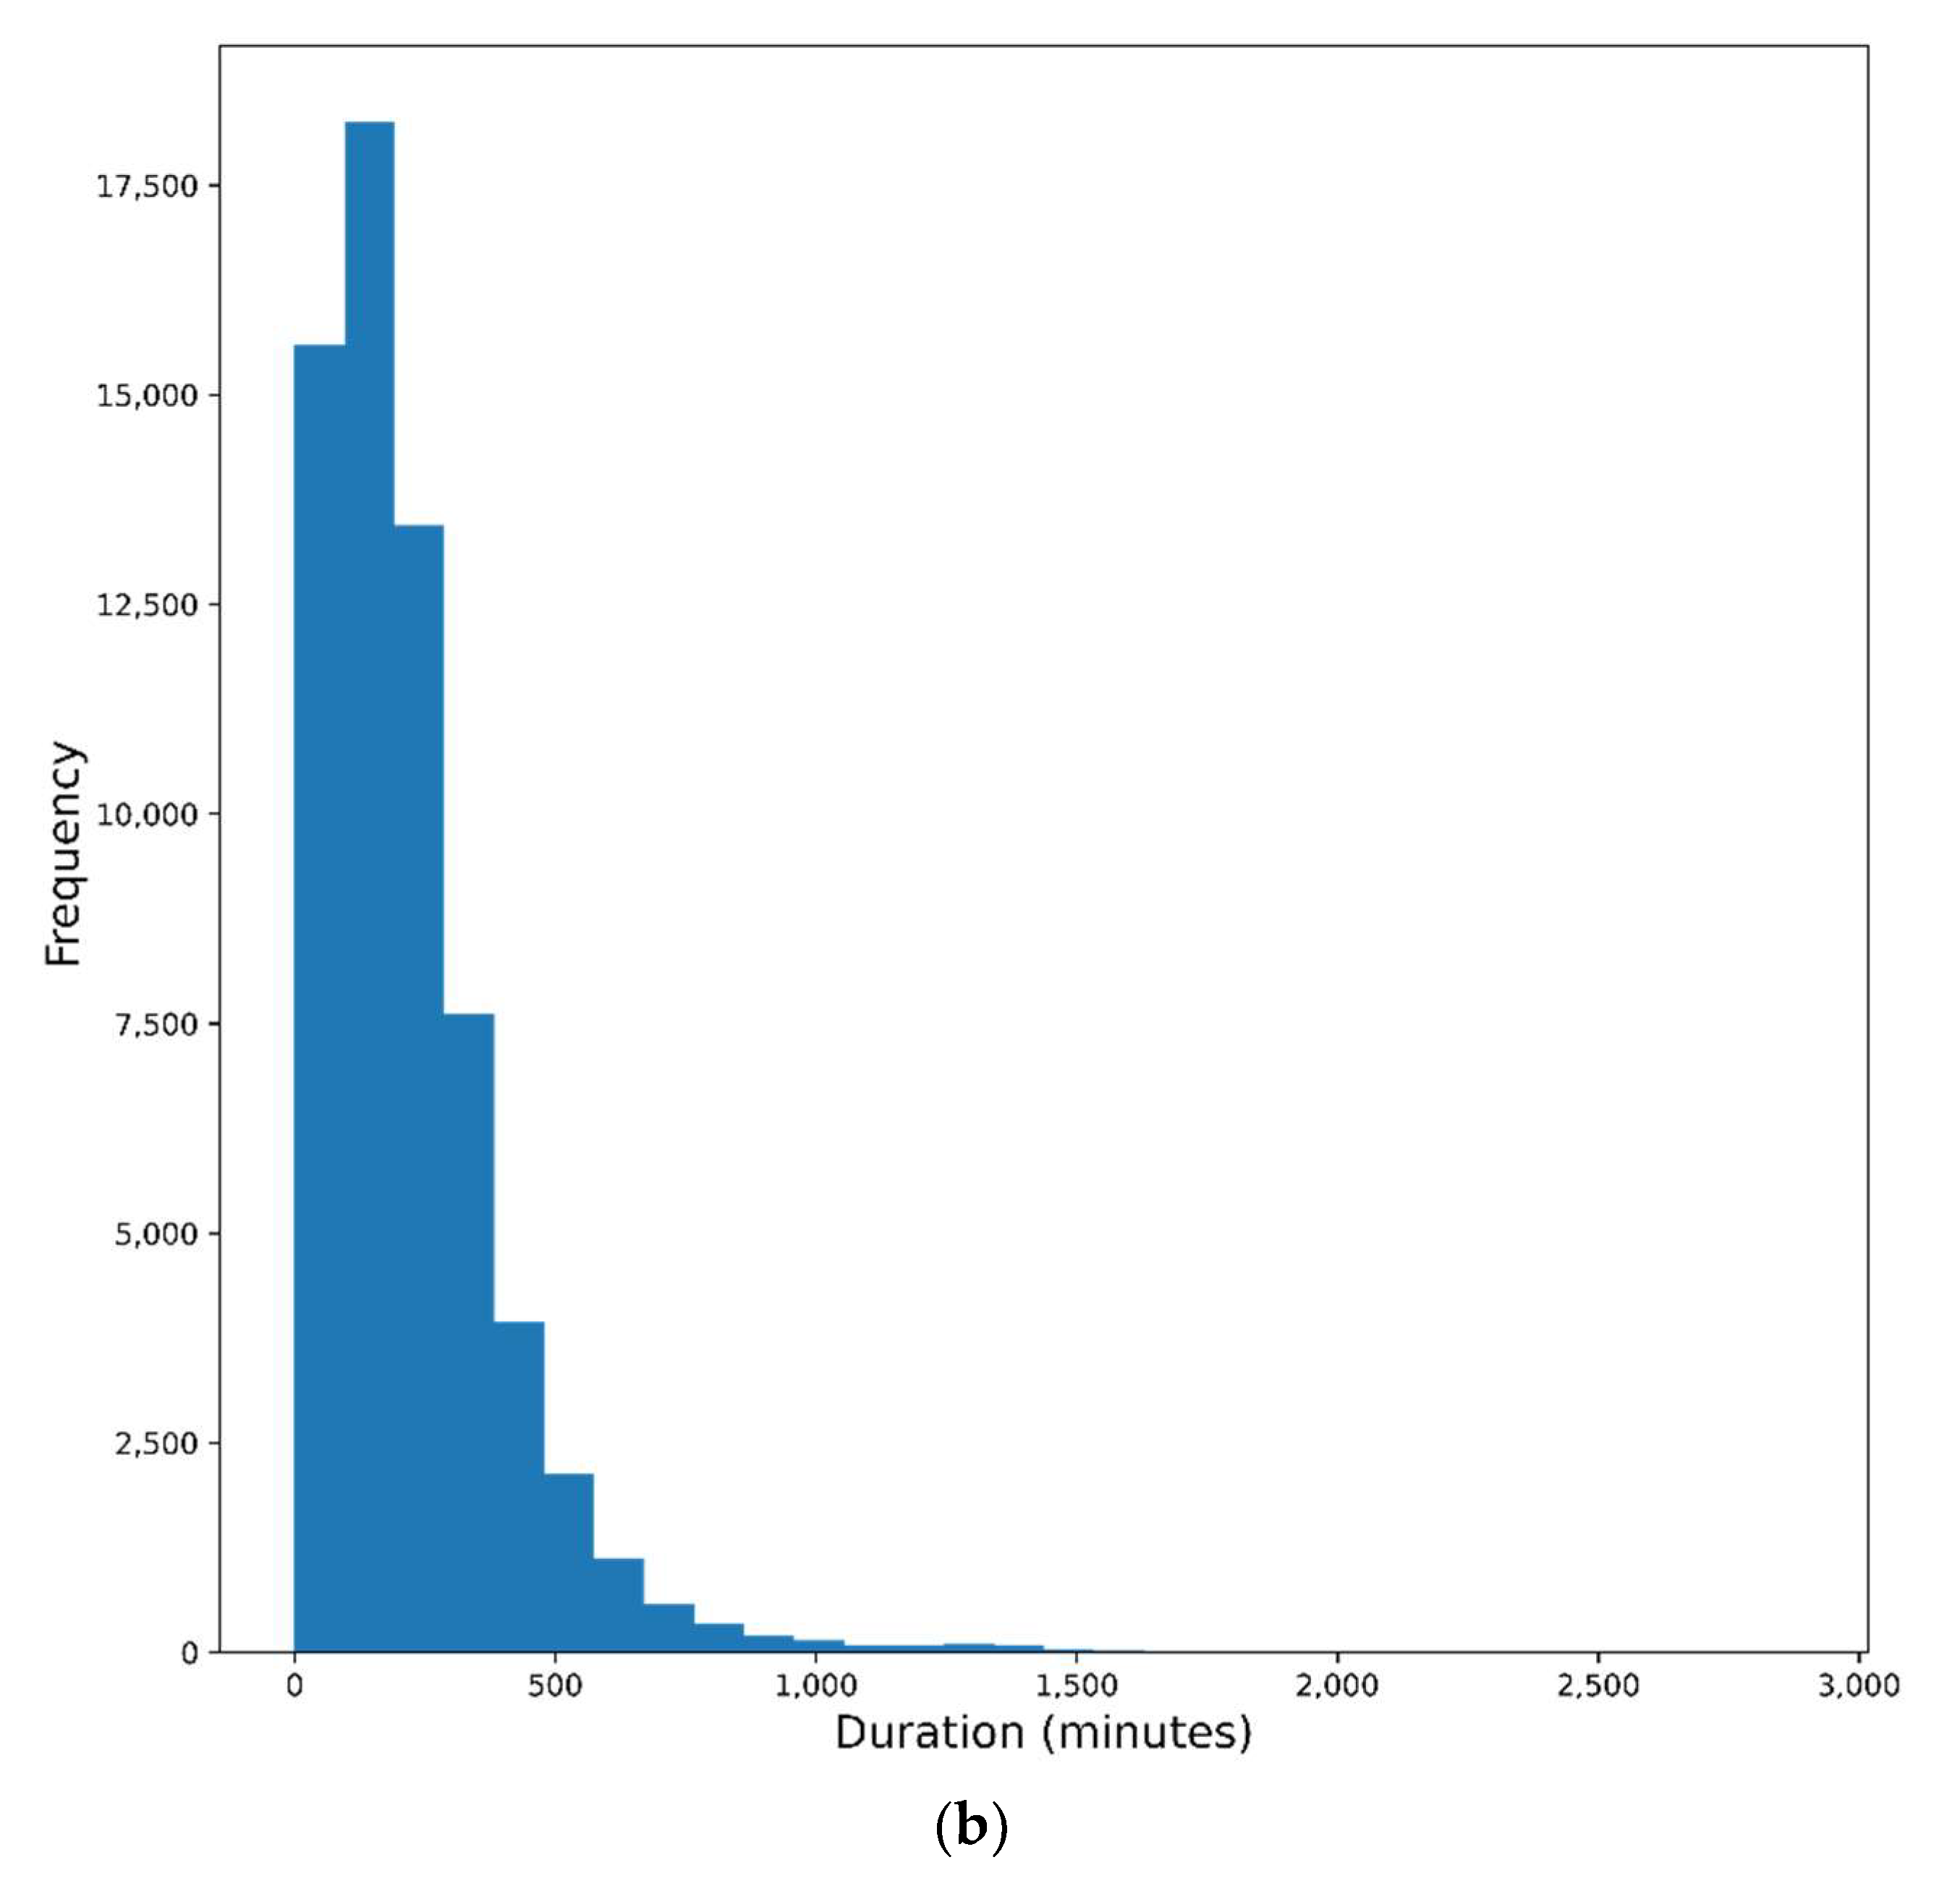
3. Results and Discussion

The graph network metric algorithms described earlier were called using Cypher queries to retrieve results from the patient journey network graph implemented in the Neo4j database. The following discussion focuses on metrics that illustrate the temporal nature of patient journeys through the ED. This information will be helpful to administrators making staffing and resource decisions.
Degree centrality measures the importance of any specific nodes in a network. In the context of the time-varying patient journey network graph, the degree centrality of hospital units and consulting units are measured and visualized. Figure 3a,b show the top 10 hospital units and consulting units with the highest degree of importance in terms of incoming inquiries. This correlates with the busiest hospital units and consulting units as we are only considering incoming edges (‘TO’ for hospital units and ‘ORDER_TO’ for consulting units) when querying degree centrality using Cypher. We also can interpret centrality as each hospital and consulting units’ number of followers. The Internal Medicine Emergency Department among hospital units, and Metabolic (Chemistry) Lab among consulting units, have the highest numbers of interactions with incoming patients. This is important information for hospital management as they decide which units need to be expanded or scaled-down and need more or fewer resources and staff. It also helps to position busy units in places where there is easy access to avoid unwanted traffic and clutter on the hospital floor.
The ‘FROM’ edge connects the ‘Hospital_Unit’ node and ‘Ward Update’ event node, and represents an established hospitalization of a patient. The degree centrality of a hospital unit based on ‘FROM’ edges represent the number of patients hospitalized in that hospital unit (Figure 4). The highest degree indicates that more patients require hospitalization within that unit. As can be seen in Figure 4a,b, ‘Internal Medicine’ among hospital units has reported the highest hospitalizations, followed by two of the more specific departments that work on aspects of internal medicine, ‘Internal Medicine B’ and ‘Internal Medicine A’. This gives crucial information to administrative decision makers on how to optimize resource allocation among hospital units. As an example, they can decide the number of hospital beds or staff needed in each hospital unit depending on the number of hospitalizations within that unit.
Evolutionary analytics of patients’ journeys are demonstrated using a metric called the weighted degree, based on event duration. This was originally proposed by Yarlagadda, Pinnaka, and Etinkaya [20]. Figure 5 shows the discrete duration for each event in the current analysis. This shows that the event ‘Home Hospitalization’ takes longer to finish. It is followed by ‘Consultation Order’ and ‘Doctor Examination End’. The event type ‘Discharge’ takes less time to finish compared to other events. This information helps hospital staff efficiently manage the jobs that they receive by allocating time effectively. However, these results completely rely on event starting time accuracy in our dataset, and the assumption that patients move through stations efficiently without any time delay.
The Dijkstra source–target algorithm implemented in the Neo4j Graph Data Science (GDS) Library computes the shortest path between a source and a target node and also supports weighted graphs with positive relationship weights. We computed specific journey parameters for each case while simplistically using graph knowledge, with an immediate query. Specifically, path flow data for each patient, including all events, were used by the Dijkstra algorithm to compute the shortest path to provide the number of events a patient moves through during their ED experience, the path sequence, the total duration of the journey, and the day and the hour the journey started (Table 2).
Overall graph statistics are computed to provide information on the comprehensive set of journeys. For example, these include shorter journeys that entailed only 2 events, as well as the longest possible journey through 39 events. From a medical perspective, it becomes more complex to compare the shorter and longer journeys. Since the medical situation determines the journey, traditional statistics used for analyzing journeys in a discrete way may fall short. In our study, the aim was to learn about the dynamic behaviors of patients while they visited the ED rather than analyzing their specific medical outcomes. To better understand the length of patient journeys, the information retrieved using the Dijkstra algorithm was used to develop frequency distributions of events and frequency distributions of durations, as shown in Figure 6. Figure 6a shows that exactly 17,606 patients go through five events in their ED visit and the mean number of events a patient goes through is eight. According to Figure 6b, the shortest visit was 0.0167 min long and the longest visit required 2864 min in the ED. It is important to note that there are some cases in which all the events are entered at once, and a time lag of 1 s (0.0167 min) was introduced to all events of such cases. Frequency distribution of patient flow durations shows that a little more than 15,000 patients stayed between 0.0167 and 100 min in ED and more than 17,500 patients stayed between 100 and 200 min. The average patient stay is 222.09 min.
Since the data come from the knowledge graph, it is easy to understand the overall perspective of the system using the time-tree. From the perspective of the duration of the journey by day of the week, we see that patient journeys are slightly longer earlier in the week (Sundays and Mondays) and they are slightly shorter on Fridays and Saturdays (Figure 7a). No differences exist on the other days of the week. Additionally, this analysis can be grouped by hour to provide more detail (Figure 7b). It highlights an interesting trend, which is that people who arrive in the early morning hours (5.00 a.m. to 6.00 a.m.) and around early noon to early afternoon (11 a.m. to 2.00 p.m.) typically stay longer. ED stays of people who arrive between 8.00 a.m. and 9.00 a.m. are shorter compared to those of other people who visit during the daytime.
Generally, SQL is used to analyze data in traditional RDBMS. It enables analysts to slice and dice different combinations of dimensions and metrics. Results can be aggregated to the level of the patient, event, or unit of interest. However, path analysis is not well-supported by traditional SQL databases. It takes many table scans to query such paths, making it expensive. Neo4j and its query language Cypher help provide the results for such questions efficiently and accurately. In the current study, it permits exploration of how patients travel through the ED network at the event level in a way that ensures analysis is not limited to preconceptions. As an example, Table 3 shows the most frequent journey sequences in the hospital ED network with corresponding frequency of occurrences.
Several sequences can be identified with the same events but slight variation in event order. As an example, the first and the tenth sequences are almost identical, except ‘Nurse Examination’ is reported before ‘Nurse Triage’ in the tenth. This is important, as the medical domain has a precise journey sequence that must be executed by specific patients’ needs. In traditional database analysis, this path, which could be a mistake needing more attention, would not be seen. The graph network approach highlights a tabulation of the nodes and the sequence of relationships. The use of graph knowledge is important, especially in the medical domain, since it provides a comprehensive look and perspective based on a holistic patient journey.
In the same way, we can query the most frequent event or event sequences that occur before or after a certain event, hospital unit, or consulting unit. This information can help patients and hospital staff construct an idea of the next step in the journey. It could in turn help hospital management organize the hospital floor so that patients can efficiently move through stations. As an example, ‘hospitalization’ is a critical event in patients’ journeys. What happened before and after such a decision is very important to a patient as well as to hospital management. Table 4 shows the most common three consecutive event sequences a patient traveled before and after a decision to be hospitalized, and their frequency of occurrence. It depicts that, usually (~14.9% of hospitalizations), patients are hospitalized after finishing nurse/doctor examination and hospitalized patients mostly go through at least three laboratory tests (~4.2% of hospitalizations) after hospitalization.
Similar issues could have been identified if graph knowledge was used in a journey that described hospitalization decisions without receiving final reports from a medical team. This might mean the patient did not require hospitalization. By looking at the full journey sequence for the visit, these problems could have been eliminated.
As mentioned earlier, path analysis can also be used to explore a specific event that happened before or after a certain event. As an example, it is very useful for a patient and hospital staff to have an idea of what event leads to ‘Consultation Perform’ and what event usually occurs after consultation is performed. Table 5 shows the most common events that happened before ‘Consultation Order’ and after ‘Consultation Perform’. Our analysis indicates that most consultation orders are executed after finishing doctor examinations (38.5% of consultation orders) or nurse examinations (14.8% of consultation orders). This information can be useful to hospital management to efficiently organize the hospital floor. The establishment of doctor/nurse offices close to consulting units lets patients move through stations easily and effectively, thereby saving unwanted travel time through the ED network. Furthermore, the busiest consulting units can be established in such a way that patient traffic will not be disturbed.

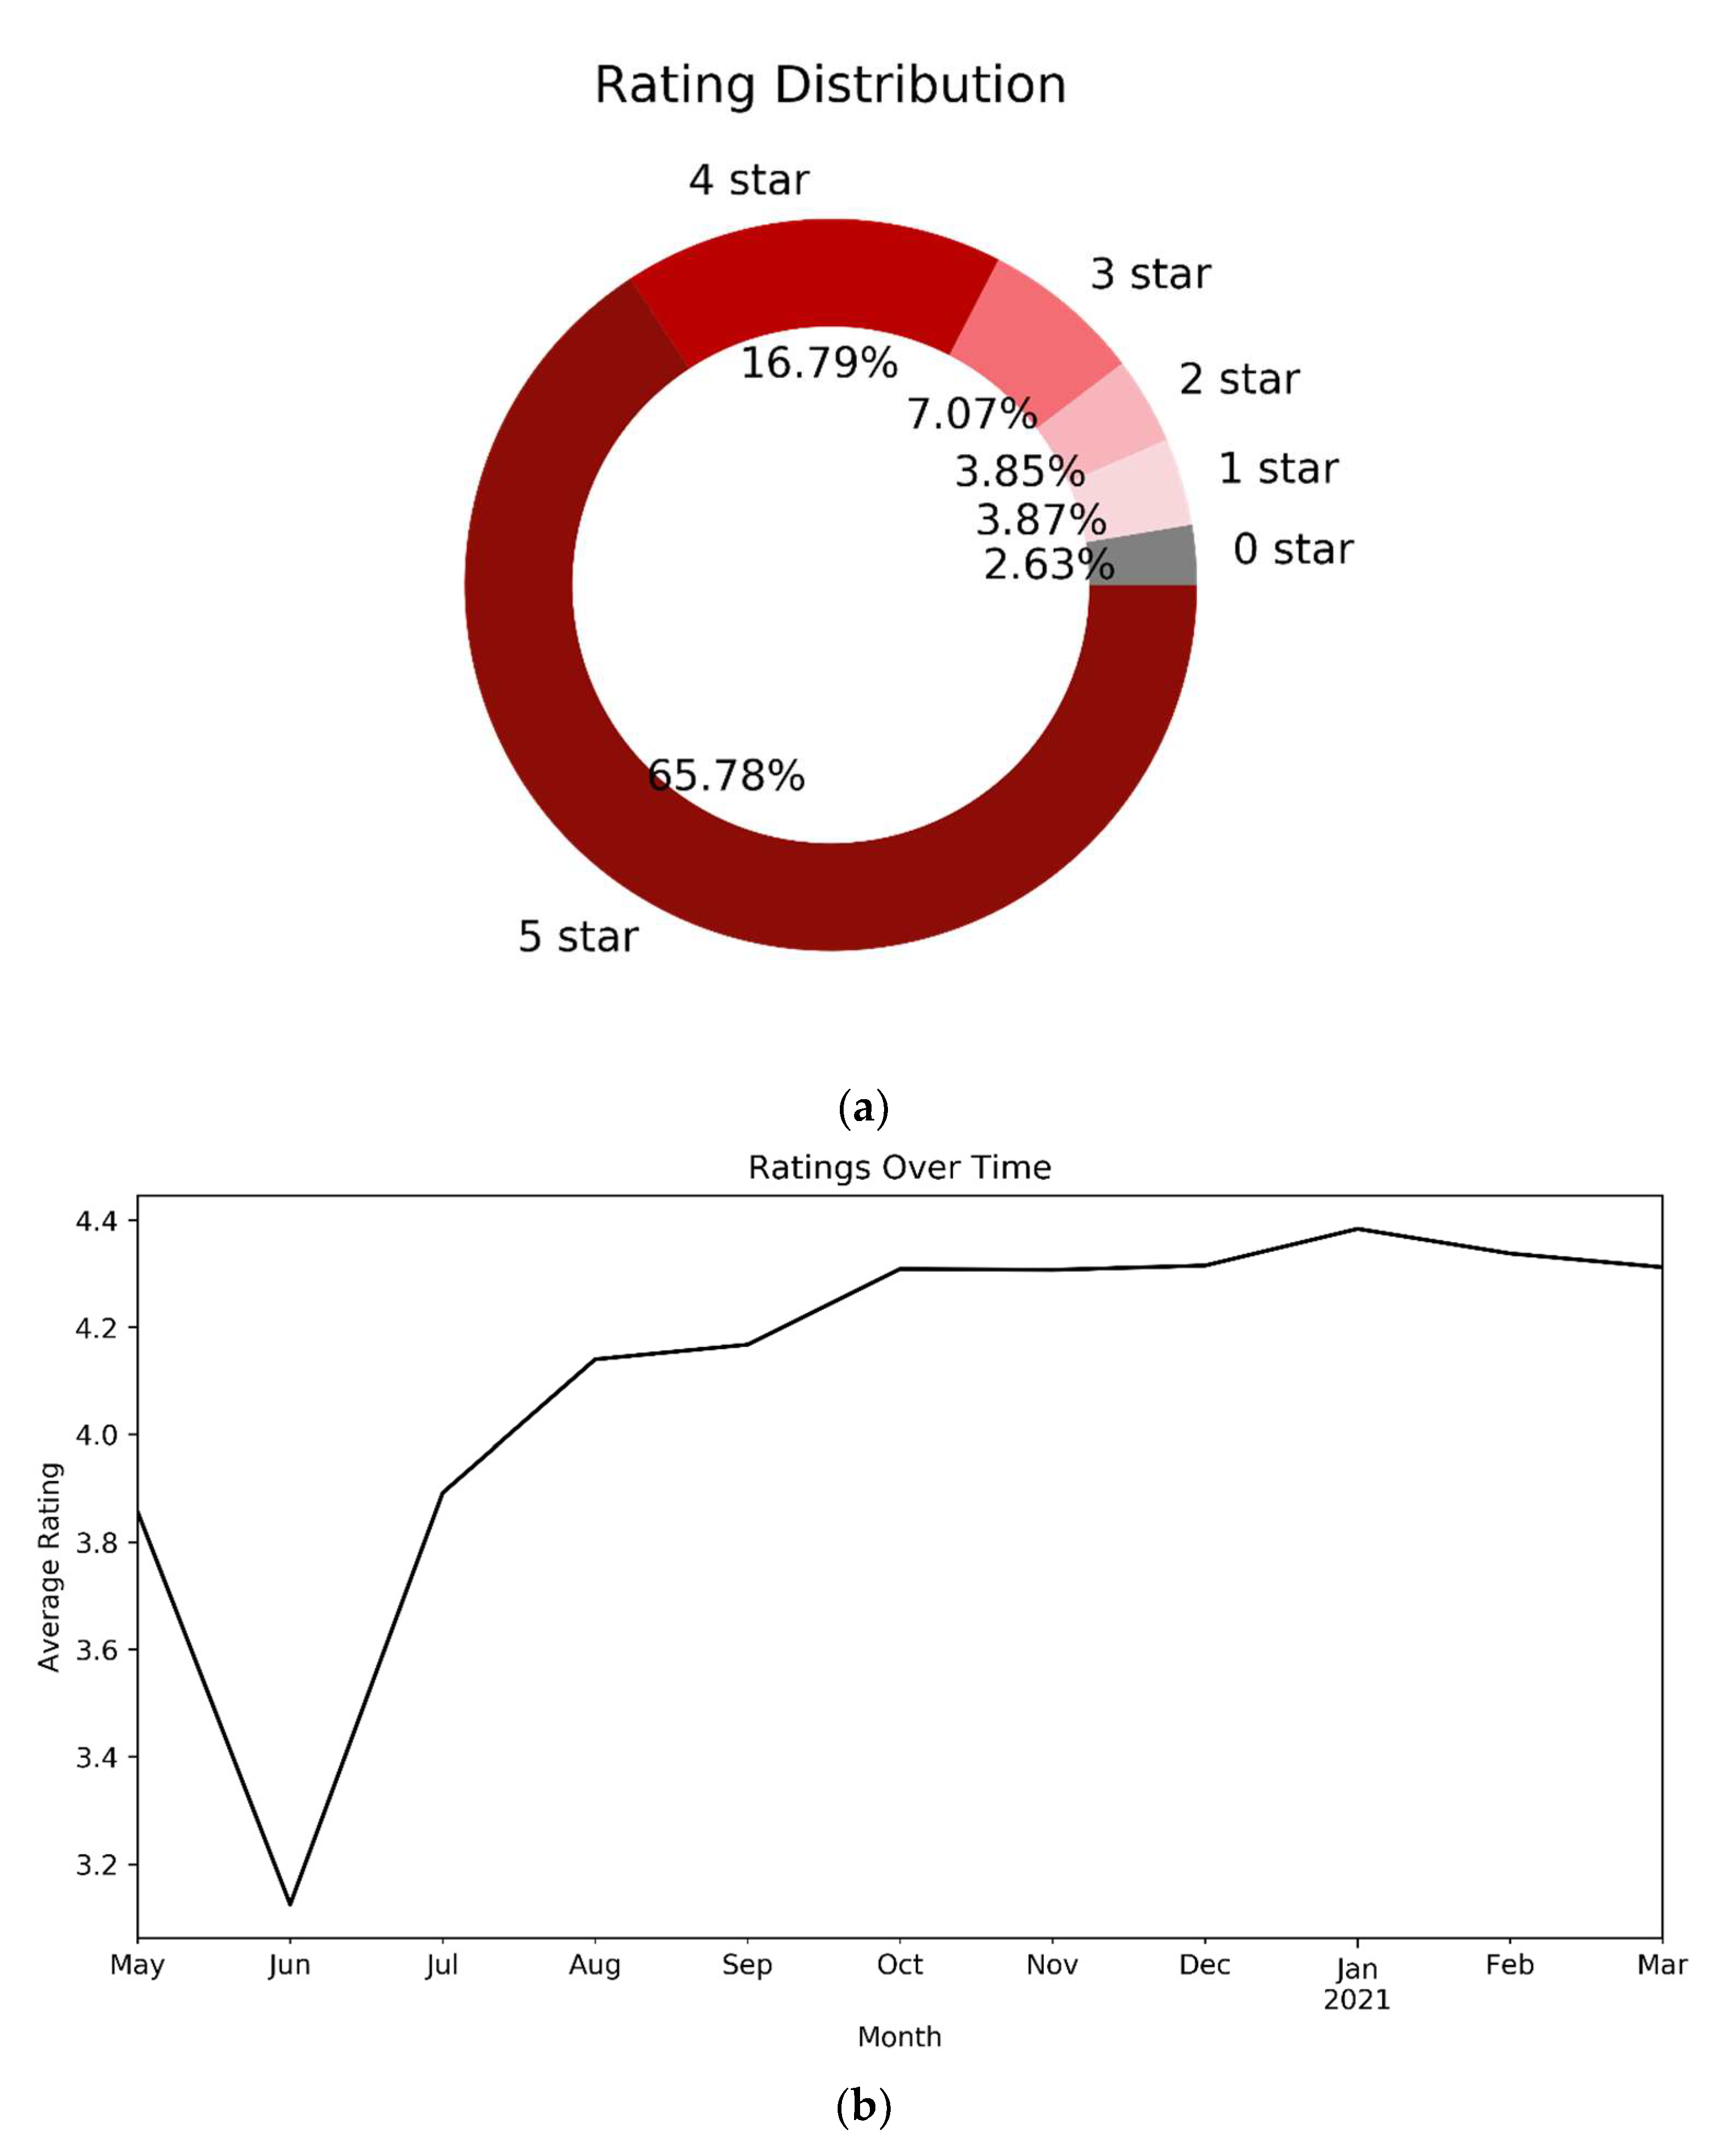
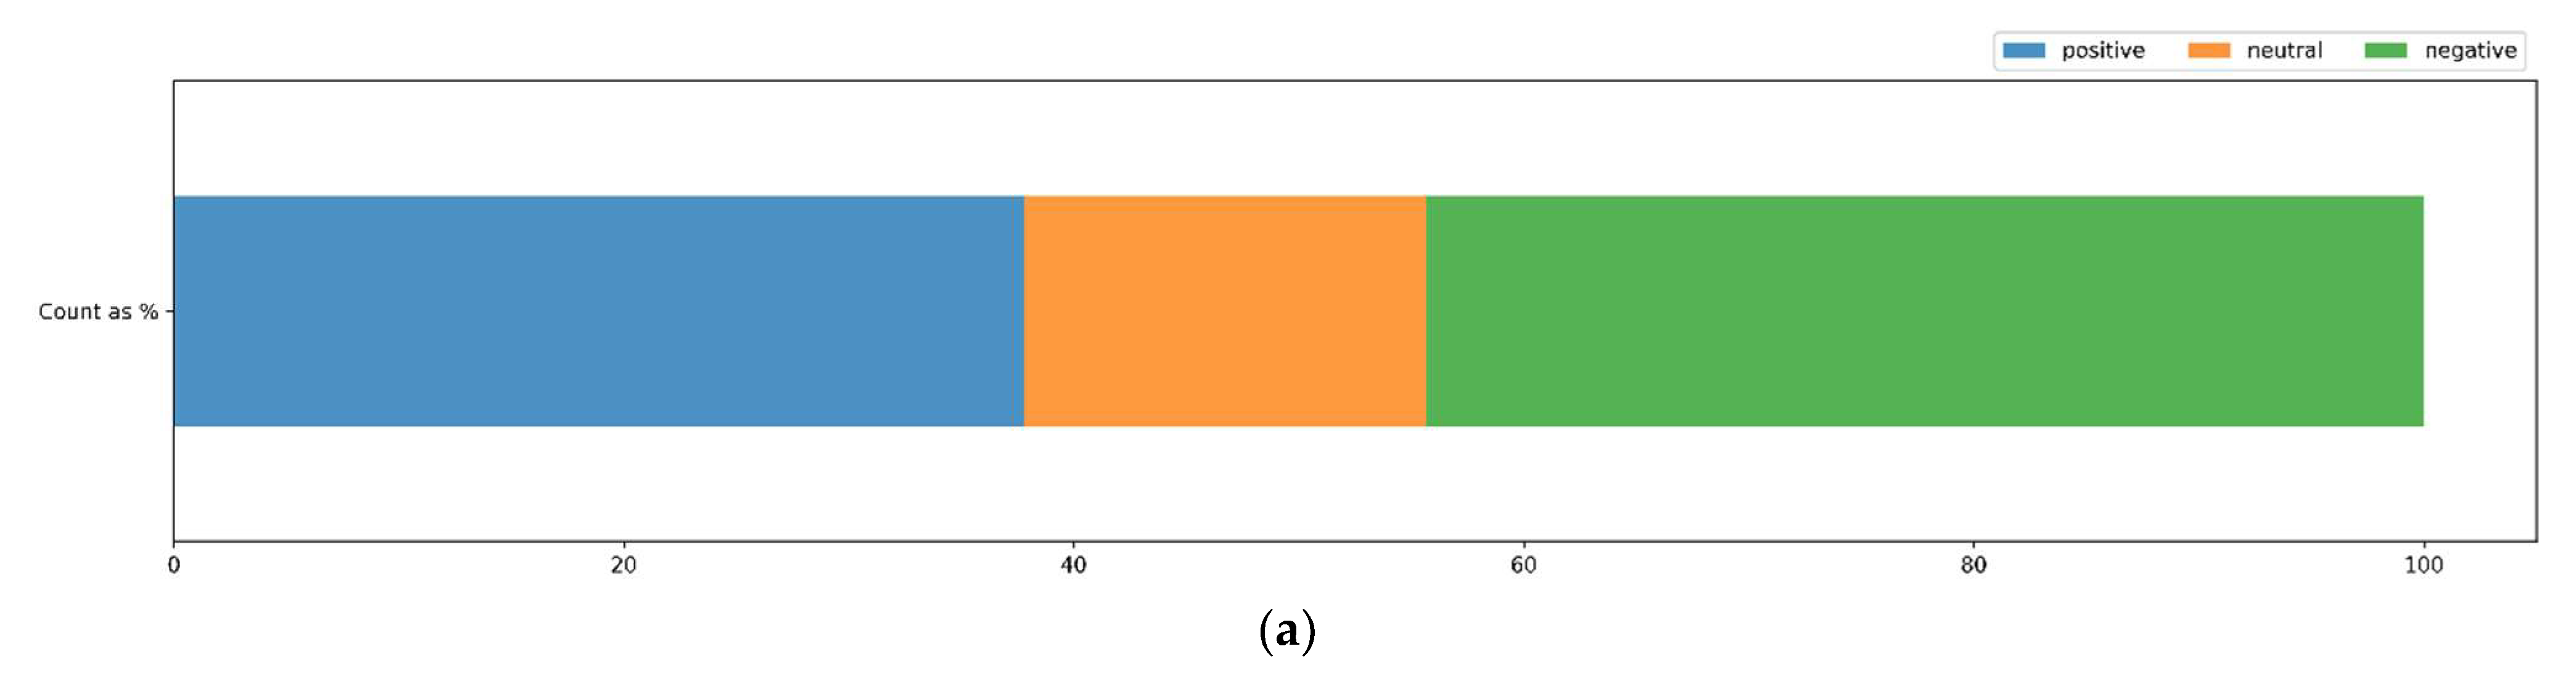
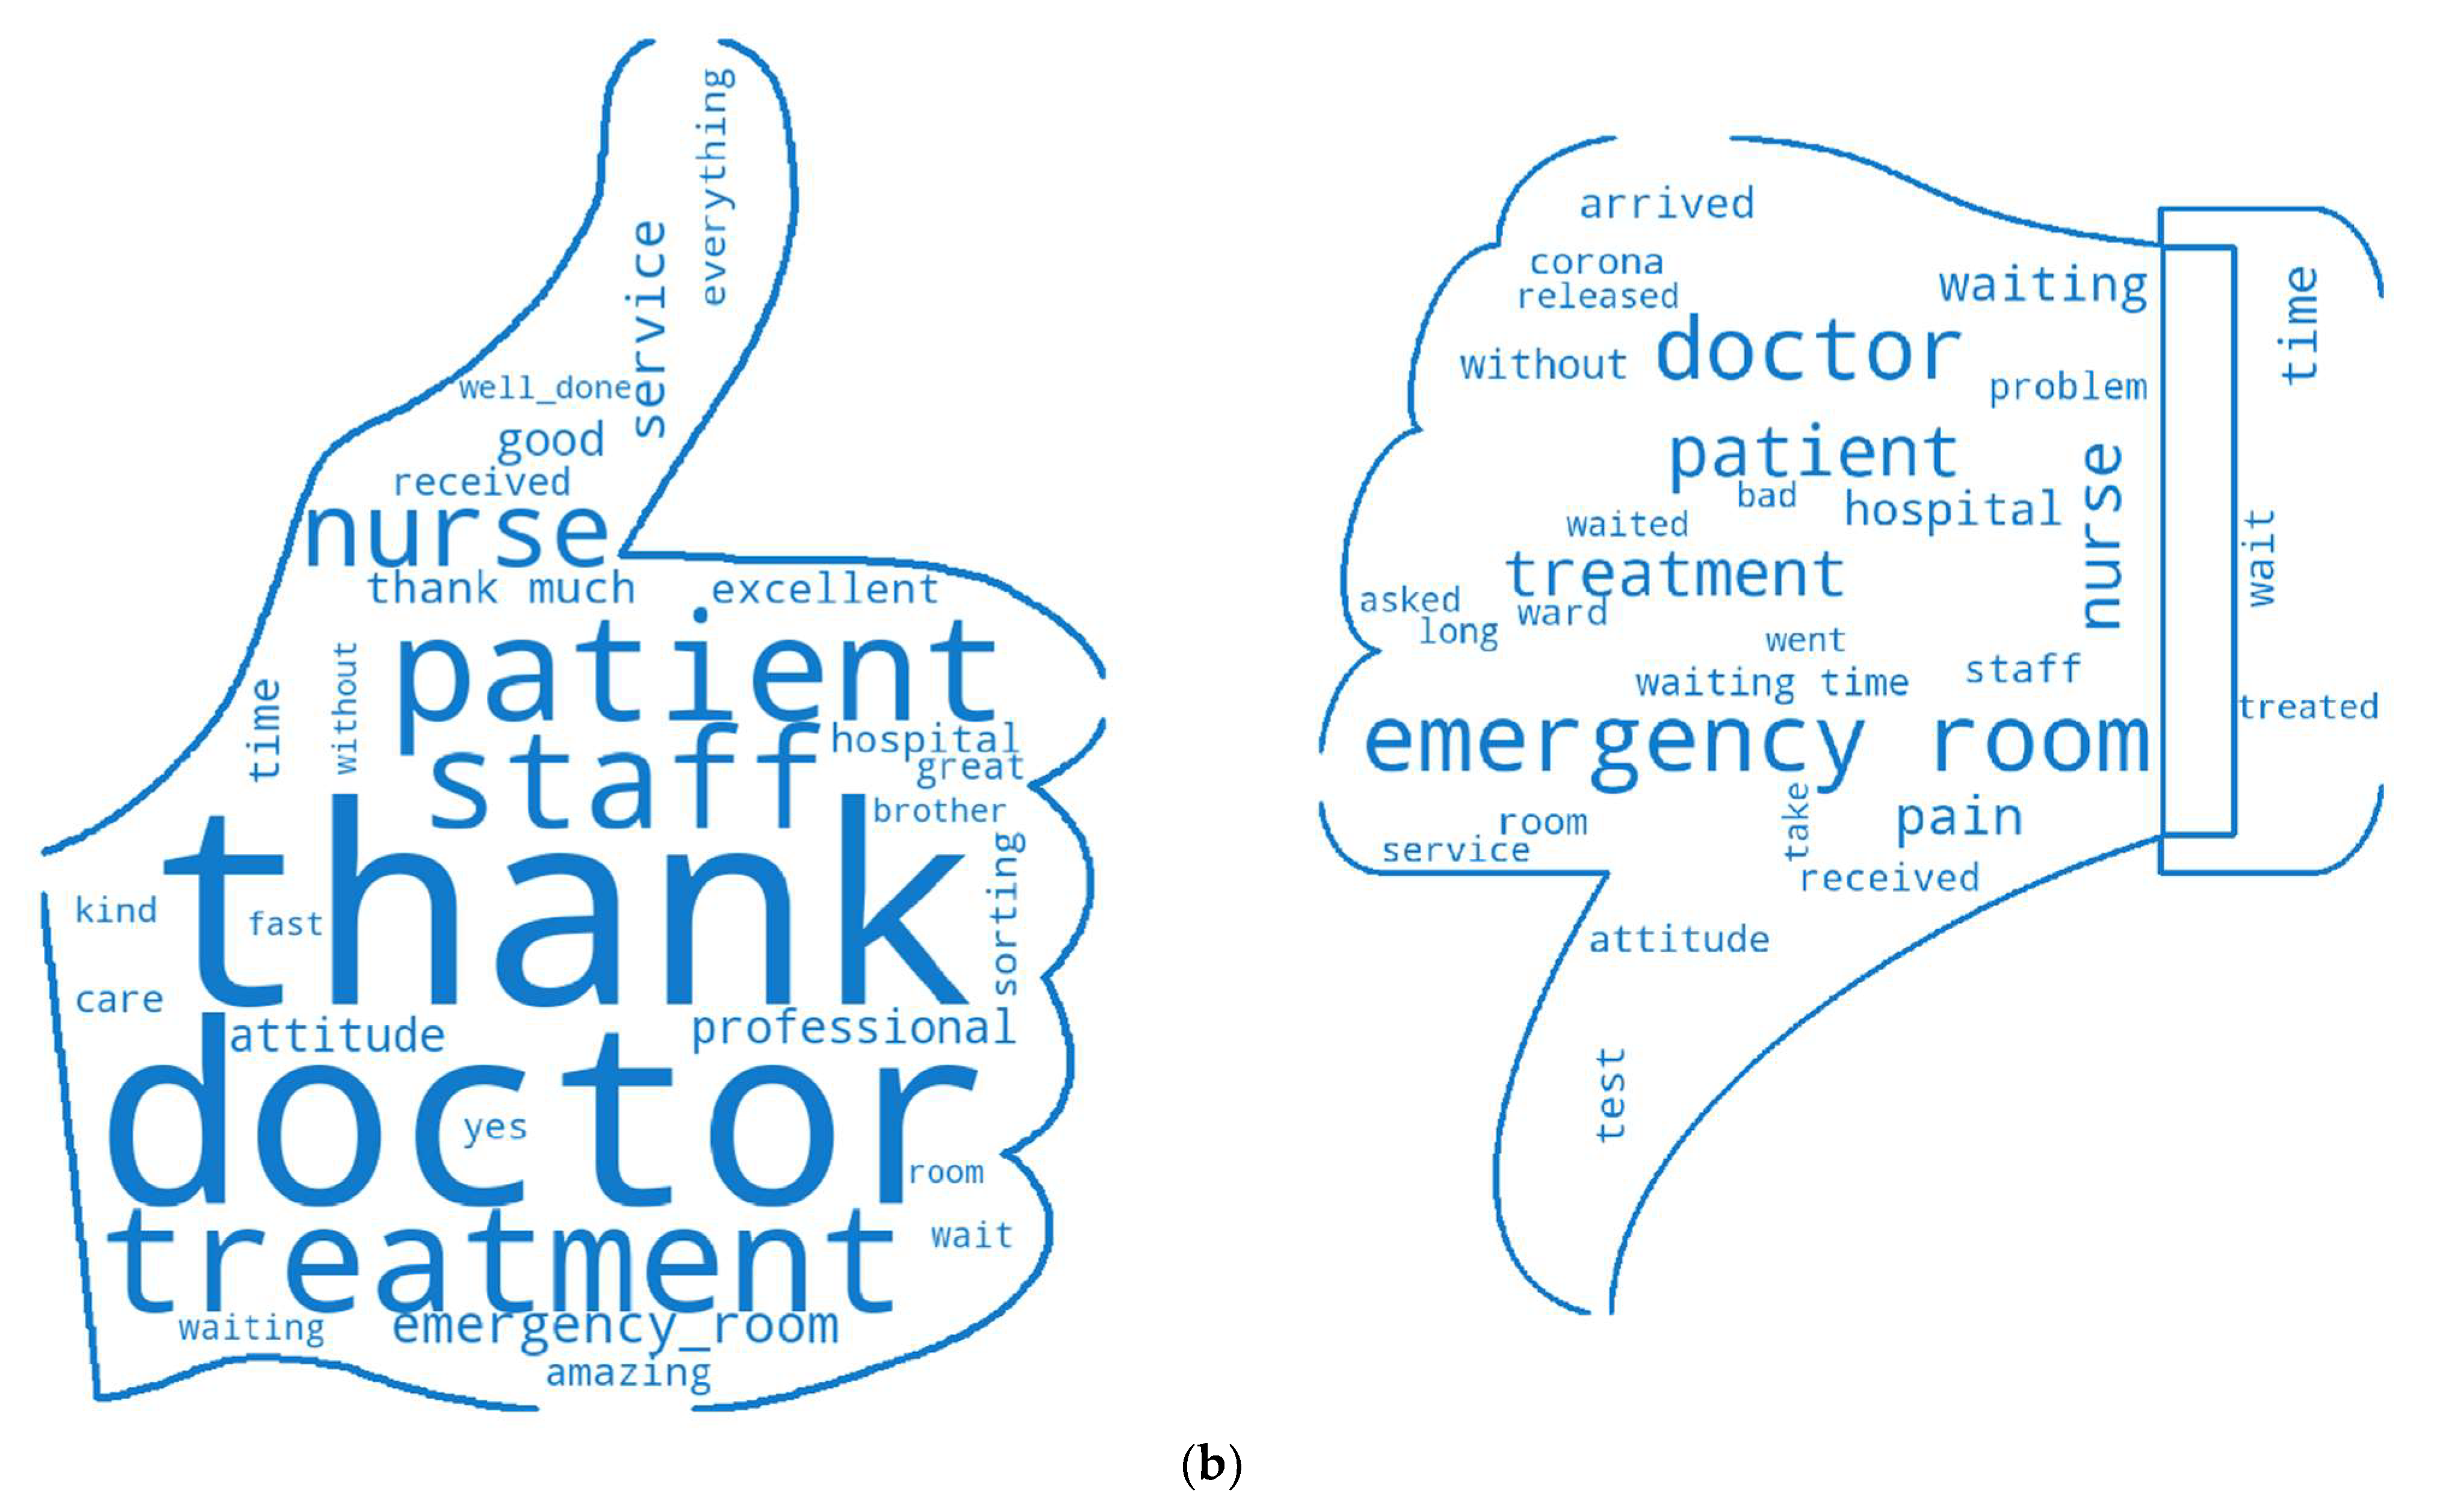
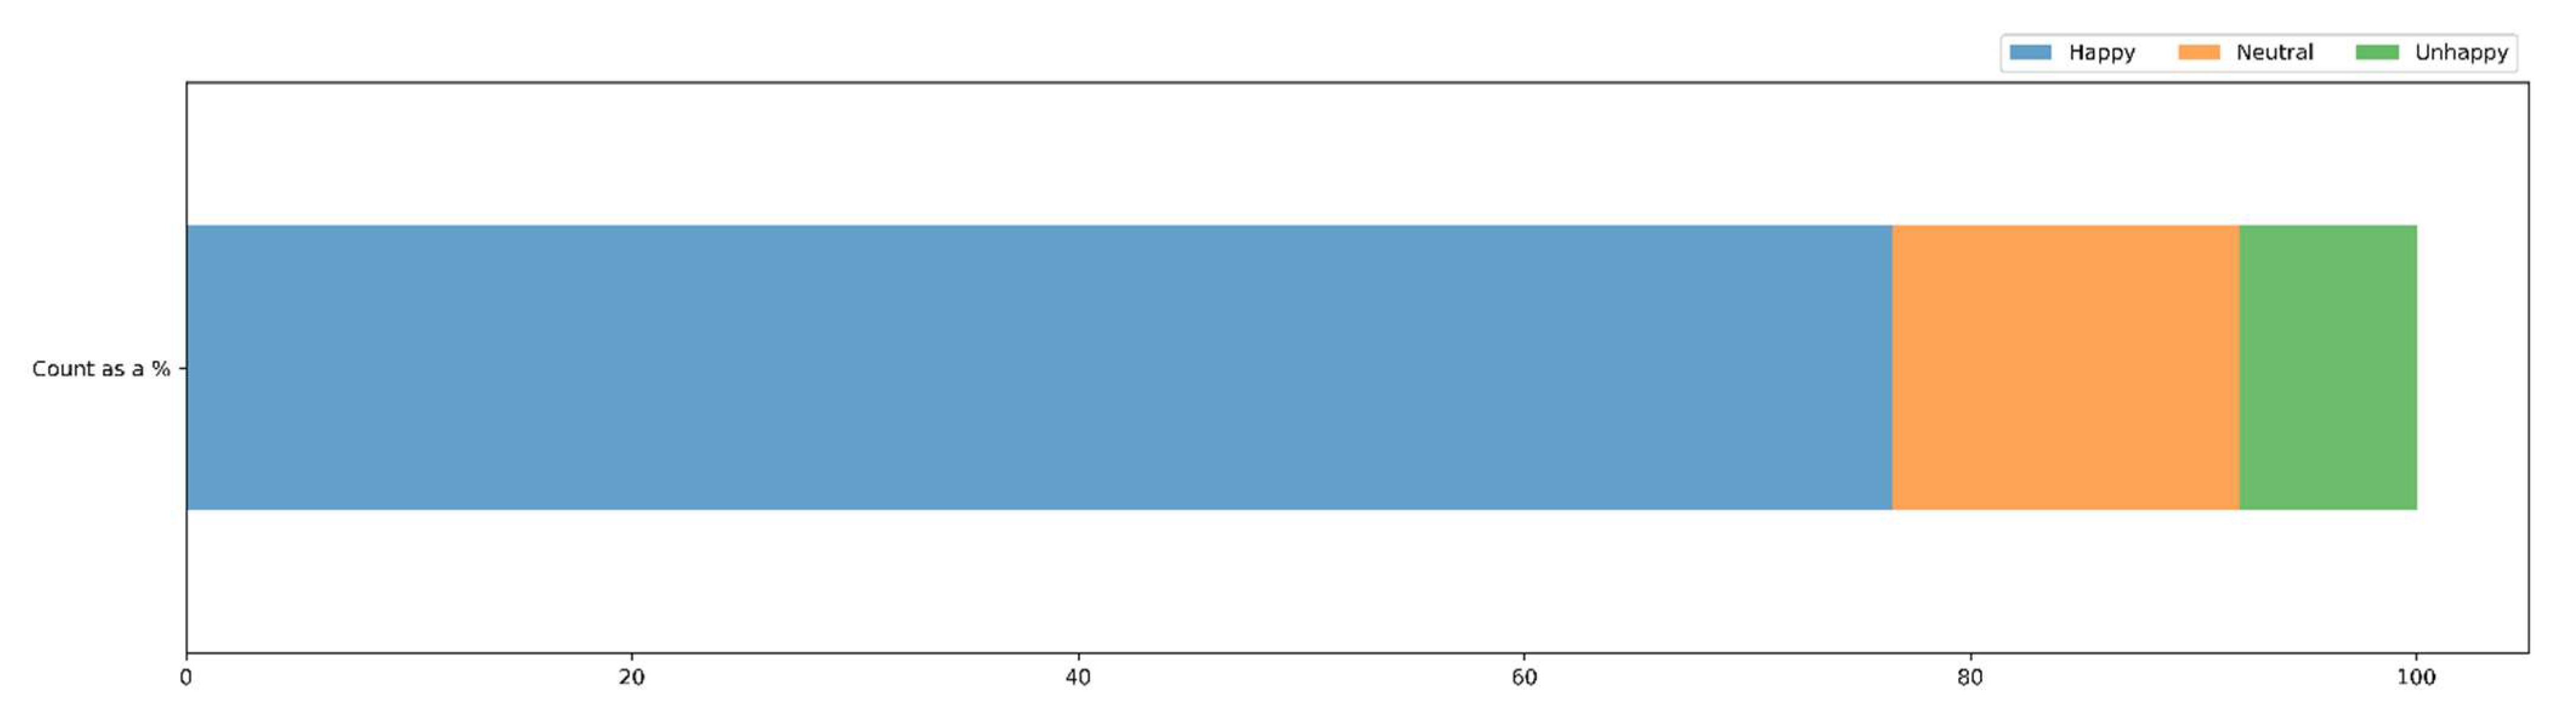
Patients’ Satisfaction Data Analysis

In recent years, sentiment analysis has become a popular method of identifying consumers’ attitudes, opinions, or emotions about a particular product or service. In healthcare, patients possess strong sentiments towards the service they receive and it triggers a positive, negative, or neutral reaction. To better understand the patient ED experience in the hospital, we analyzed patient data from 7862 individuals, collected through their mobile application. The data were used to recognize overall patient satisfaction towards the entire ED network. Satisfaction survey data contain patient rating scores ranging from low (1) to high (5), with satisfaction data depicting how they feel (happy, unhappy, or neutral) towards the service that they received, and text reviews describing their experience.
A 65.78% proportion of the total of 7862 patients who rated their experience gave 5 stars for the service they received, and only 2.63% rated the service with 0 stars. (Figure 8a). We also calculated the mean rating for each month in all consecutive months from May 2020 to March 2021 (Figure 8b). The results indicate the mean rating in June 2020 significantly decreased compared to other months. This could be due to extreme COVID-19 prevention measurements that the whole world imposed in not only healthcare facilities but also in every business, which directly impacted normal day-to-day functioning for patients.
Satisfaction data reveal that, of the 7749 patients who responded, 76.47% were happy about the service they received from the ED. A 15.58% proportion responded that they were neutral, and only 7.95% were unhappy with their ED experience (Figure 9). Since over 76% of the respondents were happy about the service, one can conclude that the hospital has a good reputation among its customers.
Only 4130 patients of 7862 who used the mobile application provided a text review and these data reveal patients’ opinions and feelings in more detail. Hence, review data can be used to unlock deeper insights into patients’ needs. Polarity scores of patient text reviews were calculated using VADER (Valence Aware Dictionary and sEntiment Reasoner), which is a lexicon- and rule-based sentiment analysis tool specifically adapted for sentiments expressed on social media [54]. It is used to quantify how much positive, negative, or neutral emotion the review text has without preprocessing the data since it includes features that weight emoticon use, capitalization, punctuation, and other text-based mechanisms used by people to emote their feelings. The compound score of VADER is the sum of positive, negative, and neutral scores, which is then normalized between −1 (most extreme negative) and +1 (most extreme positive). The closer a compound score is to +1, the higher the positivity of the review. From 4130 text reviews provided, 37.88% were positive (compound score > 0), 44.42% were negative (compound score < 0), and 17.17% were neutral (compound score = 0). See Figure 10.
A Word Cloud is an excellent way to visually interpret text, and is useful for gaining insight from a given text by visualizing the word frequency in the text as a weighted list. We used reviews differentiated above as positive and negative using the VADER compound score to create the word clouds depicted in Figure 10a,b. The weighted words in each cloud represent the prominent topics related to the polarity (positive/negative). The data also are represented in Table 6, which displays the 15 most common words used in positive and negative reviews.

4. Conclusions

Developing a TVG based on a patient journey through an ED is an important and impactful area for analysis within medical facilities. It is crucial in health analytics to understand both general factors and unique influences that define relationships between events that result in a specific end. Using knowledge graphs over time allows hospital administrators to glean insights into whether patient flow patterns might display certain trends, seasonal or other variations, and potential challenges such variations might impose for EDs. Additionally, knowledge graphing, including visualizations of subgraphs, can help enhance administrators’ understanding of flow processes, units that are most in demand, units where patients spend the most of their time, and what constitutes system constraint. This approach also offers promise for better understanding the individual impacts of physicians and nurses engaged in specific patient ED processes. This information can be further illuminated using other unstructured data analytics techniques such as sentiment analysis and word clouds. Specifically, by analyzing sentiment data at the node level, problem areas can be identified and managed to preempt system problems or shortcomings. In summary, these techniques help develop better information for decision makers, ultimately resulting in better patient care and outcomes.

4.1. Contributions to Practice

Using a TVG approach to modeling an ED offers several contributions to practice. While our model is specific to the system studied, the methodology and application of the model are transferable. For example, a temporal network model can be used by administrators to redesign patient flows to avoid bottlenecks and constrained resources in a time-sensitive manner. Likewise, this type of model can be used to examine responses of the system to external disturbances and unexpected circumstances (such as ones caused by COVID-19). The current model can identify system bottlenecks, and this may inform service improvement initiatives in both specific and holistic ways. Developing a TVG model shows structural vulnerabilities that may not be apparent without considering its temporal nature. Since the data for this study were derived from electronic record systems, future integration in a real-time manner may provide both long-term and short-term managerial planning advantages.

4.2. Limitations

The updates for some events in the system were completed by nurses or doctors after a delay due to their pressing needs to deal with patient issues. Therefore, the duration between events and path sequences might not always reflect the true duration and sequence.

4.3. Medical Ethics

All research in this article was conducted according to the World Medical Association Declaration of Helsinki. No identifiable characteristics of study subjects were used.

Author Contributions

I.R.—conceptualization; formal analysis; methodology; project administration; resources; software; supervision; validation; visualization; roles/writing—original draft; writing—review and editing. R.M.—conceptualization; formal analysis; project administration; resources; supervision; validation; visualization; roles/writing—original draft; writing—review and editing. S.B.—conceptualization; investigation; methodology; resources; supervision; validation; visualization; roles/writing—original draft. K.W.—data curation; formal analysis; investigation; methodology; software; visualization; writing—review and editing. N.A.—conceptualization; formal analysis; investigation; methodology; writing—roles/writing—original draft. A.N.—conceptualization; data curation; investigation; resources; validation; roles/writing—original draft; writing—review and editing. All authors have read and agreed to the published version of the manuscript.

Funding

This research received no external funding but was part of a research collaboration between Ariel University, Florida Atlantic University, and Kansas State University.

Institutional Review Board Statement

The study was conducted in accordance with the Declaration of Helsinki. No personalized data was used in this study.

Informed Consent Statement

No personalized data was obtained for this study so patient consent was not required.

Data Availability Statement

The data used in this study are housed at Hillel Yaffe Medical Center in Israel.

Conflicts of Interest

The authors declare no conflict of interest.

References

  1. Rathert, C.; Wyrwich, M.D.; Boren, S.A. Patient-Centered Care and Outcomes: A Systematic Review of the Literature. Med. Care Res. Rev. 2013, 70, 351–379. [Google Scholar] [CrossRef] [PubMed]
  2. Hearld, L.R.; Alexander, J.A. Patient-Centered Care and Emergency Department Utilization: A Path Analysis of the Mediating Effects of Care Coordination and Delays in Care. Med. Care Res. Rev. 2012, 69, 560–580. [Google Scholar] [CrossRef] [PubMed]
  3. Pham, J.C.; Seth Trueger, N.; Hilton, J.; Khare, R.K.; Smith, J.P.; Bernstein, S.L. Interventions to Improve Patient-Centered Care during Times of Emergency Department Crowding. Acad. Emerg. Med. 2011, 18, 1289–1294. [Google Scholar] [CrossRef] [PubMed]
  4. Sariyer, G.; Ataman, M.G. The Likelihood of Requiring a Diagnostic Test: Classifying Emergency Department Patients with Logistic Regression. Health Inf. Manag. J. 2022, 51, 13–22. [Google Scholar] [CrossRef]
  5. Huang, Q.; Zhao, C.; Zhang, X.; Wang, X.; Yi, D. Centrality Measures in Temporal Networks with Time Series Analysis. EPL Europhys. Lett. 2017, 118, 36001. [Google Scholar] [CrossRef]
  6. Khurana, U. An Introduction to Temporal Graph Data Management. Ph.D. Thesis, Computer Science Department, University of Maryland, College Park, MD, USA, 2012. Available online: https//www.cs.umd.edu/sites/default/files/scholarly_papers/Khurana_SchPaper_1.pdf (accessed on 20 April 2022).
  7. Tong, H.; Papadimitriou, S.; Philip, S.Y.; Faloutsos, C. Proximity Tracking on Dynamic Bipartite Graphs: Problem Definitions and Fast Solutions. In Link Mining: Models, Algorithms, and Applications; Springer: Berlin/Heidelberg, Germany, 2010; pp. 211–236. [Google Scholar]
  8. Rossi, R.A.; Gallagher, B.; Neville, J.; Henderson, K. Modeling Dynamic Behavior in Large Evolving Graphs. In Proceedings of the Sixth ACM International Conference on Web Search and Data Mining, Rome, Italy, 4–8 February 2013; pp. 667–676. [Google Scholar]
  9. Yang, Y.; Yu, J.X.; Gao, H.; Pei, J.; Li, J. Mining Most Frequently Changing Component in Evolving Graphs. World Wide Web 2014, 17, 351–376. [Google Scholar] [CrossRef]
  10. Yang, J.; Leskovec, J. Patterns of Temporal Variation in Online Media. In Proceedings of the Fourth ACM International Conference on Web Search and Data Mining, Hong Kong, China, 9–12 February 2011; pp. 177–186. [Google Scholar]
  11. Pereira, F.S.F.; de Amo, S.; Gama, J. Evolving Centralities in Temporal Graphs: A Twitter Network Analysis. In Proceedings of the 2016 17th IEEE International Conference on Mobile Data Management (MDM), Porto, Portugal, 13–16 June 2016; Volume 2, pp. 43–48. [Google Scholar]
  12. Aridhi, S.; Montresor, A.; Velegrakis, Y. BLADYG: A Graph Processing Framework for Large Dynamic Graphs. Big Data Res. 2017, 9, 9–17. [Google Scholar] [CrossRef] [Green Version]
  13. Koloniari, G.; Pitoura, E. Partial View Selection for Evolving Social Graphs. In Proceedings of the First International Workshop on Graph Data Management Experiences and Systems, New York, NY, USA, 23 June 2013; pp. 1–6. [Google Scholar]
  14. Jalili, M.; Salehzadeh-Yazdi, A.; Gupta, S.; Wolkenhauer, O.; Yaghmaie, M.; Resendis-Antonio, O.; Alimoghaddam, K. Evolution of Centrality Measurements for the Detection of Essential Proteins in Biological Networks. Front. Physiol. 2016, 7, 375. [Google Scholar] [CrossRef] [Green Version]
  15. Leventhal, G.E.; Hill, A.L.; Nowak, M.A.; Bonhoeffer, S. Evolution and Emergence of Infectious Diseases in Theoretical and Real-World Networks. Nat. Commun. 2015, 6, 6101. [Google Scholar] [CrossRef] [Green Version]
  16. Magnien, C.; Tarissan, F. Time Evolution of the Importance of Nodes in Dynamic Networks. In Proceedings of the 2015 IEEE/ACM International Conference on Advances in Social Networks Analysis and Mining (ASONAM), Paris, France, 25–28 August 2015; pp. 1200–1207. [Google Scholar]
  17. Starnini, M.; Machens, A.; Cattuto, C.; Barrat, A.; Pastor-Satorras, R. Immunization Strategies for Epidemic Processes in Time-Varying Contact Networks. J. Theor. Biol. 2013, 337, 89–100. [Google Scholar] [CrossRef] [Green Version]
  18. Karimi, F.; Matous, P. Mapping Diversity and Inclusion in Student Societies: A Social Network Perspective. Comput. Human Behav. 2018, 88, 184–194. [Google Scholar] [CrossRef]
  19. Blondel, V.D.; Guillaume, J.-L.; Lambiotte, R.; Lefebvre, E. Fast Unfolding of Communities in Large Networks. J. Stat. Mech. Theory Exp. 2008, 2008, P10008. [Google Scholar] [CrossRef] [Green Version]
  20. Yarlagadda, R.; Pinnaka, S.; Etinkaya, E.K.Ç. A Time-Evolving Weighted-Graph Analysis of Global Petroleum Exchange. In Proceedings of the 2015 7th International Workshop on Reliable Networks Design and Modeling (RNDM), Munich, Germany, 5–7 October 2015; pp. 266–273. [Google Scholar]
  21. Von Landesberger, T.; Brodkorb, F.; Roskosch, P.; Andrienko, N.; Andrienko, G.; Kerren, A. Mobilitygraphs: Visual Analysis of Mass Mobility Dynamics via Spatio-Temporal Graphs and Clustering. IEEE Trans. Vis. Comput. Graph. 2015, 22, 11–20. [Google Scholar] [CrossRef] [PubMed] [Green Version]
  22. Qi, X.; Liu, L.; Cai, G.; Xie, M. A Topology Evolution Model Based on Revised PageRank Algorithm and Node Importance for Wireless Sensor Networks. Math. Probl. Eng. 2015, 2015, 165136. [Google Scholar] [CrossRef] [Green Version]
  23. Glacet, C.; Fiore, M.; Gramaglia, M. Temporal Connectivity of Vehicular Networks: The Power of Store-Carry-and-Forward. In Proceedings of the 2015 IEEE Vehicular Networking Conference (VNC), Kyoto, Japan, 16–18 December 2015; pp. 52–59. [Google Scholar]
  24. Küçükkeçeci, C.; Yazici, A. Big Data Model Simulation on a Graph Database for Surveillance in Wireless Multimedia Sensor Networks. Big Data Res. 2018, 11, 33–43. [Google Scholar] [CrossRef] [Green Version]
  25. Liao, C.-H.; Chen, M.-Y. Building Social Computing System in Big Data: From the Perspective of Social Network Analysis. Comput. Hum. Behav. 2019, 101, 457–465. [Google Scholar] [CrossRef]
  26. Brunson, J.C.; Laubenbacher, R.C. Applications of Network Analysis to Routinely Collected Health Care Data: A Systematic Review. J. Am. Med. Inform. Assoc. 2018, 25, 210–221. [Google Scholar] [CrossRef]
  27. McHaney-Lindstrom, M.; Hebert, C.; Flaherty, J.; Mangino, J.E.; Moffatt-Bruce, S.; Root, E.D. Analysis of Intra-Hospital Transfers and Hospital Onset Clostridium Difficile Infection. J. Hosp. Infect. 2019, 102, 168–169. [Google Scholar] [CrossRef]
  28. Kohler, K.; Ercole, A. Characterising Complex Healthcare Systems Using Network Science: The Small World of Emergency Surgery. arXiv 2019, arXiv:1908.01688. [Google Scholar]
  29. Kohler, K.; Ercole, A. Can Network Science Reveal Structure in a Complex Healthcare System? A Network Analysis Using Data from Emergency Surgical Services. BMJ Open 2020, 10, e034265. [Google Scholar] [CrossRef] [Green Version]
  30. McHaney-Lindstrom, M.; Hebert, C.; Miller, H.; Moffatt-Bruce, S.; Root, E. Network Analysis of Intra-Hospital Transfers and Hospital Onset Clostridium Difficile Infection. Health Inf. Libr. J. 2020, 37, 26–34. [Google Scholar] [CrossRef] [PubMed]
  31. Zhang, C.; Eken, T.; Jørgensen, S.B.; Thoresen, M.; Søvik, S. Effects of Patient-Level Risk Factors, Departmental Allocation and Seasonality on Intrahospital Patient Transfer Patterns: Network Analysis Applied on a Norwegian Single-Centre Data Set. BMJ Open 2022, 12, e054545. [Google Scholar] [CrossRef] [PubMed]
  32. Bean, D.M.; Stringer, C.; Beeknoo, N.; Teo, J.; Dobson, R.J.B. Network Analysis of Patient Flow in Two UK Acute Care Hospitals Identifies Key Sub-Networks for A&E Performance. PLoS ONE 2017, 12, e0185912. [Google Scholar]
  33. Lim, M.E.; Nye, T.; Bowen, J.M.; Hurley, J.; Goeree, R.; Tarride, J.-E. Mathematical Modeling: The Case of Emergency Department Waiting Times. Int. J. Technol. Assess. Health Care 2012, 28, 93–109. [Google Scholar] [CrossRef]
  34. Wiler, J.L.; Bolandifar, E.; Griffey, R.T.; Poirier, R.F.; Olsen, T. An Emergency Department Patient Flow Model Based on Queueing Theory Principles. Acad. Emerg. Med. 2013, 20, 939–946. [Google Scholar] [CrossRef]
  35. Maduako, I.; Wachowicz, M.; Hanson, T. STVG: An Evolutionary Graph Framework for Analyzing Fast-Evolving Networks. J. Big Data 2019, 6, 55. [Google Scholar] [CrossRef]
  36. Li, L.; Wang, P.; Yan, J.; Wang, Y.; Li, S.; Jiang, J.; Sun, Z.; Tang, B.; Chang, T.-H.; Wang, S.; et al. Real-World Data Medical Knowledge Graph: Construction and Applications. Artif. Intell. Med. 2020, 103, 101817. [Google Scholar] [CrossRef]
  37. Barnett, G.O.; Cimino, J.J.; Hupp, J.A.; Hoffer, E.P. DXplain: An Evolving Diagnostic Decision-Support System. JAMA 1987, 258, 67–74. [Google Scholar] [CrossRef]
  38. Bisson, L.J.; Komm, J.T.; Bernas, G.A.; Fineberg, M.S.; Marzo, J.M.; Rauh, M.A.; Smolinski, R.J.; Wind, W.M. Accuracy of a Computer-Based Diagnostic Program for Ambulatory Patients with Knee Pain. Am. J. Sports Med. 2014, 42, 2371–2376. [Google Scholar] [CrossRef]
  39. Miller, R.A. Medical Diagnostic Decision Support Systems—Past, Present, and Future: A Threaded Bibliography and Brief Commentary. J. Am. Med. Inform. Assoc. 1994, 1, 8–27. [Google Scholar] [CrossRef] [Green Version]
  40. Wang, M.; Liu, M.; Liu, J.; Wang, S.; Long, G.; Qian, B. Safe Medicine Recommendation via Medical Knowledge Graph Embedding. arXiv 2017, arXiv:1710.05980. [Google Scholar]
  41. Gann, B. Giving Patients Choice and Control: Health Informatics on the Patient Journey. Yearb. Med. Inform. 2012, 21, 70–73. [Google Scholar] [CrossRef] [Green Version]
  42. Tang, H.; Ng, J.H.K. Googling for a Diagnosis—Use of Google as a Diagnostic Aid: Internet Based Study. BMJ 2006, 333, 1143–1145. [Google Scholar] [CrossRef] [PubMed] [Green Version]
  43. Robinson, I.; Webber, J.; Eifrem, E. Graph Databases: New Opportunities for Connected Data; O’Reilly Media, Inc.: Newton, MA, USA, 2013. [Google Scholar]
  44. Kaur, K.; Rani, R. Modeling and Querying Data in NoSQL Databases. In Proceedings of the 2013 IEEE International Conference on Big Data, Silicon Valley, CA, USA, 6–9 October 2013; pp. 1–7. [Google Scholar]
  45. Maduako, I.; Cavalheri, E.; Wachowicz, M. Exploring the Use of Time-Varying Graphs for Modelling Transit Networks. arXiv 2018, arXiv:1803.07610. [Google Scholar]
  46. Ajami, S.; Ketabi, S.; Yarmohammadian, M.H.; Bagherian, H. Waiting Time in Emergency Department by Simulation. In Proceedings of the ITCH, Victoria, BC, Canada, 24–27 February 2011; pp. 196–200. [Google Scholar]
  47. Brysiewicz, P.; Emmamally, W. Focusing on Families in the Emergency Department. Int. Emerg. Nurs. 2017, 100, 1–2. [Google Scholar] [CrossRef]
  48. Cypress, B.S. The Emergency Department: Experiences of Patients, Families, and Their Nurses. Adv. Emerg. Nurs. J. 2014, 36, 164–176. [Google Scholar] [CrossRef]
  49. Kash, B.; McKahan, M. The Evolution of Measuring Patient Satisfaction. J. Prim. Health Care Gen. Pract. 2017, 4, 2. [Google Scholar]
  50. Iwanowski, P.; Budaj, A.; Członkowska, A.; Wasek, W.; Kozłowska-Boszko, B.; Olekedzka, U.; Masełbas, W. Informed Consent for Clinical Trials in Acute Coronary Syndromes and Stroke Following the European Clinical Trials Directive: Investigators’ Experiences and Attitudes. Trials 2008, 9, 45. [Google Scholar] [CrossRef] [Green Version]
  51. Wilets, I.; O’Rourke, M.; Nassisi, D. How Patients and Visitors to an Urban Emergency Department View Clinical Research. Acad. Emerg. Med. 2003, 10, 1081–1085. [Google Scholar] [CrossRef]
  52. Flynn, D.; Knoedler, M.A.; Hess, E.P.; Murad, M.H.; Erwin, P.J.; Montori, V.M.; Thomson, R.G. Engaging Patients in Health Care Decisions in the Emergency Department through Shared Decision-Making: A Systematic Review. Acad. Emerg. Med. 2012, 19, 959–967. [Google Scholar] [CrossRef]
  53. Edwards, B.; Hofmeyr, S.; Stelle, G.; Forrest, S. Internet Topology over Time. arXiv 2012, arXiv:1202.3993. [Google Scholar]
  54. Borg, A.; Boldt, M. Using VADER Sentiment and SVM for Predicting Customer Response Sentiment. Expert Syst. Appl. 2020, 162, 113746. [Google Scholar] [CrossRef]
Figure 1. TVG model for patient flow network schema.
Mathematics 10 01526 g001
Figure 2. Example patient flow in ED for case number 11067087.
Mathematics 10 01526 g002
Figure 3. (a) Top 10 busiest hospital units queried based on all ‘TO’ edges. (b) Top 10 busiest consulting units queried based on all ‘ORDER_TO’ edges.
Mathematics 10 01526 g003
Figure 4. (a) Bar chart of Top 10 hospital units with highest hospitalizations. (b) Neo4j bloom graph visualization showing the same.
Mathematics 10 01526 g004
Figure 5. Average duration for each event type.
Mathematics 10 01526 g005
Figure 6. (a) Frequency of number of events during patient ED journey. Max. = 39, min. = 2, and ave. ~ 8. (b) Frequency distribution of duration of patient ED journey.
Mathematics 10 01526 g006aMathematics 10 01526 g006b
Figure 7. (a) Total duration grouped by hour. (b) Duration of patient drive by day of the week. The number 1 represents Monday and 7 represents Sunday.
Mathematics 10 01526 g007
Figure 8. (a) Rating distribution of patients who rated the service via the mobile application. (b) Mean rating given by patients for all consecutive months from May 2020 to March 2021.
Mathematics 10 01526 g008
Figure 9. Percentages of the satisfaction data.
Mathematics 10 01526 g009
Figure 10. (a) Polarity percentages of 4130 review texts. (b) Word clouds of positive and negative reviews.
Mathematics 10 01526 g010aMathematics 10 01526 g010b
Table 1. Event type classification.
EVENT_TYPE_DESCCount
Administrative Reception63,895
Consultation Order22,742
Consultation Perform22,748
Discharge43,429
Doctor Examination End62,234
Home Hospitalization2
Hospitalization18,770
Imaging Test Perform17,870
Left Before Completion928
Nurse Examination End71,034
Nurse Triage End63,688
Ordering Imaging Tests20,967
Ordering Laboratory Tests117,546
Passed Away102
Refusal of Admission1367
Transfer601
Ward Update8970
Total536,893
Table 2. The number of events, the path sequence, the total duration of the journey, and the day and the hour patient journey started through their ED experience.
Case NumberEvent CountTotal DurationHourDay of WeekPath Sequence
1110667655177.4154[Administrative Reception, Nurse Triage End, Nurse Examination End, Doctor Examination End, Discharge]
2110667946297.0174[Administrative Reception, Nurse Triage End, Doctor Examination End, Nurse Examination End, Hospitalization, Ward Update]
311066740683.0174[Doctor Examination End, Consultation Perform, Consultation Order, Consultation Order, Consultation Perform, Discharge]
4110667898279.0174[Administrative Reception, Nurse Triage End, Nurse Examination End, Doctor Examination End, Hospitalization, Consultation Order, Consultation Perform, Hospitalization]
51106677540.05174[Nurse Triage End, Nurse Examination End, Doctor Examination End, Discharge]
611066791531.0174[Administrative Reception, Nurse Triage End, Nurse Examination End, Doctor Examination End, Discharge]
711066733289.0174[Consultation Perform, Discharge]
8110667735277.0174[Nurse Triage End, Nurse Examination End, Doctor Examination End, Consultation Order, Discharge]
911066792793.0174[Administrative Reception, Nurse Triage End, Nurse Examination End, Consultation Order, Doctor Examination End, Consultation Perform, Discharge]
1011066730229.0174[Doctor Examination End, Discharge]
Table 3. Top 10 most frequent journey sequences in the hospital ED network.
PathFreq.
1[Administrative Reception, Nurse Triage End, Nurse Examination End, Doctor Examination End, Discharge]13,487
2[Administrative Reception, Nurse Triage End, Nurse Examination End, Ordering Laboratory Tests, Ordering Laboratory Tests, Ordering Laboratory Tests, Ordering Laboratory Tests, Doctor Examination End, Discharge]960
3[Administrative Reception, Nurse Triage End, Nurse Examination End, Doctor Examination End, Hospitalization]939
4[Administrative Reception, Nurse Triage End, Nurse Examination End, Doctor Examination End, Consultation Order, Consultation Perform, Discharge]904
5[Administrative Reception, Nurse Triage End, Nurse Examination End, Doctor Examination End, Ordering Imaging Tests, Imaging Test Perform, Discharge]870
6[Administrative Reception, Nurse Triage End, Nurse Examination End, Doctor Examination End, Hospitalization, Ward Update]858
7[Administrative Reception, Nurse Triage End, Nurse Examination End, Ordering Laboratory Tests, Ordering Laboratory Tests, Ordering Laboratory Tests, Ordering Laboratory Tests, Ordering Laboratory Tests, Doctor Examination End, Discharge]822
8[Administrative Reception, Nurse Triage End, Nurse Examination End, Ordering Laboratory Tests, Ordering Laboratory Tests, Ordering Laboratory Tests, Doctor Examination End, Discharge]814
9[Administrative Reception, Nurse Triage End, Doctor Examination End, Discharge]800
10[Administrative Reception, Nurse Examination End, Nurse Triage End, Doctor Examination End, Discharge]648
Table 4. Top five most common before and after three-consecutive-event sequences of a hospitalized patient.
Three-Consecutive-Event SequencesFrequency
Before
Hospitalization
[“Nurse Triage End”, “Nurse Examination End”, “Doctor Examination End”] 2788
[“Ordering Laboratory Tests”, “Ordering Laboratory Tests”, “Doctor Examination End”]1643
[“Ordering Laboratory Tests”, “Ordering Laboratory Tests”, “Ordering Laboratory Tests”]1313
[“Doctor Examination End”, “Consultation Order”, “Consultation Perform”]879
[“Doctor Examination End”, “Ordering Imaging Tests”, “Imaging Test Perform”]619
After
Hospitalization
[“Ordering Laboratory Tests”, “Ordering Laboratory Tests”, “Ordering Laboratory Tests”]790
[“Nurse Examination End”, “Ordering Laboratory Tests”, “Ordering Laboratory Tests”]104
[“Ordering Laboratory Tests”, “Ordering Laboratory Tests”, “Ward Update”]74
[“Consultation Order”, “Consultation Perform”, “Ward Update”]46
[“Ordering Laboratory Tests”, “Ward Update”, “Consultation Perform”]45
Table 5. Top five most common events that happened before ‘Consultation Order’ and after ‘Consultation Perform’.
Event before Consultation OrderFrequency
“Doctor Examination End”8760
“Nurse Examination End”3366
“Consultation Order”2534
“Ordering Laboratory Tests”2232
“Ordering Imaging Tests”1428
Event after Consultation PerformFrequency
“Discharge”7931
“Hospitalization”3455
“Doctor Examination End”2382
“Consultation Perform”2061
“Consultation Order”1325
Table 6. Frequencies of top 15 words used in positive and negative reviews.
Top 15 PositiveTop 15 Negative
WordFrequencyWordFrequency
1doctor425room563
2thank366emergency511
3treatment309doctor449
4patient285time293
5nurse282patient277
6staff271treatment240
7everything253nurse209
8service245waiting194
9time226pain182
10emergency room206long152
11excellent205test140
12good201wait119
13attitude194hospital114
14thanks181arrived109
15professional181without107
Publisher’s Note: MDPI stays neutral with regard to jurisdictional claims in published maps and institutional affiliations.

