
A Hybrid Analytic Hierarchy Process and Likert Scale Approach for the Quality Assessment of Medical Education Programs

 ,
,  ,
, 

Abstract
1. Introduction
2. Materials and Methods
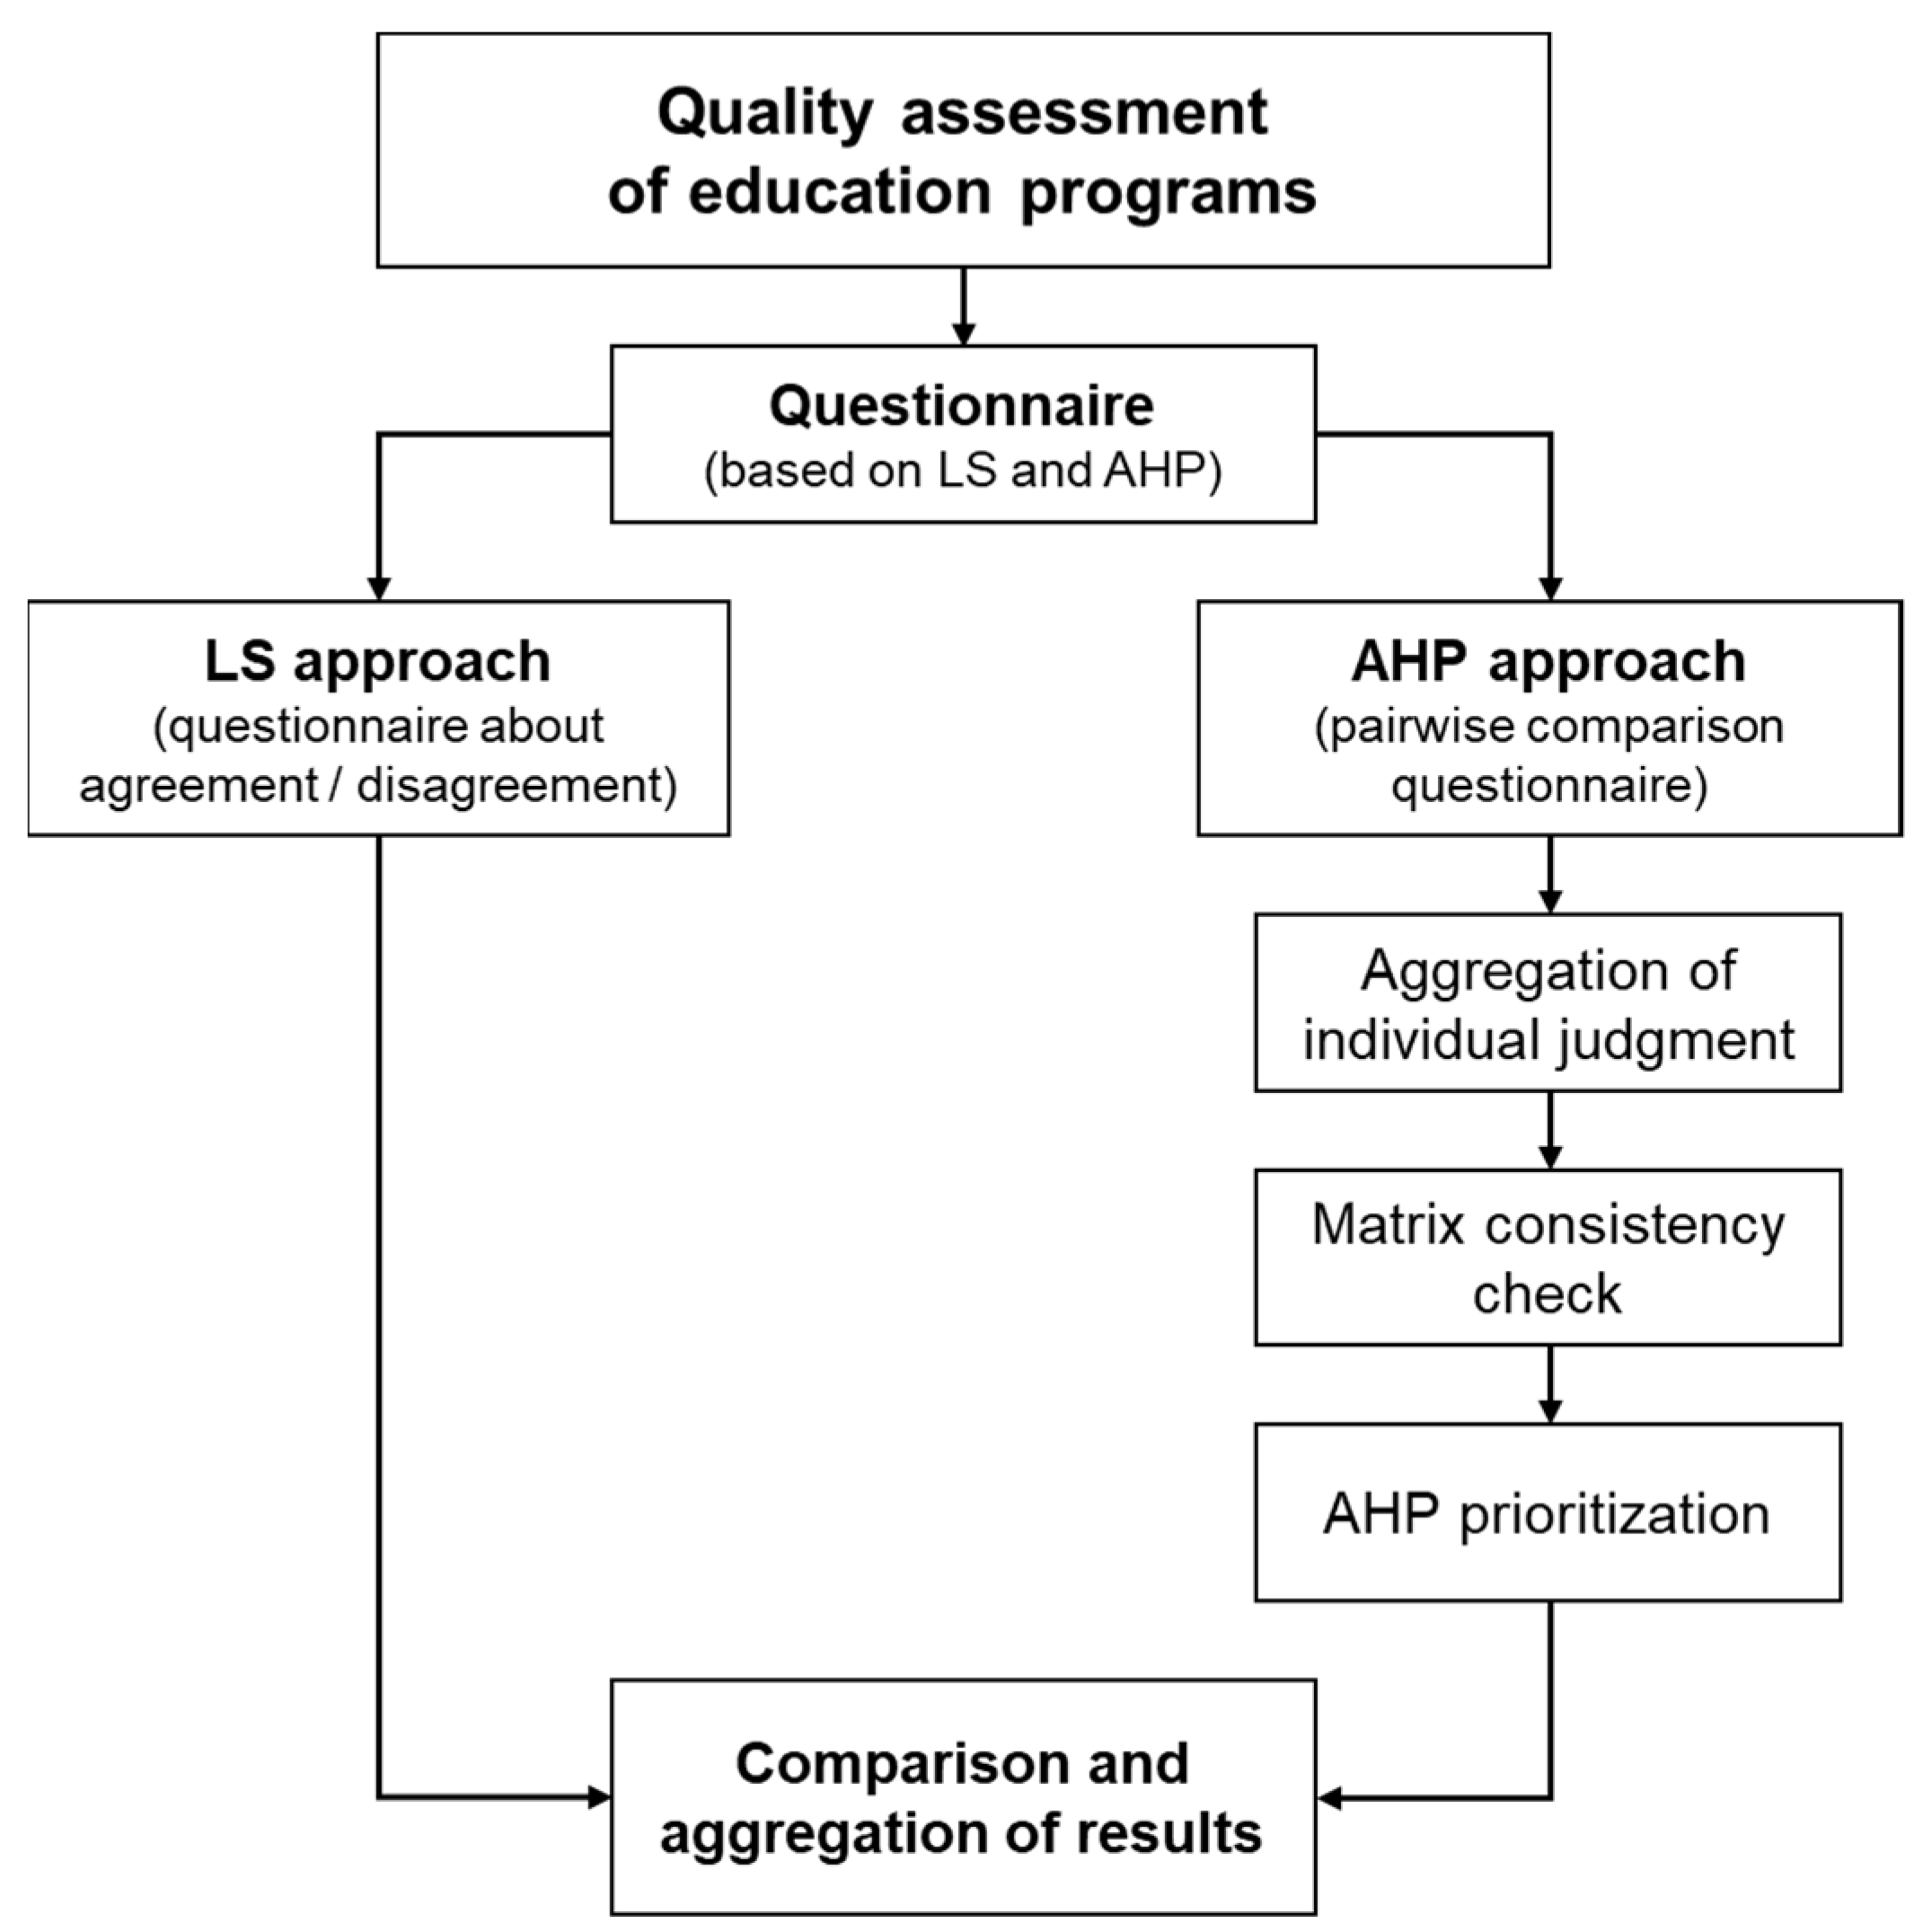
2.1. Proposed Methodology
- Selection of the analysis dimensions;
- Sample choice;
- Questionnaire development;
- Questionnaire submission;
- Data processing.
2.2. Application of the Approach to a Case Study: AHP Approach
- Location: the strategic location of the building with respect to the hospital structure and to the transport facilities nearby;
- Equipment: presence and suitability of the equipment provided with the training courses;
- Comfort: characteristics making the environment pleasant and comfortable.
- Preparation: adequacy of the level of training and preparation of the teacher;
- Interpersonal skills: ability to relate to learners by interpreting their requests and providing clear and comprehensive answers;
- Effectiveness: ability to deal with topics aimed at achieving the objectives of the course.
- Cost: costs sustained for the course;
- Duration: number of hours of the course;
- Content: topics and subjects of the course.
2.3. Planning of the LS Methodology
- Each item must be formulated in such a way that people with opposite attitudes give different responses;
- It is often helpful to present statements in an impersonal form;
- Statements must be concise and formulated with a simple language;
- Double negation sentences must be avoided;
- The items must be formulated half with a favorable attitude to the object and half with an unfavorable attitude.
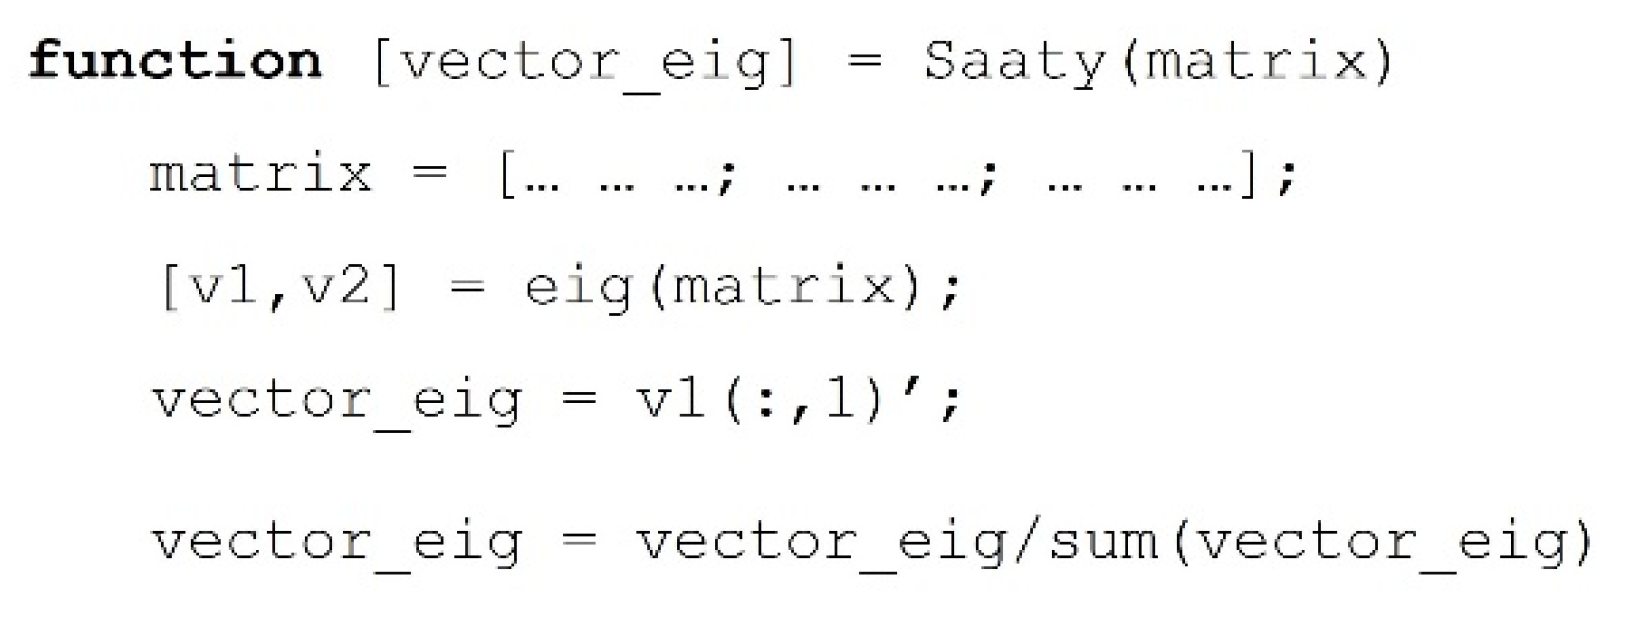
2.4. Data processing Using AHP
2.5. Matrix Consistency Check
2.6. Application of the Approach to a Case Study: Processing LS-Based Questionnaires
3. Results
3.1. Data Processing
3.2. Calculation of Local and Global Priorities (AHP Method)
- TEACHER weight: 0.443;
- ORGANIZATION weight: 0.387;
- STRUCTURE weight: 0.169.
3.3. Matrix Consistency
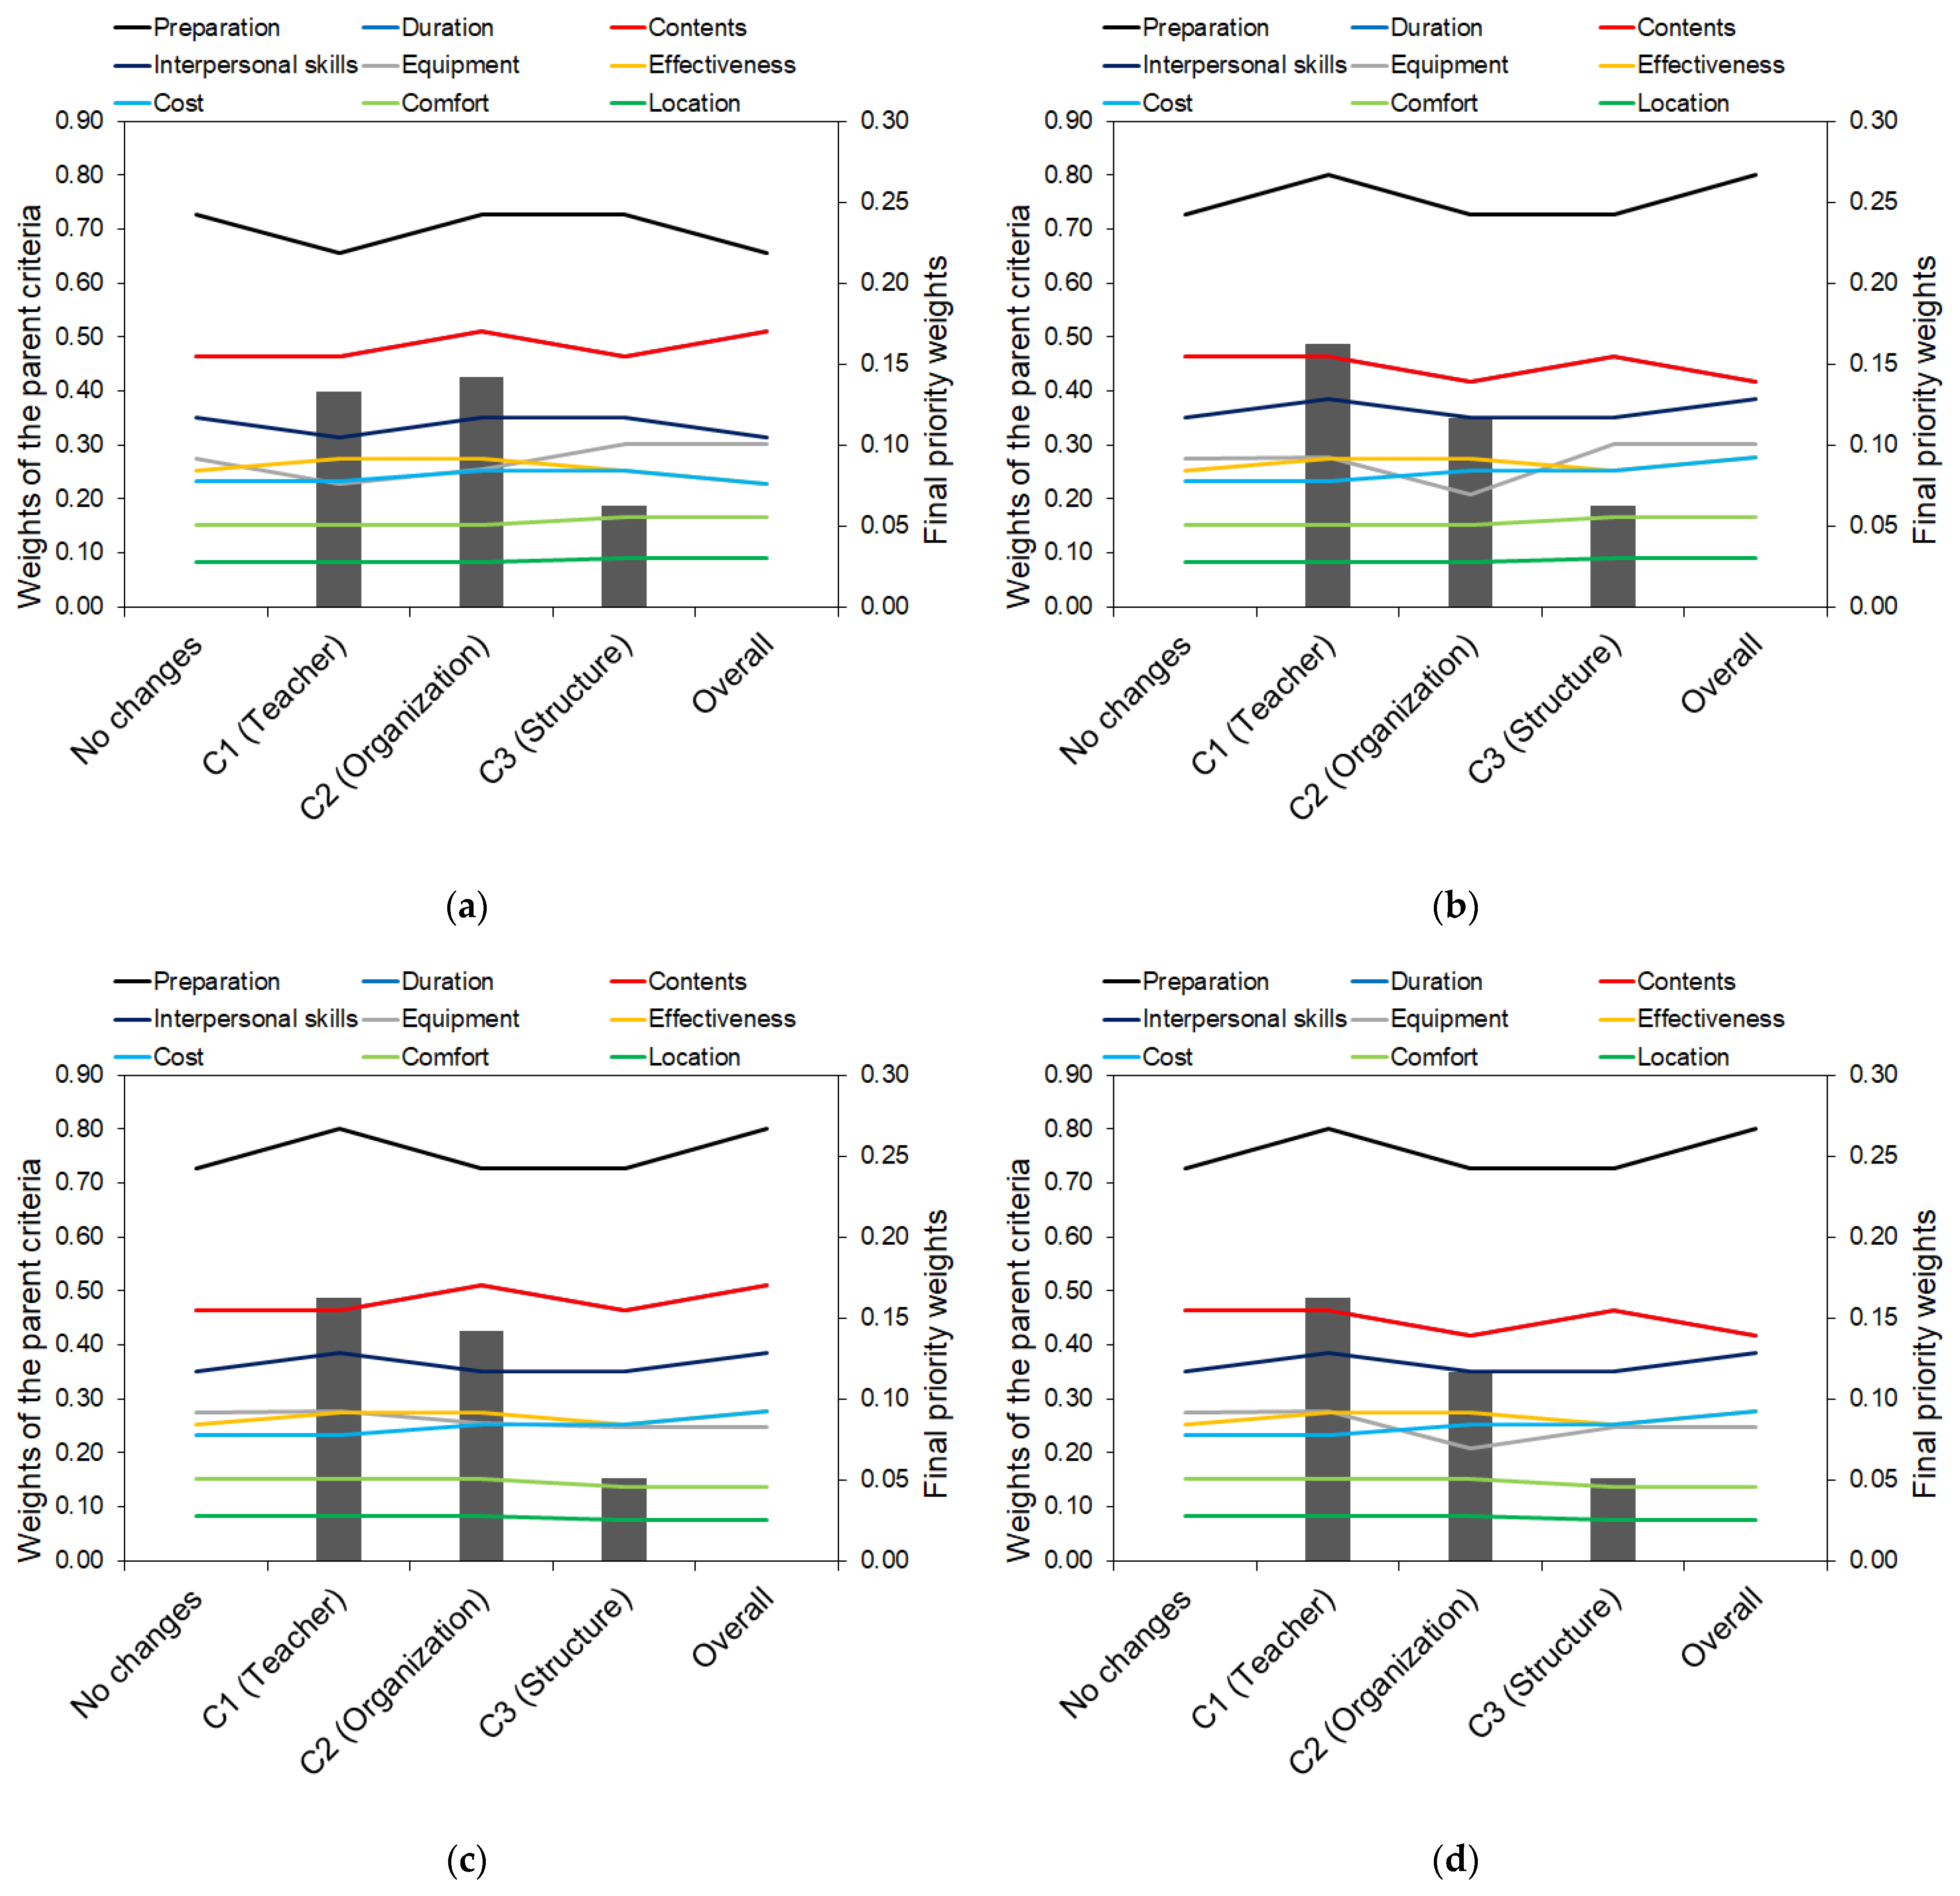
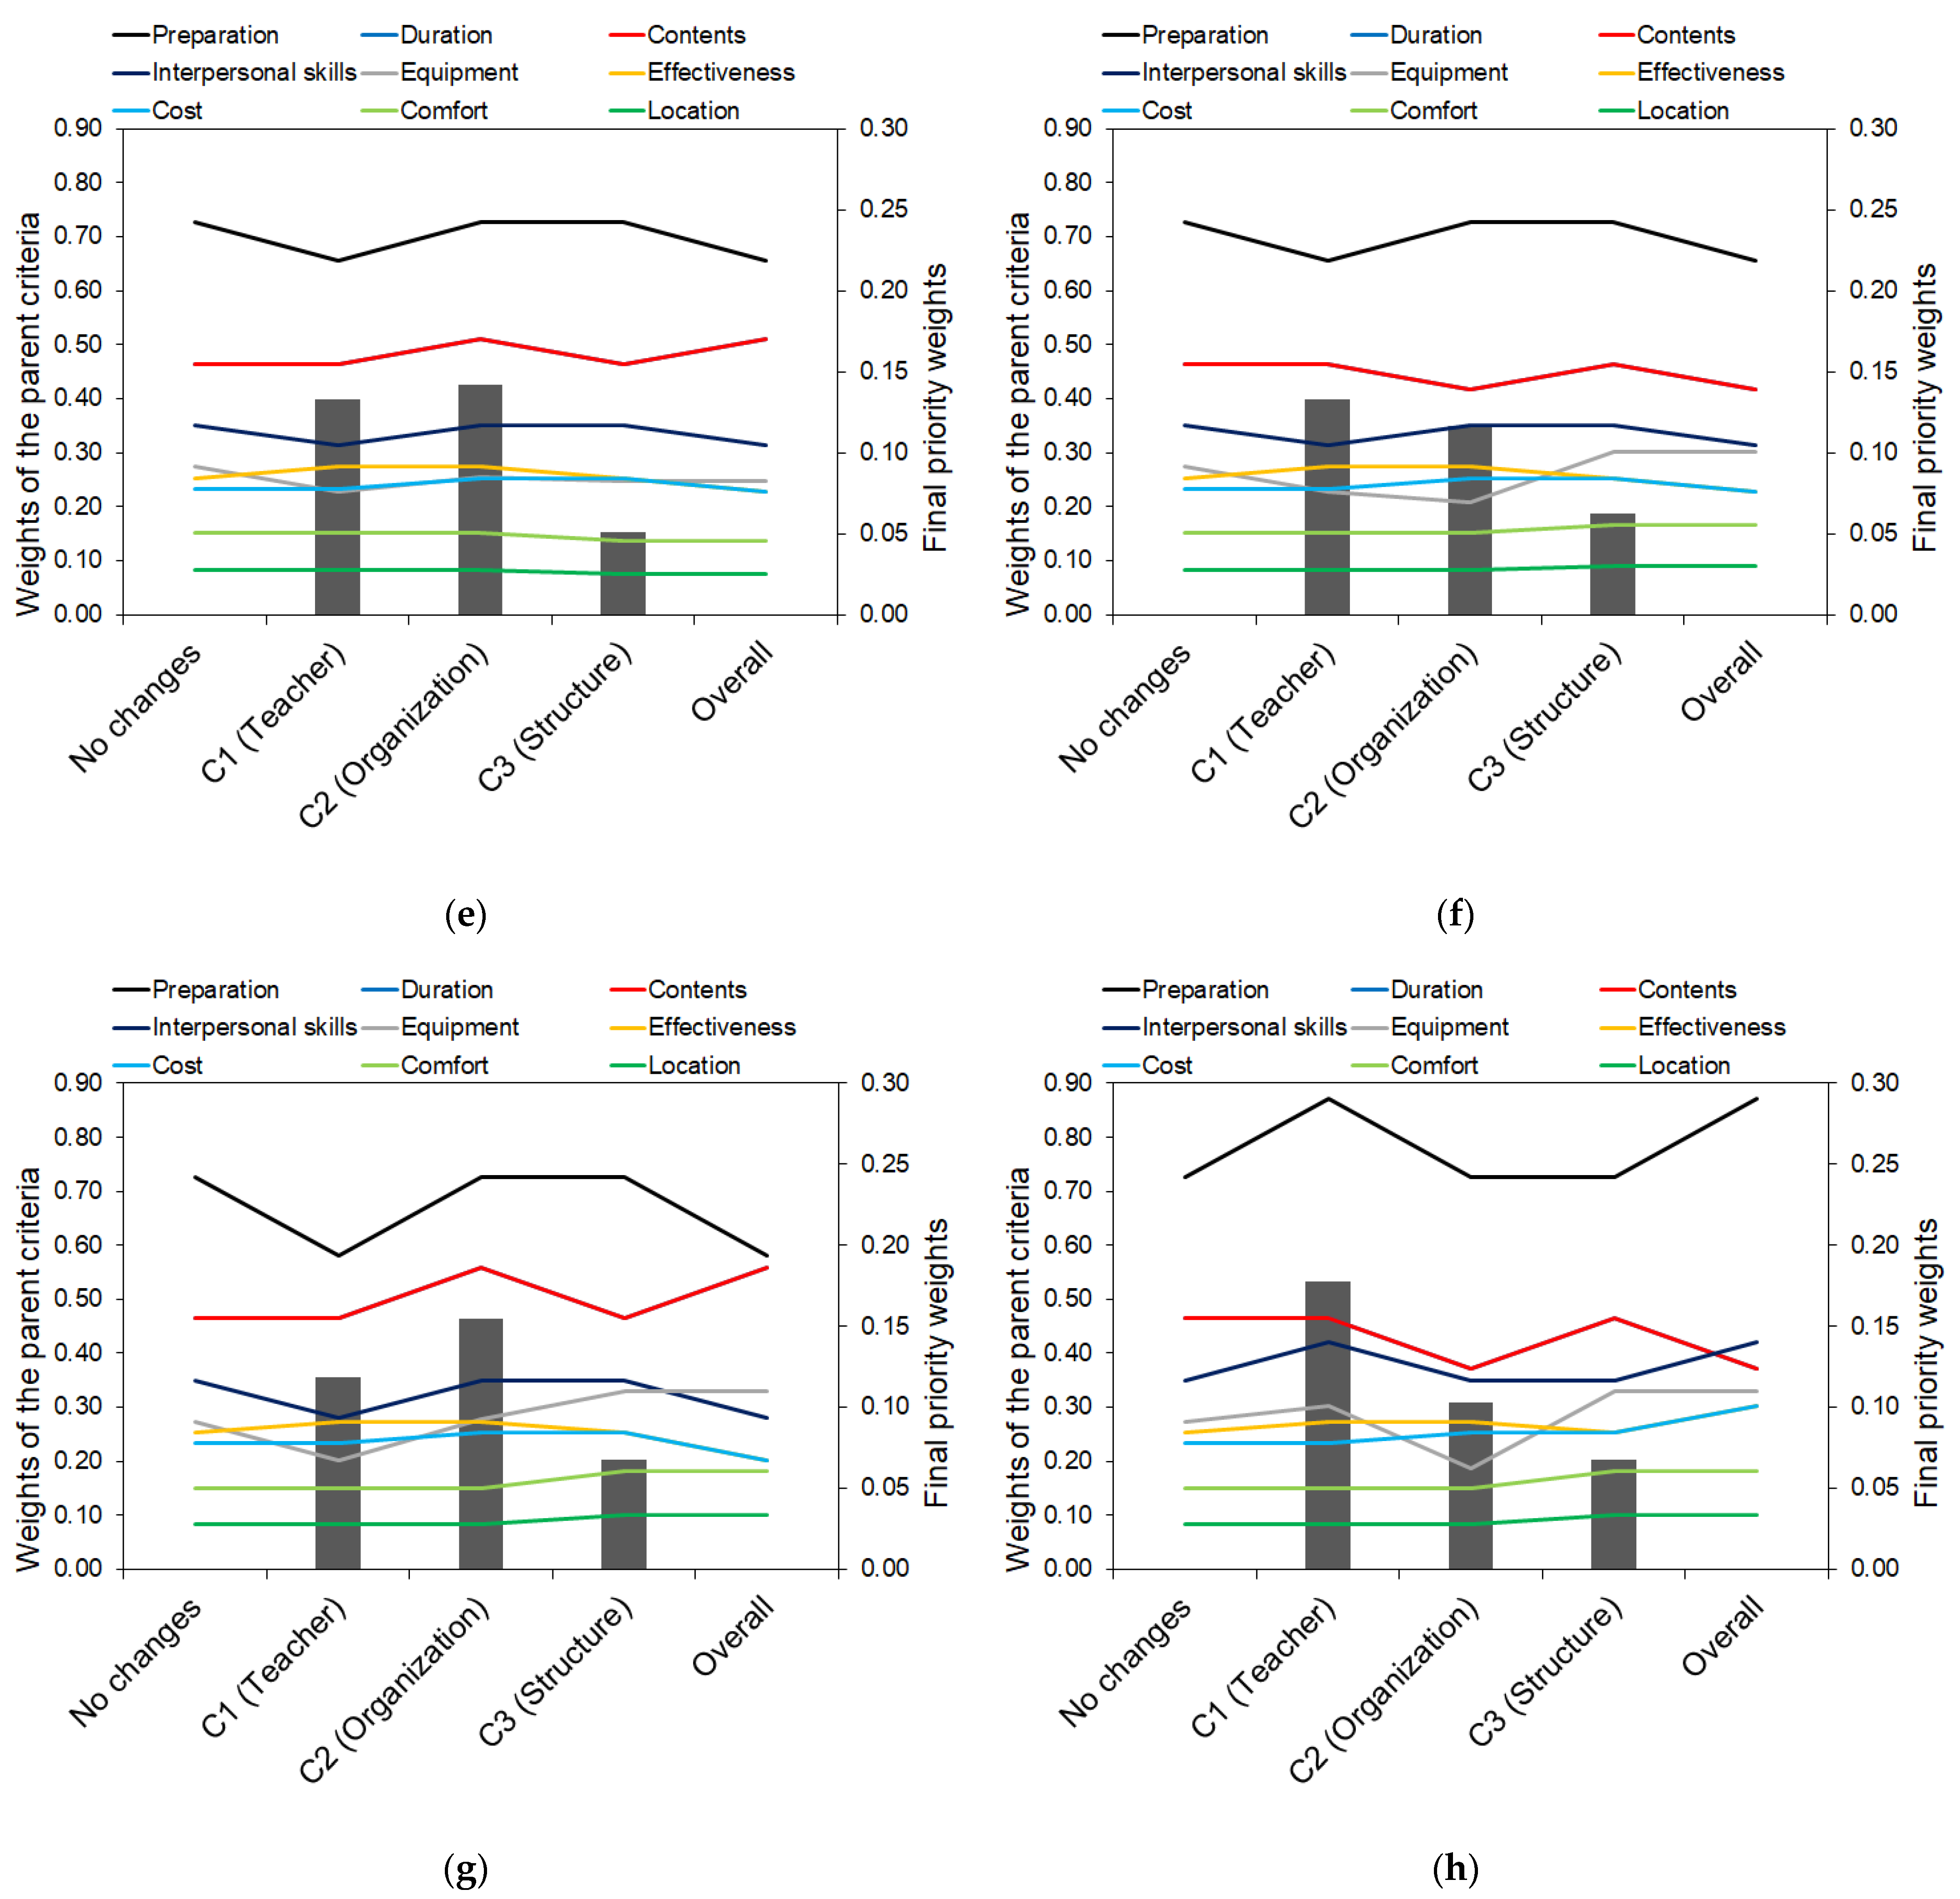
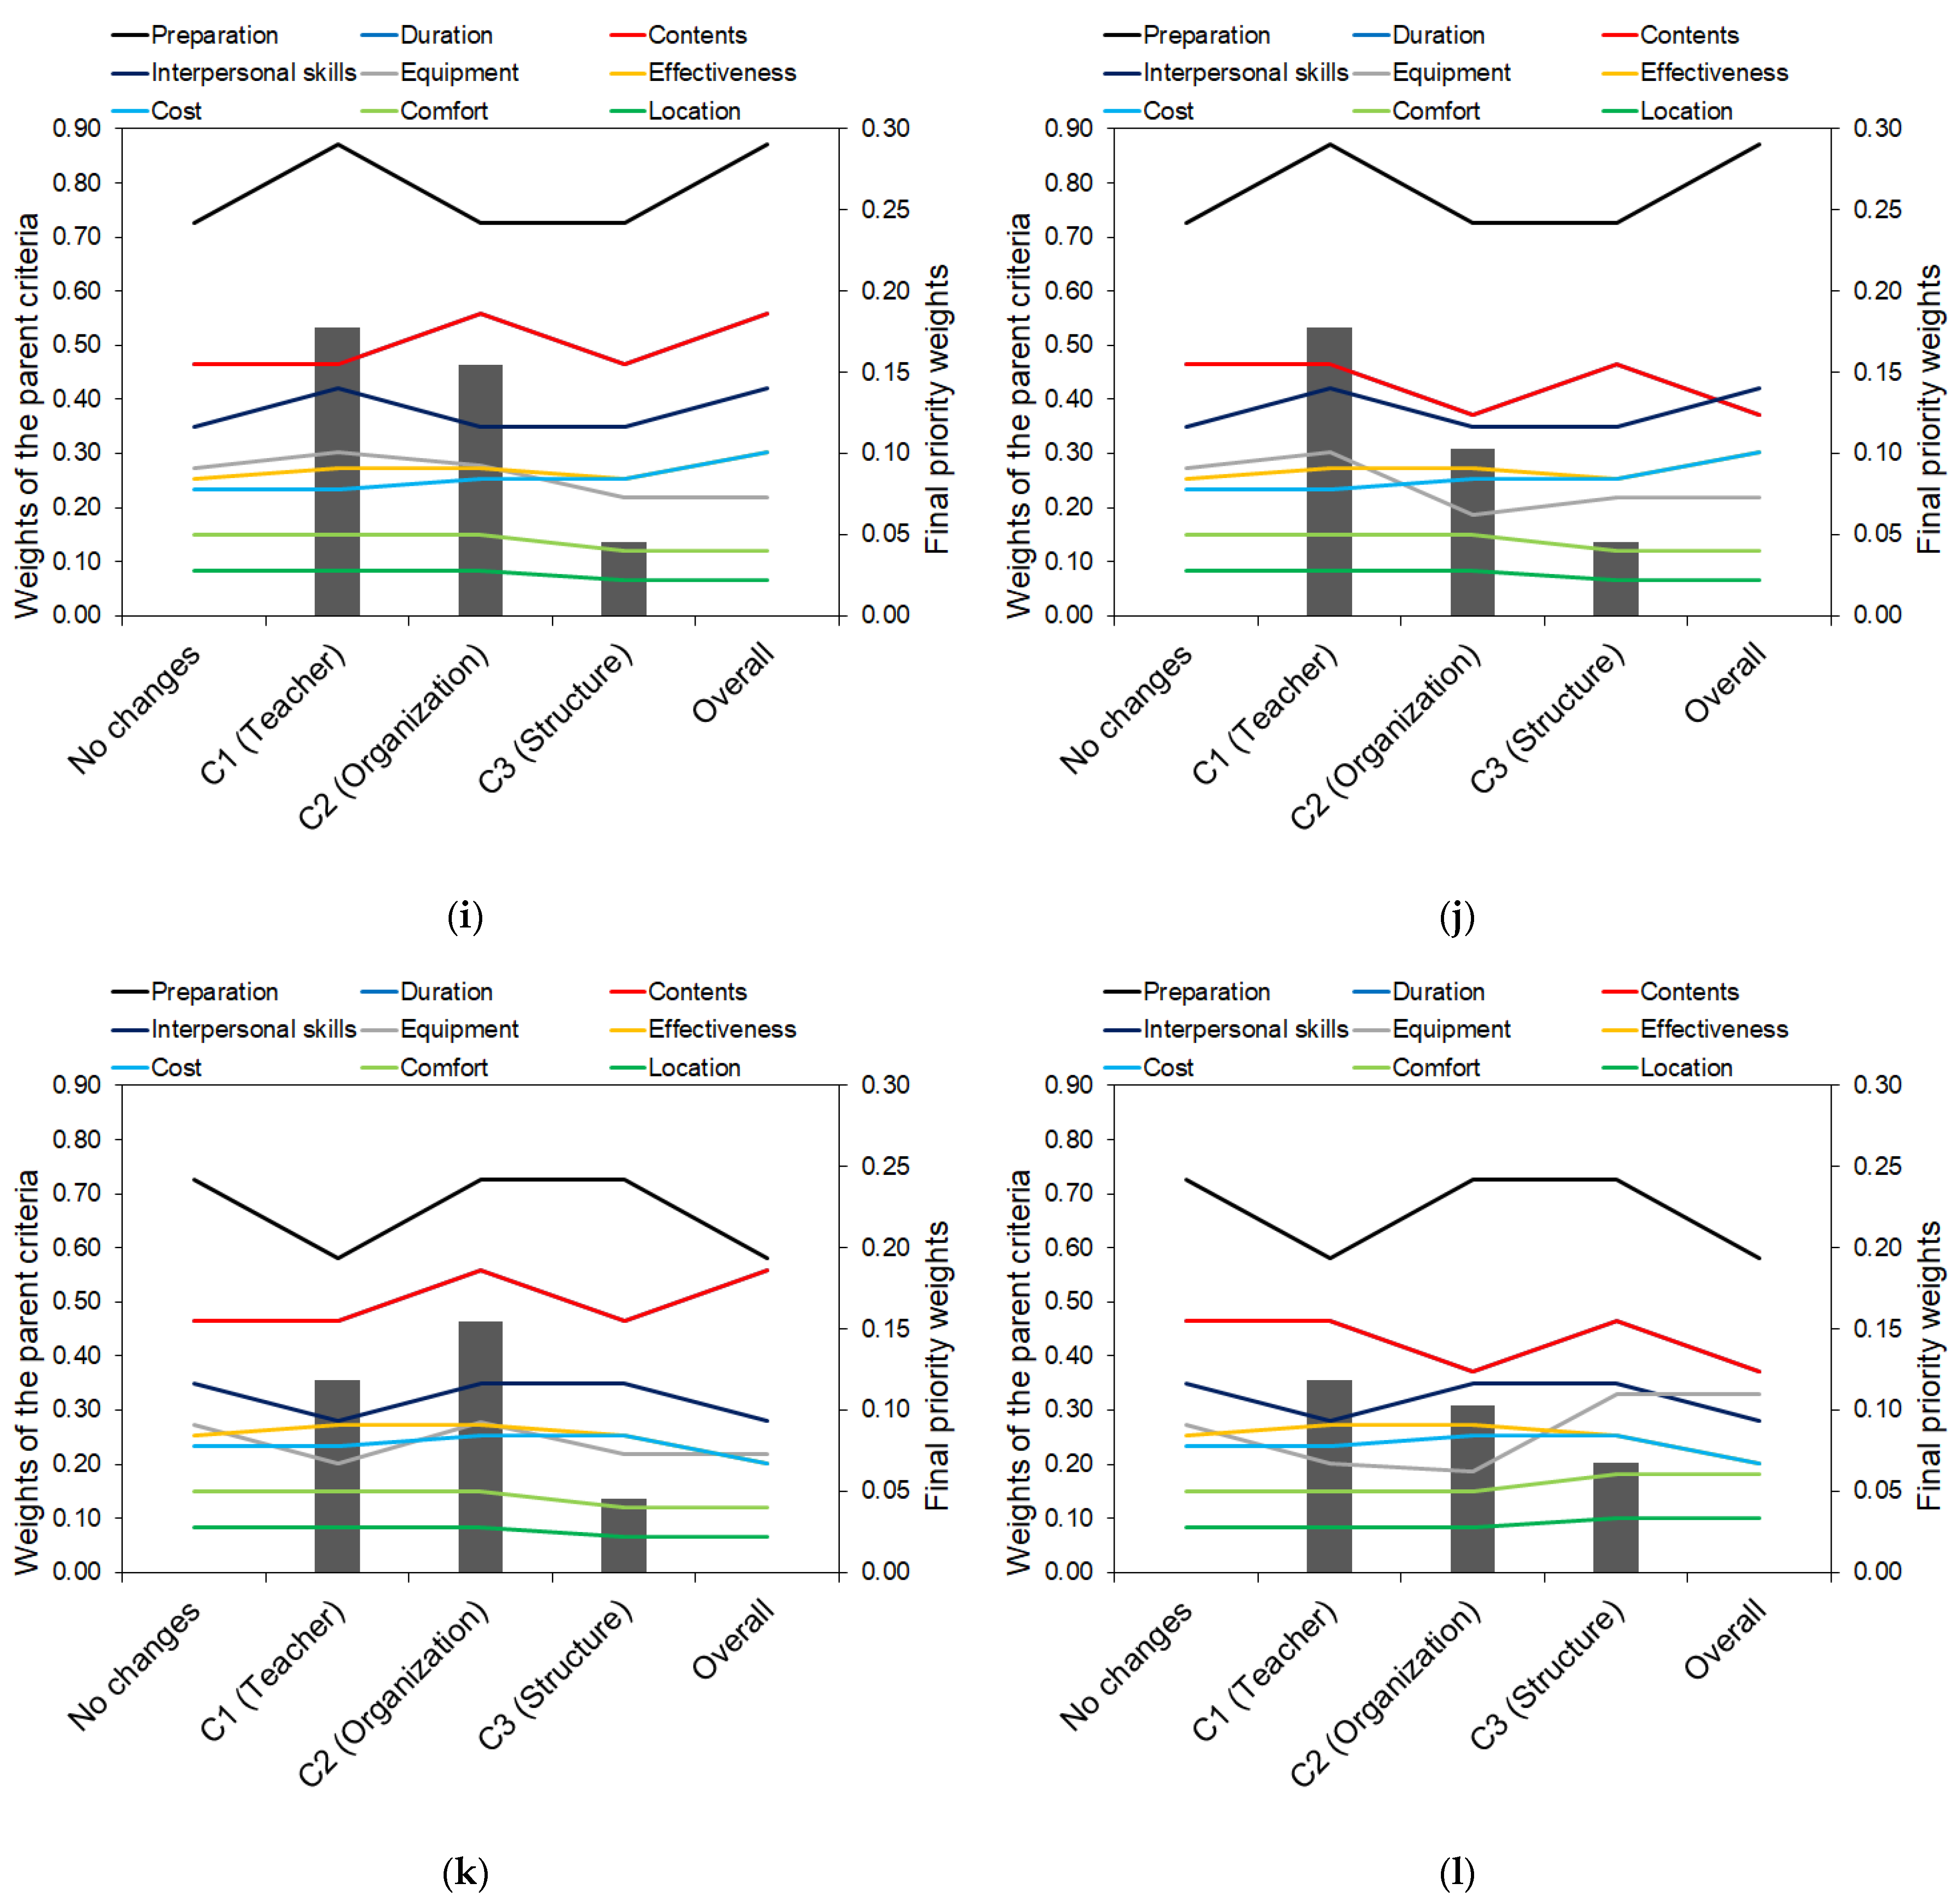
3.4. Sensitivity Analysis
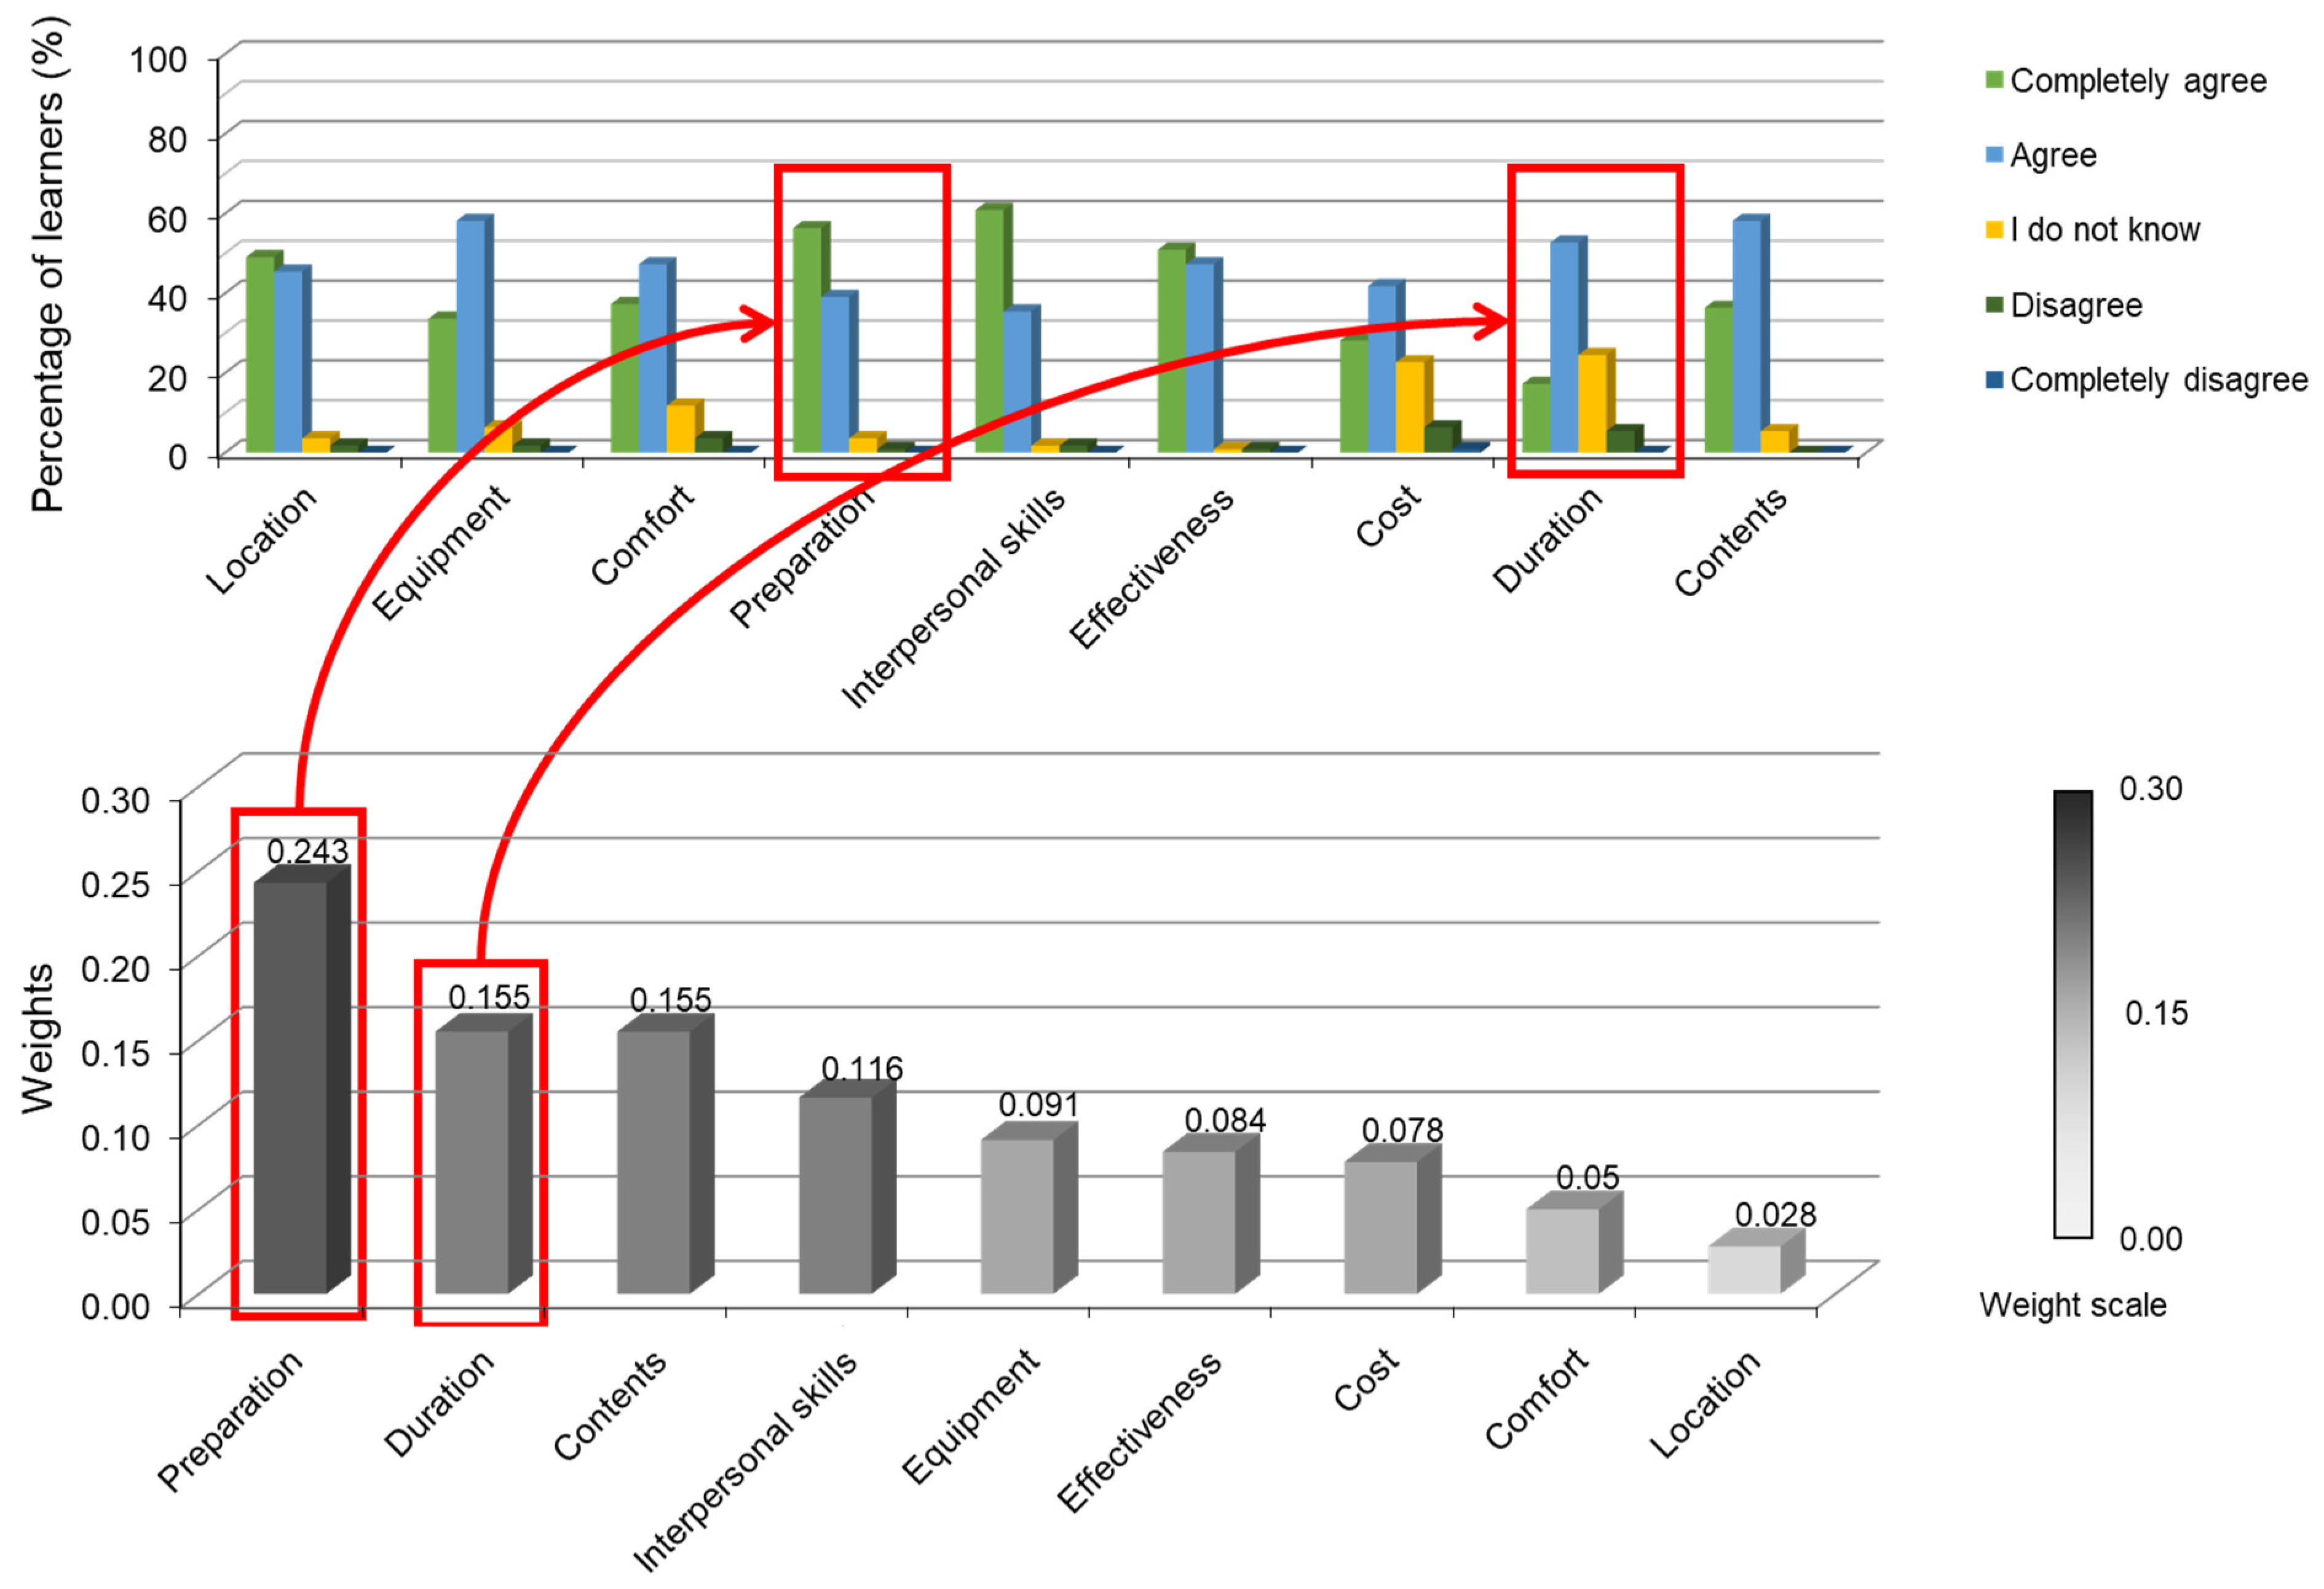
3.5. Data Aggregation and Comparison
4. Discussion
5. Conclusions
Author Contributions
Funding
Institutional Review Board Statement
Data Availability Statement
Acknowledgments
Conflicts of Interest
References
- Davis, D.; Galbraith, R. American College of Chest Physicians Health and Science Policy Committee Continuing Medical Education Effect on Practice Performance: Effectiveness of Continuing Medical Education: American College of Chest Physicians Evidence-Based Educational Guidelines. Chest 2009, 135, 42S–48S. [Google Scholar] [CrossRef] [PubMed]
- Udo, G.G. Using Analytic Hierarchy Process to Analyze the Information Technology Outsourcing Decision. Ind. Manag. Data Syst. 2000, 100, 421–429. [Google Scholar] [CrossRef]
- Saaty, T.L. Decision Making with the Analytic Hierarchy Process. Int. J. Serv. Sci. 2008, 1, 83–98. [Google Scholar] [CrossRef]
- Improta, G.; Ponsiglione, A.M.; Parente, G.; Romano, M.; Cesarelli, G.; Rea, T.; Russo, M.; Triassi, M. Evaluation of Medical Training Courses Satisfaction: Qualitative Analysis and Analytic Hierarchy Process. In Proceedings of the 8th European Medical and Biological Engineering Conference, Portorož, Slovenia, 29 November–3 December 2020; Jarm, T., Cvetkoska, A., Mahnič-Kalamiza, S., Miklavcic, D., Eds.; Springer International Publishing: Cham, Switzerland, 2021; pp. 518–526. [Google Scholar]
- Vaidya, O.S.; Kumar, S. Analytic Hierarchy Process: An Overview of Applications. Eur. J. Oper. Res. 2006, 169, 1–29. [Google Scholar] [CrossRef]
- Agha, S.R. Evaluating and Benchmarking Non-Governmental Training Programs: An Analytic Hierarchy Approach. JJMIE 2008, 2, 2. [Google Scholar]
- Saaty, T.L. The Analytic Hierarchy Process: Planning, Priority Setting, Resource Allocation; RWS: Buckinghamshire, UK, 1990; ISBN 978-0-9620317-2-4. [Google Scholar]
- Franek, J.; Kresta, A. Judgment Scales and Consistency Measure in AHP. Procedia Econ. Financ. 2014, 12, 164–173. [Google Scholar] [CrossRef]
- Badri, M.A.; Abdulla, M.H. Awards of Excellence in Institutions of Higher Education: An AHP Approach. Int. J. Educ. Manag. 2004, 18, 224–242. [Google Scholar] [CrossRef]
- Benítez, J.; Delgado-Galván, X.; Izquierdo, J.; Pérez-García, R. An Approach to AHP Decision in a Dynamic Context. Decis. Support Syst. 2012, 53, 499–506. [Google Scholar] [CrossRef]
- Canco, I.; Kruja, D.; Iancu, T. AHP, a Reliable Method for Quality Decision Making: A Case Study in Business. Sustainability 2021, 13, 13932. [Google Scholar] [CrossRef]
- González-Prida, V.; Barberá, L.; Viveros, P.; Crespo, A. Dynamic Analytic Hierarchy Process: AHP Method Adapted to a Changing Environment. IFAC Proc. Vol. 2012, 45, 25–29. [Google Scholar] [CrossRef]
- Wang, C.-N.; Kao, J.-C.; Wang, Y.-H.; Nguyen, V.T.; Nguyen, V.T.; Husain, S.T. A Multicriteria Decision-Making Model for the Selection of Suitable Renewable Energy Sources. Mathematics 2021, 9, 1318. [Google Scholar] [CrossRef]
- Wang, Y.; Xu, L.; Solangi, Y.A. Strategic Renewable Energy Resources Selection for Pakistan: Based on SWOT-Fuzzy AHP Approach. Sustain. Cities Soc. 2020, 52, 101861. [Google Scholar] [CrossRef]
- Heo, E.; Kim, J.; Boo, K.-J. Analysis of the Assessment Factors for Renewable Energy Dissemination Program Evaluation Using Fuzzy AHP. Renew. Sustain. Energy Rev. 2010, 14, 2214–2220. [Google Scholar] [CrossRef]
- Dorado, R.; Gómez-Moreno, A.; Torres-Jiménez, E.; López-Alba, E. An AHP Application to Select Software for Engineering Education. Comput. Appl. Eng. Educ. 2014, 22, 200–208. [Google Scholar] [CrossRef]
- Laguna-Sánchez, P.; Palomo, J.; de la Fuente-Cabrero, C.; de Castro-Pardo, M. A Multiple Criteria Decision Making Approach to Designing Teaching Plans in Higher Education Institutions. Mathematics 2021, 9, 9. [Google Scholar] [CrossRef]
- Nosal, K.; Solecka, K. Application of AHP Method for Multi-Criteria Evaluation of Variants of the Integration of Urban Public Transport. Transp. Res. Procedia 2014, 3, 269–278. [Google Scholar] [CrossRef]
- Almeida, F.; Silva, P.; Leite, J. Proposal of A Carsharing System to Improve Urban Mobility. Theor. Empir. Res. Urban Manag. 2017, 12, 32–44. [Google Scholar]
- Lu, X.; Lu, J.; Yang, X.; Chen, X. Assessment of Urban Mobility via a Pressure-State-Response (PSR) Model with the IVIF-AHP and FCE Methods: A Case Study of Beijing, China. Sustainability 2022, 14, 3112. [Google Scholar] [CrossRef]
- Ricciardi, C.; Ponsiglione, A.M.; Converso, G.; Santalucia, I.; Triassi, M.; Improta, G. Implementation and Validation of a New Method to Model Voluntary Departures from Emergency Departments. Math. Biosci. Eng. 2021, 18, 253–273. [Google Scholar] [CrossRef]
- Ponsiglione, A.M.; Ricciardi, C.; Improta, G.; Orabona, G.D.; Sorrentino, A.; Amato, F.; Romano, M. A Six Sigma DMAIC Methodology as a Support Tool for Health Technology Assessment of Two Antibiotics. Math. Biosci. Eng. 2021, 18, 3469–3490. [Google Scholar] [CrossRef]
- Improta, G.; Perrone, A.; Russo, M.A.; Triassi, M. Health Technology Assessment (HTA) of Optoelectronic Biosensors for Oncology by Analytic Hierarchy Process (AHP) and Likert Scale. BMC Med. Res. Methodol. 2019, 19, 140. [Google Scholar] [CrossRef] [PubMed]
- Improta, G.; Converso, G.; Murino, T.; Gallo, M.; Perrone, A.; Romano, M. Analytic Hierarchy Process (AHP) in Dynamic Configuration as a Tool for Health Technology Assessment (HTA): The Case of Biosensing Optoelectronics in Oncology. Int. J. Inf. Technol. Decis. Mak. 2019, 18, 1533–1550. [Google Scholar] [CrossRef]
- Improta, G.; Russo, M.A.; Triassi, M.; Converso, G.; Murino, T.; Santillo, L.C. Use of the AHP Methodology in System Dynamics: Modelling and Simulation for Health Technology Assessments to Determine the Correct Prosthesis Choice for Hernia Diseases. Math. Biosci. 2018, 299, 19–27. [Google Scholar] [CrossRef] [PubMed]
- Danner, M.; Hummel, J.M.; Volz, F.; van Manen, J.G.; Wiegard, B.; Dintsios, C.-M.; Bastian, H.; Gerber, A.; IJzerman, M.J. Integrating Patients’ Views into Health Technology Assessment: Analytic Hierarchy Process (AHP) as a Method to Elicit Patient Preferences. Int. J. Technol. Assess. Health Care 2011, 27, 369–375. [Google Scholar] [CrossRef]
- De Santo, A.; Galli, A.; Gravina, M.; Moscato, V.; Sperlì, G. Deep Learning for HDD Health Assessment: An Application Based on LSTM. IEEE Trans. Comput. 2022, 71, 69–80. [Google Scholar] [CrossRef]
- Dell-Kuster, S.; Sanjuan, E.; Todorov, A.; Weber, H.; Heberer, M.; Rosenthal, R. Designing Questionnaires: Healthcare Survey to Compare Two Different Response Scales. BMC Med. Res. Methodol. 2014, 14, 96. [Google Scholar] [CrossRef]
- Krzych, Ł.J.; Lach, M.; Joniec, M.; Cisowski, M.; Bochenek, A. The Likert Scale Is a Powerful Tool for Quality of Life Assessment among Patients after Minimally Invasive Coronary Surgery. Pol. Pol. J. Cardio-Thorac. Surg. 2018, 15, 130–134. [Google Scholar] [CrossRef]
- Kalaja, R.; Myshketa, R.; Scalera, F. Service Quality Assessment in Health Care Sector: The Case of Durres Public Hospital. Procedia Soc. Behav. Sci. 2016, 235, 557–565. [Google Scholar] [CrossRef]
- Melillo, P.; Delle Donne, A.; Improta, G.; Cozzolino, S.; Bracale, M. Assessment of Patient Satisfaction Using an AHP Model: An Application to a Service of Pharmaceutical Distribution. In Proceedings of the International Symposium on the Analytic Hierarchy Process, Sorrento, Italy, 15–18 June 2011. [Google Scholar]
- Wang, Y.-M.; Luo, Y.; Hua, Z. On the Extent Analysis Method for Fuzzy AHP and Its Applications. Eur. J. Oper. Res. 2008, 186, 735–747. [Google Scholar] [CrossRef]
- Chang, D.-Y. Applications of the Extent Analysis Method on Fuzzy AHP. Eur. J. Oper. Res. 1996, 95, 649–655. [Google Scholar] [CrossRef]
- Liu, Y.; Eckert, C.M.; Earl, C. A Review of Fuzzy AHP Methods for Decision-Making with Subjective Judgements. Expert Syst. Appl. 2020, 161, 113738. [Google Scholar] [CrossRef]
- Radovanovic, M.; Ranđelović, A.; Jokić, Ž. Application of Hybrid Model Fuzzy AHP—VIKOR in Selection of the Most Efficient Procedure for Rectification of the Optical Sight of the Long-Range Rifle. Decis. Mak. Appl. Manag. Eng. 2020, 3, 131–148. [Google Scholar] [CrossRef]
- Lima Junior, F.R.; Osiro, L.; Carpinetti, L.C.R. A Comparison between Fuzzy AHP and Fuzzy TOPSIS Methods to Supplier Selection. Appl. Soft Comput. 2014, 21, 194–209. [Google Scholar] [CrossRef]
- Pamučar, D.; Stević, Ž.; Zavadskas, E.K. Integration of Interval Rough AHP and Interval Rough MABAC Methods for Evaluating University Web Pages. Appl. Soft Comput. 2018, 67, 141–163. [Google Scholar] [CrossRef]
- Taha, Z.; Rostam, S. A Hybrid Fuzzy AHP-PROMETHEE Decision Support System for Machine Tool Selection in Flexible Manufacturing Cell. J. Intell. Manuf. 2012, 23, 2137–2149. [Google Scholar] [CrossRef]
- Sindhu, S.; Nehra, V.; Luthra, S. Investigation of Feasibility Study of Solar Farms Deployment Using Hybrid AHP-TOPSIS Analysis: Case Study of India. Renew. Sustain. Energy Rev. 2017, 73, 496–511. [Google Scholar] [CrossRef]
- Kusumawardani, R.P.; Agintiara, M. Application of fuzzy AHP-TOPSIS method for decision making in human resource manager selection process. Procedia Comput. Sci. 2015, 72, 638–646. [Google Scholar] [CrossRef]
- Widianta, M.M.D.; Rizaldi, T.; Setyohadi, D.P.S.; Riskiawan, H.Y. Comparison of Multi-Criteria Decision Support Methods (AHP, TOPSIS, SAW & PROMENTHEE) for Employee Placement. J. Phys. Conf. Ser. 2018, 953, 012116. [Google Scholar] [CrossRef]
- Joshi, A.; Kale, S.; Chandel, S.K.; Pal, D.K. Likert Scale: Explored and Explained. Br. J. Appl. Sci. Technol. 2015, 7, 396. [Google Scholar] [CrossRef]
- Sullivan, G.M.; Artino, A.R. Analyzing and Interpreting Data From Likert-Type Scales. J. Grad. Med. Educ. 2013, 5, 541–542. [Google Scholar] [CrossRef]
- Kersnik, J. An Evaluation of Patient Satisfaction with Family Practice Care in Slovenia. Int. J. Qual. Health Care. 2000, 12, 143–147. [Google Scholar] [CrossRef] [PubMed]
- Mcleod, S. Likert Scale Definition, Examples and Analysis. Simply Psychology. 2008. Available online: www.simplypsychology.org/likert-scale.html (accessed on 31 January 2022).
- Saaty, T.L. Basic Theory of the Analytic Hierarchy Process: How to Make a Decision. Rev. Real Acad. Cienc. Exactas Fis. Nat. 1999, 93, 395–423. [Google Scholar]
- Gronroos, C. Service Quality: The Six Criteria of Good Perceived Service. Rev. Bus. 1988, 9, 10. [Google Scholar]
- Parasuraman, A.; Zeithaml, V.A.; Berry, L.L. A Conceptual Model of Service Quality and Its Implications for Future Research. J. Mark. 2018, 49, 41–50. [Google Scholar] [CrossRef]
- Saaty, T.L. Decision Making—The Analytic Hierarchy and Network Processes (AHP/ANP). J. Syst. Sci. Syst. Eng. 2004, 13, 1–35. [Google Scholar] [CrossRef]
- Saaty, T.L. Decision-Making with the AHP: Why Is the Principal Eigenvector Necessary. Eur. J. Oper. Res. 2003, 145, 85–91. [Google Scholar] [CrossRef]
- Aguarón, J.; Escobar, M.T.; Moreno-Jiménez, J.M.; Turón, A. AHP-Group Decision Making Based on Consistency. Mathematics 2019, 7, 242. [Google Scholar] [CrossRef]
- Yadav, A.; Jayswal, S.C. Using Geometric Mean Method of Analytical Hierarchy Process for Decision Making in Functional Layout. Int. J. Eng. Res. Technol. 2013, 2, 775–779. [Google Scholar]
- Krejčí, J.; Stoklasa, J. Aggregation in the Analytic Hierarchy Process: Why Weighted Geometric Mean Should Be Used Instead of Weighted Arithmetic Mean. Expert Syst. Appl. 2018, 114, 97–106. [Google Scholar] [CrossRef]
- Dijkstra, T.K. On the Extraction of Weights from Pairwise Comparison Matrices. Cent. Eur. J. Oper. Res. 2013, 21, 103–123. [Google Scholar] [CrossRef]
- Saaty, T.L.; Tran, L.T. On the Invalidity of Fuzzifying Numerical Judgments in the Analytic Hierarchy Process. Math. Comput. Model. 2007, 46, 962–975. [Google Scholar] [CrossRef]
- Chang, C.-W.; Wu, C.-R.; Lin, C.-T.; Chen, H.-C. An Application of AHP and Sensitivity Analysis for Selecting the Best Slicing Machine. Comput. Ind. Eng. 2007, 52, 296–307. [Google Scholar] [CrossRef]
- Aller, M.-B.; Vargas, I.; Waibel, S.; Coderch, J.; Sánchez-Pérez, I.; Colomés, L.; Llopart, J.R.; Ferran, M.; Vázquez, M.L. A Comprehensive Analysis of Patients’ Perceptions of Continuity of Care and Their Associated Factors. Int. J. Qual. Health Care 2013, 25, 291–299. [Google Scholar] [CrossRef] [PubMed]
- Abbad, G. da S.; Borges-Andrade, J.E.; Sallorenzo, L.H. Self-Assessment of Training Impact at Work: Validation of a Measurement Scale. Rev. Interam. De Psicol./Interam. J. Psychol. 2004, 38, 277–284. [Google Scholar]
- Clark, N.M.; Gong, M.; Schork, M.A.; Kaciroti, N.; Evans, D.; Roloff, D.; Hurwitz, M.; Maiman, L.A.; Mellins, R.B. Long-Term Effects of Asthma Education for Physicians on Patient Satisfaction and Use of Health Services. Eur. Respir. J. 2000, 16, 15–21. [Google Scholar] [CrossRef] [PubMed][Green Version]
- Awasthi, S.; Agnihotri, K.; Thakur, S.; Singh, U.; Chandra, H. Quality of Care as a Determinant of Health-Related Quality of Life in Ill-Hospitalized Adolescents at a Tertiary Care Hospital in North India. Int. J. Qual. Health Care 2012, 24, 587–594. [Google Scholar] [CrossRef][Green Version]
- El-Jardali, F.; Jamal, D.; Dimassi, H.; Ammar, W.; Tchaghchaghian, V. The Impact of Hospital Accreditation on Quality of Care: Perception of Lebanese Nurses. Int. J. Qual. Health Care 2008, 20, 363–371. [Google Scholar] [CrossRef]
- Nicolay, C.R.; Purkayastha, S.; Greenhalgh, A.; Benn, J.; Chaturvedi, S.; Phillips, N.; Darzi, A. Systematic Review of the Application of Quality Improvement Methodologies from the Manufacturing Industry to Surgical Healthcare. Br. J. Surg. 2012, 99, 324–335. [Google Scholar] [CrossRef]
- Arafeh, M.; Barghash, M.A.; Haddad, N.; Musharbash, N.; Nashawati, D.; Al-Bashir, A.; Assaf, F. Using Six Sigma DMAIC Methodology and Discrete Event Simulation to Reduce Patient Discharge Time in King Hussein Cancer Center. J. Healthc. Eng. 2018, 2018, 3832151. [Google Scholar] [CrossRef]
- Ponsiglione, A.M.; Romano, M.; Amato, F. A Finite-State Machine Approach to Study Patients Dropout From Medical Examinations. In Proceedings of the 2021 IEEE 6th International Forum on Research and Technology for Society and Industry (RTSI), Naples, Italy, 6–9 September 2021; pp. 289–294. [Google Scholar]
- Black, J.R.; Miller, D.; Sensel, J. The Toyota Way to Healthcare Excellence: Increase Efficiency and Improve Quality with Lean; HAP/Health Administration Press: Chicago, IL, USA, 2016; ISBN 978-1-56793-782-4. [Google Scholar]
- Mazzocato, P.; Savage, C.; Brommels, M.; Aronsson, H.; Thor, J. Lean Thinking in Healthcare: A Realist Review of the Literature. Qual. Saf. Health Care 2010, 19, 376–382. [Google Scholar] [CrossRef]
- Haynes, R.B.; Davis, D.A.; McKibbon, A.; Tugwell, P. A Critical Appraisal of the Efficacy of Continuing Medical Education. JAMA 1984, 251, 61–64. [Google Scholar] [CrossRef] [PubMed]
- Drescher, U.; Warren, F.; Norton, K. Towards Evidence-Based Practice in Medical Training: Making Evaluations More Meaningful. Med. Educ. 2004, 38, 1288–1294. [Google Scholar] [CrossRef] [PubMed]
- Zeiger, R.F. Toward Continuous Medical Education. J. Gen. Intern. Med. 2005, 20, 91–94. [Google Scholar] [CrossRef]
- Ataei, M.; Saffarian-Hamedani, S.; Zameni, F. Effective Teaching Model in Continuing Medical Education Programs. J. Mazandaran Univ. Med. Sci. 2019, 29, 202–207. [Google Scholar]
- Bloom, B.S. Effects of Continuing Medical Education on Improving Physician Clinical Care and Patient Health: A Review of Systematic Reviews. Int. J. Technol. Assess. Health Care 2005, 21, 380–385. [Google Scholar] [CrossRef]
- Khoshnoodi Far, M.; Mohajerpour, R.; Rahimi, E.; Roshani, D.; Zarezadeh, Y. Comparison between the Effects of Flipped Class and Traditional Methods of Instruction on Satisfaction, Active Participation, and Learning Level in a Continuous Medical Education Course for General Practitioners. Sci. J. Kurd. Univ. Med. Sci. 2019, 24, 56–65. [Google Scholar] [CrossRef]
- Davis, D.; O’Brien, M.A.; Freemantle, N.; Wolf, F.M.; Mazmanian, P.; Taylor-Vaisey, A. Impact of Formal Continuing Medical Education: Do Conferences, Workshops, Rounds, and Other Traditional Continuing Education Activities Change Physician Behavior or Health Care Outcomes? JAMA 1999, 282, 867–874. [Google Scholar] [CrossRef]
- Çelikbilek, Y.; Tüysüz, F. An In-Depth Review of Theory of the TOPSIS Method: An Experimental Analysis. J. Manag. Anal. 2020, 7, 281–300. [Google Scholar] [CrossRef]
- Pamucar, D.; Deveci, M.; Schitea, D.; Erişkin, L.; Iordache, M.; Iordache, I. Developing a Novel Fuzzy Neutrosophic Numbers Based Decision Making Analysis for Prioritizing the Energy Storage Technologies. Int. J. Hydrogen Energy 2020, 45, 23027–23047. [Google Scholar] [CrossRef]
- Munier, N. A New Approach to the Rank Reversal Phenomenon in MCDM with the SIMUS Method. Mult. Criteria Decis. Mak. 2016, 11, 137–152. [Google Scholar] [CrossRef]
- Dezert, J.; Tchamova, A.; Han, D.; Tacnet, J.-M. The SPOTIS Rank Reversal Free Method for Multi-Criteria Decision-Making Support. In Proceedings of the 2020 IEEE 23rd International Conference on Information Fusion (FUSION), Rustenburg, South Africa, 6–9 July 2020; pp. 1–8. [Google Scholar]
- Kizielewicz, B.; Kołodziejczyk, J. Effects of the Selection of Characteristic Values on the Accuracy of Results in the COMET Method. Procedia Comput. Sci. 2020, 176, 3581–3590. [Google Scholar] [CrossRef]


| Score | Description |
|---|---|
| 5 | Completely agree |
| 4 | Agree |
| 3 | I do not know |
| 2 | Disagree |
| 1 | Completely disagree |
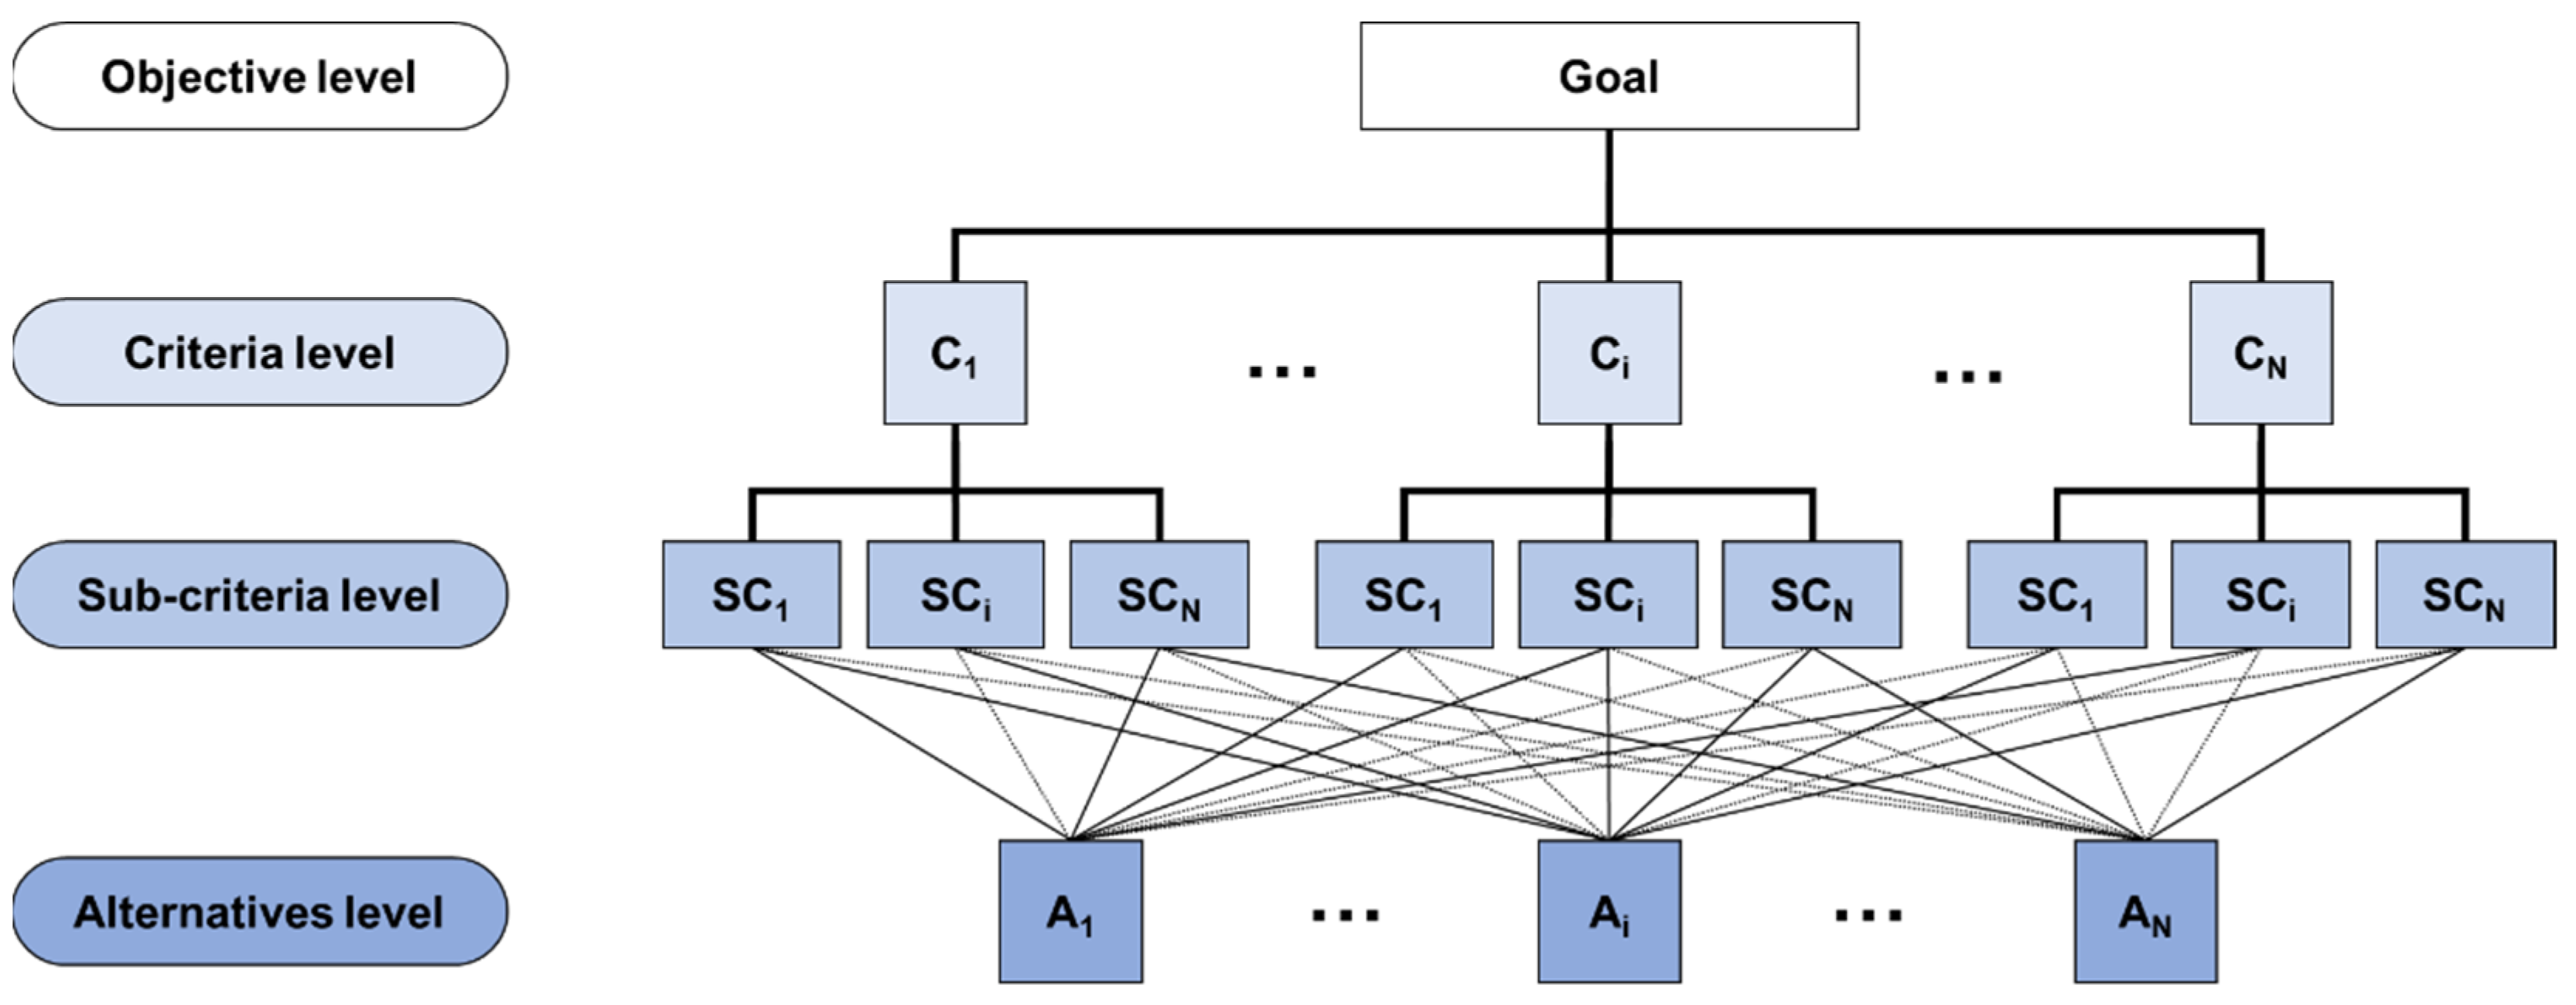
| Hierarchy Level | Description | ||||||||
|---|---|---|---|---|---|---|---|---|---|
| Objective level | Quality assessment of medical training courses | ||||||||
| Criteria level | Structure | Teacher | Organization | ||||||
| Sub-criteria level | Location | Equipment | Comfort | Preparation | Interpersonal skills | Effectiveness | Cost | Course duration | Course content |
| Teacher–Organization Pairwise Comparison | Teacher–Structure Pairwise Comparison | Organization–Structure Pairwise Comparison | |||
|---|---|---|---|---|---|
| Score | Number of Learners | Score | Number of Learners | Score | Number of Learners |
| 1/9 | 2 | 1/9 | 0 | 1/9 | 1 |
| 1/8 | 0 | 1/8 | 0 | 1/8 | 0 |
| 1/7 | 5 | 1/7 | 6 | 1/7 | 2 |
| 1/6 | 0 | 1/6 | 0 | 1/6 | 0 |
| 1/5 | 10 | 1/5 | 0 | 1/5 | 4 |
| 1/4 | 0 | 1/4 | 0 | 1/4 | 0 |
| 1/3 | 14 | 1/3 | 3 | 1/3 | 12 |
| 1/2 | 0 | 1/2 | 1 | 1/2 | 0 |
| 1 | 36 | 1 | 28 | 1 | 42 |
| 2 | 0 | 2 | 0 | 2 | 0 |
| 3 | 19 | 3 | 10 | 3 | 11 |
| 4 | 0 | 4 | 0 | 4 | 1 |
| 5 | 13 | 5 | 27 | 5 | 16 |
| 6 | 0 | 6 | 0 | 6 | 0 |
| 7 | 7 | 7 | 8 | 7 | 12 |
| 8 | 1 | 8 | 1 | 8 | 0 |
| 9 | 3 | 9 | 26 | 9 | 9 |
| WGM 1 | 1.18 ≈ 1 | WGM | 2.81 ≈ 3 | WGM | 1.67 ≈ 2 |
| Teacher | Organization | Structure | |
|---|---|---|---|
| Teacher | 1 | 1 1 | 3 1 |
| Organization | 1 2 | 1 | 2 1 |
| Structure | 1/3 2 | 1/2 2 | 1 |
| ITEM | Strongly Agree | Agree | Uncertain | Disagree | Strongly Disagree |
|---|---|---|---|---|---|
| Location | 49.1 | 45.5 | 3.6 | 1.8 | 0 |
| Equipment | 33.6 | 58.2 | 6.4 | 1.8 | 0 |
| Comfort | 37.3 | 47.3 | 11.8 | 3.6 | 0 |
| Preparation | 56.4 | 39.1 | 3.6 | 0.9 | 0 |
| Effectiveness | 60.9 | 35.5 | 1.8 | 1.8 | 0 |
| Interpersonal skills | 50.9 | 47.3 | 0.9 | 0.9 | 0 |
| Cost | 28.2 | 41.8 | 22.7 | 6.4 | 0.9 |
| Duration | 17.3 | 52.7 | 24.5 | 5.5 | 0 |
| Contents | 36.4 | 58.2 | 5.5 | 0 | 0 |
| ITEM | Strongly Agree | Agree | Uncertain | Disagree | Strongly Disagree |
|---|---|---|---|---|---|
| Structure | 40.0 | 50.3 | 7.3 | 2.4 | 0.0 |
| Teacher | 56.1 | 40.6 | 2.1 | 1.2 | 0.0 |
| Organization | 27.3 | 50.9 | 17.6 | 3.9 | 0.3 |
| Parent Criteria | |||||
| Teacher | Organization | Structure | Weight 1 | ||
| Teacher | 1 | 1 | 3 | 0.443 | |
| Organization | 1 | 1 | 2 | 0.387 | |
| Structure | 1/3 | 1/2 | 1 | 0.169 | |
| Sub-criteria belonging to the “teacher” parent criterion | |||||
| Interpersonal skills | Preparation | Effectiveness | Weight 1 | Overall weight 2 | |
| Interpersonal skills | 1 | 1/3 | 2 | 0.263 | 0.116 |
| Preparation | 3 | 1 | 2 | 0.547 | 0.242 |
| Effectiveness | 1/2 | 1/2 | 1 | 0.190 | 0.084 |
| Sub-criteria belonging to the “organization” parent criterion | |||||
| Duration | Contents | Cost | Weight 1 | Overall weight 2 | |
| Duration | 1 | 1 | 2 | 0.400 | 0.155 |
| Contents | 1 | 1 | 2 | 0.400 | 0.155 |
| Cost | 1/2 | 1/2 | 1 | 0.200 | 0.078 |
| Sub-criteria belonging to the “structure” parent criterion | |||||
| Equipment | Comfort | Location | Weight 1 | Overall weight 2 | |
| Equipment | 1 | 2 | 3 | 0.540 | 0.091 |
| Comfort | 1/2 | 1 | 2 | 0.297 | 0.050 |
| Location | 1/3 | 1/2 | 1 | 0.163 | 0.028 |
| Sub-Criterion | Overall Weight |
|---|---|
| 1. Preparation | 0.242 |
| 2. Duration | 0.155 |
| 3. Contents | 0.155 |
| 4. Interpersonal skills | 0.116 |
| 5. Equipment | 0.091 |
| 6. Effectiveness | 0.084 |
| 7. Cost | 0.078 |
| 8. Comfort | 0.050 |
| 9. Location | 0.028 |
| Scenario/Parent Criterion | 1 | 2 | 3 | 4 | 5 | 6 | 7 | 8 | 9 | 10 | 11 | 12 |
|---|---|---|---|---|---|---|---|---|---|---|---|---|
| C1 (Teacher) | −10% | 10% | 10% | 10% | −10% | −10% | −20% | 20% | 20% | 20% | −20% | −20% |
| C2 (Organization) | 10% | −10% | 10% | −10% | 10% | −10% | 20% | −20% | 20% | −20% | 20% | −20% |
| C3 (Structure) | 10% | 10% | −10% | −10% | −10% | 10% | 20% | 20% | −20% | −20% | −20% | 20% |
Publisher’s Note: MDPI stays neutral with regard to jurisdictional claims in published maps and institutional affiliations. |
© 2022 by the authors. Licensee MDPI, Basel, Switzerland. This article is an open access article distributed under the terms and conditions of the Creative Commons Attribution (CC BY) license (https://creativecommons.org/licenses/by/4.0/).
Share and Cite
Ponsiglione, A.M.; Amato, F.; Cozzolino, S.; Russo, G.; Romano, M.; Improta, G. A Hybrid Analytic Hierarchy Process and Likert Scale Approach for the Quality Assessment of Medical Education Programs. Mathematics 2022, 10, 1426. https://doi.org/10.3390/math10091426
Ponsiglione AM, Amato F, Cozzolino S, Russo G, Romano M, Improta G. A Hybrid Analytic Hierarchy Process and Likert Scale Approach for the Quality Assessment of Medical Education Programs. Mathematics. 2022; 10(9):1426. https://doi.org/10.3390/math10091426
Chicago/Turabian StylePonsiglione, Alfonso Maria, Francesco Amato, Santolo Cozzolino, Giuseppe Russo, Maria Romano, and Giovanni Improta. 2022. "A Hybrid Analytic Hierarchy Process and Likert Scale Approach for the Quality Assessment of Medical Education Programs" Mathematics 10, no. 9: 1426. https://doi.org/10.3390/math10091426
APA StylePonsiglione, A. M., Amato, F., Cozzolino, S., Russo, G., Romano, M., & Improta, G. (2022). A Hybrid Analytic Hierarchy Process and Likert Scale Approach for the Quality Assessment of Medical Education Programs. Mathematics, 10(9), 1426. https://doi.org/10.3390/math10091426