Abstract
Physical interaction in peer learning has been proven to improve students’ learning processes, which is pertinent in facilitating a fulfilling learning experience in learning theory. However, observation and interviews are often used to investigate peer group learning dynamics from a qualitative perspective. Hence, more data-driven analysis needs to be performed to investigate the physical interaction in peer learning. This paper complements existing works by proposing a framework for exploring students’ physical interaction in peer learning based on the graph analytics modeling approach focusing on both centrality and community detection, as well as visualization of the graph model for more than 50 students taking part in group discussions. The experiment was conducted during a mathematics tutorial class. The physical interactions among students were captured through an online Google form and represented in a graph model. Once the model and graph visualization were developed, findings from centrality analysis and community detection were conducted to identify peer leaders who can facilitate and teach their peers. Based on the results, it was found that five groups were formed during the physical interaction throughout the peer learning process, with at least one student showing the potential to become a peer leader in each group. This paper also highlights the potential of the graph analytics approach to explore peer learning group dynamics and interaction patterns among students to maximize their teaching and learning experience.
Keywords:
physical interaction; peer learning; graph analytics; centrality analysis; community detection; peer leaders MSC:
97P99
1. Introduction
Human interactions are omnipresent in almost every part of our lives, situation, and environment, such as in the workplace, family, friends, associates, and many more. It involves interaction and cooperation between groups of people to achieve specific objectives. Besides achieving specific aims or goals requiring interaction in groups, establishing a positive interaction leads to better mental and physical health. From an educational perspective, the learning processes at all academic stages, including childhood, primary, secondary, and tertiary education, involve human interaction.
Interaction with peers becomes one of the essential skills needed to achieve a fulfilling learning experience during college life. Peers refer to other students experiencing similar situations and sharing the same status as fellow learners. Being on par with their friends encourages students to interact and seek information regarding their studies from peers due to the ease of gaining knowledge and resulting in less anxiety in learning rather than seeking assistance from lecturers. These advantages thus lead to the emergence of peer learning.
Peer learning is described as moving beyond independent to interdependent or mutual learning that is mutually beneficial for the participants and involves exchanging knowledge, ideas, experiences, and concerns [1]. It is a feature of informal learning that is either similar to or more important than the lecturers’ effort in traditional teaching [2]. In the absence of peer learning, students will be at a disadvantage in their learning process. Therefore, the interaction in peer learning is crucial, in which good results are obtained for courses that require improvement of student retention and achievement in learning [3]. The peer learning process involves two types of interaction; physical and virtual [4]. While physical interaction can be observed in the classroom, virtual interaction often occurs on an online learning platform. Therefore, in this paper, physical interaction refers to the direct face-to-face interaction among students concerning their studies.
Previous works on peer learning focused on peer collaboration among young learners with profound and multiple learning difficulties [5], peer tutoring in second language learning [6], undergraduate STEM courses in peer learning and teaching interactions [7], peer collaboration in problem solving among children [8], and community learning among heterogeneous groups [9], among others. However, it is worth noting that most of the current works reviewing the dynamics of peer learning among the students are predominantly qualitative in nature [10].
To address the importance of peer learning, particularly in higher education, this article examines the benefits of physical interaction in the peer learning process among students using the graph analytics concept. The work in this paper is inspired by Grunspan et al. [11], who used the centrality measure to investigate an undergraduate biology classroom. Similar work focusing on biological students was also performed by Chai et al. [10]. However, they focused on only a small group of students (eight students). In addition, there are similar works utilizing graph or network modeling concepts done by Wu and Nian [12], but very few have proposed frameworks emphasize implementing graph analytics for peer learning. For example, Wong et al. [13] advocated that one of the potential uses of graph analytics allows insights into searching for predominant individuals or entities in the network and builds associations with them. For its part, the text and document analytics application promotes the bottom-up approach in order to isolate standout actors in the network and create associations between them.
Hence, to complement the existing work in the literature, this study focused on undergraduate computer science students undertaking a discrete mathematics course and investigated the dynamics of students’ physical interaction in peer learning with regard to the formation of study groups (clustering analysis) as well as peer leaders (centrality analysis) for a larger number of students through the proposed framework. The work seeks to answer the following questions: How does the survey of physical interaction among the students turn into peer group learning dynamics based on the graph analytics approach for a higher number of students through a defined framework? How can this analysis contribute to learning and education perspectives?
The findings obtained from the graph analytics approach are hoped to facilitate the lecturer or relevant education management team manage the peer learning platform by modeling and analyzing each interaction. The group pattern identification can be achieved by developing the physical interaction model of peer learning and observing the interaction in the learning process. This study hopes to initiate a progressive step in fostering an effective peer learning platform in any educational institution. In short, this paper highlights the proposed framework of exploring students’ physical interaction in peer learning based on graph analytics modeling approach focusing on both centrality and community detection as well as the visualization of the graph model.
2. Related Works
In a case study conducted by Chalaye and Male [5], two young learners diagnosed with severe and multiple learning difficulties were observed for peer collaboration. Aged 6 and 5, the older peer was initially given guidance from adults on how to provide assistance to her younger peer. Over time, the more able peer was also progressing towards using her initiative during peer collaboration. Throughout the four months of peer collaboration for the pre-school play, both learners gained many benefits, including self-confidence, behavior improvements, and increased maturity and self-esteem, some aspects in which the researchers urge for further explorations to be made. In addition, feedback and praise were given to both learners, which are deemed essential to learners in a problem-solving activity. While the less able peers could gain benefits through guidance from a more able peer, Chalaye and Male [5] suggest that attention should also be given to the more able peers. The latter need to be given opportunities to study from peers outside of their typical learning environment or the platform to develop themselves further.
The effects of peer tutoring have also been observed in an online learning environment [14]. In her study, the use of assistance tools in mathematics learning among low-achieving children to demonstrate solutions, identify errors, and provide guided instruction is afforded to the learners, thereby emphasizing the significance of providing meaningful feedback, which helped the learners to achieve significant gains in the mathematics class compared to those whom the tutor did not guide through the use of the helping tools. Peer learning and teaching interactions in a more mature setting have also been explored in which investigation of the learning experiences of students taking the STEM undergraduate courses who interact with their peer-learning assistant (peer leaders) show an improvement in their learning through different types of interactions taking place between the peer leaders and the students [7].
Past studies exploring the potential use of analytics include those looking into various ways and issues surrounding learning analytics [15], learning behaviors of low-achieving children in mathematics learning [14], and a systematic review on the Multimodal Learning Analytics and Learning Analytics practices for children under six years old [16]. Other studies have also highlighted learning analytics to predict students’ learning performance [15] and learning intervention [17]. For example, in Lu et al.’s study [18], learning analytics has been applied to analyze and predict students’ performance by analyzing student learning profiles using the regression model to improve prediction performance. This study presents the possibility of group patterns and peer leader identification observed in peer learning for potential use in other peer learning contexts.
In general, advanced analytics can be used to investigate any interaction that occurs during the learning process, including the connectivity between students, instructors, and other entities involved in the learning environment that cannot be fully represented by a linear model. As one of the advanced analytics techniques, graph analytics is becoming an increasingly important and useful technique for discovering, capturing, and making sense of complex relationships and interdependencies. A graph is typically composed of nodes and edges that represent the connections between the nodes [19]. This body of knowledge can be applied to a wide variety of application domains, allowing for data exploration via graph visualization [20,21]. Its diverse applications range from representing paths in a city to identifying circuit networks such as telephones and computers, as well as displaying social networks. In addition, each node allows for the retrieval of a variety of information, such as the user’s identity document (ID), name, gender, location, and so on.
Graph analytics are employed in various multi-disciplinary and high-impact applications to obtain multiple patterns in a given real-world system [22,23,24,25]. Path analysis, connectivity analysis, community analysis, and centrality analysis are the four types of graph analytics currently available; each has its own advantages and disadvantages. Path analysis is used to determine the shortest path between two nodes in a graph; for example, when analyzing route optimization applicable to the logistics, supply, and distribution chain, as well as traffic optimization for smart cities [26]. Furthermore, the application of connectivity analysis is used to determine the weaknesses of a network, such as a utility power grid [27], and it can also be used to compare the connectivity of networks across different organizations. On the other hand, community analysis is a distance and density-based technique used to identify clusters of nodes that are highly connected in a network. It can be used in a variety of case studies, for example, to determine whether the entity represented by the nodes is transient and to predict whether the network will grow [28]. Centrality analysis allows for the identification of relevancy in order to determine which node in a network is the most influential node [29,30].
Several scholars have acknowledged the complementary use of graph analytics or network analysis in educational and learning settings [31,32,33,34]. However, little is known about the graph concept adopted in previous works, particularly details that enrich the literature by adding a mathematical modeling component in the methodology. Moreover, the existing studies are lacking in presenting the framework that specifically positions graph analytics or network analysis in a peer learning context. Most of the works present a framework on education perspectives when applying graph modeling [12]. Moreover, the number of students involved in most existing studies is still relatively small scale; most do not exceed 30 students [10,11,35]. This paper focused on using centrality analysis and community analysis to investigate the physical interaction in peer learning during a mathematics tutorial class in one of the Malaysian public universities by proposing a defined framework. Centrality analysis was used in this study to identify the peer leaders, while community analysis was utilized to determine the groups of heavily connected students. The graph visualization concerning the centrality and community analyses and the grades obtained during the test is generated and further analyzed. The test grade was also included in the analysis, which mainly aims to observe whether the preference to consult a particular peer in the group is related to their achievement in mathematics.
3. Methodology
The primary aim of this study was to build upon a student physical peer learning interaction model during the learning process by observing each physical interaction among the students in the mathematics tutorial class. The students investigated in this study were all students in their first year of the Bachelor of Computer Science (Artificial Intelligent) program cohort were 2019/2020 undertaking a discrete mathematics course during the first semester. This study included a total of 53 students ranging in age from 19 to 22 years old. The researchers followed the operation research project methodology that included the following progression: (1) determining problem definition and data collection; (2) building the model; (3) finding and developing solutions; (4) testing and validation; and (5) disseminating, using, or deploying the solution [36].
Figure 1 depicts the study’s specific framework, which outlines the study’s three phases: pre-processing, processing, and post-processing. In the pre-processing phase, a survey was performed by utilizing the Google online form for data capturing of interaction data. The sample question in the survey is given in Appendix A. The interaction data was then combined with the mathematics test scores obtained from the instructor’s databases to prepare the peer learning dataset, as explained in detail in Section 3.1. The peer learning dataset was then converted into a network object of nodes and edges in the processing phase. Once converted, a graph model representing the dynamics of physical interaction in peer learning was developed and visualized. In this study, both centrality analysis and community detection of graph analytics are utilized to investigate the dynamics of physical interaction (Section 3.2). Post-processing has been useful in reflecting the results obtained from graph analytics into the perspective of peer learning context. As can be seen in Figure 1, centrality analysis is beneficial to be used when determining peer leaders. At the same time, community detection helps determine peer group formation.
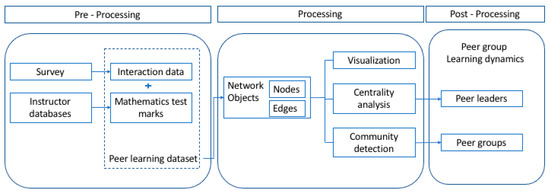
Figure 1.
The framework adopted in the study.
3.1. Preparing the Dataset of Physical Interaction in Peer Learning
A short survey was designed to ascertain the students’ interaction using a Google online form while learning mathematics. Important details that were gathered from the survey include respondent details (name, student ID, course or program enrolled), study habits (independent learning/learning from peers, etc.), and student acknowledgment of peer learning support (to identify peer leader).
For analysis purposes, the acknowledgment of peer learning support is repeated to allow students to list their peers (a maximum of 10 names) who become their referrals. All the responses were automatically recorded in an Excel sheet and extracted to determine the initial and terminal nodes. In this research, the node represents the student. In contrast, the edge represents the presence of physical interaction in peer learning among the students. Figure 2 illustrates some portion of the student’s physical interaction in the mathematics tutorial session.
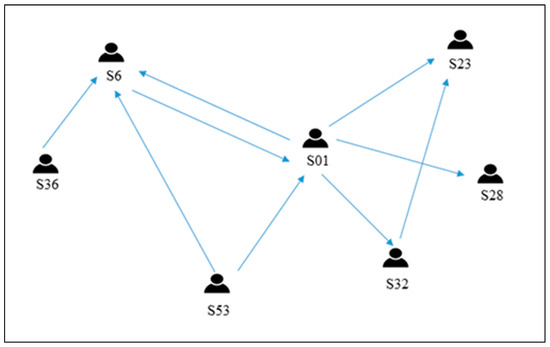
Figure 2.
A portion of student physical interaction during the mathematics tutorial session.
As shown in Figure 2, students were connected via direct links representing the physical interaction. In the findings, it was observed that one particular student (S36) always refers to S6 during the mathematics tutorial class. Therefore, S36 is classified as the initial node in this example, while S6 is the terminal node connected by the directed edge.
This study not only captures the details of the interaction between one student and another, but it also captures the results of the mathematics test. This score was obtained by extracting information from the instructor’s databases and entering it into the dataset. Through the visualization of the model, the test score information assisted in providing deeper insights into the process of forming the study group.
3.2. Graph Analytics for Student Interaction
Once the dataset (Excel format) is ready, the dataset is loaded into the R Studio for the graph analytics procedure. The data are then transformed into node and edge network objects. The graph model is developed and further analyzed using the igraph library packages once the nodes and edges have been created [37]. The igraph is a set of network analysis tools that focuses on performance, portability, and simplicity of use. It is a free and open-source program that is supported in R, Python, Mathematica, and C/C++. Essentially, igraph initially converts raw data into network objects that require two data frames; d and vertices, as the following function:
graph_from_data_frame (d, vertices = NULL, directed = TRUE)
In the above function, the network’s edges are described by “d”, in which the IDs of the source and target nodes for each edge are listed in the first two columns, while edge properties are listed in the following columns (weight, type, label, or anything else). The second data frame in the function, “vertices”, contains a column of node IDs and node attributes in the following columns if necessary. Once the data have been successfully converted into network objects, other network analysis tools such as centrality and community detection can be performed using the following functions:
Function for centrality:
degree (graph, v = V(graph), mode = c(“all”, “out”, “in”, “total”), loops = TRUE, normalized = FALSE)
Function for community detection:
cluster_fast_greedy (graph, merges = TRUE, modularity = TRUE, membership = TRUE, weights = E(graph)$weight)
The centrality analysis was used to investigate the physical interaction among the students in their learning process. The specific matrix used is the in-degree centrality to identify peer leaders whom students referred to during the mathematics tutorial class. In addition, community detection analysis was used to determine study groups during peer learning interaction.
In this paper, the student physical peer learning interaction graph is denoted as G (V,E), made up of two components:
- (a)
- The student set of n nodes for . In this case, each node represents a student, and n represents the total number of students in the mathematics tutorial class.
- (b)
- The student physical interaction set which is the edge representing the student’s physical interaction from node (or ) to node (or ). This is a directed edge in which it represents student node refers to student node . The total number of interactions is .
Since this study utilized the centrality analysis of in-degree centrality, the following governing equation is used [38]:
In the above equation, denotes the in-degree centrality for node in which and denotes any edge that points inward from node to node . The centrality analysis of in-degree centrality is important to conduct in this study in order to identify peer leaders who are referred to by their peers during the math tutorial class.
Another interesting concept in graph analytics is finding the dense sub-graph or the present community detection in the graph. This study applied the fast greedy modularity optimization algorithm to find the community structure in which the set of governing equations can be referred to by Clauset et al. [39]. The reason for using a fast greedy modularity optimization algorithm is because it is proven to be a faster algorithm as well as it works well with both contrived test cases and real-world situations [39,40,41]. In the algorithm, a community is associated with each node of the network. Then, it repeatedly joins the communities whose union results in the greatest gain in community structure modularity, Q. The strategy seeks to identify the community combination that produces the greatest increase in Q and then conduct such an operation. The approach identifies the pair of communities that, when united, produce the highest modularity value. Such a value might be viewed as an affinity measure between two generic communities, with the goal of finding two communities that are similar enough to be linked together [39,42]. The complexity of the algorithm is O((l + n)n) [43]. In this study, community detection in the graph represents the study group formed from the student physical peer learning interaction process during the mathematics tutorial class. The R code to construct the network graph as well as the centrality and community detection analysis in this study is attached as Appendix B.
4. Results
Once the raw data have been converted into an igraph network object using the igraph library in R, the student physical interaction graph, G (V,E), is obtained. G represents the student’s physical interaction during studying mathematics in the tutorial session, consisting of (1) set V represented as the student nodes and (2) set E represented as physical interaction among the students. Table 1 outlines the main characteristics of student interaction data. Every student in the mathematics tutorial class is represented in Table 1 as 53 nodes. The students in the class completed a total of 176 physical interactions, which are classified as 176 directed edges.

Table 1.
Dataset: Summary Statistics.
The graph G (V,E) representing the student’s physical interaction during the mathematics tutorial session is depicted in Figure 3. The nodes represent the students, while the edges represent the physical interaction taking place between the students. The results indicate that directed edges connect from both nodes S25 and S45 to node S19, as illustrated in Figure 3, indicating that S19 became the referral for S25 and S45. Hence, the in-degree for node S19 is 2. Based on the same figure, other-directed edges connected from node S43 include S51, S42, S47, S16, and S44, signifying that S43 referred to S51, S42, S47, S16, and S44 in the case study. Therefore, the out-degree of the node is 5. As shown in Figure 3, it can be observed that some nodes only have inward edges. To illustrate, only one inward edge is demonstrated by node S34 coming from node S37. In this case, the in-degree for node S34 is 1, indicating that S34 is only referred to by S37. The ‘refer and being referred’ activity among the students represents the student physical interaction in peer learning investigated and modeled in this study.
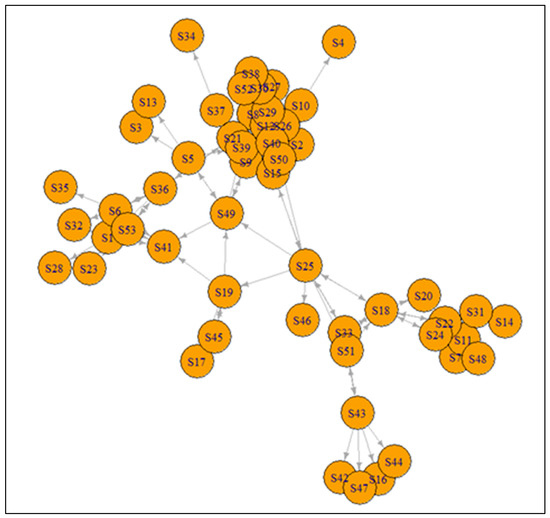
Figure 3.
The visualization of graph G (V,E).
Since the study aimed to identify the peer leaders who collaborate actively and become referrals to their friends during the mathematics tutorial class, the graph analytics utilizes the in-degree matrix as illustrated in Equation (1). The results of the in-degree matrix signifying students’ physical interaction during the mathematics tutorial class are summarized in Table 2. In this case study, nodes with higher in-degree indicate potential peer leaders in the classroom. Their active involvement in peer learning is determined by the number of students who interact directly. From the analysis, it can be seen that the top 5% nodes with the highest in-degree value are nodes S12, S39, and S9, with the values of 11, 9, and 8, respectively. In other words, these students (S12, S39, and S9) are those who are actively collaborating and guiding their peers during the mathematics tutorial session.
Table 2.
Dataset: Result in-degree matrix.
Identifying students who actively collaborate and assist their peers during the tutorial is difficult to detect solely through the visualization of the graph G (V,E), as shown in Figure 3. This is because the graph illustrates the nodes in similar colors and sizes. However, with the availability of the in-degree value from the graph analytics procedure, the visualization of the entire graph has been revised. As shown in Figure 4, the graph was re-plotted by changing the size of all the nodes based on their in-degree measure. Visually, it can be seen that node S12 is the biggest, followed by nodes S39 and S9, as the former has the highest in-degree compared to nodes S39 and S9. From the figure, the nodes that have an in-degree value of 1 are the smallest. The size of the nodes is congruent with the value of the in-degree measure, according to previous findings.
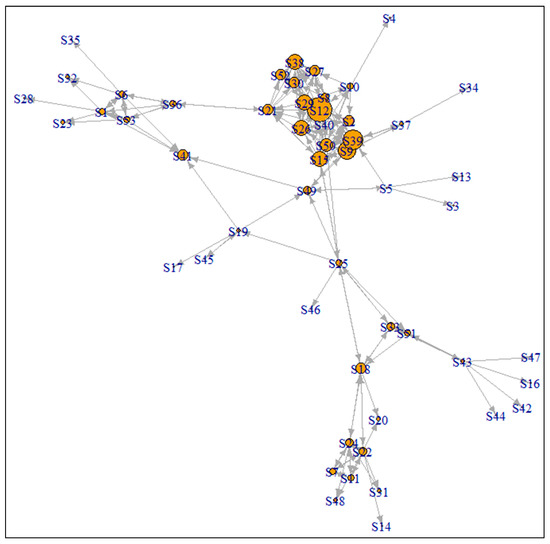
Figure 4.
The revised visualization of the graph is based on the in-degree measure.
One of the many factors that allow peer leaders to work collaboratively with their peers is their competency in mathematics, as reflected by the test scores obtained. To further investigate why particular students are more competent than others, students’ scores obtained during the test were combined in the dataset. Instead of having the graph visualization depending solely on the in-degree value for the size of the nodes, the graph visualization was revised by embedding the test scores. For better visualization, the test score was ranked and presented by color. In this case study, the scores for the test were ranked as 1, 2, and 3, which indicate high, medium, and low scores obtained in the test. Thus, nodes with ranks 1, 2, and 3 were represented by grey, red, and green. The revised graph visualization concerning in-degree and test mark rank is shown in Figure 5. It can be seen that the size of the nodes was bigger for those who obtained excellent or high scores in their test as well as those who had a higher in-degree value. To illustrate, node 12 has the highest in-degree value and, at the same time, obtained a higher score in the test, which indicates that S12 is the peer leader in the class who scored excellently in the mathematics test.
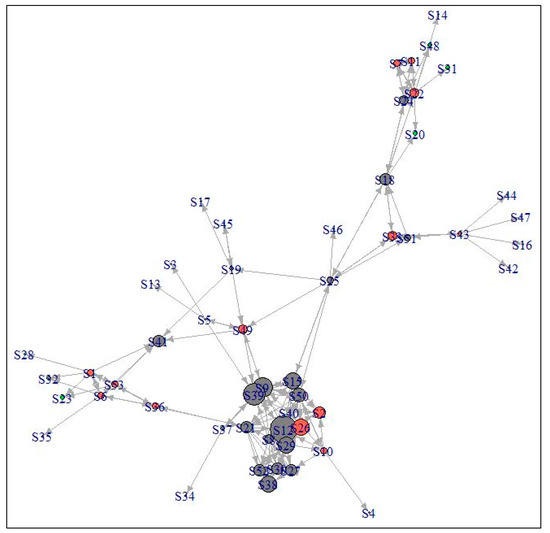
Figure 5.
The revised graph visualization with regards to in-degree and test mark rank.
Using the community detection concept of graph analytics to observe students’ physical interactions, it was found that a total of five groups were formed in the tutorial class. The five groups are highlighted in Figure 6, and details of each group are presented in Table 3. Based on the analysis, it can be observed that each group consists of at least one student who obtained a good result and has the ability to become a peer leader in the group.
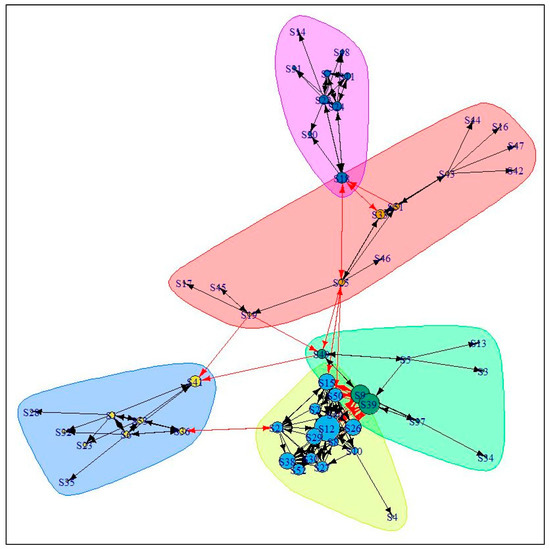
Figure 6.
The study group based on the results of community detection.
Table 3.
Dataset: Summary Statistics.
Does this pattern indicate an initial assumption that the student group was formed based on trust and competency? This assumption opens a new area of study that can be explored further in future studies. The following section thus provides insights on peer learning, peer leaders, and the formation of study groups.
5. Discussion
This section discusses the implications of the graph analytics approach and provides some practical suggestions on peer learning. Graph analytics can help instructors identify patterns that otherwise could not be distinguished through in-class observation. The analysis is beneficial when it comes to creating an effective learning environment for students. Although the analysis may be considered relatively simple, it offers insights for the instructors to initiate strategies for delivering effective lectures, conducting tutorial sessions, and enhancing student learning experience both academically and individually. Practical and effective teaching and learning strategies will provide a more holistic educational life experience for the students.
Graph analytics facilitates the identification of high-ability students who have the potential to become peer leaders. Chalaye and Male [5] lamented that these ‘accidental leaders’ should be groomed as peer leaders because they seem to be referrals for their peer learning groups. Instructors can identify and select these peer leaders to participate in peer leadership training programs run by the university’s student affairs department, which will provide them with the competencies and skills they need to become more effective peer leaders. Baker [44] listed four leadership competencies of peer leaders as the ability to (i) assist peer groups in determining goals and making decisions, (ii) participate or focus on the concerns of the peers by listening and encouraging and including them in decision making, (iii) be physically present during the process of peer guidance, and (iv) reflect and analyze the situation involved. Students groomed to be peer leaders will assist the instructors more effectively in the teaching and learning process and simultaneously acquire new skills, including leadership skills, social skills, self-confidence, and personal identity [45,46]. These generic skills will be valuable assets for peer leaders, especially when they embark on professional careers.
Several researchers exploring the context of peer learning propose the formalization of peer learning to help students more effectively [9,47,48]. Students seek guidance from peer leaders both in and outside the formal classroom and take responsibility for their learning through peer learning. Keppell et al. [49] acknowledge peer learning as both formal and informal learning. They stressed that informal peer learning occurs when they participate in lectures, assignments, projects, and exams in casual social settings. On the other hand, formal peer learning occurs when courses explicitly arrange group work or projects. Williamson and Paulsen-Becejac [48] recommend that tutors structure the process and facilitate student learning activities to allow students to gain the full benefits of interacting with their peers. The learning process can be shifted from teacher-centered to learner-centered with the proper structure of peer learning.
It is important to note that peer learning can be applied beyond the context of academic matters. Identifying the peer leader will help members of the peer group overcome situations when they lack motivation or loss hope. Studying at universities can often impose a great deal of stress. Some students may seek help beyond academic matters, where peer leaders can offer valuable assistance. Because peer leadership is a form of social support that students perceive as more approachable and less threatening than older professionals and authority figures, it is a powerful force [50]. It is found that peer counseling groups offer more significant social support and positive effects on promoting healthy development in young people [51]. The support includes facilitating interpersonal relationships, promoting a healthy lifestyle [52], and facilitating intercultural interaction [53]. The availability of peer leaders who are selected among high-ability students will assist their peers in achieving academic success and personal struggles during their study years. With this in mind, universities’ counseling departments are encouraged to provide soft skills training such as effective communication, stress management, and basic helping skills to peer leaders to equip them with the necessary tools to help their peers with life challenges.
In short, student involvement in the peer learning process has provided a win–win situation for all three parties involved; the peer leader, the peer group, and the faculty [54]. The graph analytics approach adopted in this study provides a broader opportunity to identify the group pattern and high-ability students who have the potential to be peer leaders. In addition, the graph analytics model can also be extended to other areas of study, such as group work and leadership.
To assist instructors and educators in embedding a graph analytics approach when observing peer group dynamics in their classrooms, this study proposes several strategies, as follows:
- (1)
- Assess students’ performance in learning interaction through centrality measure in graph analytics. Centrality measures such as in-degree metrics are useful to monitor students who actively collaborate and guide their peers in the classroom.
- (2)
- Detect any group patterns based on the community detection of graph analytics measurement in peer learning dynamics through physical interaction in the classroom. Once the peer group is identified, mixed ability grouping can be formed to assist with peer tutoring within the peer interaction and the task delegation for the group activities.
- (3)
- Identify peer leaders through graph analytics. When peer leaders can be identified, it is easier for the instructors to understand and facilitate the assistance required to establish better group dynamics among the students and provide guidance to the peer leaders who should be exposed to environments more conducive to developing their skills and knowledge.
6. Conclusions
Physical interaction in peer learning improves students’ learning process through enhancing problem-solving skills and critical thinking. Thus, in addressing the significance of effective peer learning, this paper highlights the effects of physical interaction among students by applying the graph analytics model through the proposed framework. The study used two main concepts of graph analytics: centrality analysis and community detection analysis. Centrality analysis was used to identify high-ability students who become peer leaders during the mathematics tutorial class, while community detection was used to determine the study groups resulting from students’ physical interaction. Based on the investigation, about 5% of the students have high in-degree values. These students are actively engaging and facilitating their peers during the mathematics tutorial class. The model highlighted the formation of five study groups. Each group has at least one student who obtained a good result and had the potential to become a peer leader in the group.
The graph analytics model provides a key technique for discovering, capturing, and making sense of complex relationships and interdependencies, which is a significant benefit of using it in this study. In the context of teaching and learning from and with their peers, the graph analytics model approach aids in identifying the pattern of group dynamics and potential peer leaders. This can potentially maximize the role of instructors or peer leaders in peer-group learning, and peer collaboration can develop learners’ optimum potential. Furthermore, the graph analytics model can obtain new ideas and opportunities for future investigation areas. Hence, this paper serves as a platform to expose academicians and related professionals to the possible utilization of the graph analytics model in investigating student physical interaction in the peer learning process to make continuous improvements toward achieving an effective teaching and learning environment.
It must be noted that this paper presents an initial study of physical interaction in peer learning. Hence, at present, the collected data are still in its initial phase. However, considerations should be made in future research based on some concerns and limitations. First, performing a longitudinal study using another approach within the graph analytics should provide more evidence of the effectiveness of peer interaction and group learning dynamics investigated in this study. This is to allow further examination of possible repeated interaction between peers and detect any changes that may occur over a period of time. This requires a temporal graph analytics approach for such investigation to be performed. Second, to establish a quantitative comparative study of the most significant findings. Third, to perform a comparison of different existed algorithms with the proposed algorithm. Fourth, to conduct a yearly observation in order to provide a more comprehensive analysis since the result is based on a single observation. Moreover, it is also recommended that further research should attempt to explore the role of in-person peer learning as well as the context of online peer learning during the post COVID-19 pandemic adaptations.
Author Contributions
Conceptualization, Z.A.A. and Z.Z.A.; methodology, A.F.N.A.R. and N.H.M.Z.; software, M.N.N.; validation, I.H.A.T.; formal analysis, S.A.S.; investigation, Z.A.A.; resources, W.F.W.W.F.; data curation, H.R.; writing—original draft preparation, Z.A.A.; writing—review and editing, W.F.W.W.F. and M.N.N.; visualization, M.N.N.; supervision, Z.A.A.; project administration, A.F.N.A.R.; funding acquisition, M.N.N. and S.A.S. All authors have read and agreed to the published version of the manuscript.
Funding
This research received no external funding.
Institutional Review Board Statement
Not applicable.
Informed Consent Statement
Not applicable.
Data Availability Statement
Not applicable.
Acknowledgments
Special thanks to Universiti Teknikal Malaysia Melaka (UTeM), Universiti Malaysia Perlis (UniMAP), Universiti Malaysia Kelantan (UMK), Universiti Malaya (UM), and Universiti Teknologi Malaysia (UTM) for allowing researchers to conduct this independent project successfully.
Conflicts of Interest
The authors declare no conflict of interest.
Appendix A
Here is an appendix that contains a copy of the question that was sent to the student via Google Form. The following are the questions that have been posed:
- What is your full name? (e.g., Nurul Hafizah Binti Mohd Zaki)
- What is your student identification card number? (e.g., B031710289)
- What is your course program? (e.g., BITZ, BITI, BITE)
- Do you always refer to your friends whenever you are studying mathematics this semester? (Yes or No)
- If you answered yes, please provide the full name of your friend, as many as you referring to. Maximum is only 10. (e.g., Friend 1—Ahmad Fadzli Nizam Abdul Rahman, Friend 2—Hidayah Rahmalan)
- List of subjects taken in the current semester, along with the name of the lecturer who taught them. (e.g., Subject 1—Mathematics, Lecturer 1—Zaheera Binti Zainal Abidin, Subject 2—Data Analytics, Lecturer 2—Zuraida Binti Abal Abas)
Appendix B
The following is the R code that was used to construct the network graph, as well as the centrality and community detection analyses that were performed in this study:
- getwd()
- setwd(“D:/Z/Graph Analytics/Connectivity among students BITE”)
- library(“readxl”)
- library(“igraph”)
- nodes <- read_excel(“IDStudent-Nodes-with-marks.xlsx”)
- links <- read_excel(“IDStudent-Edges v2.xlsx”)
- net_students <- graph_from_data_frame(d=links, vertices=nodes, directed=T)
- summary(net_students)
- V(net_students)
- E(net_students)
- #visualisation by plotting the graph
- plot(net_students, edge.arrow.size=0.3)
- #centrality analysis
- #visualisation by plotting the graph according to in-degree value for node size
- in_deg <- degree(net_students, mode=“in”)
- in_deg
- plot(net_students, edge.arrow.size=0.3, vertex.size=in_deg*1)
- #visualisation by plotting the graph according to in-degree for node size and different color of mark rank for node color
- colrs <- c(“gray50”, “tomato”, “green”)
- V(net_students)$color <- colrs[V(net_students)$Test_Grade]
- plot(net_students, edge.arrow.size=0.3, vertex.size=in_deg*1)
- #cluster analysis and visualisation
- #To plot the graph according to the in-degree value for node size.
- cfg <- cluster_fast_greedy(as.undirected(net_students))
- cfg
- plot(cfg, net_students, edge.arrow.size=0.3, vertex.size=in_deg*1)
- length (cfg)
- membership(cfg)
- sort(membership(cfg))
References
- Topping, K.; Buchs, C.; Duran, D.; van Keer, H. Effective Peer Learning; Routledge: New York, NY, USA, 2017; ISBN 9781315695471. [Google Scholar]
- Barnard, S.; Mallaband, B.; Leder Mackley, K. Enhancing skills of academic researchers: The development of a participatory threefold peer learning model. Innov. Educ. Teach. Int. 2019, 56, 173–183. [Google Scholar] [CrossRef] [Green Version]
- Candela, A. Peer organized study groups: Successful learning interactions in Mexican undergraduate physics. Learn. Cult. Soc. Interact. 2018, 19, 11–21. [Google Scholar] [CrossRef]
- Hartwick, P. Investigating research approaches: Classroom-based interaction studies in physical and virtual contexts. ReCALL 2018, 30, 161–176. [Google Scholar] [CrossRef]
- Chalaye, C.; Male, D. Applying Vygotsky’s zone of proximal development and peer collaboration to pupils with profound and multiple learning difficulties and severe learning difficulties: Two case studies. SLD Exp. 2011, 61, 13–18. [Google Scholar]
- Haider, M.; Yasmin, A. Significance of Scaffolding and Peer Tutoring in the Light of Vygotsky’s Theory of Zone of Proximal Development. Int. J. Lang. Lit. Linguist. 2015, 1, 170–173. [Google Scholar] [CrossRef] [Green Version]
- Gong, H.J.; Park, H.; Hagood, T.C. Peer learning in STEM: A qualitative study of a student-oriented active learning intervention program. Interact. Learn. Environ. 2020. [Google Scholar] [CrossRef]
- Fawcett, L.M.; Garton, A.F. The effect of peer collaboration on children’s problem-solving ability. Br. J. Educ. Psychol. 2005, 75, 157–169. [Google Scholar] [CrossRef]
- Crocitto, M.M.; Walsh, L.D.; Murphy, A.; Keefe, M.A. Diversity as a natural occurrence: An enrichment strategy of peer learning. Interact. Learn. Environ. 2018, 26, 61–74. [Google Scholar] [CrossRef]
- Chai, A.; Le, J.P.; Lee, A.S.; Lo, S.M. Applying graph theory to examine the dynamics of student discussions in small-group learning. CBE Life Sci. Educ. 2019, 18, ar29. [Google Scholar] [CrossRef] [Green Version]
- Grunspan, D.Z.; Wiggins, B.L.; Goodreau, S.M. Understanding classrooms through social network analysis: A primer for social network analysis in education research. CBE Life Sci. Educ. 2014, 13, 167–178. [Google Scholar] [CrossRef]
- Wu, J.Y.; Nian, M.W. The dynamics of an online learning community in a hybrid statistics classroom over time: Implications for the question-oriented problem-solving course design with the social network analysis approach. Comput. Educ. 2021, 166, 104120. [Google Scholar] [CrossRef]
- Wong, P.C.; Chen, C.; Gorg, C.; Shneiderman, B.; Stasko, J.; Thomas, J. Graph Analytics-Lessons Learned and Challenges Ahead. IEEE Comput. Graph. Appl. 2011, 31, 18–29. [Google Scholar] [CrossRef] [PubMed]
- Tsuei, M. Learning behaviours of low-achieving children’s mathematics learning in using of helping tools in a synchronous peer-tutoring system. Interact. Learn. Environ. 2017, 25, 1–15. [Google Scholar] [CrossRef]
- Hwang, G.-J.; Chu, H.-C.; Yin, C. Objectives, methodologies and research issues of learning analytics. Interact. Learn. Environ. 2017, 25, 143–146. [Google Scholar] [CrossRef] [Green Version]
- Crescenzi-Lanna, L. Multimodal Learning Analytics research with young children: A systematic review. Br. J. Educ. Technol. 2020, 51, 1485–1504. [Google Scholar] [CrossRef]
- Hwang, G.J. Definition, framework and research issues of smart learning environments—A context-aware ubiquitous learning perspective. Smart Learn. Environ. 2014, 1, 4. [Google Scholar] [CrossRef]
- Lu, O.H.T.; Huang, A.Y.Q.; Huang, J.C.H.; Lin, A.J.Q.; Ogata, H.; Yang, S.J.H. Applying learning analytics for the early prediction of students’ academic performance in blended learning. Educ. Technol. Soc. 2018, 21, 220–232. [Google Scholar]
- Nathan, E.; Sanders, G.; Henson, V.E.; Bader, D.A. Numerically approximating centrality for graph ranking guarantees. J. Comput. Sci. 2018, 26, 205–216. [Google Scholar] [CrossRef]
- Dzwinel, W.; Wcisło, R.; Czech, W. ivga: A fast force-directed method for interactive visualization of complex networks. J. Comput. Sci. 2017, 21, 448–459. [Google Scholar] [CrossRef]
- Gómez-Romero, J.; Molina-Solana, M.; Oehmichen, A.; Guo, Y. Visualizing large knowledge graphs: A performance analysis. Futur. Gener. Comput. Syst. 2018, 89, 224–238. [Google Scholar] [CrossRef]
- Berahmand, K.; Haghani, S.; Rostami, M.; Li, Y. A new attributed graph clustering by using label propagation in complex networks. J. King Saud Univ. Comput. Inf. Sci. 2020. [Google Scholar] [CrossRef]
- Berlingerio, M.; Coscia, M.; Giannotti, F.; Monreale, A.; Pedreschi, D. The pursuit of hubbiness: Analysis of hubs in large multidimensional networks. J. Comput. Sci. 2011, 2, 223–237. [Google Scholar] [CrossRef]
- Eblen, J.D.; Phillips, C.A.; Rogers, G.L.; Langston, M.A. The maximum clique enumeration problem: Algorithms, applications, and implementations. BMC Bioinform. 2012, 13, S5. [Google Scholar] [CrossRef] [PubMed] [Green Version]
- Jiang, W.; Wang, G.; Wu, J. Generating trusted graphs for trust evaluation in online social networks. Futur. Gener. Comput. Syst. 2014, 31, 48–58. [Google Scholar] [CrossRef]
- Saberi, M.; Mahmassani, H.S.; Brockmann, D.; Hosseini, A. A complex network perspective for characterizing urban travel demand patterns: Graph theoretical analysis of large-scale origin–destination demand networks. Transportation 2017, 44, 1383–1402. [Google Scholar] [CrossRef]
- Werho, T.; Vittal, V.; Kolluri, S.; Wong, S.M. Power System Connectivity Monitoring Using a Graph Theory Network Flow Algorithm. IEEE Trans. Power Syst. 2016, 31, 4945–4952. [Google Scholar] [CrossRef]
- Cao, J.; Wang, H.; Jin, D.; Dang, J. Combination of links and node contents for community discovery using a graph regularization approach. Futur. Gener. Comput. Syst. 2019, 91, 361–370. [Google Scholar] [CrossRef]
- Dingyloudi, F.; Strijbos, J.-W. Just plain peers across social networks: Peer-feedback networks nested in personal and academic networks in higher education. Learn. Cult. Soc. Interact. 2018, 18, 86–112. [Google Scholar] [CrossRef]
- Harrison, K.R.; Ventresca, M.; Ombuki-Berman, B.M. A meta-analysis of centrality measures for comparing and generating complex network models. J. Comput. Sci. 2016, 17, 205–215. [Google Scholar] [CrossRef]
- Cela, K.L.; Sicilia, M.Á.; Sánchez, S. Social Network Analysis in E-Learning Environments: A Preliminary Systematic Review. Educ. Psychol. Rev. 2015, 27, 219–246. [Google Scholar] [CrossRef]
- Laninga-Wijnen, L.; Ryan, A.M.; Harakeh, Z.; Shin, H.; Vollebergh, W.A.M. The moderating role of popular peers’ achievement goals in 5th- and 6th-graders’ achievement-related friendships: A social network analysis. J. Educ. Psychol. 2018, 110, 289–307. [Google Scholar] [CrossRef]
- Ruane, R.; Koku, E.F. Social Network Analysis of Undergraduate Education Student Interaction in Online Peer Mentoring Settings. MERLOT J. Online Learn. Teach. 2014, 10, 577–589. [Google Scholar]
- Shen, D.; Nuankhieo, P.; Huang, X.; Amelung, C.; Laffey, J. Using Social Network Analysis to Understand Sense of Community in an Online Learning Environment. J. Educ. Comput. Res. 2008, 39, 17–36. [Google Scholar] [CrossRef]
- Lee, J.; Bonk, C.J. Social network analysis of peer relationships and online interactions in a blended class using blogs. Internet High. Educ. 2016, 28, 35–44. [Google Scholar] [CrossRef]
- Cochran, J.J. INFORMS Analytics Body of Knowledge; Wiley: New Jersey, United State of America, 2018; ISBN 9781119483212. [Google Scholar]
- Csárdi, G.; Nepusz, T. igraph: Network Analysis and Visualization; RStudio: Boston, United State of America, 2019. [Google Scholar]
- Salleh, S.; Abal Abas, Z. Simulation for Applied Graph Theory Using Visual C++; CRC Press Taylor & Francis Group: Boca Raton, FL, USA, 2016; ISBN 9781498721011. [Google Scholar]
- Clauset, A.; Newman, M.E.J.; Moore, C. Finding community structure in very large networks. Phys. Rev. E Stat. Phys. Plasmas Fluids Relat. Interdiscip. Top. 2004, 70, 066111. [Google Scholar] [CrossRef] [Green Version]
- Newman, M.E.J. Modularity and community structure in networks. Proc. Natl. Acad. Sci. USA 2006, 103, 8577–8582. [Google Scholar] [CrossRef] [Green Version]
- Mourchid, Y.; El Hassouni, M.; Cherifi, H. A general framework for complex network-based image segmentation. Multimed. Tools Appl. 2019, 78, 20191–20216. [Google Scholar] [CrossRef] [Green Version]
- Vieira, V.D.F.; Evsukoff, A.G.; Xavier, C.R.; Ebecken, N.F.F. Performance Evaluation of Modularity Based Community Detection Algorithms in Large Scale Networks. Math. Probl. Eng. 2014, 2014, 502809. [Google Scholar] [CrossRef]
- Mester, A.; Pop, A.; Mursa, B.-E.-M.; Greblă, H.; Dioşan, L.; Chira, C. Network Analysis Based on Important Node Selection and Community Detection. Mathematics 2021, 9, 2294. [Google Scholar] [CrossRef]
- Baker, J.P. Peer Leadership on the College Campus -- Competencies and Skills for Success. Int. J. Leadersh. Chang. 2015, 3, 6. [Google Scholar]
- Astin, H.S.; Kent, L. Gender Roles in Transition: Research and Policy Implications for Higher Education. J. High. Educ. 1983, 54, 309. [Google Scholar] [CrossRef]
- Harmon, B.V. A Qualitative Study of the Learning Processes and Outcomes Associated with Students Who Serve as Peer Mentors. J. First-Year Exp. Stud. Transit. 2006, 18, 53–82. [Google Scholar]
- Boud, D. Introduction: Making the move to peer learning. In Peer Learning in Higher Education: Learning from and with Each Other; Routledge: England, United Kingdom, 2014; p. 17. ISBN 9781135383466. [Google Scholar]
- Williamson, S.; Paulsen-Becejac, L. The Impact of Peer Learning within a Group of International Post-graduate Students—A Pilot Study. Athens J. Educ. 2018, 5, 7–27. [Google Scholar] [CrossRef]
- Keppell, M.; Au, E.; Ma, A.; Chan, C. Peer learning and learning-oriented assessment in technology-enhanced environments. Assess. Eval. High. Educ. 2006, 31, 453–464. [Google Scholar] [CrossRef]
- Peregrina-Kretz, D.; Seifert, T.; Arnold, C.; Burrow, J. Finding their way in post-secondary education: The power of peers as connectors, coaches, co-constructors and copycats. High. Educ. Res. Dev. 2018, 37, 1076–1090. [Google Scholar] [CrossRef]
- Nozawa, H.; Ikegami, K.; Michii, S.; Sugano, R.; Ando, H.; Kitamura, H.; Ogami, A. Peer counseling for mental health in young people—Randomized clinical trial. Ment. Health Prev. 2019, 14, 200164. [Google Scholar] [CrossRef]
- Gutuskey, L.; McCaughtry, N.; Shen, B.; Centeio, E.; Garn, A. The role and impact of student leadership on participants in a healthy eating and physical activity programme. Health Educ. J. 2016, 75, 27–37. [Google Scholar] [CrossRef] [Green Version]
- Keup, J.R.; Mullins, E. Findings From a National Survey of Peer Leadership Experiences and Outcomes. In Proceedings of the 29th Annual Conference on The First-Year Experience; National Resource Center for The First Year Experience & Students in Transition, Denver, CO, USA, 12–16 February 2010. [Google Scholar]
- Metz, G.; Cuseo, J.B.; Thompson, A. Peer-to-Peer Leadership: Transforming Student Culture, 1st ed.; Kendall Hunt Publishing Company: Dubuque, IA, USA, 2013; ISBN 9781465215611. [Google Scholar]
Publisher’s Note: MDPI stays neutral with regard to jurisdictional claims in published maps and institutional affiliations. |
© 2022 by the authors. Licensee MDPI, Basel, Switzerland. This article is an open access article distributed under the terms and conditions of the Creative Commons Attribution (CC BY) license (https://creativecommons.org/licenses/by/4.0/).