Article

A Model for Assessing the Causality of Factors in the Development of Voluntary Pension Insurance in the Republic of Kazakhstan

1
Department of Business Informatics, Ural State University of Economics, 620144 Yekaterinburg, Russia
2
Faculty of Economic Sciences, Kazakh-German University, Almaty 050010, Kazakhstan
3
Main Department, Agency of the Republic of Kazakhstan, Almaty 480070, Kazakhstan
*
Author to whom correspondence should be addressed.
Mathematics 2022, 10(9), 1415; https://doi.org/10.3390/math10091415
Submission received: 30 March 2022 / Revised: 17 April 2022 / Accepted: 20 April 2022 / Published: 22 April 2022

Abstract

:
Many countries have been experiencing a crisis in their pension systems for fiscal and demographic reasons. Voluntary pension funds are a way out of the crisis. The depth of the problem lies in the study of social and economic-mathematical aspects in making economic decisions on implementing voluntary contributions. The authors studied sustainable development, considering the assessment of the causal relationship between factors in the development of voluntary pension insurance in the Republic of Kazakhstan. The article analyzes pension system models and studies the experience of the OECD countries. The results of the analysis highlight the most important factors affecting the development of pension systems with an emphasis on voluntary pension insurance mechanisms. The authors propose a conservative, economic, extended economic, and extended intermediate solution for building a set of cause-and-effect models for the development of voluntary pension insurance in the Republic of Kazakhstan based on a survey of a representative sample of citizens in the Republic of Kazakhstan using the QCA method.

1. Introduction

Since the beginning of the 21st century, almost all countries of the world, including most of the countries of Central and Eastern Europe, have been undergoing a process of constant pension system reform, which are mainly associated with changing demographic and economic conditions. The aging of the population and low economic growth rates have led to a crisis in pension systems on a global scale and have determined the urgency of ensuring the stable functioning of the pension system.
Pension provision as a form of material support for certain categories of citizens arose during antiquity and was associated with payments to military and civil servants in ancient Greece and the Roman Empire. A universal pension system emerged towards the end of the 19th century. Since then, one can observe the constant evolution of pension systems, which continues throughout the 20th century and is caused by changing socio-economic and demographic conditions.
We can represent the typology of pension systems based on the principle of financing as a set of distributives, cumulative, and combined (a combination of elements of distributive and cumulative systems) systems. The first pension systems were mainly distributive. However, already in the 20th century, many countries with distributive pension systems were faced with an acute demographic crisis caused by a simultaneous increase in life expectancy and a decrease in fertility in the 1980s, which led to an aging population. Distributive pension systems were formed when the proportion of the population of retirement age was relatively small. Systemic changes in the pension system introduced individual, defined contribution plans as a replacement for part of the state pension provision.
The cumulative pension system replaced the distributive system and leveled its main shortcomings. It turned out that, despite local successes, the reforms being carried out for the most part did not lead to an effective solution for the social tasks assigned to cumulative pension systems. As Barr and Diamond have shown, when switching from a distributive to a mandatory funded system, the first generation of pensioners will receive an extremely low pension, or will not receive it at all. The world practice of building pension systems includes vast experience from purely distributive to purely cumulative pension systems.
The global financial crisis has had a profound impact on pension income systems of all types [1] and has prompted a deeper consideration and search for a solution reflecting the symmetry of sustainable development of the economy and social aspects. The experience of overcoming the crisis has shown that once and for all there is no set optimal structure of the pension system since the optimal structure of the pension system depends on the demographic, economic, and socio-cultural characteristics of a particular state at a time, as well as on the goals and objectives that this state sets for itself.
Such foreign researchers as Disney, Borella, Fornero, Mountain, Kotlikoff, Sede, and Froman have scientific works on the construction and transformation of pension systems. Foreign and domestic researchers Barr, Diamond, Chubalski, Vrede, and Chernulich studied the sustainability and efficiency of pension systems. The study of international experience in the construction and functioning of pension systems on the example of several countries is included in the circle of scientific interests of such well-known researchers as Gurvich, Degtyar, Novikov, Kotlikoff, Sede, and Froman.
Most Central and Eastern European countries have implemented a three-level pension model promoted by the World Bank [2]. Its main core is a variety of pension sources, which comprise three levels: a PAYG (pay-as-you-go) scheme with public administration (first level), mandatory private (second level), as well as voluntarily funded schemes (third level).
The problem of adapting the three-level pension model to the economies of various countries of the world at its various stages requires the search for new approaches and the construction of economic and mathematical models related to the peculiarities of the development of countries, time, and demographic factors. Kazakhstan is no exception, as it is in a continuous process of integration into the world economic system.
Authors Wright, Rubin, Hair, and others reveal in their works the mathematical essence and nature of causality, present results, and discuss various approaches to the study of causality.
Jassby, Mohamadnejad, Nasrollahzadeh, Chen, Chi, Khanam, Siddiqui, and Talib et al. have investigated causal relationships in various domains using the DEMATEL, MICMAC, SEM, and ISM methods.
The authors of several studies, including Ambuehl, Baumgartner, Barrenechea, Mahoney, Thiem, Bennett, Bolton-Smith, Woodward, Tunstall-Pedo, and Morrison, use the QCA (qualitative comparative analysis) method in practice in various forms: dichotomous, many-valued, and fuzzy logics. They use various tools for processing research results and give examples of interpretations in the obtained models (configurations of causes).
The authors in most studies focus their efforts on interpreting the results obtained and ignore the mathematical essence of the study. Our article aims to fill this gap.
We chose the QCA library of the R language as a tool, which allows us to obtain the result, analyze the result, and understand the mathematical essence of the intermediate steps.
The scientific novelty of the article lies in the construction of an economic and mathematical model for the causality of factors in the development of a voluntary pension insurance system based on the QCA package of the R language and the analysis of the steps of the construction process based on the algebra of logic. We present three types of QCA method models to verify the results obtained and build a regression model that proves the correctness of the results obtained.
The purpose of our study is to build an economic and mathematical model that determines the causality of factors affecting the development of voluntary pension financing schemes on the example of Kazakhstan citizens using QCA and regression analysis methods.
The article contains an introduction, three parts, and a conclusion, in which the authors conducted a multi-aspect analysis of the phenomenon under study.

2. Characteristics of the Global Three-Level Pension Model

Systemic complexity characterizes the pension system in any state and comprises mutually complementary subsystems.
An analysis of the literature has shown that the vast majority of the combined pension systems existing in the world include three subsystems:
  • Subsystem of state pension provision;
  • Subsystem of state pension insurance;
  • Subsystem of voluntary pension insurance.
Each of the three subsystems in such a model for the pension system meets its goals and objectives. The first subsystem protects from poverty, guaranteeing the possibility of meeting a minimum set of needs; the second subsystem should provide pensioners with an acceptable standard of living, to a certain extent corresponding to the pensioner’s income before retirement; and the third subsystem is additional pension insurance based on the choice of citizens, the purpose of which is to maintain the standard of living formed at the time of retirement.
Often, the first subsystem of the pension model is distributive, and the second subsystem can be based on both the distributive and cumulative principles or a combination of them. The third subsystem is mainly based on the cumulative principle. A review of the theoretical foundations in the organization of models for pension systems shows a wide variety of potential scenarios for building a strategy for the development of the national pension system. The systematic nature of the construction of pension provision models can be justified by the impossibility of developing only one subsystem without considering the others.
Building a strategy for the development of the national pension system based on only the first subsystem is currently impossible, since the fall in employment, along with slower growth or even a decrease in wages, affects the incomes of the population. We associate this trend with almost all OECD (Organization for Economic Cooperation and Development) countries. Indeed, in some countries, the expenditure part of the state budget has suffered from job losses and early retirement. Because of the economic crises in most OECD countries, there has been a large public budget deficit and a rapidly growing public debt. Economic output in most Central and Eastern European countries has suffered more than the OECD. However, assets in private pensions have lost slightly less than the OECD average in Hungary and Poland, and significantly less than the average in the Slovak Republic.
Radical changes in the model for pension provision of the population based on the improvement of only the second subsystem are also impossible because of the peculiarities of the slipover effects of the financial crisis. The governments of Central and Eastern Europe tried to balance the fiscal budget during the crisis, considering the possibility of redirecting part of the funds from mandatory funded schemes to the social security system to acquire significant amounts of resources without increasing the current budget deficit. According to [3], in the years after the reform and before the financial crisis, countries such as Poland and Hungary pursued fiscal policies that did not fully comply with the postulates for the development of the second subsystem in the pension model. As emphasized by [4,5], reform of the pension system in the countries of Central and Eastern Europe will cost more to the younger generation, due to demographic factors. A decrease in the birth rate will not allow governments to maintain current replacement rates. For example, the change in Poland was made by reducing replacement rates. In Latin American countries, where the financial crisis was milder than in other regions, mandatory financing schemes failed to provide replacement rates at the expected levels of 60 to 70 percent, and additional savings of citizens will be required to support the pension system to receive adequate pensions in the future. Future labor market conditions explain the low replacement rates, including low contribution density, low interest rates, and lack of proper diversification of pension funds, as well as more realistic expectations about future income.
Previous research [6,7] has pointed out that future pension payments in the regions of Central and Eastern Europe from reformed pension systems within only the second and third subsystems will be lower than today.
A likely mechanism to support the social protection system in the face of population aging and lower replacement rates is the stability of fiscal policy. We expect negative changes in the predicted benefit ratio in the long term for most European countries [8]. The current working generation should work longer hours and/or plan for additional savings to avoid a significant drop in living standards in old age.
Against the background of these factors, the third subsystem of the pension system model, based on voluntary pension contributions which consider behavioral aspects, can provide a viable solution to the problem of increasing pension savings and improving the pension provision model.
In light of the fiscal burden on the population against the background of an increase in life expectancy, the formation of a significant size of the informal labor market, and a decrease in the replacement rate, governments of many countries are taking measures to develop a system of voluntary pension contributions by assuming great responsibility for the future by the population. Many Central and Eastern European States are taking steps to motivate the participation of the population in the voluntary funded component of the pension system, which is the most important mechanism for the social protection of the population. These measures include introducing new types of voluntary pension schemes and more favorable financial incentives.
However, the development of this subsystem alone will not lead to a comprehensive improvement in the global pension model. A study conducted by the OECD found that the system of voluntary contributions in the countries of Central and Eastern Europe, except for the Czech Republic, are not sufficiently developed to increase the average adequacy of future pension benefits [9].
Emerging economies such as the Dominican Republic, India, Indonesia, and Vietnam have experimented with some forms of defined contribution pension programs (MDC), where the government provides incentives for voluntary contributions made by participants in pension plans; but the result of the experiment is unlike countries with high per capita income, where MDC programs providing the positive effect turned out to be opposite [10]. Data collected during the survey of the situation in Latin American countries for the period from 1990 to 2010 according to Roffman and Oliveri [11] showed that less than 40% of the population regularly made voluntary contributions to pension systems.
In the countries of the former Soviet Union, such as Kazakhstan, the amount of pension savings of the population as of 1 October 2019 amounted to KZT 10.4 trillion, of which pension savings under the scheme of voluntary pension contributions only amounted to KZT 1.9 billion (0.02%).
We have shown that the model for the pension system in modern reality can be based only on the complex nature of the use and development of all three subsystems: subsystems of state pension provision; subsystems of state pension insurance; and subsystems of voluntary pension insurance. The economic development of national economies in the aspect of pension provision will increasingly depend on the construction of reliable and effective models of voluntary pension insurance subsystems. Voluntary pension insurance models could contribute to a certain extent to increasing the pension provision of workers in the informal sector, including self-employed workers, who make up a very important part of the population in developing economies.

3. Analysis of the Development of the Subsystem of Voluntary Pension Insurance: Models and Factors

Three main reasons can explain low participation of the population in the system of voluntary pension contributions in most countries with developing economies characterized by low income:
  • Low replacement rate: a brief career, which means a small density of contributions because of irregular deductions affects the replacement rate. This has a direct impact on the future adequacy of the pension income.
  • Low level of declared wages: the low basic level of wages can be explained by jobs with low productivity or the result of not declaring wages. It is not uncommon for employees and employers to agree to lower their stated wages to reduce pension contributions. This corresponds to the conclusions in [12], which show that the very structure of the social insurance system can affect the frequency of contributions.
  • Low income and poor working conditions in the informal sector of the economy (self-employed, small, and medium-sized businesses). This sector of the economy remains unaccounted for (undervalued), but it contributes significantly to the country’s economy. The income and permanent employment of workers in the informal sector are different and uncertain because of fairly frequent market changes they cannot control. Therefore, workers in the informal sector have to face market risks on their own [13].
Furthermore, there is a lack of an integrated approach to solving the problems of the voluntary pension insurance market without considering their relationship with one another.
Regarding factors influencing the level of savings under voluntary pension schemes in the pension system, the research of many authors has focused on identifying dependencies on socio-demographic, institutional, and behavioral factors, as well as the level of knowledge in financial management. Most of the former work emphasized the influence of socio-demographic factors on the intention to make voluntary pension contributions. Demographic information about employees plays a key role in their attitude to savings at retirement [14]. Alfonso (2003) studied the determinants affecting the coverage of voluntary personal pensions in Switzerland using a probit model to analyze a sample of 11,000 observations. Among the determinants identified by him were household income and education, as well as several other personal characteristics (gender, age, marital status, and region of residence).
Married workers have a higher willingness to join the voluntary pension system than single workers [15,16]. These authors also revealed the supposed positive impact of education on the likelihood of joining the voluntary pension savings scheme. The conclusions [17] about workers with a higher level of education are more likely to take part in the pension scheme than workers with a low level of education or no education are confirmed by the authors ofs [18]. Some studies emphasize an increase in the share of savings for old age with an increase in the level of income of the population. We associate a high level of income with financial literacy; it positively correlates with deciding the long-term planning of a retirement situation [19]. An empirical analysis of various factors (income, real estate ownership, age, unemployment, and self-employment) carried out by Stinglhamber and other authors proved that voluntary pension plans and other forms of long-term savings (life insurance products) are not a substitute for income when reaching retirement age, but an addition to the savings tool.
Some studies provide interesting results regarding the density (frequency) of contributions using a model for two periods (active and passive phase of life), which include a choice between contributions to the system of mandatory pension contributions and (or) to the products of voluntary pension savings. In particular, the authors of [20] noted that a person’s choice is based on a clear distinction between two behavioral aspects: mandatory and voluntary. If contributions are mandatory, their frequency is higher compared to the non-mandatory nature of contributions. Authors in [21] analyzed a different approach to studying the frequency of contributions using empirical studies. Using a household survey for 1992–2000, and analyzing the characteristics of the frequency of pension contributions in Chile, the authors used a non-linear econometric model to estimate the probability of the frequency of contributions. The model consistently adds to the main variables (age, gender, education, marital status, and disability) and other variables that are characteristics of factors such as military service, work experience, income, knowledge of the social security system, risk aversion, and propensity to consume. Such an iterative approach to the construction of an econometric model allowed us to establish that men have a higher frequency of contributions than women, except for work experience.
The level of education and age have a positive but significant relationship with the frequency of contributions in almost all regression models. Marital status does not matter under any circumstances. Work experience in the labor market positively correlates with the frequency of contributions; knowledge of the rules of the pension system also has a positive impact on the frequency of contributions.
There have not always been economists who considered socio-demographic factors as the basis for the growth in voluntary pension contributions. For example, the author of [22] explores the determinants of participation in the pension system under various scenarios, for which the sensitivity of the frequency and amount of contributions to legislative changes in the system is assessed. In the works of [23,24], some argue the insufficient participation of the population in voluntary pension plans near Central and Eastern Europe lies in the low level of financial knowledge and inefficiency of tax incentives. The research of these scientists shows that increasing the benefits of pension products increases participation of the population in the system. We can apply behavioral factors besides demographic factors to explain behavior in retirement planning.
Morselli (2000) and Kajauchire (2015) emphasize that future perspective or “future orientation” is a cognitive-motivational construct that plays an important role in changing individual attitudes and behaviors that focus on the future rather than the present or the past. Hershey et al. emphasize specific changes are related to the assessment of the level of the planning horizon and/or time factors.
The works of [25] also study the behavioral level in retirement planning measured by five retirement planning activities:
  • The frequency with which a person reads articles and brochures about investment or financial planning;
  • The frequency of visits to financial planning websites;
  • The frequency with which a person tunes in to TV and radio broadcasts about retirement planning and investing;
  • Planning expenses in future periods of life;
  • Discussing retirement plans with a professional in the field, with a friend or acquaintance.
The study carried out in [19] draws similar conclusions: people who actively take part in retirement planning activities have more retirement assets and higher confidence in retirement income.
Although the relationship between retirement planning activities and the level of savings in individual retirement accounts is obvious, according to the authors, it is important to consider the planning horizon in this approach to the study. Observations have shown that the population with a short-term planning horizon accumulates fewer pension assets, and they are expected to receive less income at retirement.
The Pension Awareness Index was introduced to increase the planning horizon and assess the effect of communication with the population planning their retirement income. Heuts et al. found that this indicator reflects an improvement in the communication strategy of pension funds with the population [26].
Therefore, before developing a communication campaign, it is necessary to establish a clear picture of the major barriers to understanding and perception of voluntary pension insurance programs, considering groups of citizens by demographic indicators (age, gender, and education) [27].
Regarding the channels of information dissemination, [28] believes that information about pensions should be disseminated en masse through official and non-official channels: experts, friends, colleagues. When choosing a pension fund, the population depends on the opinion of “peers” rather than on economic performance indicators [29]. Such influences can have both a positive and a negative character—a negative attitude towards voluntary pension contributions [30,31,32].
Because of the analysis of literature and internet sources on the chosen topic, we identified groups of factors that affect the development of the subsystem of voluntary pension insurance: socio-demographic, behavioral, and economic. Researchers most often rely on socio-demographic factors in their work for building models: age, gender, education, marital status, and employment; economic: work experience, income, knowledge of legislation in pension and social security; behavioral: level of awareness, planning horizon, and communication. It is quite obvious that all these [33,34] factors affect the development of the subsystem of voluntary pension insurance, but the authors of the research do not establish a causal part between them and the level of development of the subsystem of voluntary pension insurance. In addition, the research ignored the following factors:
  • Public confidence in the pension system related to voluntary savings;
  • The level of ownership of information and communication technologies by the population, which also has a serious impact on communication companies and the choice of the planning horizon by the population before retirement [35,36].
As studies have shown in different countries, the influence of such factors varies and therefore, each country requires its research, considering the specifics of the national economy, tax incentives, the development of pension funds, and models for the formation of voluntary pension contributions [37,38].

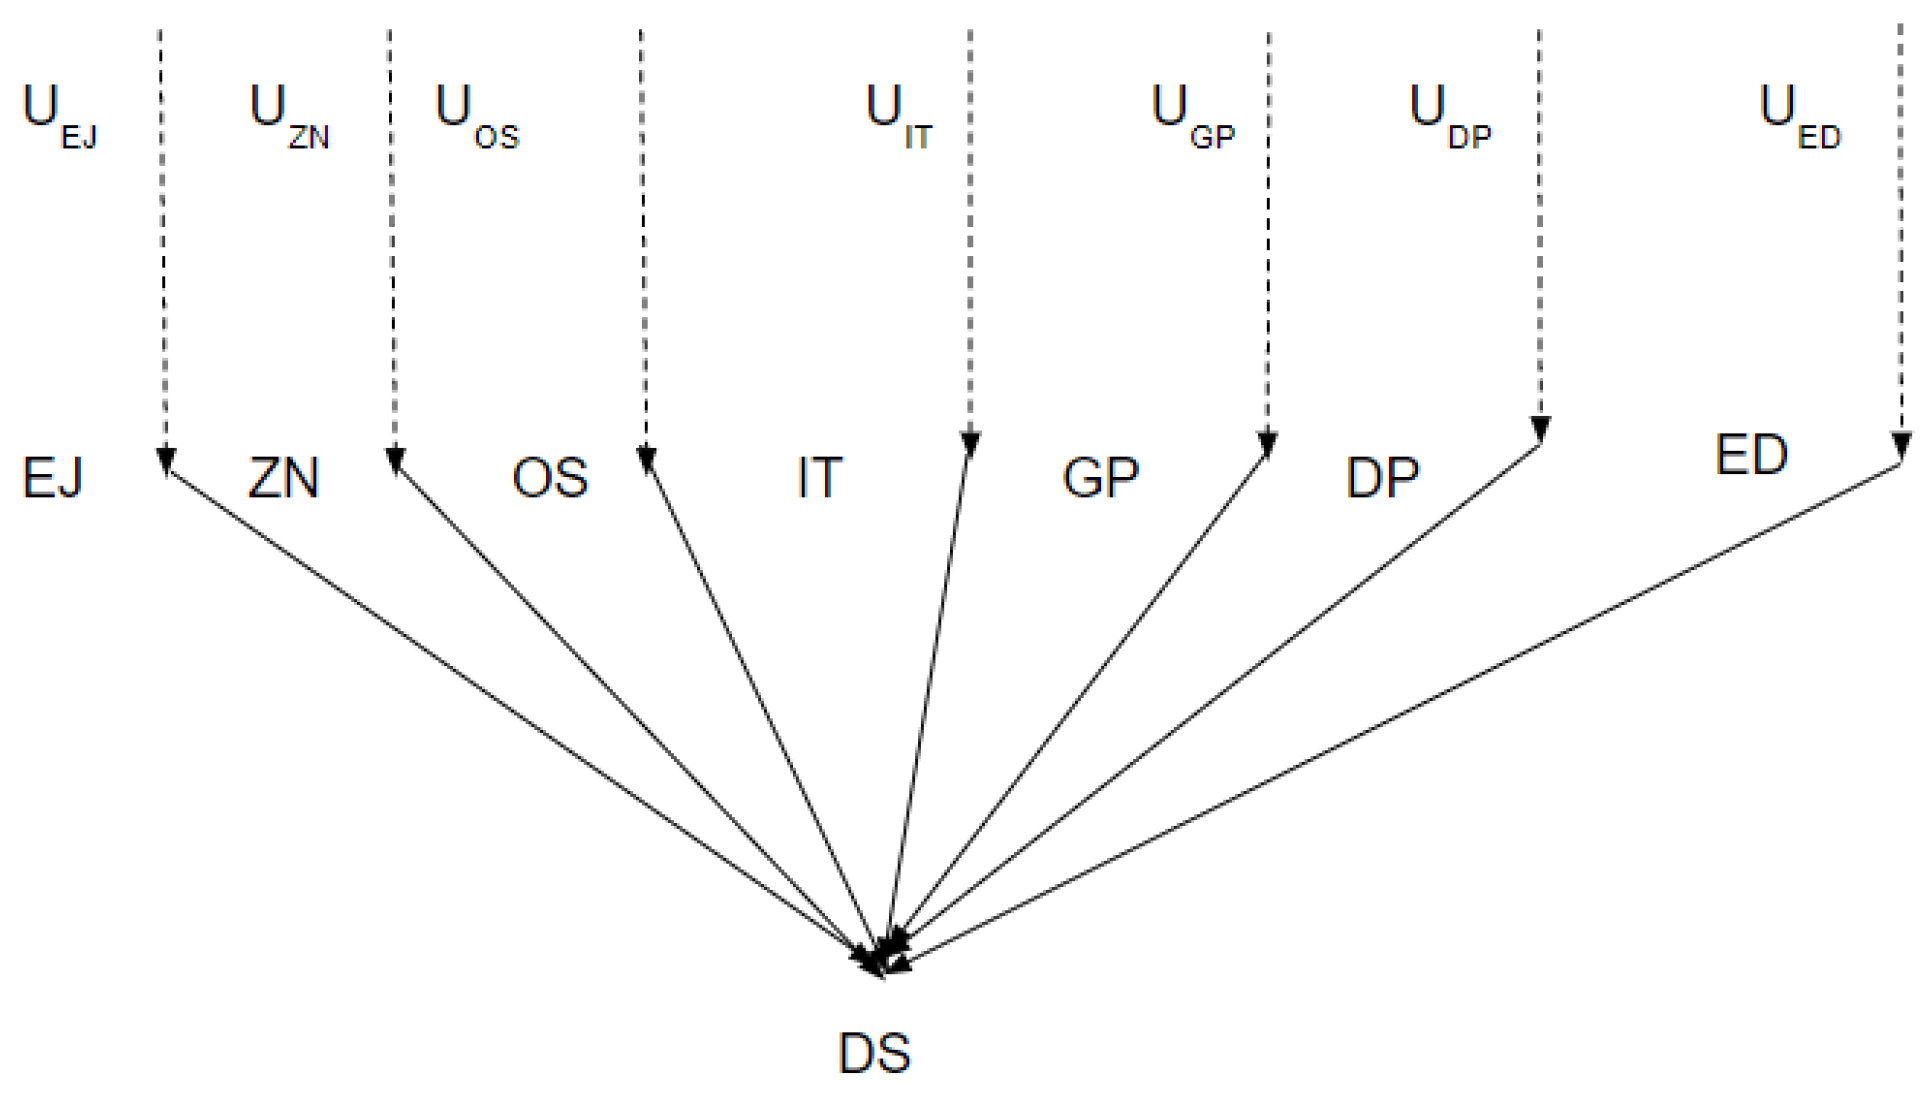
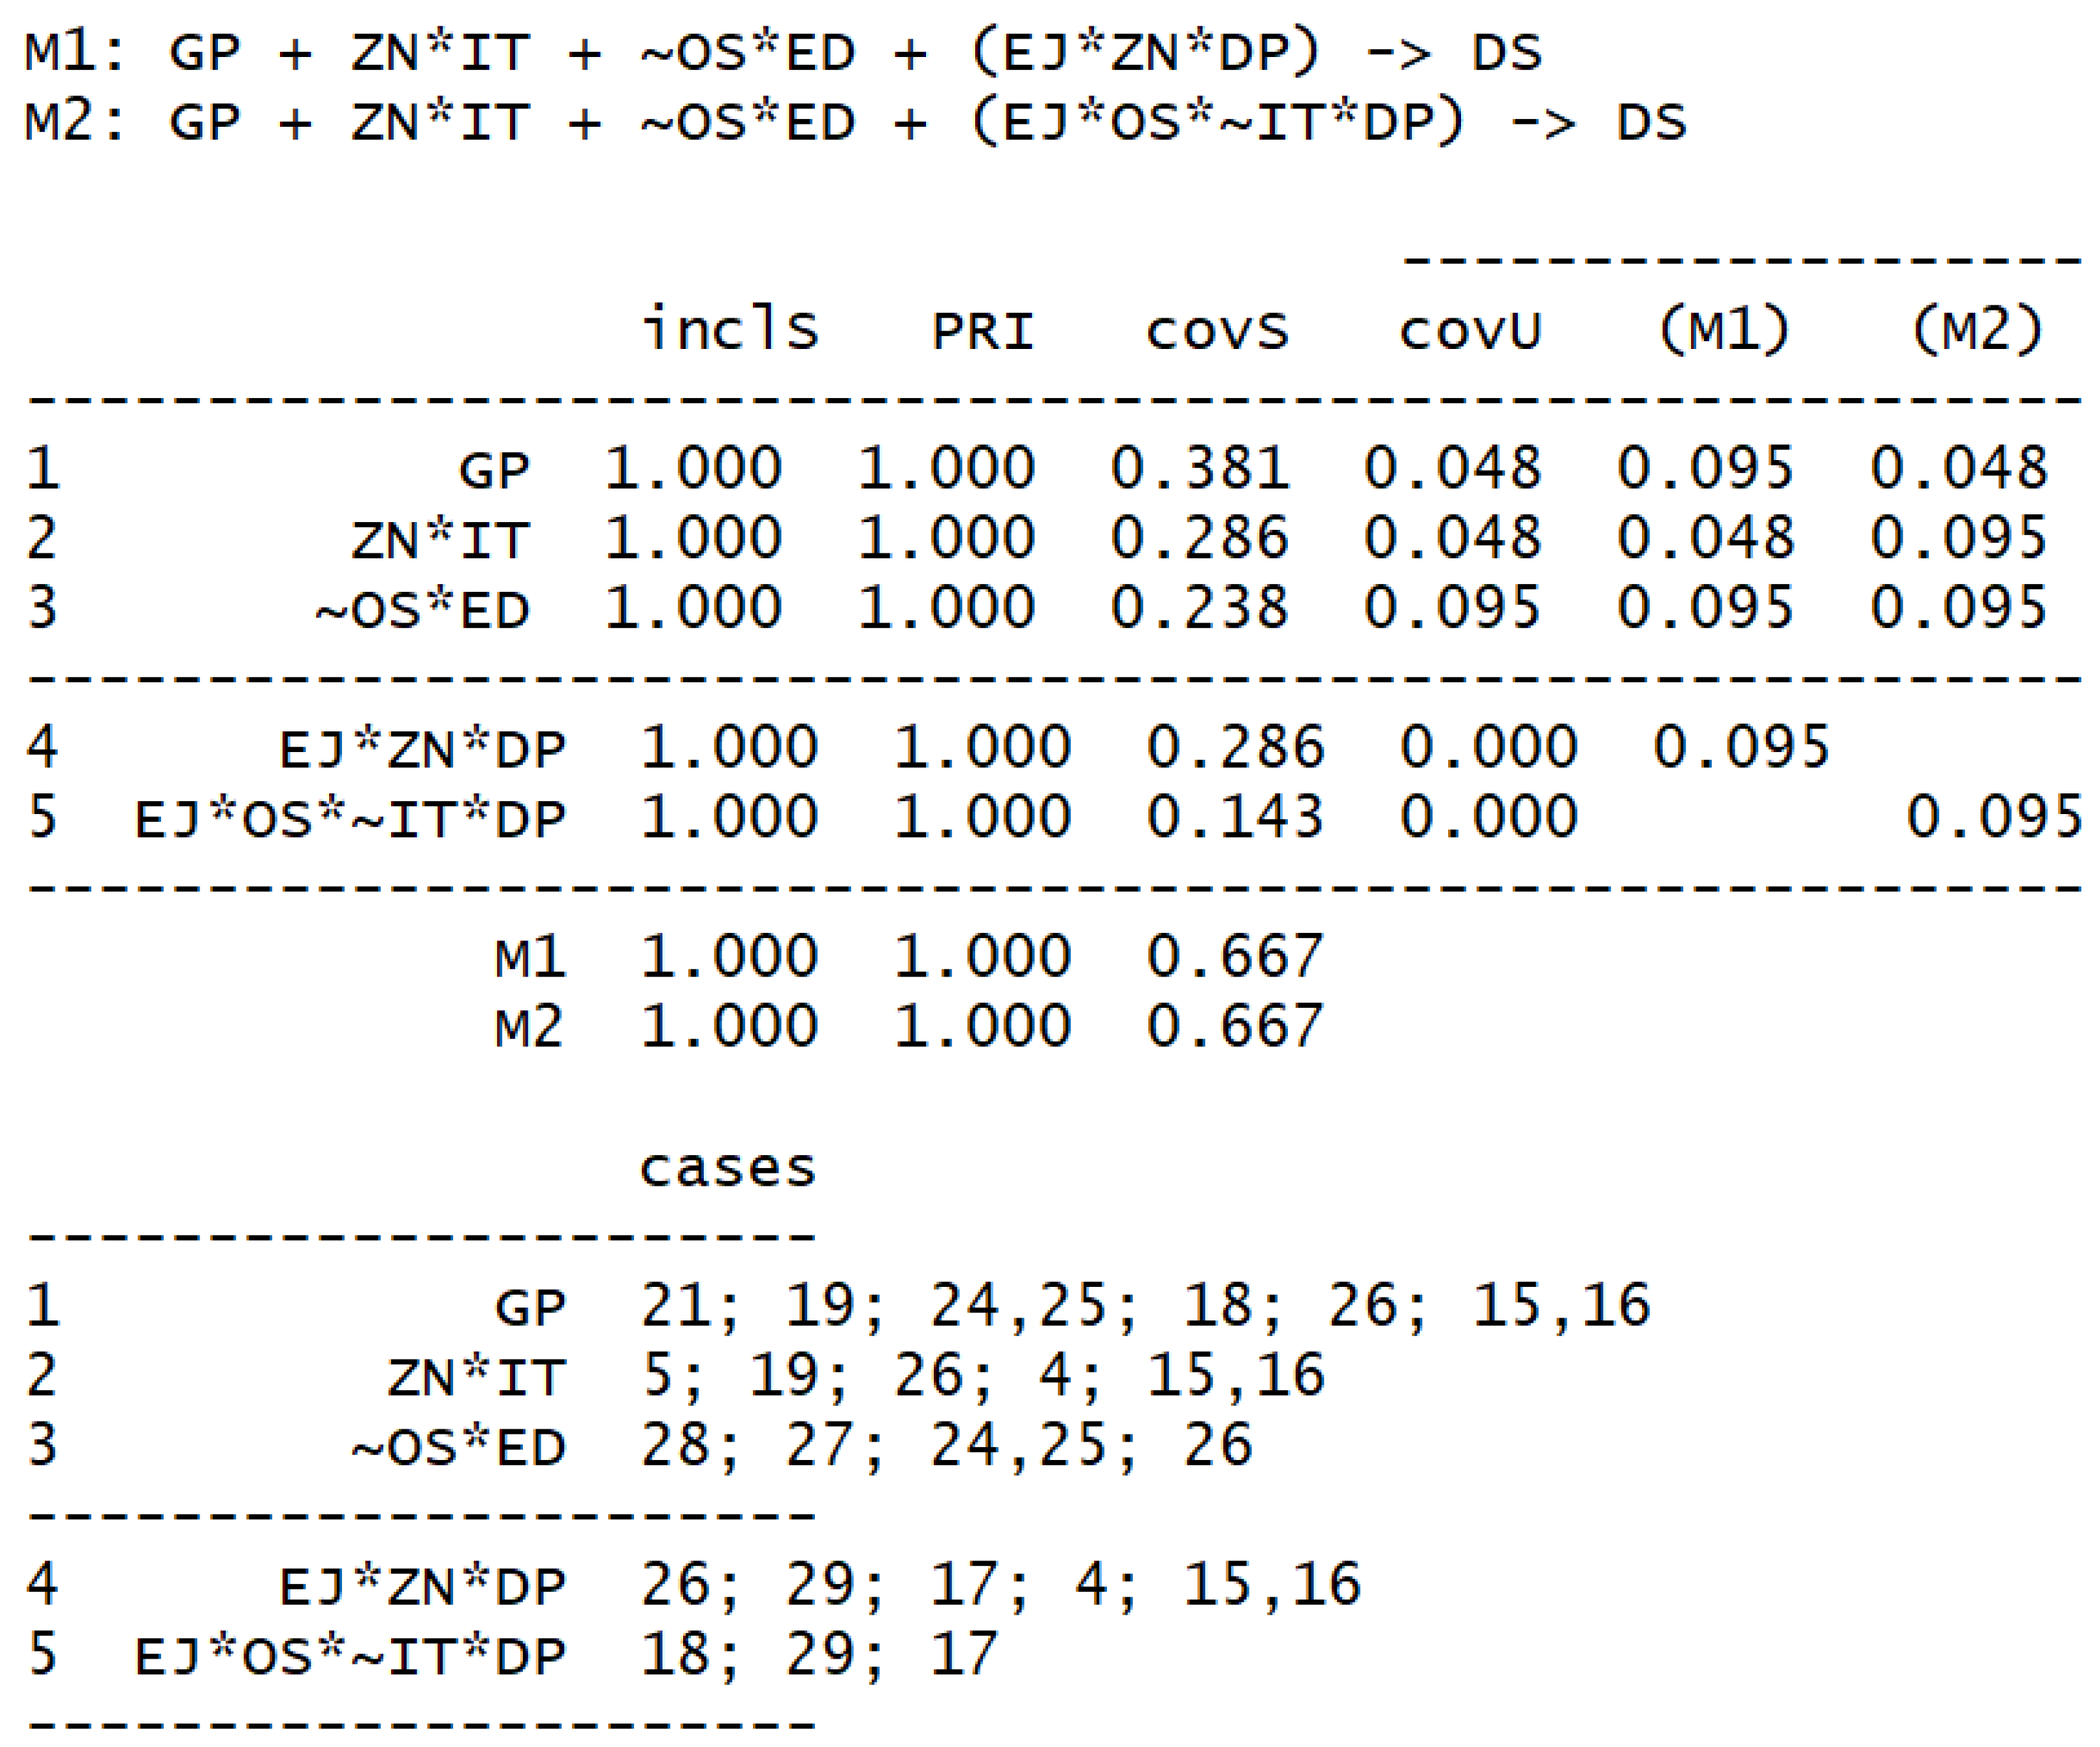
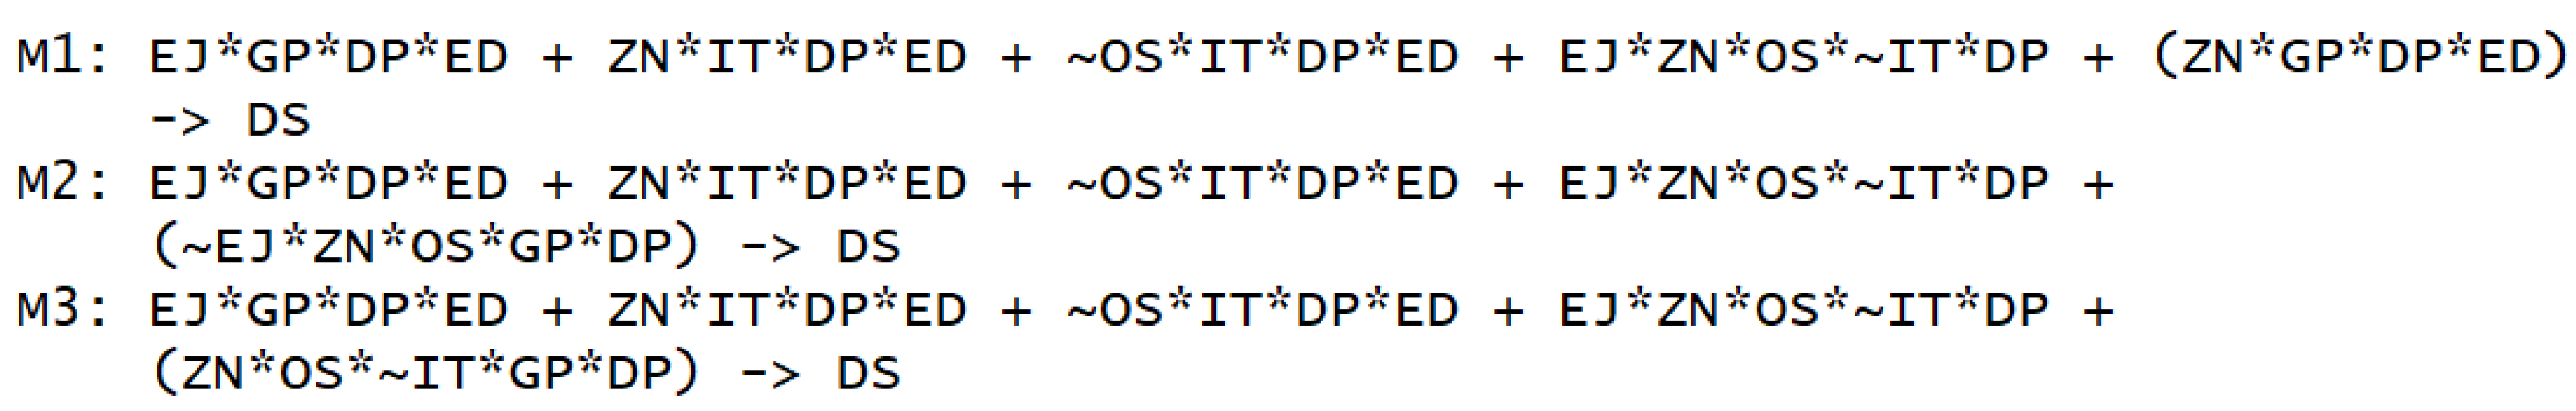
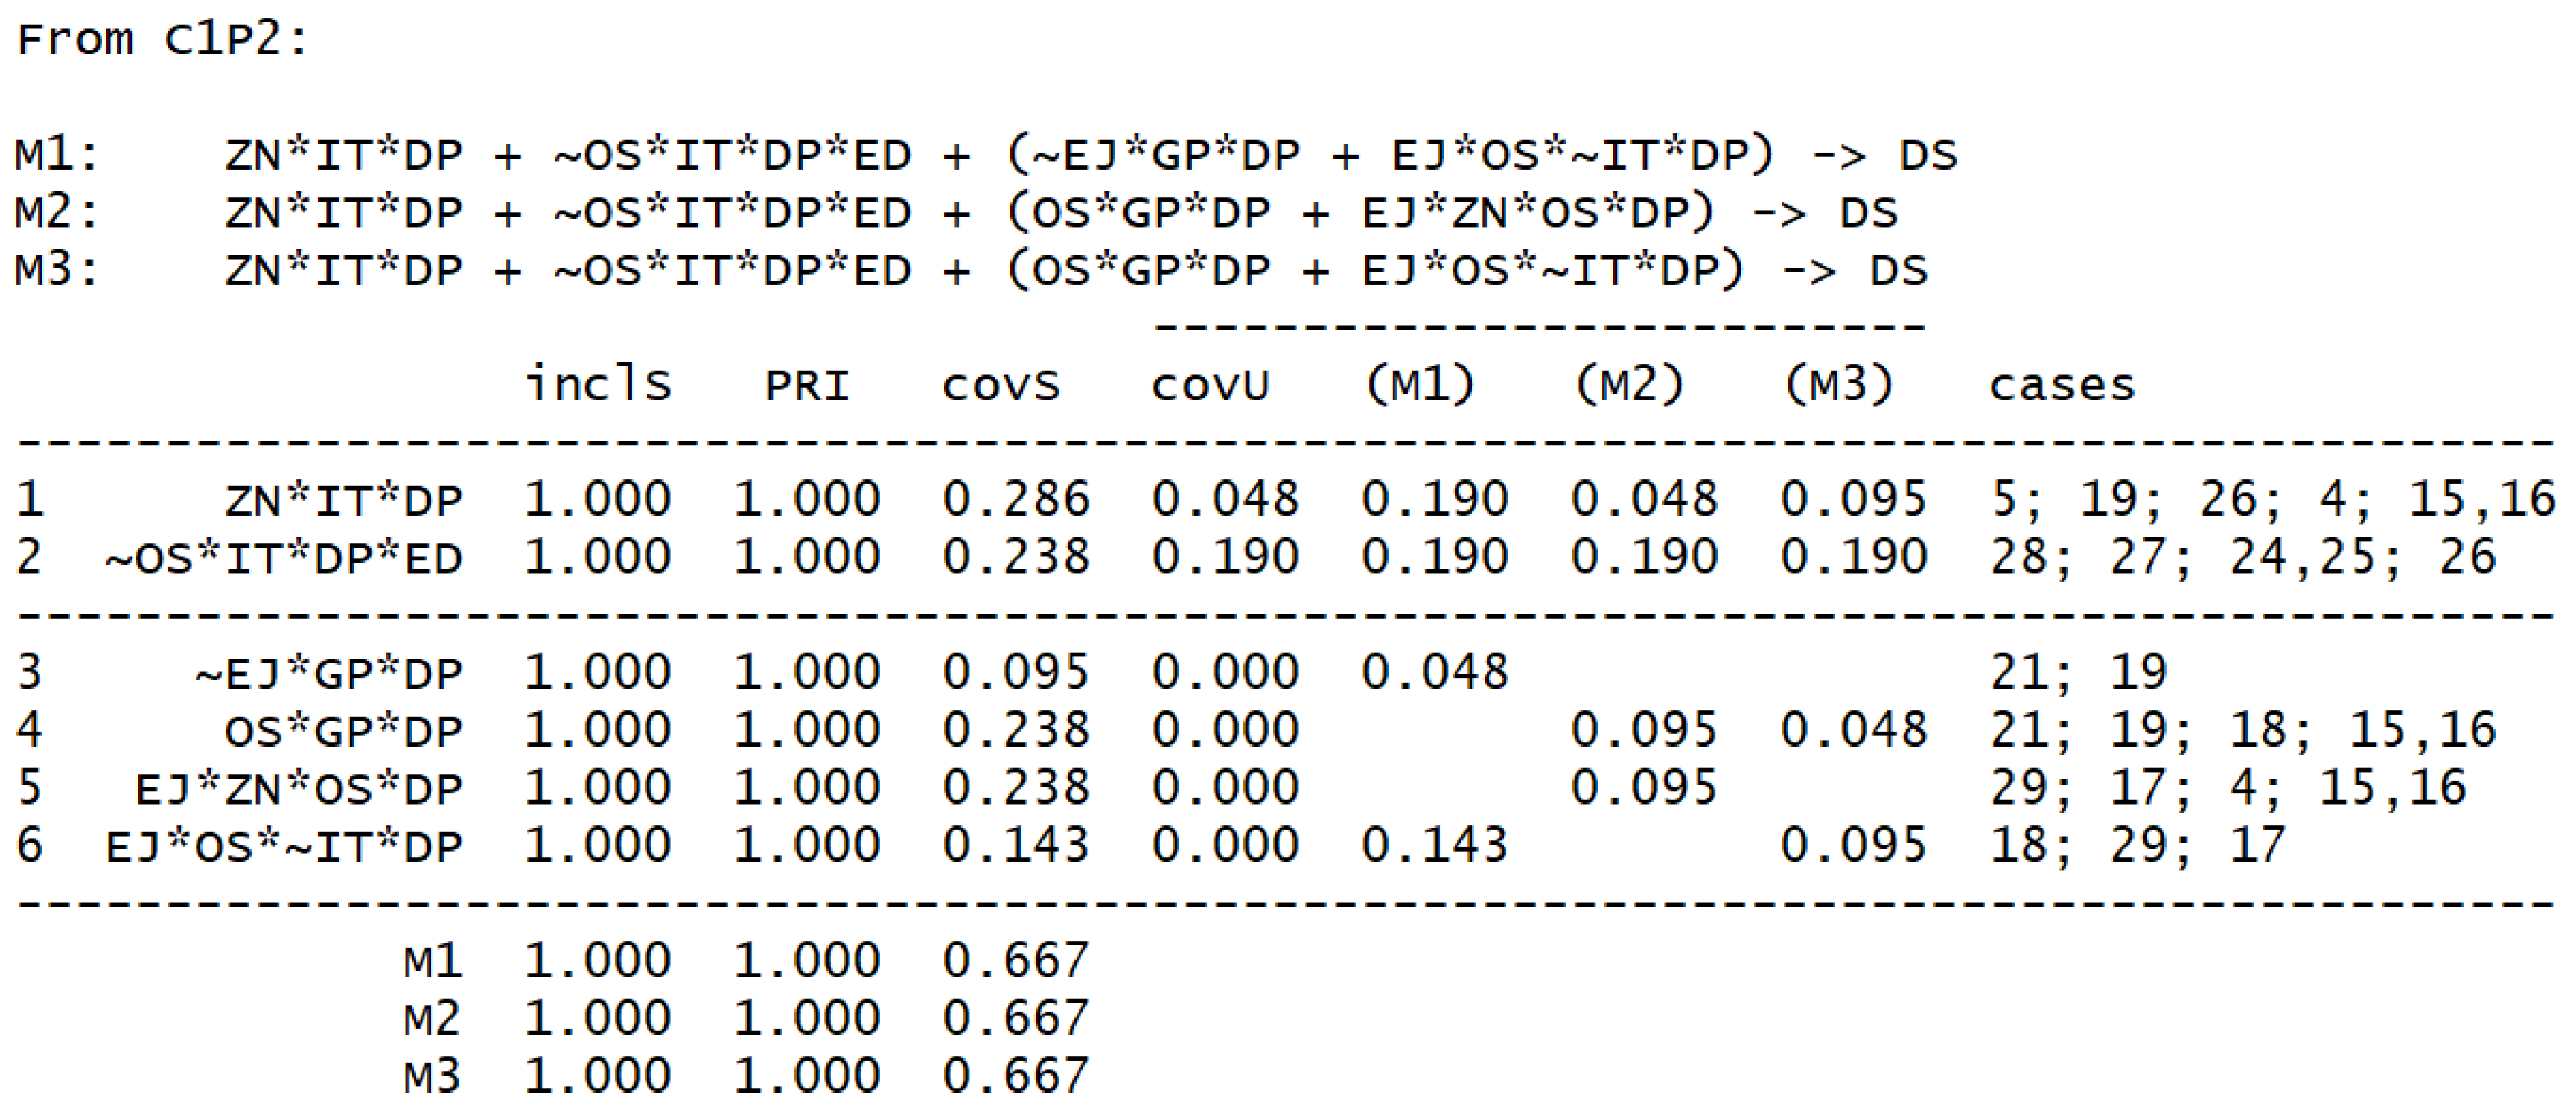
4. An economic and Mathematical Model for Assessing the Causality of Factors in the Development of Voluntary Pension Insurance in the Republic of Kazakhstan

The developed theoretical model for studying the interrelationships of structural configuration components, situational factors, and causality of factors in the development of voluntary pension insurance in the Republic of Kazakhstan [39,40] goes beyond the existing models and, considering the specifics of the object of research, pays special attention to such factors as the planning horizon, the level of information technology proficiency, and the level of trust in the pension system. Structural configuration itself indirectly affects the result of the study of causality factors. Almost always, the methods of paired correlation analysis, multiple linear regression, and variance analysis are used as analytical tools [41] for checking relationships in the construction of economic and mathematical models. Using such methods in analyzing the relationships between variables measured on the Likert scale (from complete agreement to complete disagreement) often causes discussions from the point of view of the adequacy of the use of parametric methods. Jamieson et al. speak about the complete non-applicability of such methods; Pell, Carifio and Perla [42] assert the possibility of using parametric methods for analyzing such variables, considering certain limitations. The article by Nazarov [43] summarizes the methods for the causality of factors in socio-economic processes and provides an example of the use of fuzzy control technologies for the construction of economic and mathematical models. We considered the materials of these studies when selecting variables and calibrating them [44,45,46].
Two conceptual models were chosen as tools for conducting the study: symmetric (for example, correlation and multiple regression analysis) and asymmetric (i.e., forecasts of the results of individual cases)
The basic model was defined as qualitative comparative analysis (QCA), a method for asymmetric data analysis that combines the logic and empirical intensity of qualitative approaches rich in contextual information with quantitative methods that deal with many of cases and are more generalizable than symmetric concepts and models. This ability to combine the basic concepts of both qualitative and quantitative methods of analysis differs significantly from traditional methods of quantitative analysis, which are often based on variance and use null hypothesis significance testing. QCA can identify logically simplified statements that describe various combinations (or configurations) of conditions showing a specific result. As an additional verification tool, we used multiple correlation and regression analysis of data [47].
To build an economic-mathematical model for assessing the causal relationship between factors in the development of voluntary [48,49] pension insurance in the Republic of Kazakhstan, we conducted a sociological survey through a questionnaire. The questionnaire was divided into two parts. Questions about the demographic characteristics (age, gender, and education) of the sample were the first part. The second part included measurements of various constructs stated in the literature review section. The questionnaire was aimed at identifying the attitude of citizens towards the pension system, in particular, the level of awareness, confidence in the pension system, the level of ownership of information and communication technologies, and sources of income to ensure old age with an emphasis on voluntary pension insurance.
As a result, 65 questionnaires were received, 53 of them were selected for data processing and model construction. Among the respondents were 30 men and 23 women aged 35 to 65 years at the time of the survey in 2020, with an average age of 45 years. About half were married, and about half had school-aged children. Respondents had an average of 13.5 years of professional work experience, an average of 5.7 years in managerial positions, and 7.5 years of work experience as specialists in organizations. About 21% were leaders of others. Almost 43% had a degree below bachelor’s level, and 57% had a bachelor’s degree or higher. A total of 21 respondents worked in the public sector, and 32 worked in the private sector. All were citizens of the Republic of Kazakhstan. It is notable that 12 questionnaires were rejected because the respondents of these questionnaires were younger than 35 years old and did not answer the questionnaire questions with sufficient quality and understanding.
We calibrated the survey data in two different ways: binary principle for the QCA method, and common procedures for regression analysis [50].
According to the study, we identified the following variables:
Work experience (EJ);
Knowledge of legislation in the field of pension and social security (ZN);
Level of awareness of voluntary accumulation models (OS);
Planning horizon (GP);
Public confidence in the pension system (DP);
Education level (ED);
Voluntary Pension Insurance System (DS).
There are factors that influence the endogenous variable of the DS model and are not accounted for in our model.
Using the general rules for constructing causal models, we obtained the following equations that describe our model:
V = { E J , Z N ,   O S , I T ,   G P , D P , E D } U = { U E J ,   U Z N , U O S , U I T , U G P , U D P , U E D } D S = f D S { E J , Z N ,   O S , I T ,   G P , D P , E D , U E J ,   U Z N , U O S , U I T , U G P , U D P , U E D }
гдe U E J ,   U Z N , U O S , U I T , U G P , U D P , U E D exogenous variables stand in for any random effects that may alter the relationship between the endogenous variables
We built a graph (see Figure 1) as follows:
Based on the problem statement, we needed to find [51]:
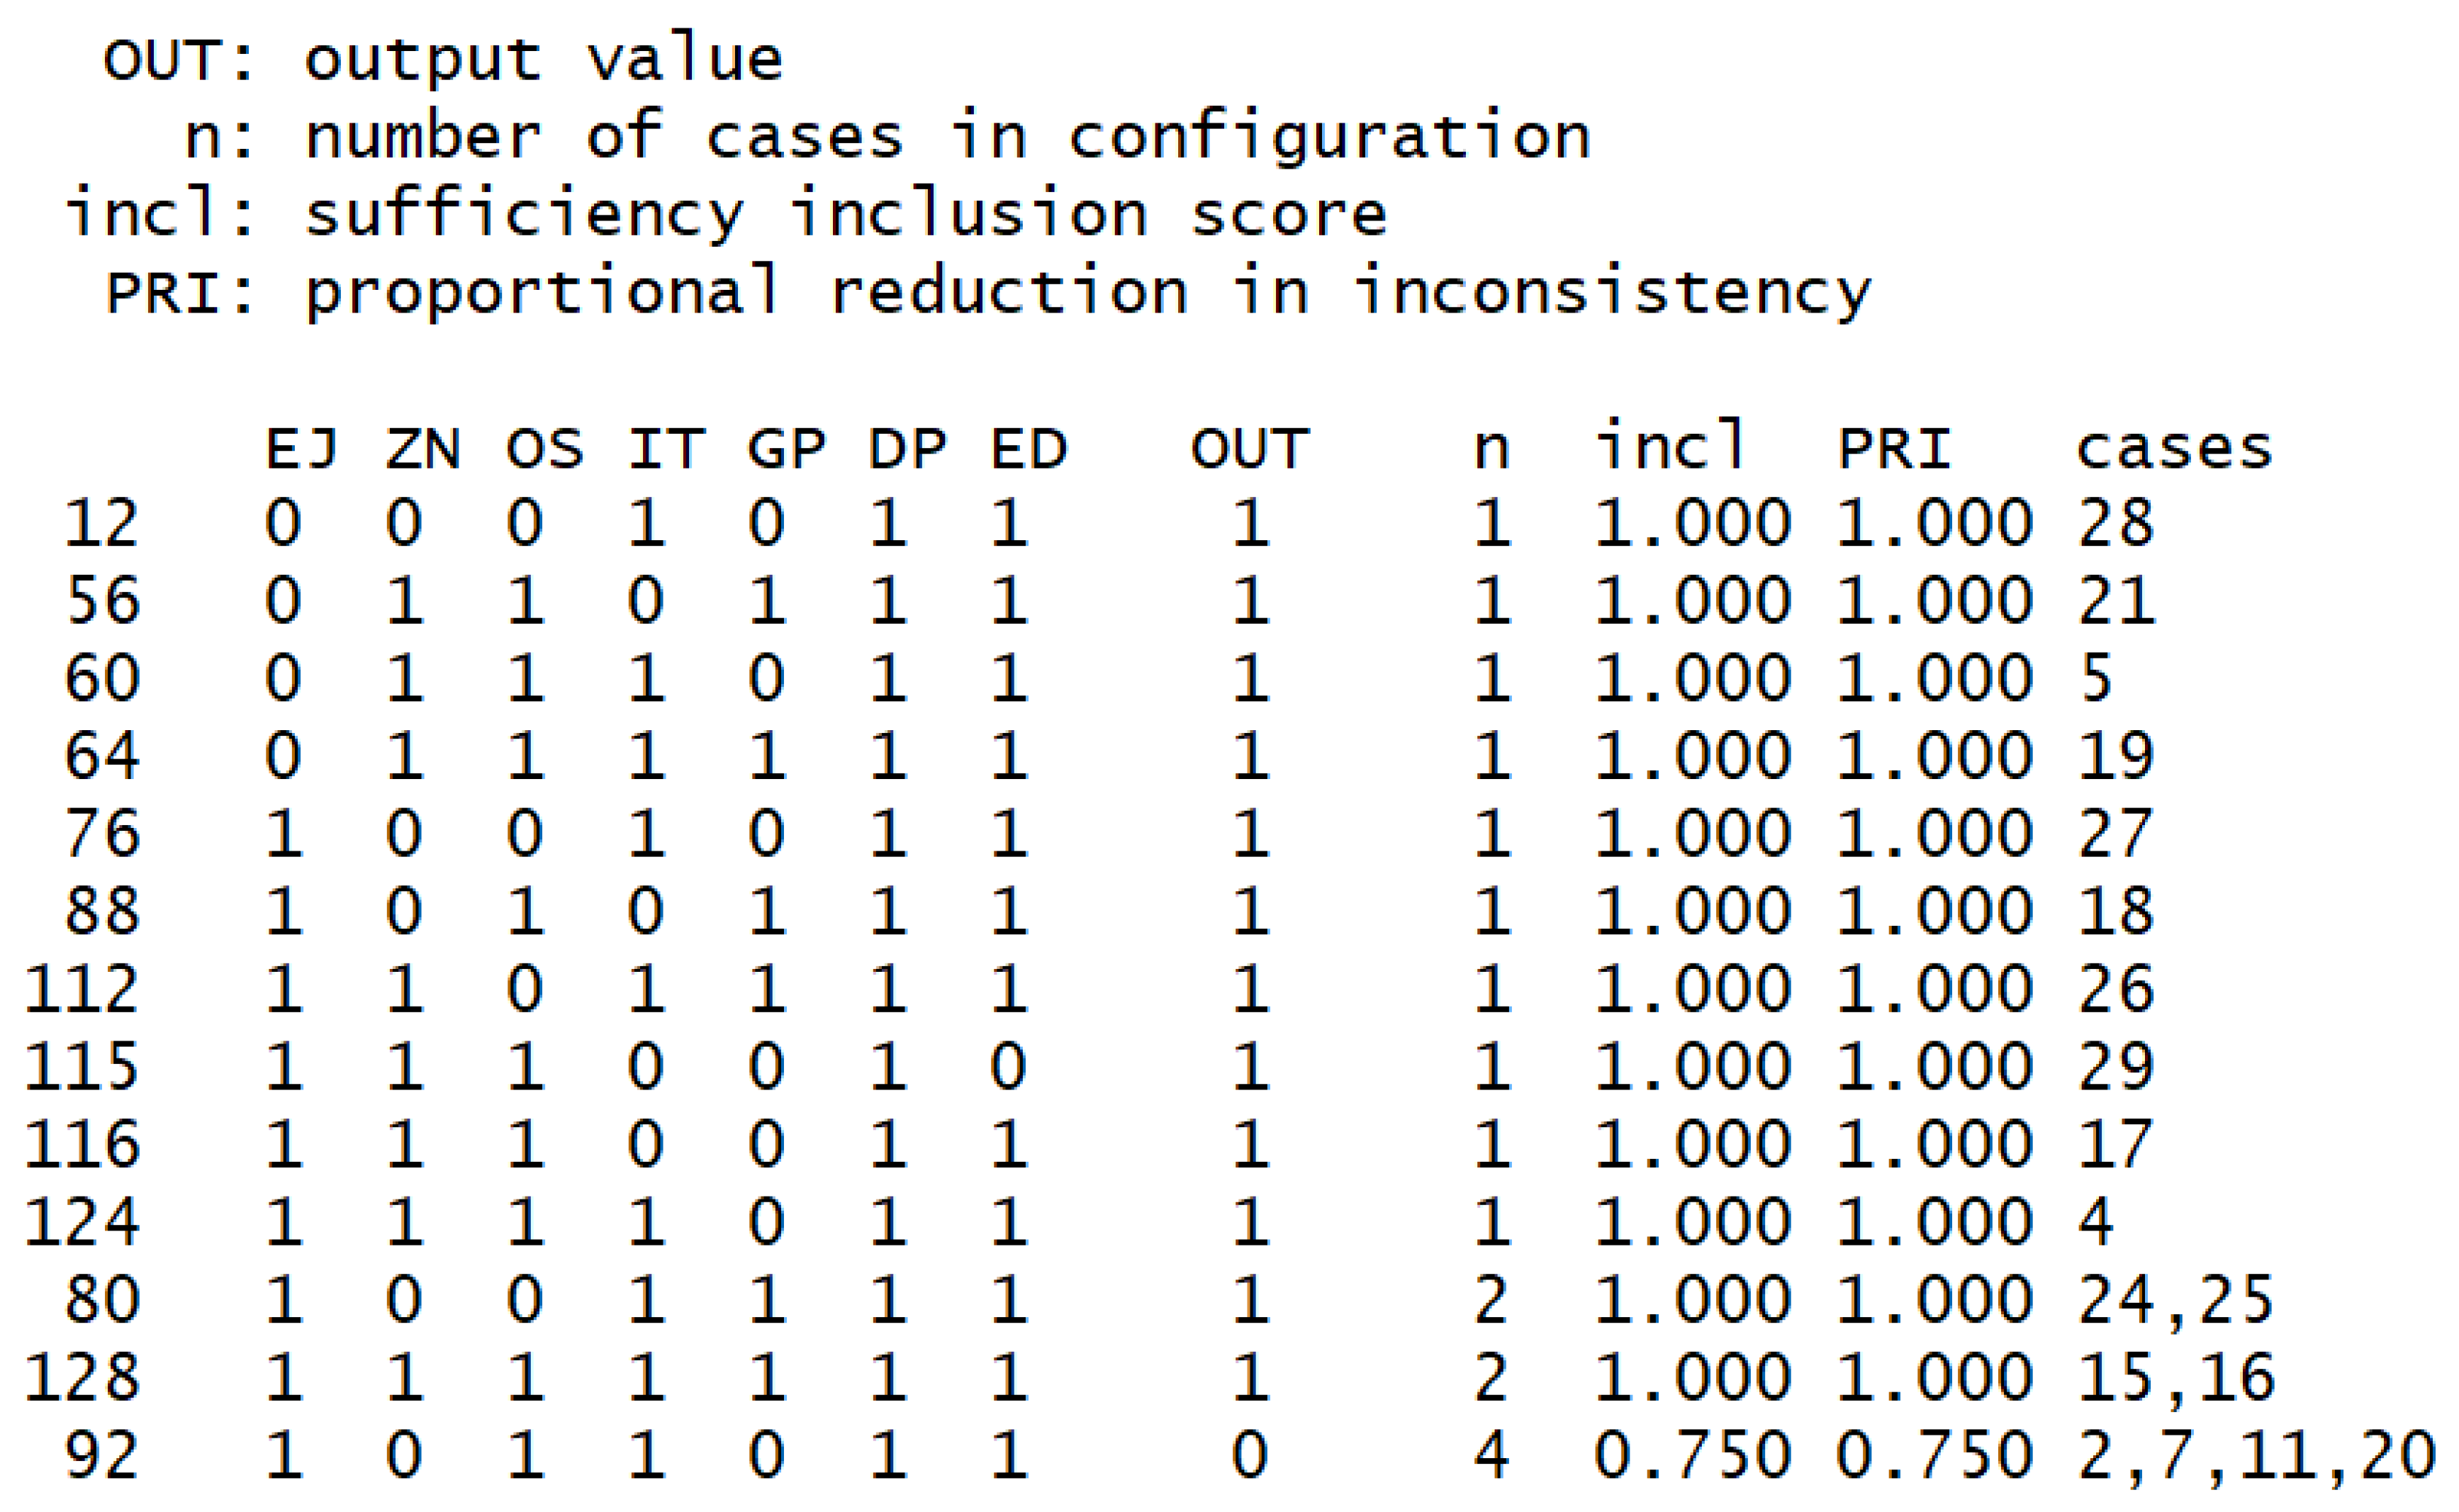
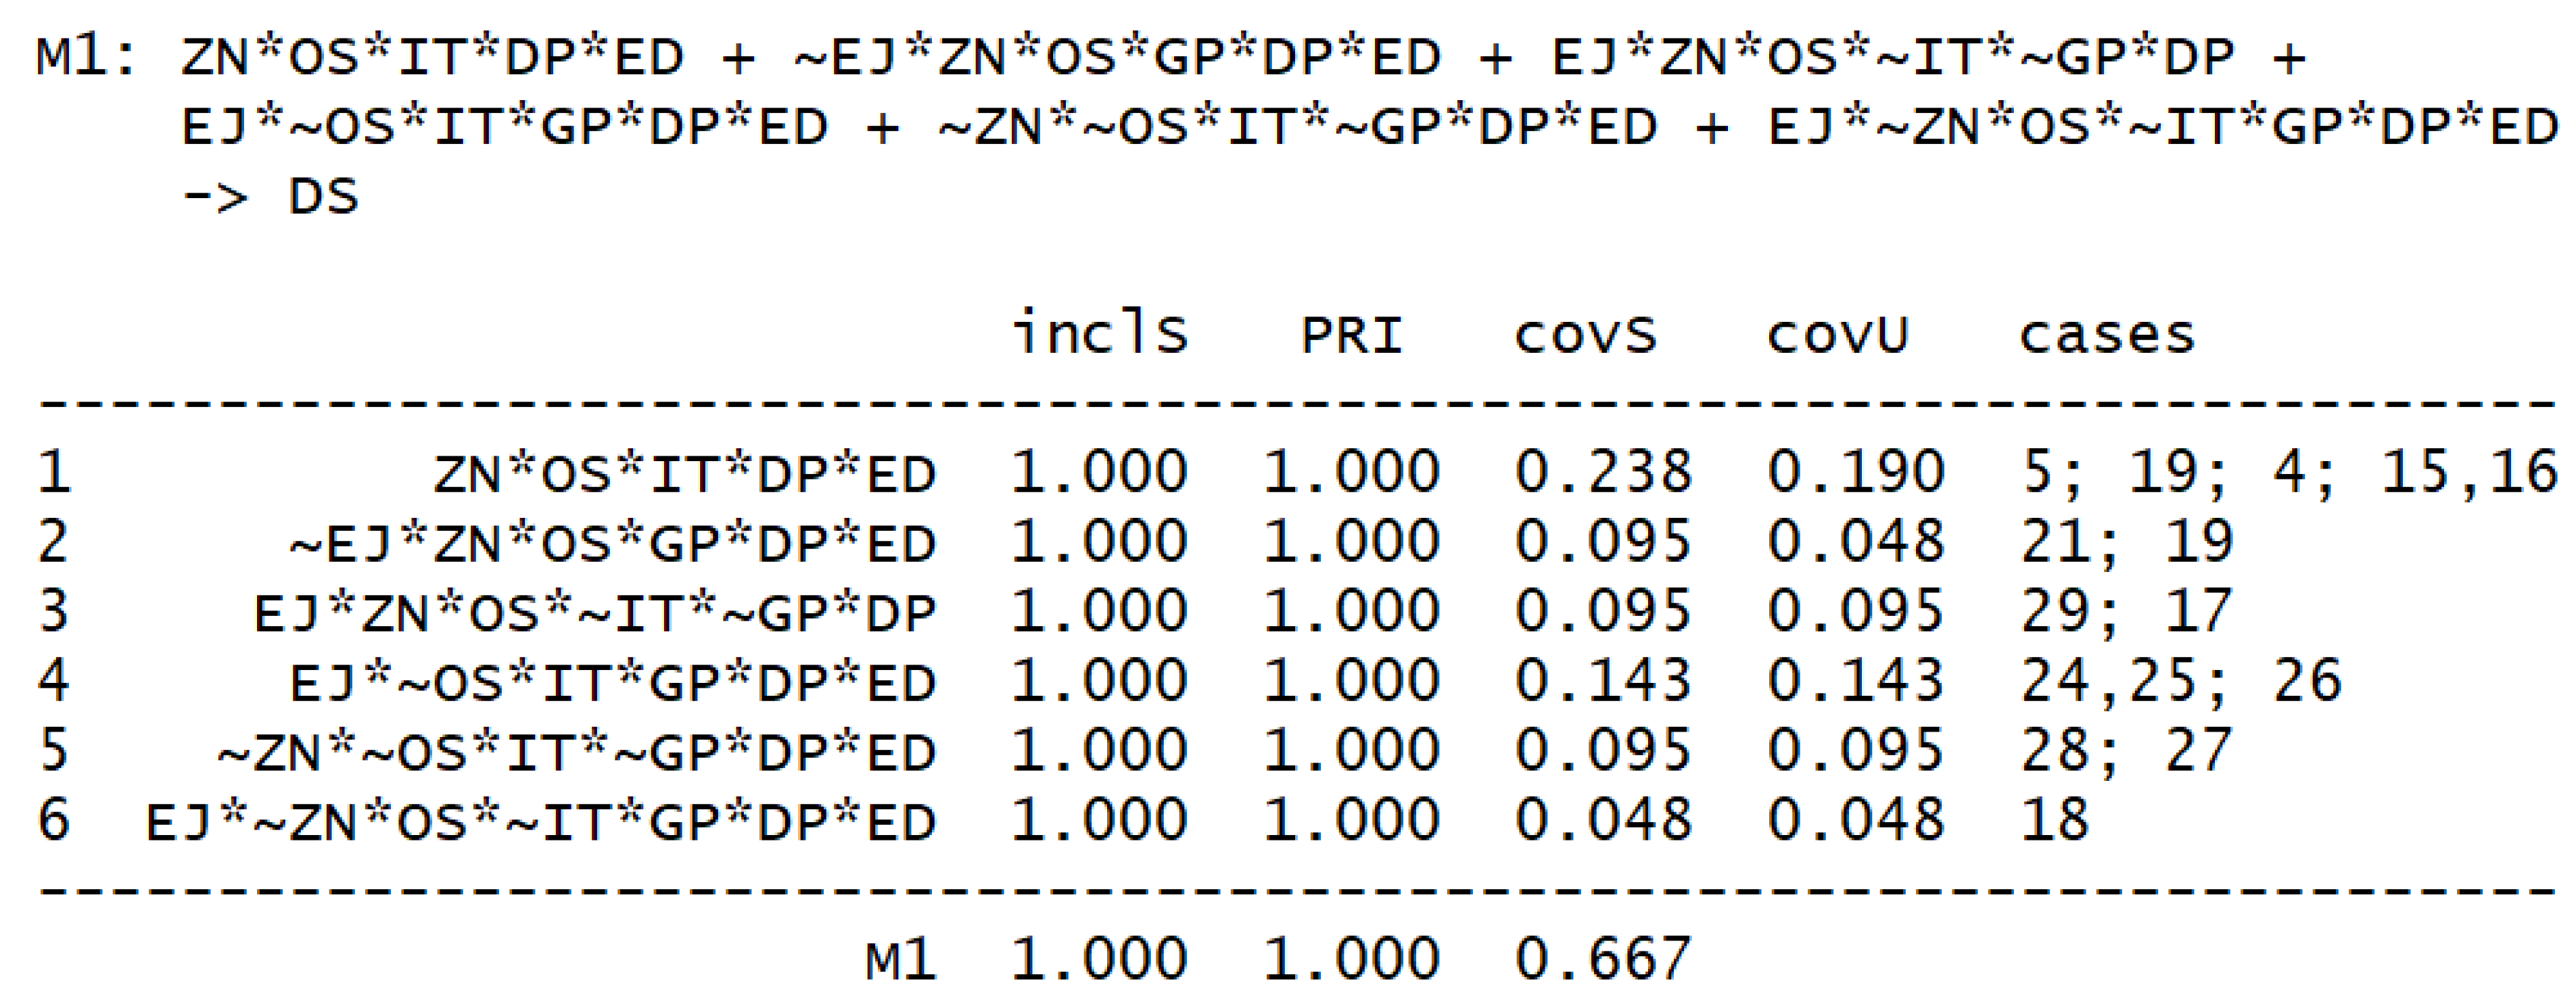
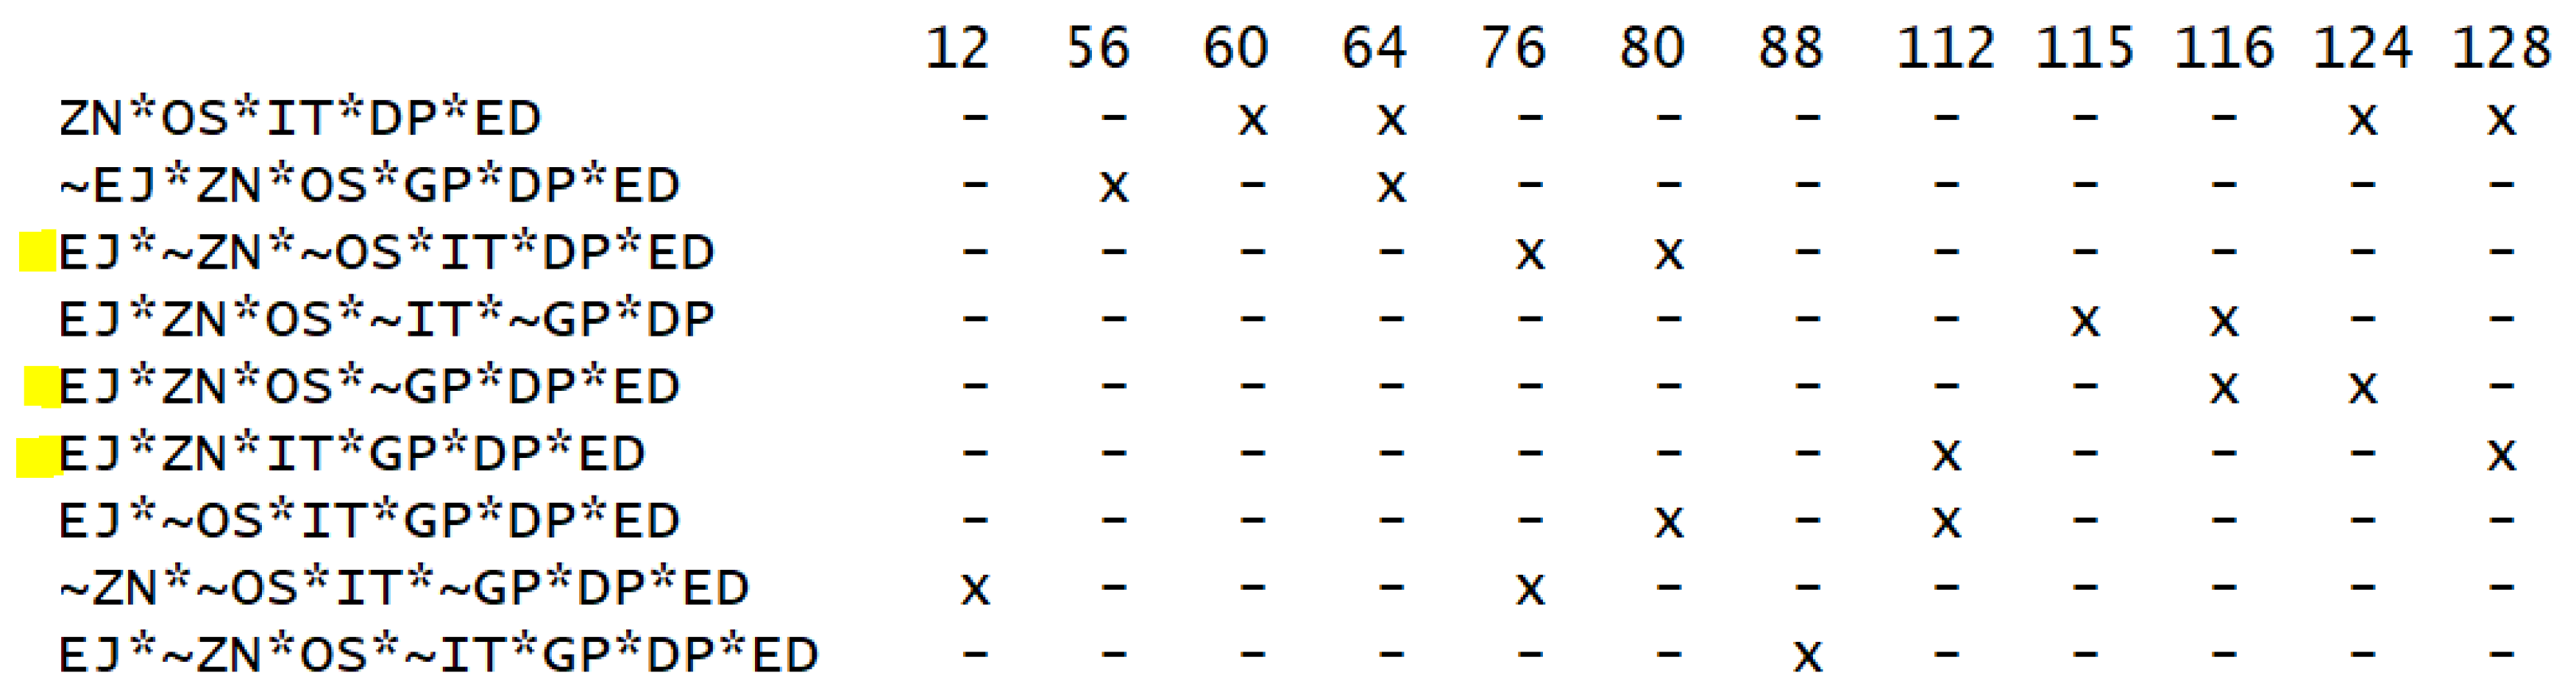
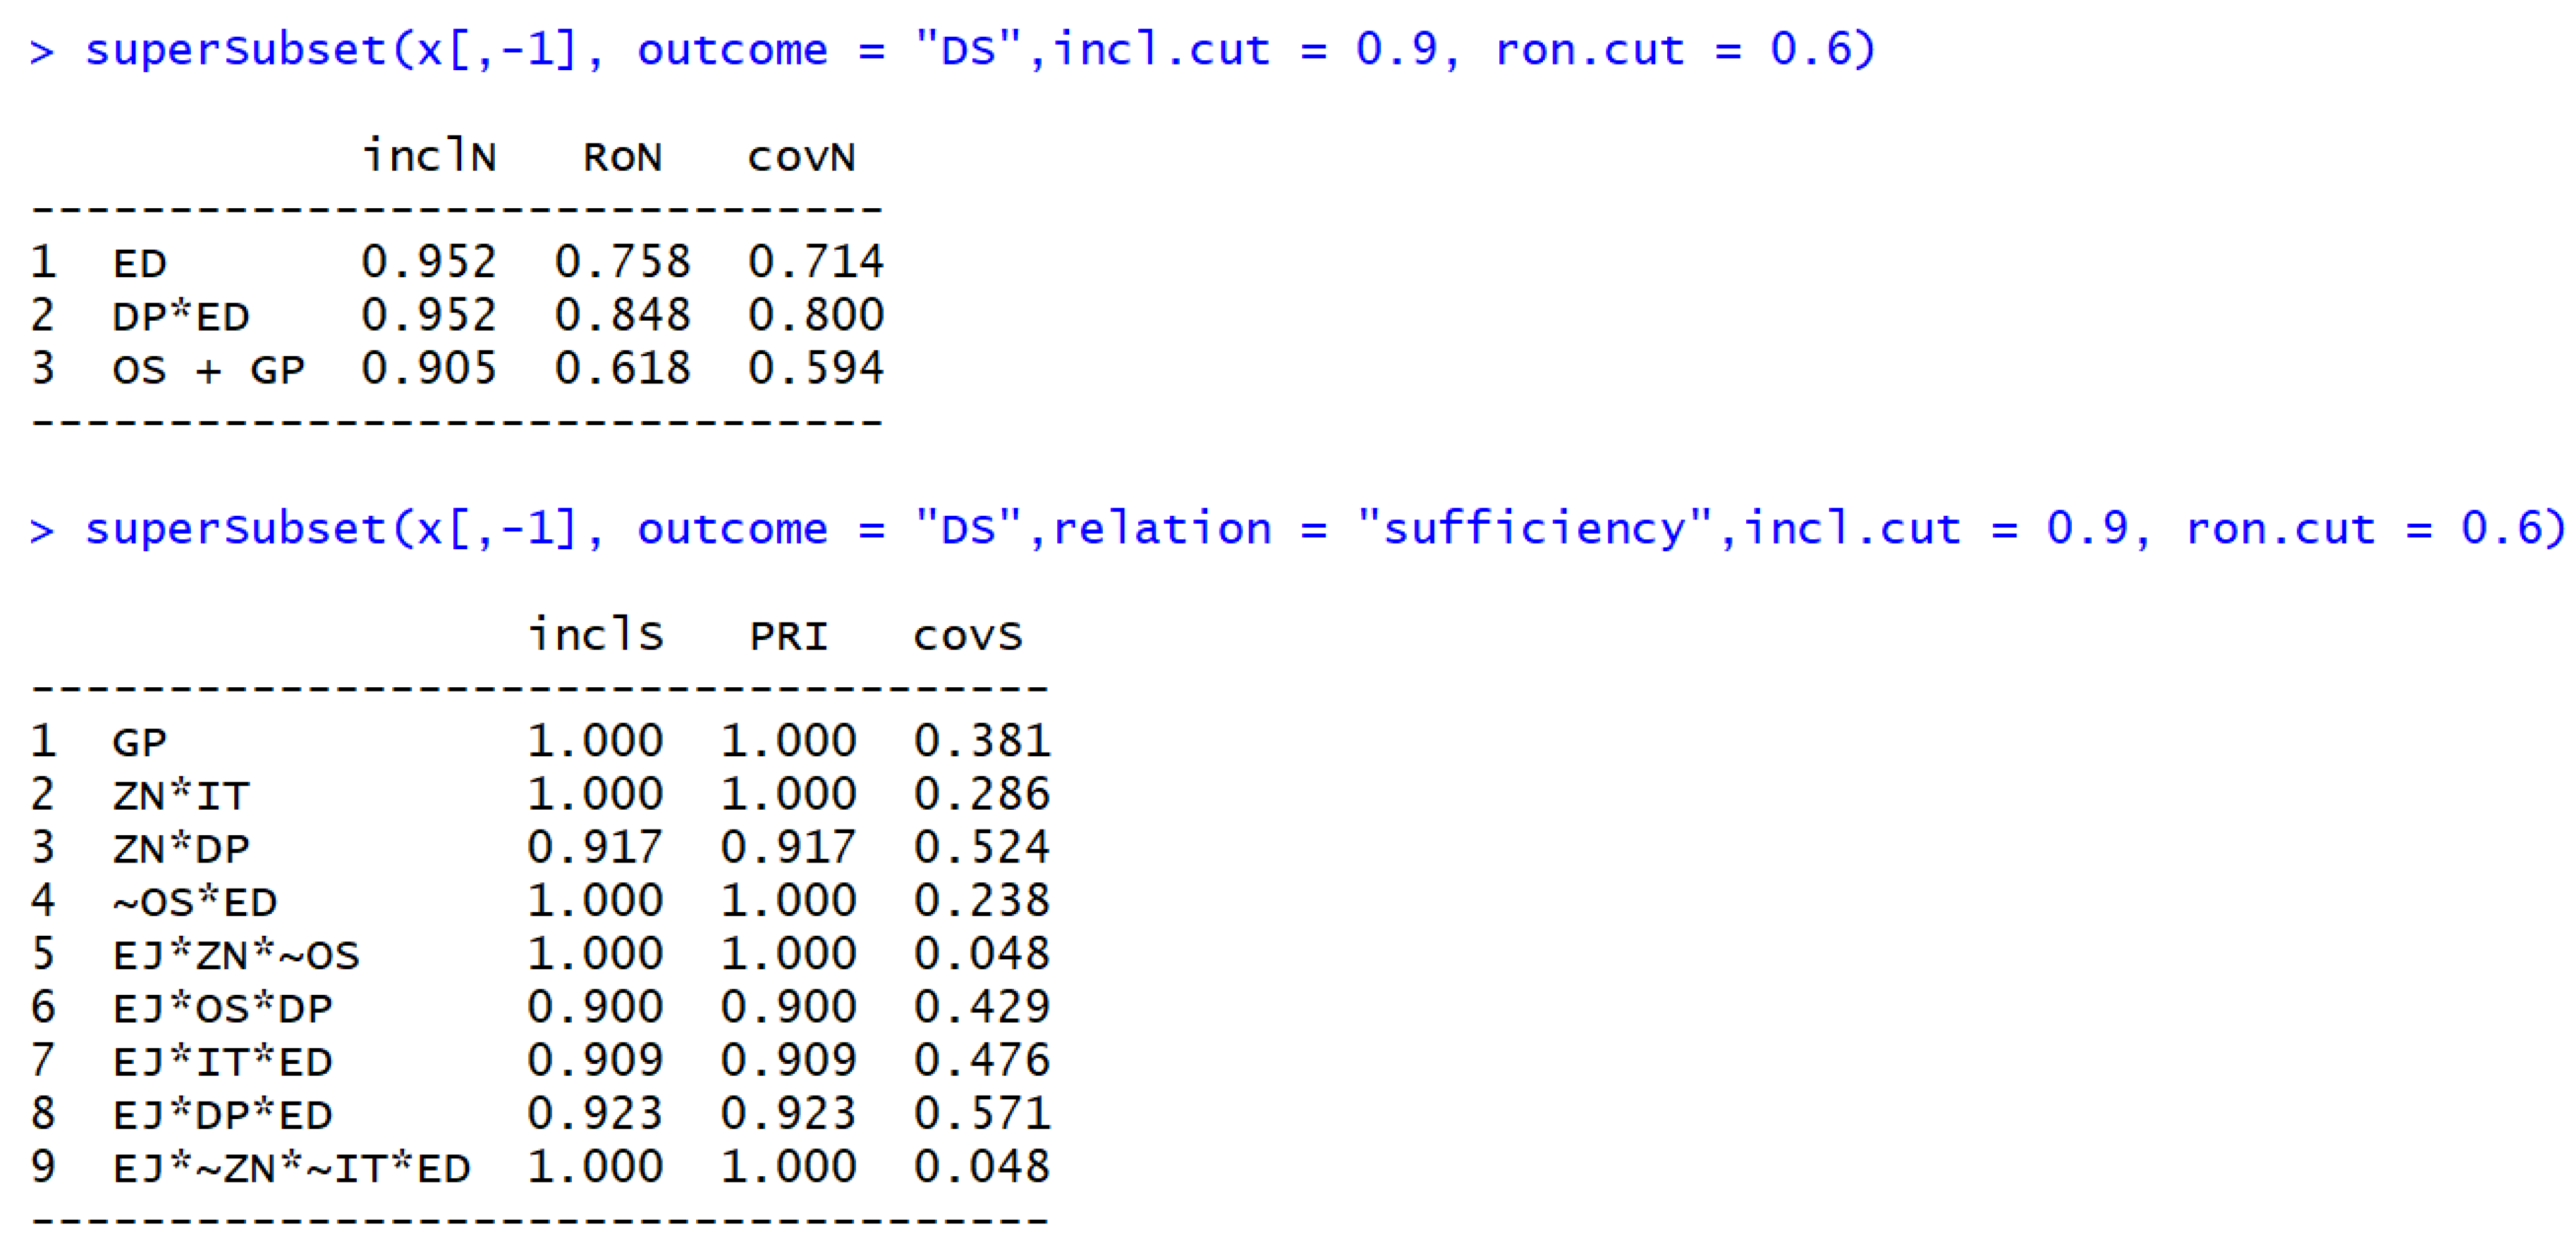
  • Conditions (causes) from the set V that ensure the fulfillment of the consequence DS. Necessary and sufficient configuration of conditions that ensure the execution of the corollary in the QCA method.
  • Test the hypothesis that the variables we introduce into the model increase the logical coverage of the consequence: c o v S ( f D S ( I T = I T 0 , G P = G P 0 , D P = D P 0 ) ) c o v S ( f D S )
The purpose of the baseline study was to determine the configuration of factors for the causal field of causal variables with synergy, which includes the initial predictors (causes) and consequences using the QCA method. QCA has three main variants: QCA with a clear set (csQCA), QCA with multiple values (mvQCA), and QCA with a fuzzy set (fsQCA).
We used CsQCA—the first kind of QCA. It is a tool designed to work with complex binary data sets [52].
QCA uses Boolean algebra and Boolean minimization algorithms to capture patterns of multiple conjunctural causality and logically and holistically simplify complex data structures, as described by Ragin (1987). Using Boolean algebra means that QCA has binary data (0 or 1) as input and uses logical operations for the procedure of constructing a causality estimation model, so it is very important to dichotomize model variables meaningfully [53].
Table 1 shows the coding of the predictors of the model.
To conduct the technical aspect of the research, we used the QCA package in the RStudio environment. As parameters are important when determining any configuration (causal field), we explained parts of the code we used in the article. This will help to better understand the design of our study and understand the features of the QCA method.
We initialized the QCA library and loaded the data. We encoded the IDs of our respondents with numbers from 1 to 53 [54].
library (QCA)
x<-read.csv (“QCA.csv”, sep = “;”, head = T)
The application of the QCA method is quite regulated, so we started with checking
pof (“OS <= DS”, data = x[,−1])
result: inclN = 0.762, RoN = 0.649
We can see that the indicators of inclusion and relevance are at an average level, so the OS factor (level of awareness) does not fully cover the consequence—readiness for voluntary contributions. Similar actions were carried out for other factors and the result [55,56,57] was approximately the same. This means that there is a configuration of factors that explains the consequence. The QCA package offers a useful superSubset() function that conducts all these checks automatically. This function explores all necessity relations for individual conditions or conjunctions (even if the conjunctions are redundant), as well as all disjunctions of conditions that are necessary for a result. We then applied it to our data:
superSubset (x[,−1], outcome = “DS”, incl.cut = 0.9, ron.cut = 0.6)
superSubset (x[,−1], outcome = “DS”, relation = “sufficiency”, incl.cut = 0.9, ron.cut = 0.6)
These commands allowed us to examine the data of our survey for the necessity and sufficiency of conditions (causal variables) that should form some configuration of causes in our causality model. The parameters incl.cut = 0.9, ron.cut = 0.6 show the thresholds for the most suitable configuration options. In our case, these are prime indicators of inclusion and coverage of logical configurations of causality of factors and consequences. We show the results in the figure below (see Figure 1) [58,59].
To analyze the results, it is necessary to understand the algebra of logic [60]. When investigating necessity, it is usually necessary to exclude atomic conditions, since these conditions in disjunctions and conjunctions make them redundant. In our case, DP*ED is a stronger explanation for the necessity of the cause than just ED [61,62]. In the sufficiency study, the opposite situation was found to arise: if an atomic condition (for example, GP) is sufficient for the result, any of its subsets of compounds is redundant, since they are logically sufficient as part of a larger atomic condition. The results are merely an aid for deciding on each variant of the study [63,64]. Since mathematical logic is used to construct structures, which is less flexible than human logic. The PRI (Proportional Reduction in Consistency) estimate, which is found in the output data for the parameters of a suitable function in the sufficiency ratio, shows the ratio of conditions for the result and its negation. When simultaneous relations of subsets arise, we must decide about what our logical [65,66] constructions are most sufficient for the result or its negation. In our case (see Figure 2), the PRI score is equal to the maximum 1 in most constructions, so these configurations are precisely sufficient for the result under study, and not its negation. Because of the conducted research, it becomes practically obvious that our assumption about the construction of the causal field, which includes the variables IT, GP, and ZN in various logical combinations, is confirmed [67].
The next most powerful research tool is the truth table, which serves as an intermediate link for performing logical minimization by Quine [68]. In this process, because of the analysis and transformation of the truth table, logical residuals are determined and excluded from the analysis, rows in the truth table to which no observations were attributed. The remaining rows are analyzed according to two criteria: the minimum number of observations required to consider a particular combination (this value is determined by the researcher depending on the sample size) and the minimum value of the combination consistency indicator. For the combination of variable values to be sufficient, the value of the consistency indicator exceeds 0.75–0.8 [69]. To implement minimization, a counterfactual analysis of causal conditions is used, which allows dividing causal conditions into core and peripheral. Counterfactual analysis is very important when analyzing configurations, because even a few configuration elements leads to a significant number of rows in the truth table [70].
(xTT<-truthTable (x[,−1], outcome = “DS”, show.cases = TRUE, sort.by = “incl, n+”))
We show the result of the execution in Figure 3.
Now, using the minimize() command, we obtained a conservative or complex solution to the problem of our study:
(xSC <- minimize(xTT, details = TRUE))
We show the result in Figure 4.
The results obtained in solving our problem turned out to be interesting but logical residues did not allow this solution to be acceptable to some reservations. We can thus explore why this happened:
xSC$PIchart
We show the result in Figure 5.
The data in Figure 4 show the explanation of contradictions (besides positive results) leads to the addition of additional columns [71] to the diagram of the main implicants (the corresponding rows are marked in yellow).
Therefore, it is advisable to consider an economical solution. A cost-effective solution is a more simplified but equivalent solution compared to a complex solution. It is obtained by applying a less conservative approach to empirical data and including residues in the minimization process. It is implemented by the following command [72,73].
(xSC <- minimize(xTT, include = “?”, details = TRUE, show.cases = TRUE))
The result is shown in Figure 6.
In the table in Figure 6 containing the fitting parameters, two or three conjunctions are sufficient, each of which covers a part of the empirically observed positive configurations in economical solutions. They are displayed with the logical relation OR, and any of them is sufficient for positive configurations, but two with M2 solution and three with M1 are necessary to cover all of them [74,75].
In the first case, three conjunctions, and in the second case, two conjunctions are sufficiently consistent sufficient expressions, but their cumulative unique coverage is below 1, which suggests that there is still some space in the resulting set that remains unexplained.
All this is connected with the problem of logical residues, the explanation of which is quite difficult and is of scientific interest from the point of view [76] of both mathematics and economics.
(xTT<-truthTable (x[,−1], outcome = “DS”, show.cases = TRUE, dcc = T, sort.by = “incl, n+”))
Executing this command leads to an understanding of the logical residuals in this study. The column shows the rows in the truth table corresponding to logical residuals for all cases of DCC. In our case, they are associated with negative (0) output configurations, which is evidence of a well-conducted analysis and will explain the logical inconsistencies [77,78].
To find and exclude contradictory simplifying assumptions, it is necessary to use the built-in findRows() function to build an economical solution:
CSA<- findRows(obj = xTT, type = 2)
(xSC <- minimize(xTT, include = “?”, exclude = CSA))
Our result is shown in Figure 7.
The result of the minimization process (see Figure 7), which excludes untenable assumptions, is an extended economical solution, which can later [79] obtain another intermediate solution, called an extended intermediate solution (EIS) by adding an argument to the dir.exp function, which shows the direction of our search, testing the hypothesis about the importance of the three conditions being tested.
(xSC <- minimize(xTT, include = “?”,details = TRUE, dir.exp = “0,0,0,1,1,1,0”, show.cases = TRUE))
The parameter dir.exp = “0,0,0,1,1,1,0” forcibly includes the factors we tested in the model: IT, DP, and GP
The result is shown in Figure 8 [80].
In the study’s course [81], we obtained a conservative, economical, extended economical and extended intermediate solution, which showed that including IT, DP, and GP factors suffices to obtain a causal model for assessing the development of voluntary pension insurance in the Republic of Kazakhstan. It is obvious that this is only one of the first studies in this direction, which allows us to explain the causality of such a complex phenomenon of real life as readiness for voluntary pension contributions. The results of our modeling process have shown that there are multiple configurations related to a non-probabilistic concept, which is inherently non-linear and additive and emphasizes the equifinality of causality (different paths can lead to the same result) [82,83].
Having transformed the survey results on the Likert scale, we applied multiple regression analysis to our data, within which we tested the following hypotheses [84,85,86].
* Null hypothesis (Ho): factors such as the level of education, awareness, and income level do not affect the increase in the intention to make voluntary pension contributions.
* Alternative hypothesis (NA): factors such as the level of education, awareness, and income level affect the increase in the intention to make voluntary pension contributions.
To test an alternative hypothesis, the authors tested the existence of a relationship between these functions using multiple regression analysis. Then the authors checked for a relationship between the studied features using a one-factor regression analysis. When constructing a regression model, the authors assumed that the relationship between the considered features is linear [87,88]. See results in Table 2.
The value of the R-square characterizes the quality of the acquired regression line. This quality is expressed by correspondence between the source data and the regression model. The value of the R-square of the studied model is 0.377, so the constructed model explains the variability of the corresponding variables by 37.7%, showing the quality of the regression line made for the initial data.
The coefficient of 0.291 shows the amount of voluntary contributions that will be present if all the independent variables in the model under consideration are reset. The relationship between the variables is directly proportional. This shows that if a person knows about the possibility of voluntary contributions, then this increases the intention to make such contributions by 0.291 [89].
The following coefficient −0.157 shows the influence of the level of education on the possibility of voluntary contributions. The coefficient has a negative value. The relationship between the variables is inversely proportional. Higher education leads to an increase in the intention to make voluntary pension contributions.
The last coefficient −0.108 shows the impact of the income level on the possibility of voluntary contributions. The coefficient has a negative value. The relationship between the variables is inversely proportional. A higher level of income leads to an increase in the intention to make voluntary pension contributions.

5. Conclusions

Conservative, economical, extended economical, and extended intermediate solutions were analyzed and results were achieved by applying the QCA method in the RStudio environment using the capabilities of the QCA library. It was found that the IT, DP, and GP factors included in the causality model have signs of sufficiency for the development of voluntary pension insurance in the Republic of Kazakhstan. Together with other factors in different configurations, they make it possible to understand in which directions the Government of the Republic of Kazakhstan and the heads of pension funds should focus their efforts to achieve positive results.
The conducted research complements the results of already known models related to the identification of cause-and-effect relationships in pension provision.
The regression model at the 95% significance level allowed the authors to investigate the dependence of factors such as awareness, education level, and income level on the level of intentions to make voluntary pension contributions to pension funds. This is consistent with the causality model and shows the importance of a comprehensive study on the phenomenon.
It was possible to prove in practice that causality models are equivalent and there are many ways to achieve the desired result.
There is practically no market for voluntary pension contributions in developing countries of the post-Soviet space, such as Kazakhstan. Radical measures are needed to develop the system for voluntary pension contributions as a tool for replenishing pension capital, including in conjunction with improving the pension literacy of the population.
The following is proposed:
  • Encourage citizens to participate in the system of voluntary pension contributions due to a competent combination of mechanisms for behavioral economics. This can include awareness of citizens about pension provision, the ability to plan their expenses, and increase planning horizons.
  • Actively introduce information technologies into the pension system. Create an information platform by the unified cumulative pension fund of the Republic of Kazakhstan, as an integral element for the dissemination of knowledge and information about pension provision, as well as a means of communication between the population and the pension system.
  • The tools we use correctly describe the process and result of modeling. We should continue further research using fuzzy and multivalued logic and the QCA method. The iterative process of building the model showed that not all factors equally affect the result. It is necessary to increase the number of factors reasonably, without changing the design of the study, and process the results of the survey using fuzzy logic and the QCA method.

Author Contributions

Data curation, A.B.; Formal analysis, D.N.; Investigation, L.B. (Leila Bayakhmetova); Methodology, D.N.; Software, L.B. (Leila Bayakhmetova); Visualization, L.B. (Lyazzat Bayakhmetova); Writing—original draft, A.B. All authors have read and agreed to the published version of the manuscript.

Funding

This research received no external funding.

Institutional Review Board Statement

Not applicable.

Informed Consent Statement

Not applicable.

Data Availability Statement

Not applicable.

Conflicts of Interest

The authors declare no conflict of interest.

References

  1. Whitehouse, E. Pensions and the Crisis. How Should Retirement-Income Systems Respond to Financial and Economic Pressures: The Geneva Papers on Risk and Insurance. Issues Pract. 2009, 34, 536–547. [Google Scholar]
  2. Holzmann, R.; Hinz, R. Old Age Income Support in the 21st Century: An International Perspective on Pension Systems and Reform; World Bank: Washington, DC, USA, 2005. [Google Scholar]
  3. Price, W.; Rudolph, H. Reversal and Reduction, Resolution and Reform: Lessons from the Financial Crisis in Europe and Central Asia to Improve Outcomes from Second Pillar Pensions; Working Paper 77779; World Bank: Washington, DC, USA, 2013; pp. 1–82. [Google Scholar]
  4. Schwartz, A.; Arias, O. The Inverted Pyramid: Pension Systems Facing Demographic Challenges in Europe and Central Asia; The World Bank: Washington, DC, USA, 2014; pp. 304–347. [Google Scholar]
  5. Organisation for Economic Co-Operation and Development, OECD Pensions Outlook. OECD ILibrary. 2012. Available online: https://www.oecd-ilibrary.org/finance-and-investment/Oecd-Pensions-Outlook-2012_9789264169401-En (accessed on 23 March 2022).
  6. Mrsik, J.; Lazarevski, D. Reformed Pensions Systems in Central and Eastern Europe: Challenges to Future Safe Pension Benefits. 2012. Available online: https://papers.ssrn.com/sol3/papers.cfm?abstract_id=2137029 (accessed on 29 March 2022). [CrossRef] [Green Version]
  7. Berk, A.; Cok, M.; Kosak, M.; Sambt, J. CEE Transition from PAYG to Private Pensions: Income Gaps and Asset Allocation. Czech J. Econ. Financ. 2013, 63, 360–381. [Google Scholar]
  8. European Commission. The 2015 Ageing Report: Economic and Budgetary Projections for the 28 EU Member States (2013–2060); European Economy 3; European Commission: Brussels, Belgium, 2015; p. 424. [Google Scholar]
  9. OECD. Pensions at a Glance; OECD: Paris, France, 2013. [Google Scholar] [CrossRef]
  10. Holzmann, R.; Robalino, D. Closing the Coverage Gap: The Role of Social Pensions and Other Retirement Income Transfers; World Bank: Washington, DC, USA, 2009. [Google Scholar]
  11. Roffman, R.; Oliveri, M. Pension Coverage in Latin America: Trends and Determinants; Social Protection Discussion Paper No. 1217; World Bank: Washington, DC, USA, 2012; p. 212. Available online: http://siteresources.worldbank.Org (accessed on 29 March 2022).
  12. Ribe, H.; Robalino, D. From Right to Reality: Incentives, Labor Market and the Challenge of Universal Social Protection in Latin America and Caribbean; World Bank Group, Ed.; The World Bank: Washington, DC, USA, 2012; p. 454. [Google Scholar]
  13. Willmore, L. Universal Pensions in Low Income Countries. 2006. Available online: https://papers.ssrn.com/sol3/papers.cfm?Abstract_id=381180 (accessed on 29 March 2022).
  14. Mutembei, R. Effect of Financial Literacy on Voluntary Retirement Planning Among Employees of State Corporations Under the Ministry of Health in Nairobi County, Kenya; University of Nairobi: Nairobi, Kenya, 2016; pp. 34–47. [Google Scholar]
  15. Holzmann, R.; Truman, P.; Cuesta, J. Extending Coverage in Multi-Pillar Systems: Constraints and Hypothesis, Preliminary Evidence and Future Research Agenda; Social Protection Discussion: Paper Series; World Bank: Washington, DC, USA, 2000; pp. 1–14. [Google Scholar]
  16. Thomas, R.; Sane, S. In Search of Inclusion: Informal Sector Participation in a Voluntary, Defined Contribution Pension System. 2013. Available online: http://www.igidr.ac.in/pdf/publication/WP-2013-022.pdf (accessed on 29 March 2022).
  17. Hinrichs, K. Recent pension reforms in Europe: More challenges, new directions. An overview. Social Policy and Administration. 2021, 55, 409–422. [Google Scholar] [CrossRef]
  18. Castel, P. Voluntary Defined Benefit Pension System Willingness to Participate the Case of Vietnam. Center for International Policy Exchanges. 2005. Available online: http://www.umdcipe.org/conferences/policy_exchanges/conf_papers/Papers/2381.Pdf (accessed on 29 March 2022).
  19. Moorthy, M.; Thamil, D.; Chiau, S. A Study on Retirement Planning Behaviour of Working Individuals in Malaysia. Int. J. Acad. Res. Econ. Manag. Sci. 2012, 2, 54–72. [Google Scholar]
  20. Valdes-Prieto, S. A Theory of Contribution Density and Implication for Pension Design; SP Discussion Paper 0828; World Bank: Washington, DC, USA, 2008; pp. 1–52. [Google Scholar]
  21. Mesa, A.; Behrman, J.; Bravo, D. Characteristics and Determinants of the Density of Contributions in a Private Social Security System; Research Paper WP 2004-077; Michigan Retirement Research Center: Ann Arbor, MI, USA, 2004; pp. 2–49. [Google Scholar]
  22. Medrano, P. Participación en el Sistema de PFA de Qué Depende; University of Chile: Santiago, Chile, 2007; pp. 12–17. [Google Scholar]
  23. Pieńkowska-Kamieniecka, S. The Role of Additional Pension Plans in Selected Countries in Central and Eastern Europe. In Proceedings of the 5th International Conference the Economies of Balkan and Eastern Europe Countries in the Changed Word, Split, Croatia, 6–8 May 2013; Kavala Institute of Technology: Kavala, Greece, 2013; pp. 143–153. [Google Scholar]
  24. Rutecka-Góra, J. Evolution of Supplementary Old-Age Pension Systems in Selected CEE Countries. J. Manag. Financ. 2016, 14, 149–162. [Google Scholar] [CrossRef]
  25. Hershey, D.; Jacob-Lawson, J.; McArdle, J. Psychological Foundations of Financial Planning for Retirement. J. Adult Dev. 2008, 14, 26–36. [Google Scholar] [CrossRef]
  26. Heuts, L.; Klaver, J. Evaluatie Informatiebepalingen Pensioenwetgeving: Eindrapport; Regioplan Beleidsonderzoek: Amsterdam, The Netherlands, 2011. [Google Scholar]
  27. Atkinson, A.; Yermo, J.; Messy, F. Lessons from National Pensions Communication Campaigns. 2012. Available online: https://www.researchgate.net/Publication/241764279 (accessed on 29 March 2022).
  28. Kast, F.; Meier, S.; Pomeranz, D. Under-Savers Anonymous: Evidence on Self-Help Groups and Peer Pressure as a Savings Commitment Device; NBER Working Paper 18417; National Bureau of Economic Research: Cambridge, MA, USA, 2012; pp. 79–93. [Google Scholar] [CrossRef]
  29. Mugerman, Y.; Sade, O.; Shayo, M. Long Term Savings Decisions: Financial Reform, Peer Effects and Ethnicity. J. Econ. Behav. Organ. 2014, 106, 235–253. [Google Scholar] [CrossRef]
  30. Beshears, J.; Choi, J.J.; Laibson, D.; Madrian, B.C.; Milkman, K.L. The Effect of Providing Peer Information on Retirement Savings Decisions. J. Financ. 2015, 70, 1161–1201. [Google Scholar] [CrossRef]
  31. Johansen, K. Information Search in Pension Plan Decisions. Appl. Econ. Lett. 2013, 20, 1648–1650. [Google Scholar] [CrossRef]
  32. Fang, H.; Feng, J. The Chinese Pension System. 2018. Available online: http://www.nber.org/papers/W25088 (accessed on 29 March 2022).
  33. Autoriteit Financiële Markten. Een Volgende Stap Naar Meer Pensioeninzicht: Pensioeninformatie Actief Gebruiken. Autoriteit Financiële Markten, Amsterdam. 2012. Available online: https://www.afm.Nl/ (accessed on 29 March 2022).
  34. Bernheim, B.D.; Fradkin, A.; Popov, I. The Welfare Economics of Default Options in 401(k) Plans. Am. Econ. Rev. 2015, 105, 2798–2837. [Google Scholar] [CrossRef] [Green Version]
  35. Brown, K.M.; Laschever, R.A. When They’re Sixty-Four: Peer Effects and the Timing of Retirement. Am. Econ. J. Appl. Econ. 2012, 4, 90–115. [Google Scholar] [CrossRef]
  36. Bucher-Koenen, T.; Lusardi, A.; Alessie, R. How Financially Literate Are Women? Some New Perspectives on the Gender Gap; Netspar Panel Paper; Global Financial Literacy Excellence Center: Washington, DC, USA, 2012; Volume 31, pp. 12–26. [Google Scholar]
  37. Camerer, C.; Weber, M. Recent Developments in Modeling Preferences: Uncertainty and Ambiguity. J. Risk Uncertain. 1992, 5, 325–370. [Google Scholar] [CrossRef]
  38. Kearney, M. Essays on the Determinants of Pensions Savings and Retirement Management Decisions; Working Paper 4; University of Maryland: College Park, MD, USA, 2011; pp. 4–18. Available online: https://pqdtopen.proquest.com/doc/904159541.Html?FMT=ABS (accessed on 29 March 2022).
  39. Melissa, A.; Knoll, M. The Role of Behavioral Economics and Behavioral Decision Making in Americans’ Retirement Savings Decisions; Society of Actuaries: Schaumburg, IL, USA, 2011; pp. 70–80. [Google Scholar]
  40. Meng, C.; Pfau, W. The Role of Pension Funds in Capital Market Development; GRIPS Discussion Papers; National Graduate Institute for Policy Studies: Tokyo, Japan, 2010; pp. 52–64. [Google Scholar]
  41. Merton, R.; Snippe, J. Dutch Not Facing up to Pension Troubles. Financial Times, 26 September 2012. [Google Scholar]
  42. Mitchell, O.S.; Utkus, S.P. Lessons from Behavioral Finance for Retirement Plan Design; PRC WP 2003-6. In Pension Design and Structure; Oxford University Press (OUP): Oxford, UK, 2004; pp. 3–42. [Google Scholar] [CrossRef] [Green Version]
  43. Nazarov, D.; Nazarov, A.; Kovtun, D. Building Technology and Predictive Analytics Models in the SAP Analytic Cloud Digital Service. In Proceedings of the 2020 IEEE 22nd Conference on Business Informatics (CBI), Antwerp, Belgium, 22–24 June 2020; Institute of Electrical and Electronics Engineers (IEEE): Piscataway, NJ, USA, 2020; Volume 2, pp. 106–110. [Google Scholar] [CrossRef]
  44. Nazarov, D.M.; Morozova, A.S.; Kokovikhin, A.Y. SAP Analytic Cloud: A Tool for the Formation of Professional Competencies of Business Analyst. In Proceedings of the CEUR Workshop Proceedings, St. Petersburg, Russia, 17–20 June 2020; p. 2570. [Google Scholar]
  45. Munnell, A.; Sunden, A.; Taylor, C. What Determines 401(k) Participation and Contributions. Soc. Secur. Bull. 2002, 64, 64–75. [Google Scholar] [CrossRef] [Green Version]
  46. O’Connor, K.M.; De Dreu, C.K.W.; Schroth, H.; Barry, B.; Lituchy, T.R.; Bazerman, M.H. What We Want to Do Versus What We Think We Should Do: An Empirical Investigation of Intrapersonal Conflict. J. Behav. Decis. Mak. 2002, 15, 403–418. [Google Scholar] [CrossRef]
  47. Olsen, A.; Whitman, K. Effective Retirement Savings Programs: Design Features and Financial Education. Soc. Secur. Bull. 2007, 67, 53–72. [Google Scholar] [PubMed]
  48. Papke, L.E. Participation in and Contributions to 401(k) Pension Plans: Evidence from Plan Data. J. Hum. Resour. 1995, 30, 311. [Google Scholar] [CrossRef]
  49. Peron, A.; John, K.M. Willingness to Participate in Micro Pension Schemes: Evidence from the Informal Sector in Ghana. J. Econ. Int. Financ. 2013, 5, 21–34. [Google Scholar]
  50. Popta, B.; Morency, B. Summary of the Chilean Pension System Santiago: International Centre for Pension Management; Organisation for Economic Co-operation and Development (OCDE): Paris, France, 2018; pp. 70–110. [Google Scholar]
  51. Prast, H. Complexe Producten: Wat Kunnen Ze Betekenen En Wie Moet Ze Begrijpen? Over financiële Educatie En De Verantwoordelijkheid Van Instituties; De Nederlandsche Bank: Amsterdam, The Netherlands, 2007; pp. 45–67. [Google Scholar]
  52. Raaij, F.; Huiskes, N. Individual Differences in Pension Knowledge; CASS, City University: London, UK, 2011; pp. 34–87. [Google Scholar]
  53. Renneboog, L.; Spaenjers, C. Religion, Economic Attitudes, and Household Finance. Oxf. Econ. Pap. 2012, 64, 103–127. [Google Scholar] [CrossRef]
  54. Schmidt-Hebbel, K. Does Pension Reform Really Spur Productivity, Saving and Growth? Banco Central De Chile, Gerencia De Investigacion Economica, Departamento Publicaciones: Santiago, Chile, 1998; Volume 33, pp. 1–7. [Google Scholar]
  55. Spruit, J. Does Pension Awareness Reduce Pension Concerns? Causal Evidence from the Netherlands. Master’s Thesis, Leiden University, Leiden, The Netherlands, 2018; pp. 32–38. [Google Scholar]
  56. Stelten, S. Extending Coverage of the New Pension Scheme in India; Hertie School of Governance: Berlin, Germany, 2017; pp. 1–25. [Google Scholar]
  57. Wang, X.; Yu, C.; Wei, Y. Social Media Peer Communication and Impacts on Purchase Intentions: A Consumer Socialization Framework. J. Interact. Mark. 2012, 26, 198–208. [Google Scholar] [CrossRef]
  58. Waters, R.D.; Burnett, E.; Lamm, A.; Lucas, J. Engaging Stakeholders through Social Networking: How Nonprofit Organizations Are Using Facebook. Public Relat. Rev. 2009, 35, 102–106. [Google Scholar] [CrossRef]
  59. Wijzer in Geldzaken. Pensioenbewustzijn, Wijzer in Geldzaken, The Hague. 2012. Available online: https://www.wijzeringeldzaken.nl/Regel-Je-pensioen/5-Vragen-over-Het-Verdelen-En-Verevenen-Van-Pensioen-Bij-Een-Scheiding/ (accessed on 29 March 2022).
  60. Wolf, C.A. Whether to Approve an Education Savings Account Program in Texas: Preventing Crime Does Pay; EDRE Working Paper; University of Arcansas: Fayetteville, AR, USA, 2016; p. 20. [Google Scholar]
  61. Shalgimbaeva, N.T. Report on the Results of Trips to the Republic of Chile to Study the Issues of the Functionality of the Funded Pension System; National Bank of the Republic of Kazakhstan: Almaty, Kazakhstan, 2011; pp. 6–9. [Google Scholar]
  62. Wright, S. Correlation and I Causality. J. Agric. Res. 1921, 20, 557. [Google Scholar]
  63. Rubin, D.B. Bayesian Inference for Causal Effects: The Role of Randomization. Ann. Stat. 1978, 6, 34–58. [Google Scholar] [CrossRef]
  64. Hair, J.F. A Primer on Partial Least Squares Structural Equation Modeling (PLS-SEM); Saga: Ventura County, CA, USA, 2014; p. 56. [Google Scholar]
  65. Jassbi, J.; Mohamadnejad, F.; Nasrollahzadeh, H.A. Fuzzy DEMATEL Framework for Modeling Cause and Effect Relationships of Strategy Map. Expert Syst. Appl. 2011, 38, 5967–5973. [Google Scholar] [CrossRef]
  66. Chen, F.H.; Chi, D.-J. Application of a New DEMATEL to Explore Key Factors of China’s Corporate Social Responsibility: Evidence from Accounting Experts. Qual. Quant. 2015, 49, 135–154. [Google Scholar] [CrossRef]
  67. Wu, H.-H.; Chang, S.-Y. A Case Study of Using DEMATEL Method to Identify Critical Factors in Green Supply Chain Management. Appl. Math. Comput. 2015, 256, 394–403. [Google Scholar] [CrossRef]
  68. Khanam, S.; Siddiqui, J.; Talib, F. Modelling the TQM Enablers and IT Resources in the ICT Industry: An ISM-MICMAC Approach. Int. J. Inf. Syst. Manag. 2015, 1, 195–218. [Google Scholar] [CrossRef]
  69. Mudgal, R.K.; Shankar, R.; Talib, P.; Raj, T. Greening the Supply Chain Practices: An Indian Perspective of enablers’ Relationships. Int. J. Adv. Oper. Manag. 2009, 1, 151. [Google Scholar] [CrossRef]
  70. Angrist, J.D.; Pischke, J.-S. The Credibility Revolution in Empirical Economics: How Better Research Design Is Taking the Con Out of Econometrics. J. Econ. Perspect. 2010, 24, 3–30. [Google Scholar] [CrossRef] [Green Version]
  71. Balke, A.; Pearl, J. Counterfactuals and Policy Analysis in Structural Models. In Uncertainty in Artificial Intelligence; Besnard, P., Hanks, S., Eds.; Morgan Kaufmann: Burlington, MA, USA, 1995; p. 11. [Google Scholar]
  72. Dawid, A.P. Conditional Independence in Statistical Theory. J. R. Stat. Soc. Ser. B Stat. Methodol. 1979, 41, 1–31. [Google Scholar] [CrossRef]
  73. Engle, R.; Hendry, D.; Richard, J. Exogeneity. Econometrica 1983, 51, 277–304. [Google Scholar] [CrossRef]
  74. Foygel, R.; Draisma, J.; Drton, M. Half-Trek Criterion for Generic Identifiability of Linear Structural Equation Models. Ann. Stat. 2012, 40, 1682–1713. [Google Scholar] [CrossRef]
  75. Galles, D.; Pearl, J. An Axiomatic Characterization of Causal Counterfactuals. Found. Sci. 1998, 3, 151–182. [Google Scholar] [CrossRef]
  76. Glymour, M.; Greenland, S. Causal Diagrams. In Modern Epidemiology, 3rd ed.; Rothman, K., Greenland, S., Lash, T., Eds.; Lippincott Williams & Wilkins: Philadelphia, PA, USA, 2008; pp. 183–209. [Google Scholar]
  77. Pearl, J. The Foundations of Causal Inference. Sociol. Methodol. 2010, 40, 75–149. [Google Scholar] [CrossRef]
  78. Pearl, J. An Introduction to Causal Inference. Int. J. Biostat. 2010, 6, 354. [Google Scholar] [CrossRef]
  79. Pearl, J. Graphical Models, Potential Outcomes and Causal Inference: Comment on Lindquist and Sobel. Stat. Med. 2011, 58, 770–771. [Google Scholar] [CrossRef]
  80. Ambuehl, M.; Baumgartner, M. Cna: Causal Modeling with Coincidence Analysis. R Package Version 2.0.0. 2017. Available online: https://CRAN.R-project.org/Package=cna (accessed on 29 March 2022).
  81. Barrenechea, R.; Mahoney, J. A Set-Theoretic Approach to Bayesian Process Tracing. Sociol. Methods Res. 2017, 48, 451–484. [Google Scholar] [CrossRef]
  82. Cheli, B.; Lemmi, A. A “totally” Fuzzy and Relative Approach to the Multidimensional Analysis of Poverty. Econ. Notes 1995, 1, 115–134. [Google Scholar]
  83. Cronqvist, L.; Berg-Schlosser, D. Multi-Value QCA (mvQCA). In Configurational Comparative Methods: Qualitative Comparative Analysis (QCA) and Related Techniques; Rihoux, B., Ragin, C., Eds.; Sage Publications: London, UK, 2009; pp. 69–86. [Google Scholar]
  84. Dalgaard, P. Introductory Statistics With R, 2nd ed.; Springer: New York, NY, USA, 2008. [Google Scholar]
  85. De Meur, G.; Rihoux, B.; Yamasaki, S. Adressing the Critiques of QCA. In Configurational Comparative Methods: Qualitative Comparative Analysis (QCA) and Related Techniques; Rihoux, B., Ragin, C., Eds.; Sage Publications: London, UK, 2009; pp. 147–165. [Google Scholar]
  86. Dusa, A. A Mathematical Approach to the Boolean Minimization Problem. Qual. Quant. 2008, 44, 99–113. [Google Scholar] [CrossRef]
  87. Ragin, C. Redesigning Social Inquiry: Fuzzy Sets and Beyond; University of Chicago Press: Chicago, IL, USA; London, UK, 2008. [Google Scholar]
  88. Ragin, C.C. Comment: Lucas and Szatrowski in Critical Perspective. Sociol. Methodol. 2014, 44, 80–94. [Google Scholar] [CrossRef]
  89. Ragin, C.; Rihoux, B. Qualitative Comparative Analysis (QCA): State of the Art and Prospects. Qual. Methods 2004, 2, 3–13. [Google Scholar]
Figure 1. A graphical representation of the model.
Mathematics 10 01415 g001
Figure 2. Results of applying the superSubset() function to research survey data.
Mathematics 10 01415 g002
Figure 3. Fragment of the truth table.
Mathematics 10 01415 g003
Figure 4. Complex (conservative) solution to the research problem.
Mathematics 10 01415 g004
Figure 5. Explanation of the complex (conservative) solution to the research problem.
Mathematics 10 01415 g005
Figure 6. Economical solution to the research problem.
Mathematics 10 01415 g006
Figure 7. Extended economical solution to the research problem (EPS).
Mathematics 10 01415 g007
Figure 8. Extended intermediate solution (EIS).
Mathematics 10 01415 g008
Table 1. Variables for the causality assessment model of factors.
PredictorsCoding of Variables (Dichotomy)
Work experience (EJ)Sufficient (over 13.5 years)—1
Insufficient (less than 13.5 years)—0
Knowledge of legislation pension and social security (ZN)Knows the basics—1
Does not know the basics—0
Level of awareness of voluntary accumulation models (OS)Aware—1
Not aware—0
The level of ownership of information and communication technologies (IT) by the populationOwns—1
Does not own—0
Planning horizon (GP)High—1
Low—0
Public confidence in the pension system (DP)Trusts—1
Does not trust—0
Education level (ED)Above bachelor’s degree—1
Below bachelor’s degree—0
Voluntary Pension Insurance System (DS)Ready to pay—1
Not ready to pay—0
Table 2. Indicators of multivariate statistical analysis (performed by the authors, 2021).
Regression Statistics
Multiple R0.614
R-square0.377
Normalized R-square0.357
Standard error0.403
Observations97
ANOVA
dfSSMSFSignificance F
Regression39.13.018.80.000
Residual9315.10.2
Total9624.2
CoefficientsStandard
error
t-statisticsp-valueLower 95%Upper 95%
Y-crossing1.8700.2208.4860.0001.4322.307
Awareness 0.2910.1092.6720.0090.0750.507
Education level−0.1570.045−3.5300.001−0.246−0.069
Income level−0.1080.041−2.6260.010−0.189−0.026
Publisher’s Note: MDPI stays neutral with regard to jurisdictional claims in published maps and institutional affiliations.

