Article

A Fuzzy Improvement Testing Model of Bank APP Performance

1
School of Economics and Management, Dongguan University of Technology, Dongguan 523808, China
2
School of Management, University of Science and Technology of China, Hefei 230026, China
3
Department of Finance, National Taichung University of Science and Technology, Taichung 404336, Taiwan
4
Department of Industrial Engineering and Management, National Chin-Yi University of Technology, Taichung 411030, Taiwan
5
Department of Business Administration, Chaoyang University of Technology, Taichung 413310, Taiwan
6
Institute of Innovation and Circular Economy, Asia University, Taichung 413305, Taiwan
*
Author to whom correspondence should be addressed.
Mathematics 2022, 10(9), 1409; https://doi.org/10.3390/math10091409
Submission received: 26 February 2022 / Revised: 14 April 2022 / Accepted: 20 April 2022 / Published: 22 April 2022
(This article belongs to the Special Issue Fuzzy Applications in Industrial Engineering)

Abstract

:
Numerous studies have pointed out that the issue of global warming is getting increasingly more serious. Therefore, the concepts of circular economy (CE) and sharing economy have been more and more valued by enterprises and governments. With the gradual popularization and maturity of the Internet of Things (IoT), various smart APP platforms have sprung up rapidly. For example, the fuzzy evaluation model of bank APP performance was proposed in such an environment, aiming to improve the APP service performance by means of evaluating, analyzing, improving, and enhancing customers’ satisfaction with their use of APPs, and increasing the number of users of APPs. Since the follow-up of the article did not mention the improved testing model used to verify the improvement effect, this paper then proposed a fuzzy two-tailed testing model with two indices before and after the improvement based on the confidence interval to verify whether the improvement has had a significant effect. This complete bank APP fuzzy performance evaluation, analysis, and improvement model measured the bank APP operation performance using customer time intervals, so the data collection time was short. Not only can it meet enterprises’ need for rapid response and grasp the opportunity for improvement to achieve the effect of energy-saving and carbon reduction, but it also can satisfy enterprises’ requirement to pursue fast and accurate decision-making. Furthermore, the fuzzy two-tailed test proposed by this paper was based on the confidence interval, which can reduce the risk of misjudgment caused by sampling error. Plenty of studies have indicated that the designs based on confidence intervals can integrate expert experience and past data so that the accuracy of testing can be maintained in the case of small-sized samples.

1. Introduction

Many studies have revealed that the issue of global warming is becoming increasingly more serious. Consequently, the thinking of circular economy (CE) and sharing economy has been more and more highlighted by businesses and governments [1,2,3,4,5,6,7]. A variety of smart applications (APPs) have sprung up rapidly in the face of this issue, especially as the Internet of Things (IoT) and big data analysis technologies gradually become popular and mature. Smart APPs can link all relevant information and facilitate the disclosure and delivery of information, making what we are doing more convenient and more economically efficient [8,9,10,11,12]. For example, various transportation APPs raise the willingness and population of carpooling, educational APP platforms allow people to learn without going out, and bank APPs allow people to complete transfers, payments, and various transactions at home without going out. Obviously, the development of smart APPs can not only alleviate traffic congestion and reduce carbon emissions but also save the labor cost of banks so that enterprises can accelerate their pace toward the goal of innovative and smart management as well as achieve economic benefits and the effects of energy-saving and waste reduction [13,14,15,16].
Based on the above-mentioned, Chen et al. [2] has put forward a fuzzy evaluation model of bank APP performance to promote the APP service performance, enhance customers’ satisfaction with the use of the APP, and increase the number of users of the APP by means of evaluation, analysis, and improvement. According to some research, the number of customers ( N t ) accessing an APP is a Poisson distribution with a rate λ t [17,18,19,20,21]. As noted by Chen et al. [2], the mean time ( T j ) is the average time that two continuous customers access an APP, and then T j is a distributed exponential random variable with mean τ = 1 / λ . The probability density function of T j is
f T j ( t ) = 1 τ × e x p { t τ } ,   t 0 .
If at least N 0 customer is required to access the APP within a unit of time, it is equivalent to the requirement of T j U , where U = 1 / N 0 denotes the maximum expected interarrival time of two continuous customers accessing the APP. On this basis, Chen et al. [2] proposed an APP performance index ( A P I ) as follows:
A P I = U τ .
Obviously, performance index A P I and ratio q, which do not meet performance requirements, have a one-to-one mathematical relationship, where
q = p ( T j > U ) = e x p { A P I } .
Then, Chen et al. [2] proposed a fuzzy testing model based on the confidence interval for performance index A P I to evaluate whether the bank APP performance can meet the required performance level. The fuzzy evaluation model employed customer time intervals to measure the bank APP operation performance, so the time for collecting data was relatively short. Consequently, this model can meet enterprises’ need to pursue fast and accurate decision-making. However, the fly in the ointment is that the above-mentioned model only provides an evaluation of the bank APP operation performance. Although it can quickly grasp the opportunity for improvement, it cannot provide verification of whether the improvement is effective. Therefore, this paper then proposes a fuzzy two-tailed testing model based on the confidence interval to verify whether the improvement has a significant effect. This fuzzy improvement testing model, combined with the fuzzy performance evaluation model of Chen et al. [2], will form a complete model of bank APP fuzzy performance evaluation, analysis, and improvement. In addition, because the fuzzy two-tailed test proposed by this paper is based on the confidence interval, it can reduce the risk of misjudgment resulting from sampling error.
The other sections of this paper are organized as follows. In Section 2, this paper deduces confidence intervals of bank APP performance indices before and after improvement to construct fuzzy membership functions. In Section 3, a fuzzy two-tailed testing model is proposed by means of the above two fuzzy membership functions to verify whether the improvement has a significant effect. Section 4 presents an application example demonstrating the applicability of the proposed approach. Section 5 provides conclusions.

2. Confidence Intervals of Two APP Performance Indices

Obviously, putting forward a complete model for evaluation, analysis, and improvement of smart APPs will help enterprises develop more efficient APPs, so it is a crucial topic. If the operating performance of an APP is directly measured by the number of customers who use the APP within a unit of time, then it will take a relatively long time to collect data. Since the number of customers using the APP within a unit of time is a Poisson distribution, a larger sample size is required to make statistical inferences with the normal approximation rule. If 30 pieces of data are collected to meet the central limit theorem, it will take 30 units of time to complete the collection. In contrast, if the operation performance of the APP is measured by the time interval of customers using the APP, the sample data of sample size n = 35 can be immediately obtained when there are 35 users in the first unit of time. That way, the fuzzy test based on the confidence interval can be carried out, so the time of data collection will be 1/30 of the number of collected customers. Apparently, measuring the APP operation performance with time intervals of the customers using the APP is more in line with the need of enterprises’ pursuit of fast and accurate decision-making. Quite a few studies have suggested that sorting the time intervals between customers’ access to an APP is more effective than the number of customers arriving within a unit of time [2,22,23]. It is assumed that the two sets of samples of the time intervals between customers accessing the APP before and after the improvement are sorted as T h , 1 , , T h , j , , T h , n h , where h = 1 represents the pre-improvement while h = 2 represents the post-improvement. Then, the unbiased estimator of A P I h is expressed as follows:
A P I h = U τ h ,
where τ h = ( n h 1 ) 1 j = 1 n h T h , j is the estimator of mean τ h . According to Chen et al. [2], let
W = ( n h 1 ) A P I h A P I h ,
then W is distributed as G ( n h , 1 ) and the probability density function of W is displayed below:
f W ( w ) = 1 Γ ( n h ) × w n h 1 × e x p { w } ,   w 0 .
Therefore,
1 α = p ( L A P I h A P I h U A P I h )
= p ( ( n h 1 ) L A P I h A P I h ( n h 1 ) A P I h A P I h ( n h 1 ) U A P I h A P I h )
= p ( ( n h 1 ) L A P I h A P I h W ( n h 1 ) U A P I h A P I h ) .
Thus,
( n h 1 ) U A P I h A P I h = G 1 α / 2 ( n h , 1 )
and
( n h 1 ) L A P I h A P I h = G α / 2 ( n h , 1 ) .
Equivalently,
L A P I h = G α / 2 ( n h , 1 ) n h 1 A P I h
and
U A P I h = G 1 α / 2 ( n h , 1 ) n h 1 A P I h ,
where G α / 2 ( n ,   1 ) is the lower α / 2 quintile of G ( n , 1 ) and G 1 α / 2 ( n ,   1 ) is the lower 1 α / 2 quintile of G ( n , 1 ) . Therefore, the confidence interval of A P I h can be shown as follows:
[ L A P I h , U A P I h ] = [ G α / 2 ( n h , 1 ) n h 1 A P I h , G 1 α / 2 ( n h , 1 ) n h 1 A P I h ] .
Let t h , 1 , , t h , j , , t h , n h be the observed values of T h , 1 , , T h , j , , T h , n h for h = 1, 2; then the observed value of A P I h is expressed as follows:
A P I h 0 = U τ h 0 ,
where τ h 0 = ( n h 1 ) 1 j = 1 n h t h , j is the observed value of τ h . Thus, the observed value of two 1 α confidence limits, L A P I h and U A P I h , can be expressed as follows:
L A P I h 0 = G α / 2 ( n h , 1 ) n h 1 A P I h 0 ;
U A P I h 0 = G 1 α / 2 ( n h , 1 ) n h 1 A P I h 0 .

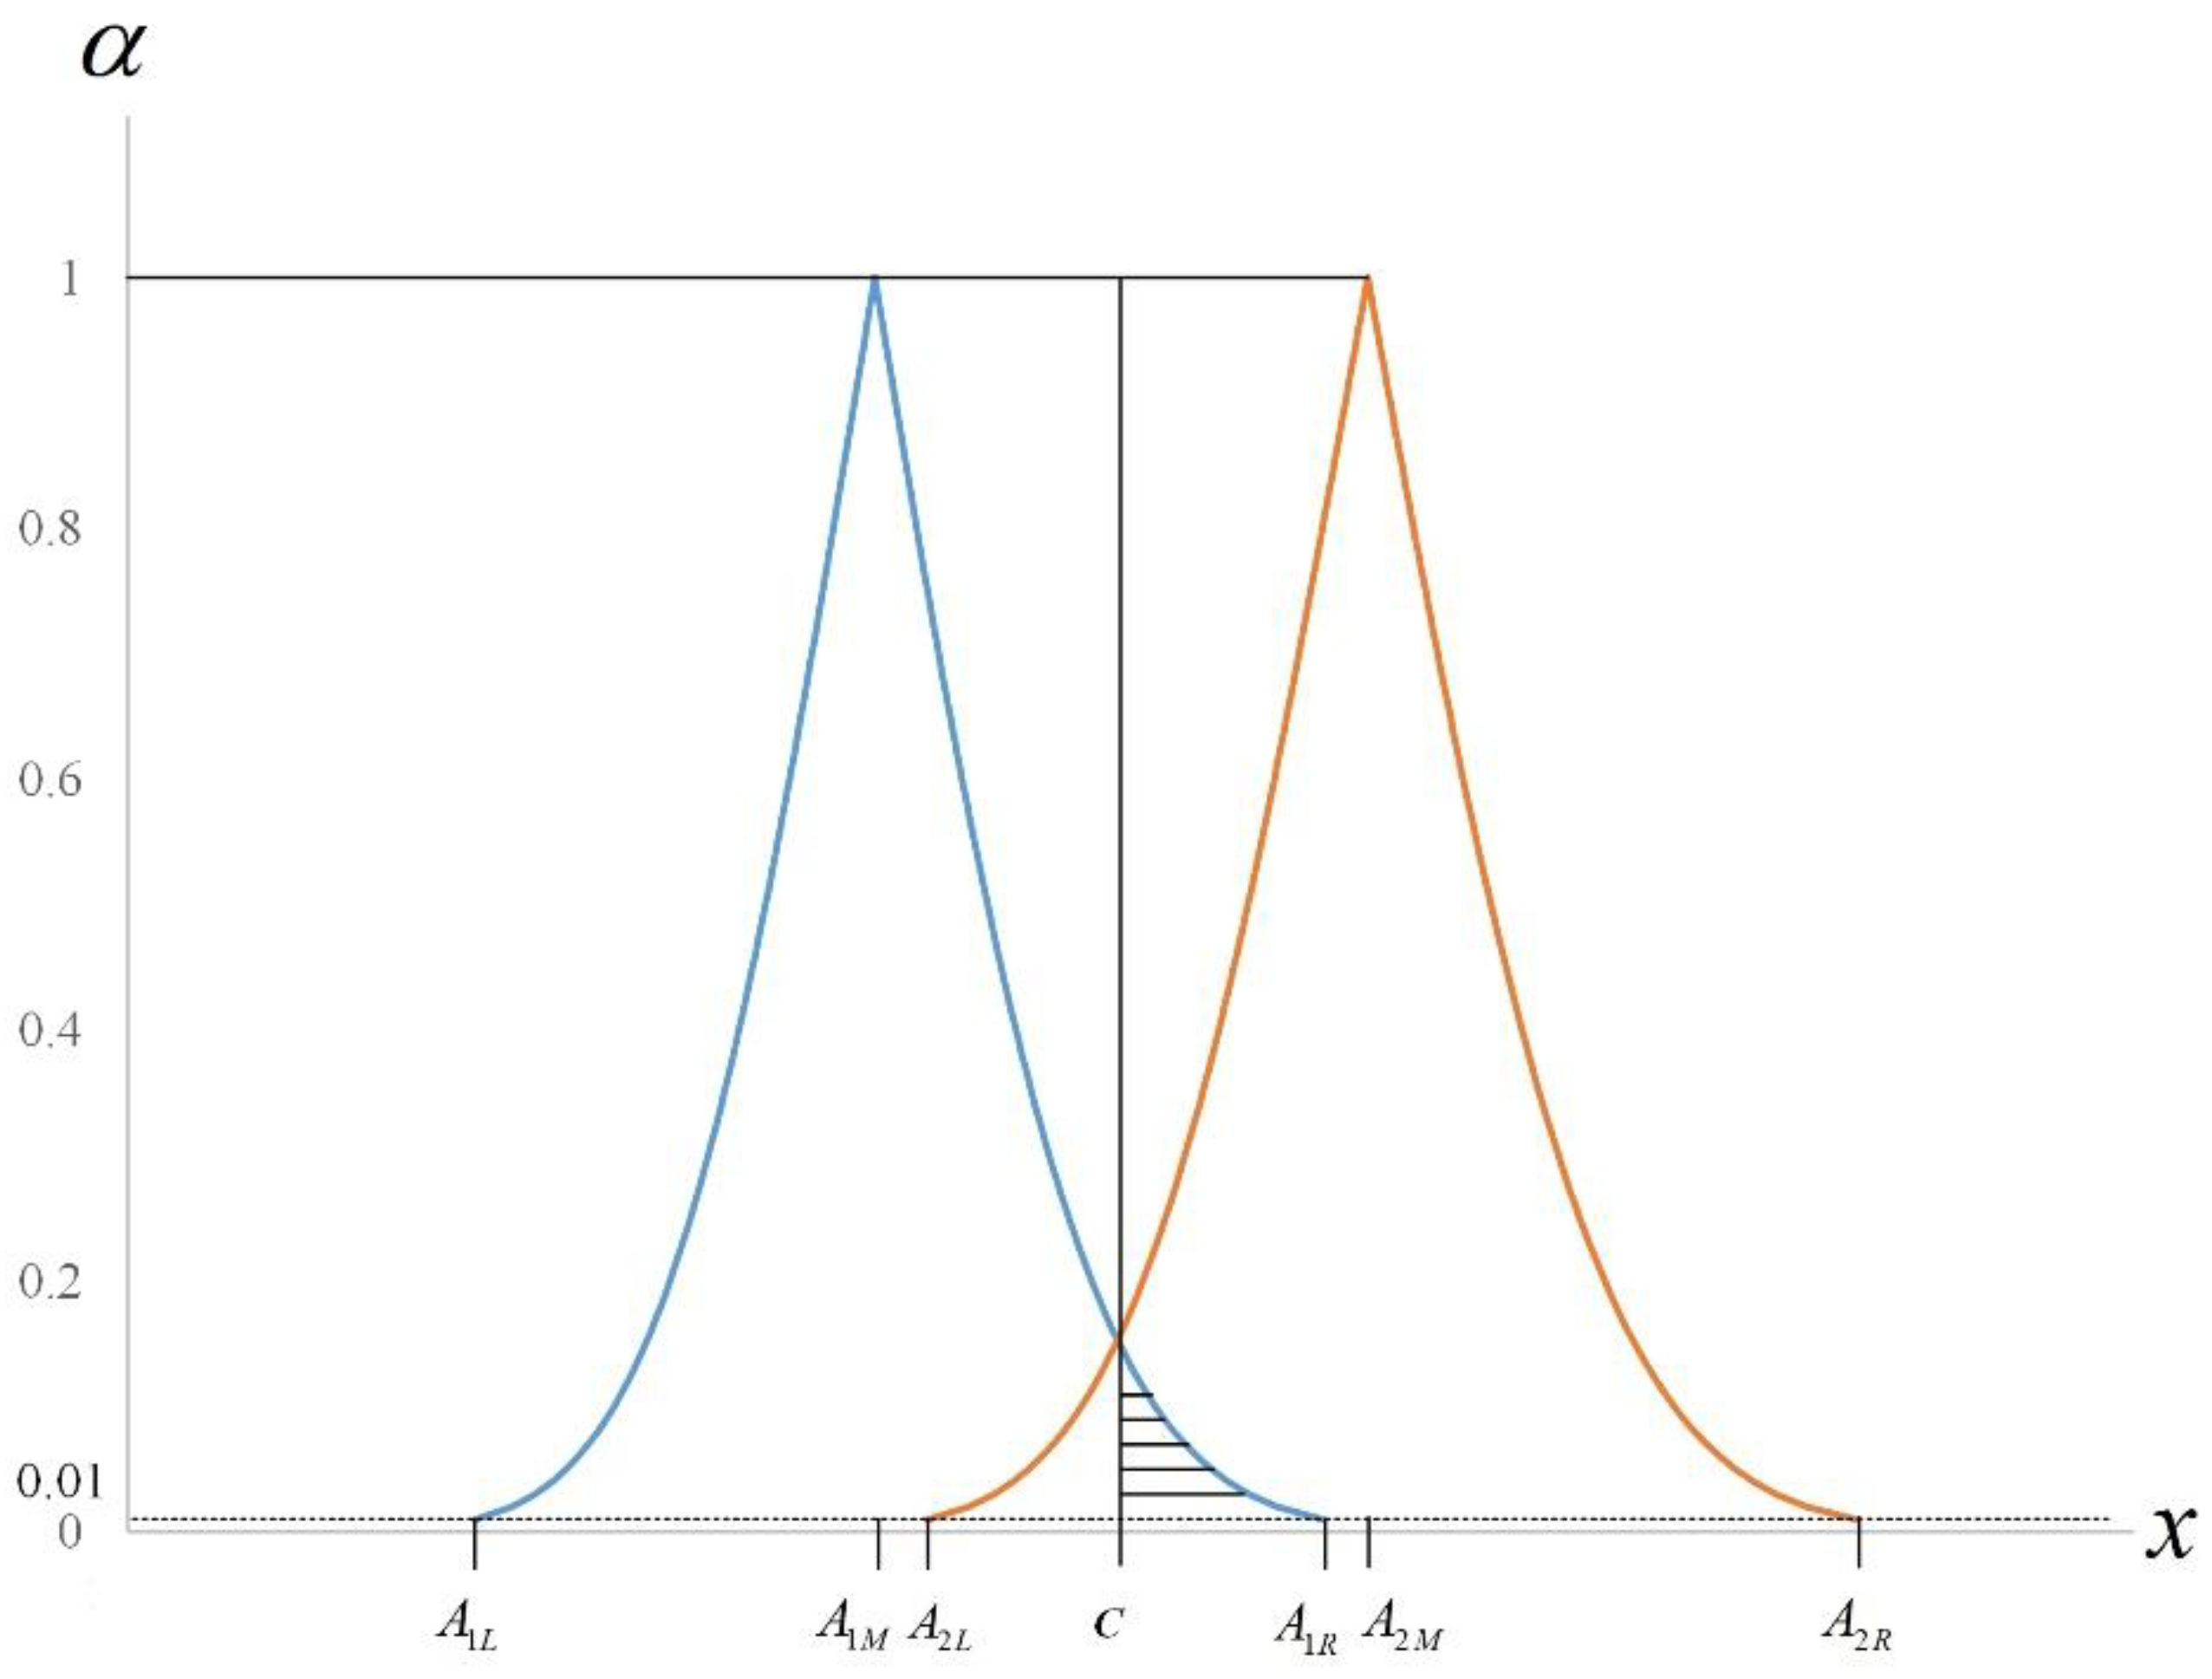
3. Fuzzy Two-Tailed Testing Model

As noted by Chen et al. [2] and Chang et al. [24], using data to develop a rapid and precise model for analysis and decision-making has become a trend of business development as the Internet of things (IoT) and Big Data analysis technology have gradually become mature and stable. Not only can the model meet the need of enterprises to pursue a rapid response, but it also can help the industry to move toward the goal of smart innovation management at the same time. Once the result of the evaluation shows that the bank APP performance does not meet the required performance level, improvement must be carried out right away. Based on the approach proposed by Chen et al. [2], we determined that the α - cuts of the triangular-shaped fuzzy number A ˜ P I h is A ˜ P I h [ α ] = [ A P I h L ( α ) , A P I h R ( α ) ] for 0.01 α 1 , where
A P I h L ( α ) = G α / 2 ( n h , 1 ) n h 1 A P I h 0 ;
A P I h R ( α ) = G 1 α / 2 ( n h , 1 ) n h 1 A P I h 0 .
We recalled that all of the α - cuts of triangular-shaped fuzzy number A ˜ P I h for 0 α 0.01 are equal to A ˜ P I h [ 0.01 ] , where
A ˜ P I h [ 0.01 ] = [ A P I h L ( 0.01 ) , A P I h R ( 0.01 ) ] .
Thus, the triangular shaped fuzzy number of A P I h is A ˜ P I h = (   A h L ,   A h M , A h R ) , where
A h L = A P I h L ( 0.01 ) = G 0.005 ( n h , 1 ) n h 1 A P I h 0 ;
A h M = A P I h L ( 0.5 ) = G 0.5 ( n h , 1 ) n h 1 A P I h 0 ;
A h R = A P I h R ( 0.01 ) = G 0.995 ( n h , 1 ) n h 1 A P I h 0 .
Furthermore, the membership function of A ˜ P I is:
η h ( x ) = { 0   i f   x < A h L α h   i f   A h L x < A h M 1   i f   x = A h M α h   i f   A h M < x A h R 0   i f   A h R < x ,
where
G α h / 2 ( n h , 1 ) = ( n h 1 ) x / A P I h 0
and
G 1 α h / 2 ( n h , 1 ) = ( n h 1 ) x / A P I h 0 .
Thus,
α h = 2 G 1 ( w , n h , 1 )
and
α h = 2 ( 1 G 1 ( w , n h , 1 ) ) ,
where w = ( n h 1 ) x / A P I h 0 is the α h quantile of G ( n h , 1 )
.
In order to confirm whether the post-improvement performance is better than the pre-improvement performance, we consider the problem of the hypothesis test, the null hypothesis H 0 : A P I 2 = A P I 1 against the alternative hypothesis H 1 : A P I 2 A P I 1 . Figure 1 is the schematic diagram of the fuzzy membership function η 1 ( x ) before improvement and the fuzzy membership function η 2 ( x ) after improvement. When the distance between the graphs of η 1 ( x ) and η 2 ( x ) is longer, the corresponding dashed area is smaller, indicating that the performance gap between pre-improvement and post-improvement is larger. Conversely, when the distance between the graphs of η 1 ( x ) and η 2 ( x ) is shorter, the corresponding dashed area is larger, showing that the performance gap between pre-improvement and post-improvement is smaller. Especially, when we have A 1 M = A 2 M , there is no significant difference between pre-improvement and post-improvement. Subsequently, this paper develops follow-up fuzzy evaluation rules based on this concept.
Let set A T 1 be the area in the graph of η 1 ( x ) , such that
A T 1 = { ( x , α ) | A P I 1 L ( α ) x A P I 1 R ( α ) , 0 α 1 } ,
where
A P I 1 L ( α ) = G α / 2 ( n 1 , 1 ) n 1 1 A P I 10 ;
A P I 1 R ( α ) = G 1 α / 2 ( n 1 , 1 ) n 1 1 A P I 10 .
Similarly, let set A T 2 be the area in the graph of η 2 ( x ) , such that
A T 2 = { ( x , α ) | A P I 2 L ( α ) x A P I 2 R ( α ) , 0 α 1 } ,
where
A P I 2 L ( α ) = G α / 2 ( n 2 , 1 ) n 2 1 A P I 20 ;
A P I 2 R ( α ) = G 1 α / 2 ( n 2 , 1 ) n 2 1 A P I 20 .
Then, this paper discussed A P I 10 A P I 20 and A P I 10 > A P I 20 respectively as follows:
(1)
When A P I 10 A P I 20 , there are two conditions: (1) A 1 R A 2 L and (2) A 1 R > A 2 L , and the value of C is defined as follows:
C = { A 1 R , A 1 R A 2 L A 1 R + A 2 L 2 , A 1 R > A 2 L .
(2)
When A P I 10 > A P I 20 , there are two conditions: (1) A 2 R > A 1 L and (2) A 2 R A 1 L , and the value of C is defined as follows:
C = { A 2 R + A 1 L 2 , A 2 R > A 1 L A 1 L , A 2 R A 1 L .
Let d T = A 1 R A 1 L , then
    d T = ( G 0.995 ( n 1 , 1 ) n 1 1 G 0.005 ( n 1 , 1 ) n 1 1 ) A P I 10 ,
and let d R = A 1 R C , then d R and d R / d T are expressed as follows:
Case 1:  A P I 10 A P I 20
d R = { 0 , A 1 R A 2 L A 1 R C , A 1 R > A 2 L ;
d R / d T = { 0 , A 1 R A 2 L ( A 1 R C ) / d T , A 1 R > A 2 L .
Case 2: A P I 1 R > A P I 2 L
d R = { A 1 R C , A 2 R > A 1 L d T , A 2 R A 1 L ;
d R / d T = { ( A 1 R C ) / d T , A 2 R > A 1 L 1 , A 2 R A 1 L .
According to Chen et al. [2], we let 0 < ϕ < 0.5, and the decision-making rules of the fuzzy two-tailed testing model are displayed below:
(1)
If d R / d T < ϕ , then reject H 0 and conclude that A P I 2 > A P I 1 , which shows significant improvement has been achieved.
(2)
If d R / d T > 1 ϕ , then reject H 0 and conclude that A P I 2 < A P I 1 , which means that the situation after improvement not only has no significant effect, but it is even worse than before, so that the operation should be reviewed and continuously improved.
(3)
If ϕ d R / d T 1 ϕ , then do not reject H 0 and conclude that A P I 2 = A P I 1 , indicating that the improvement has not received any significant outcome, so that the operation should be reviewed and continuously improved.

4. Application Example

As noted above, this paper uses an application example to demonstrate the fuzzy two-tailed testing model in this section. Then, the hypotheses for improvement and testing are described as follows:
H 0 : A P I 2 = A P I 1 ;
H 1 : A P I 2 A P I 1 .
This paper first evaluated the bank APP performance according to Chen et al. [2]. The required value of bank performance index A P I 1 was supposed to be 5; in fact, the estimated value of the index A P I 1 was only 4.29 ( A P I 0 = 4.29). Based on the evaluation rules proposed in this paper, the result of bank APP performance evaluation showed that it did not meet the requirement of the performance index value, so that it should be reviewed and improved. In practice, it is quite easy to collect the time interval data of customers’ using an APP. As long as the time difference between the time when the data collection starts and the time when the first customer goes online is t h , 1 , we have h = 1, 2, where h = 1 represents pre-improvement and h = 2 represents post-improvement. Because of τ h 0 = ( n h 1 ) 1 j = 1 n h t h , j , the time difference between the starting time and the n h customer (that is, the last online customer within a unit of time) is j = 1 n h t h , j ; therefore, the time intervals between the middle customers going online do not need to be recorded. As long as the starting time and the n h customer’s online time are calculated, the value of τ h 0 can be obtained, and then the subsequent fuzzy testing task can be completed.
According to the above statement, this paper set a unit of time as 522, used the above-mentioned evaluation data as the pre-improvement data, and presented samples of the time intervals between the accesses of customers to the APP after improvement as the post-improvement data, as follows.
Before improvement:
Sample data of the time intervals between the accesses of customers to the APP: t 1 , 1 , , t 1 , j , , t 1 , 225 ( n 1 = 225 ) and j = 1 225 t 1 , j = 521.92;
τ 10 = ( n 1 1 ) 1 j = 1 n 1 t 1 , j = ( 225 1 ) 1 j = 1 225 t 1 , j = 2.33 ;
A P I 10 = U τ 10 = 10 τ 10 = 4.29 ;
A 1 L = A P I 1 L ( 0.01 ) = G 0.005 ( n 1 , 1 ) n 1 1 A P I 10 = 188.24 224 × 4.29 = 3.61 ;
A 1 M = A P I 1 L ( 0.5 ) = G 0.5 ( n 1 , 1 ) n 1 1 A P I 10 = 224.67 224 × 4.29 = 4.30 ;
A 1 R = A P I 1 R ( 0.01 ) = G 0.995 ( n 1 , 1 ) n 1 1 A P I 10 = 265.51 224 × 4.29 = 5.08 ;
A ˜ P I 1 = ( 3.61 ,   4 . 30 ,   5.08 ) ;
η 1 ( x ) = { 0 i f   x < 3.61 α 1 i f   3.61 x < 4.30 1 i f   x = 4.30 α 1 i f   4.30 < x 5.09 0 i f   5.09 < x .
After improvement:
Sample data of the time intervals between the accesses of customers to the APP: t 2 , 1 , , t 2 , j , , t 2 , 270 ( n 2 = 270) and j = 1 270 t 2 , j = 521.86;
τ 20 = ( n 2 1 ) 1 j = 1 n 2 t 2 , j = ( 270 1 ) 1 j = 1 270 t 2 , j = 1.94 ;
A P I 20 = U τ 20 = 10 τ 20 = 5.15 ;
A 2 L = A P I 2 L ( 0.01 ) = G 0.005 ( n 2 , 1 ) n 2 1 A P I 20 = 229.55 269 ×   5.15   = 4.39 ;
A 2 M = A P I 2 L ( 0.5 ) = G 0.5 ( n 1 , 1 ) n 1 1 A P I 10 = 269.67 269 × 5.15 = 5.16 ;
A 2 R = A P I 2 R ( 0.01 ) = G 0.995 ( n 1 , 1 ) n 1 1 A P I 10 = 314.20 269 × 5.15 = 6.02 ;
A ˜ P I 1 = ( 4.39 ,   5 . 16 ,   6 . 02 ) ;
η 2 ( x ) = { 0 i f   x < 4.39 α 2 i f   4.39 x < 5.16 1 i f   x = 5.16 α 2 i f   5.16 < x 6.02 0 i f   6.02 < x .
In fact, A P I 20 = 5.15 is bigger than A P I 10 = 4.29, and A 1 R = 5.09 is bigger than A 2 L = 4.39 , then
C = A 1 R + A 2 L 2 = 5.09 + 4.39 2 = 4.74 ;
d R = A 1 R C = 5.09 4.74 = 0.35 ;
d T = A 1 R A 1 L = 5.09 3.61 = 1.48 ;
d R / d T = 0.35 / 1.48 = 0.24 .
Let ϕ = 0.25; based on the decision rules, reject H 0 and conclude that A P I 2 > A P I 1 for d R / d T < ϕ , indicating that the improvement has achieved a significant effect. According to the statistical test, since the intersection of the confidence interval of index A P I 1 and the confidence interval of index A P I 2 is not an empty set, do not reject H 0 , showing that the improvement has no significant effect. As a matter of fact, A P I 20 = 5.15 is much larger than A P I 10 = 4.29. According to the above-mentioned, it is obvious that the fuzzy test is more reasonable than the statistical test.

5. Conclusions

This paper is based on the bank APP fuzzy performance evaluation proposed by Chen et al. [2]. When the bank APP performance evaluation does not meet the requirements of performance indices, the APP must be improved. This paper proposed a model for improvement and testing so as to confirm the effect of improvement. The bank APP performance evaluation model, proposed by Chen et al. [2], was a fuzzy two-tailed testing model with a single index. This paper then proposed a fuzzy two-tailed testing model with two indices before and after improvement, not only an extension of the method but also a more complete procedure of evaluation.
In addition, the fuzzy improvement testing model developed in this paper combined with the fuzzy performance evaluation model of Chen et al. [2] formed a complete model of bank APP fuzzy performance evaluation, analysis, and improvement. Since customer time intervals were used to measure the bank APP operation performance, the time of collecting data was short. Hence, this model can help companies quickly and accurately make decisions on whether to improve as well as complete the verification of improvement effects. The advantages of this bank APP fuzzy performance evaluation, analysis and improvement model are illustrated as follows:
(1)
The fuzzy testing model was based on confidence intervals, so it can reduce the risk of misjudgment caused by sampling error.
(2)
The fuzzy testing designs built on confidence intervals can incorporate expert experience and past data so that the accuracy of testing can be maintained in the case of small-sized samples [25,26,27].
(3)
The time of data collection is short, which can help enterprises quickly grasp the opportunity for improvement and meet the need for enterprises to pursue fast and accurate decision-making.
(4)
Making good use of the fuzzy performance evaluation, analysis and improvement model [28,29] can continuously enhance the bank APP operation performance and allow users to complete banking operations without going out. Not only does the model increase the bank’s operating efficiency, but it also eases traffic congestion and parking as well as benefits energy saving and carbon reduction.
At the end of this paper, an example was presented to explain the application of the fuzzy two-tailed testing model with two indices. The three fuzzy evaluation rules stated in Section 3 and the cases discussed in Section 4 have shown that the two-tailed fuzzy test of two indicators can verify whether the performance after improvement has improved or unchanged compared with the performance before improvement. It is even likely to make the performance decline instead of improving. These three situations are relative. Thus, it is necessary to further check whether the indices are greater than the required value ( H 0 : A P I 2 > 5 ) to confirm whether the improved performance reaches the required level. This can be said to be the limitation of the two-tailed fuzzy test of the two indicators.
In addition, the use of the bank APP will be affected by the smoothness of network traffic or some kind of promotion. When the number of users is not a Poisson distribution, then the time interval will not be an exponential distribution. The above two situations are both important issues worth exploring in the future.

Author Contributions

Conceptualization, T.C. and K.-S.C.; methodology, T.C. and K.-S.C.; software, C.-M.Y.; validation, T.-H.H.; formal analysis, T.C. and K.-S.C.; resources, T.C. and T.-H.H.; data curation, T.-H.H. and C.-M.Y.; writing—original draft preparation, T.C., T.-H.H., K.-S.C., and C.-M.Y.; writing—review and editing, T.C. and K.-S.C.; visualization, C.-M.Y.; supervision, K.-S.C.; funding acquisition, T.C. and C.-M.Y.; project administration, T.C. and T.-H.H. All authors have read and agreed to the published version of the manuscript.

Funding

This work was financially supported by the Foundation of College’s Key Research base on Humanities and Social Science in Guangdong Province, China: Pearl River Delta Industrial Ecology Research Center under Grant No. 2016WZJD005; the National Natural Science Foundation of China, under Grant No. 71762008; and the Quality and Brand Development Research Center in Dongguan University of Technology under Grant No. GB200101.

Data Availability Statement

Not applicable.

Conflicts of Interest

The authors declare no conflict of interest.

References

  1. Chen, K.S.; Wang, C.H.; Tan, K.H. Developing a fuzzy green supplier selection model using Six Sigma quality indices. Int. J. Prod. Econ. 2019, 212, 1–7. [Google Scholar] [CrossRef]
  2. Chen, T.; Yang, C.M.; Chen, K.S.; Hsu, T.H. Fuzzy evaluation model of bank APP performance based on circular economy thinking. Mathematics 2021, 9, 2761. [Google Scholar] [CrossRef]
  3. Dahmani, N.; Benhida, K.; Belhadi, A.; Kamble, S.; Elfezazi, S.; Jauhar, S.K. Smart circular product design strategies towards eco-effective production systems: A lean eco-design industry 4.0 framework. J. Clean. Prod. 2021, 320, 128847. [Google Scholar] [CrossRef]
  4. Grubbström, R.W.; Tang, O. Optimal production opportunities in a remanufacturing system. Int. J. Prod. Econ. 2006, 44, 3953–3966. [Google Scholar] [CrossRef]
  5. Schultz, F.C.; Everding, S.; Pies, I. Circular supply chain governance: A qualitative-empirical study of the european polyurethane industry to facilitate functional circular supply chain management. J. Clean. Prod. 2021, 317, 128445. [Google Scholar] [CrossRef]
  6. Sudusinghe, J.I.; Seuring, S. Supply chain collaboration and sustainability performance in circular economy: A systematic literature review. Int. J. Prod. Econ. 2022, 245, 108402. [Google Scholar] [CrossRef]
  7. Yu, D.; Chen, Y. Dynamic structure and knowledge diffusion trajectory research in green supply chain. J. Intell. Fuzzy Syst. 2021, 40, 4979–4991. [Google Scholar] [CrossRef]
  8. Ahmad, S.; Wong, K.Y.; Tseng, M.L.; Wong, W.P. Sustainable product design and development: A review of tools, applications and research prospects. Resour. Conserv. Recycl. 2018, 132, 49–61. [Google Scholar] [CrossRef]
  9. Amindoust, A.; Ahmed, S.; Saghafinia, A.; Bahreininejad, A. Sustainable supplier selection: A ranking model based on fuzzy inference system. Appl. Soft Comput. 2012, 12, 1668–1677. [Google Scholar] [CrossRef]
  10. Awasthi, A.; Govindan, K.; Gold, S. Multi-tier sustainable global supplier selection using a fuzzy AHP-VIKOR based approach. Int. J. Prod. Econ. 2018, 195, 106–117. [Google Scholar] [CrossRef] [Green Version]
  11. Lin, K.P.; Yu, C.M.; Chen, K.S. Production data analysis system using novel process capability indices-based circular economy. Ind. Manag. Data Syst. 2019, 119, 1655–1668. [Google Scholar] [CrossRef]
  12. Meshram, C.; Ibrahim, R.W.; Deng, L.; Shende, S.W.; Meshram, S.G.; Barve, S.K. A robust smart card and remote user password-based authentication protocol using extended chaotic maps under smart cities environment. Soft Comput. 2021, 25, 10037–10051. [Google Scholar] [CrossRef]
  13. Shankar, A.; Tiwari, A.K.; Gupta, M. Sustainable mobile banking application: A text mining approach to explore critical success factors. J. Enterp. Inf. Manag. 2022, 35, 414–428. [Google Scholar] [CrossRef]
  14. Ngubelanga, A.; Duffett, R. Modeling mobile commerce applications’ antecedents of customer satisfaction among millennials: An extended tam perspective. Sustainability 2021, 13, 5973. [Google Scholar] [CrossRef]
  15. Nguyen-Phuoc, D.Q.; Vo, N.S.; Su, D.N.; Nguyen, V.H.; Oviedo-Trespalacios, O. What makes passengers continue using and talking positively about ride-hailing services? the role of the booking app and post-booking service quality. Transp. Res. Part A Policy Pract. 2021, 150, 367–384. [Google Scholar] [CrossRef]
  16. Wang, C.H.; Chen, K.S.; Tan, K.H. Lean Six Sigma applied to process performance and improvement model for the development of electric scooter water-cooling green motor assembly. Prod. Plan. Control 2019, 30, 400–412. [Google Scholar] [CrossRef]
  17. Chen, K.S.; Yang, C.M. Developing a performance index with a Poisson process and an exponential distribution for operations management and continuous improvement. J. Comput. Appl. Math. 2018, 343, 737–747. [Google Scholar] [CrossRef]
  18. Li, M.; Chen, K.S.; Yu, C.M.; Yang, C.M. A Fuzzy Evaluation Decision Model for the Ratio Operating Performance Index. Mathematics 2021, 9, 262. [Google Scholar] [CrossRef]
  19. Aghsami, A.; Samimi, Y.; Aghaei, A. A novel markovian queueing-inventory model with imperfect production and inspection processes: A hospital case study. Comput. Ind. Eng. 2021, 162, 107772. [Google Scholar] [CrossRef]
  20. Canbolat, P.G. Bounded rationality in clearing service systems. Eur. J. Oper. Res. 2020, 282, 614–626. [Google Scholar] [CrossRef]
  21. Manou, A.; Canbolat, P.G.; Karaesmen, F. Pricing in a transportation station with strategic customers. Prod. Oper. Manag. 2017, 26, 1632–1645. [Google Scholar] [CrossRef]
  22. Chen, K.S. Two-tailed Buckley fuzzy testing for operating performance index. J. Comput Appl Math. 2019, 361, 55–63. [Google Scholar] [CrossRef]
  23. Chen, K.S. Fuzzy testing of operating performance index based on confidence intervals. Ann. Oper. Res. 2022, 311, 19–33. [Google Scholar] [CrossRef]
  24. Chang, K.H.; Sun, Y.J.; Lai, C.A.; Chen, L.D.; Wang, C.H.; Chen, C.J.; Lin, C.M. Big data analytics energy-saving strategies for air compressors in the semiconductor industry–an empirical study. Int. J. Prod. Res. 2021, 60, 1782–1794. [Google Scholar] [CrossRef]
  25. Winanda, L.A.R.; Arifin, A.; Adi, T.W.; Arrofiqi, F.; Anwar, N. Development of fuzzy decision support system for accident prevention based on worker conditions and project environments. J. Theor. Appl. Inf. Technol. 2020, 98, 4044–4060. [Google Scholar]
  26. Salmi, K.; Magrez, H.; Ziyyat, A. A novel expert evaluation methodology based on fuzzy logic. Int. J. Emerg. Technol. Learn. 2019, 14, 160–173. [Google Scholar] [CrossRef] [Green Version]
  27. Sabbaghi, A.; Keyvanpour, M.R.; Parsa, S. FCCI: A fuzzy expert system for identifying coincidental correct test cases. J. Syst. Softw. 2020, 168, 110635. [Google Scholar] [CrossRef]
  28. Roy, P.K.; Shaw, K. An integrated fuzzy model for evaluation and selection of mobile banking (m-banking) applications using new fuzzy-BWM and fuzzy-TOPSIS. Complex Intell. Syst. 2021. [Google Scholar] [CrossRef]
  29. Reig-Mullor, J.; Brotons-Martinez, J.M. The evaluation performance for commercial banks by intuitionistic fuzzy numbers: The case of Spain. Soft Comput. 2021, 25, 9061–9075. [Google Scholar] [CrossRef]
Figure 1. Schematic diagram of fuzzy membership function η 1 ( x ) before improvement and fuzzy membership function η 2 ( x ) after improvement.
Mathematics 10 01409 g001
Publisher’s Note: MDPI stays neutral with regard to jurisdictional claims in published maps and institutional affiliations.

