Article

Investigation of Terrorist Organizations Using Intelligent Tools: A Dynamic Network Analysis with Weighted Links

by
Alexandros Z. Spyropoulos
1,
Charalampos Bratsas
2,
Georgios C. Makris
2,
Evangelos Ioannidis
2,
Vassilis Tsiantos
1 and
Ioannis Antoniou
2,*
1
Department of Physics, School of Science, Kavala’s Campus, International Hellenic University (IHU), 57001 Thessaloniki, Greece
2
Department of Mathematics, Aristotle University of Thessaloniki (AUTH), 54124 Thessaloniki, Greece
*
Author to whom correspondence should be addressed.
Mathematics 2022, 10(7), 1092; https://doi.org/10.3390/math10071092
Submission received: 22 February 2022 / Revised: 11 March 2022 / Accepted: 25 March 2022 / Published: 28 March 2022
(This article belongs to the Special Issue Complex Network Modeling: Theory and Applications)

Abstract

:
Law enforcement authorities deal with terrorism in two ways: prevention and legal procedures to establish the offence of forming a terrorist organization. Setting up the offence of a terrorist organization requires proof that the members of the organization acquire distinct roles in the organization. Until today, this procedure has been based on unreliable, biased or subjective witness statements, resulting in questionable criminal court proceedings. A quantitative, unbiased methodology based on Network Theory is proposed in order to address three research questions: “How can the presence of distinct roles among the members of a terrorist organization be revealed?”, “Is the presence of distinct roles related to terrorist activity?”and “Are there early signs of imminent terrorist activity?”. These questions are addressed using selected global indices from network theory: density, small worldness, centralization, average centrality and standard deviation of centrality. These indices are computed for four real networks of terrorist organizations from four different countries.

1. Introduction

The law enforcement authorities (police/judicial) responsible for investigating, tracing, arresting and judging members of terrorist organizations support the existence of a structure among the members of the organization in witness statements [1]. The defenders of those arrested in court characterize these statements as unreliable, biased or subjective [1]. Thus, there seems to be a need to propose a procedure based on reliable, unbiased and objective tools that indicate the presence of distinct roles between the members of a group carrying out terrorist acts. The distinct roles together are manifestations of an internal structure of terrorist organizations.
The confirmation of the presence of distinct roles among the members of an organization is one of the four necessary conditions for a group of people to be considered as a terrorist organization, as adopted by the member states of the European Union [2,3]. This common legal framework provides four conditions for establishing criminal organizations of individuals: (1) Three or more individuals joining the association. (2) The association of persons must have a structure, some hierarchy and distinct roles for individuals. Some are leaders; others are team leaders; others are members of operating teams. (3) The organization is carrying out criminal acts punishable by prison sentences. (4) The criminal activity has a long enough duration.
Law enforcement authorities can easily identify the commission of specific criminal acts (condition 3), identify the presence of associations between persons (condition 1), as well as monitor the development of delinquent behavior in time (condition 4). On the contrary, it is usually very difficult to confirm the presence of roles of individuals in a criminal association (condition 2) [1].
In recent years, mathematical tools have been used by law enforcement authorities in order to support the reliability of forensic investigations [4,5,6,7,8]. Network theory has been recently used for the identification of distinct roles of members of terrorist organizations [9,10,11,12,13,14,15,16,17,18,19,20,21,22]. The main results are based on typical local statistical indicators known as centralities, pointing out the importance of each node based on the relations with the other nodes of the network (graph topology) [9,10,13,14,15,23,24,25]. There are more than 100 roles that can be highlighted by centralities. Important and useful for law enforcement authorities are the local properties degree and betweenness.
Degree centrality gives the number of links of each node [10,26]. The degree centrality of each node κ in a network of N nodes is given by the formula D E G κ = λ = 1 N a κ λ N 1 , where a κ λ is the κ λ –element of the adjacency matrix of the network [13,20,22,27]. In the case of weighted networks, the weighted degree is known as strength: D E G κ w = λ = 1 N w κ λ N 1 . In physical contact networks, the high-degree nodes are highly participatory and useful in local activities [25].
Betweenness centrality demonstrates the importance of a node as a mediator in the paths connecting different nodes in the network [10,26,28]. The betweenness centrality of each node κ is given by the formula   B κ = 1 N 1 N 2 λ , μ = 1 λ μ κ Ν σ λ κ μ σ λ μ , where σ λ μ is the number of paths connecting nodes λ and μ , and σ λ κ μ is the number of paths connecting nodes λ and μ and passing through the node κ . The computation of betweenness centrality in weighted networks is computed with appropriate modification [28]. In physical contact networks, the nodes with high betweenness are effective mediators serving as liaison officers, connecting and coordinating together different nodes of the network [25].
The nodes of a terrorist network are the members of the organization, and the links among the nodes are defined by the confirmed contacts among the members. The contacts are confirmed either by telecommunications or physical contacts [26,29]. More specifically, when the members of the organization communicate with each other using telephones or generally electronic means, a weighted and directed network is formed [10,21,30,31]. The direction of telecommunication networks is defined by who the calling party is and who is the receiver, while the weight is assessed from the number of communications. Directed weight 5 from node A to node B means A calls B five times [10,21,30,31]. Physical contact networks are weighted but not directed. Undirected weight 5 means A and B meet 5 times [9,10,15,32]. Physical contact networks are considered as more reliable compared to telecommunications networks for inferring the roles of the members of a criminal organization [26,29].
Statistical indicators for confirming the presence of distinct roles of members of social networks are well-known from network theory and are generically called centralities [9,10,20,21,22,27,32,33,34]. Centralities have been confirmed as reliable indicators of the roles of members of terrorist organizations [9,10,11,12,13,14,15,16,17,18,19,20,21,22]. Individuals (nodes) with high centrality have pronounced roles in the network functionality. More specifically, nodes with a high degree of centrality are participators with many direct contacts, while nodes with high betweenness centrality are mediators [25]. The presence of distinct roles for the members of an organization (condition 2 for establishing criminal organization) as participators and/or mediators is revealed by the values of the corresponding centralities.
However, the presence of roles of nodes alone does not indicate whether distinct roles emerge. Are there signs of the presence of distinct roles in terrorist networks in terms of the values of global indicators? This would have profound procedural impact, as it offers law enforcement authorities the option to assess quantitatively the presence of distinct roles, and therefore an internal structure (legal condition 2 above).
In addition, the temporal analysis of networks may reveal whether the emergence of distinct roles is related to the terrorist activity of the organization [35,36].
In this work, four different terrorist organizations, constructed from physical contacts, are analyzed. The corresponding networks are undirected by construction. The analysis is performed in terms of five global indicators, namely: (i) density, indicating whether the network is dense or sparse, (ii) small worldness, indicating whether the network is a microcosm, i.e., whether there are communication shortcuts among the members of the network; (iii) centralizations, indicating how central the most central node is, in relation to how central all the other nodes are. In particular, degree centralization and betweenness centralization are investigated; (iv) Average degree centrality and average betweenness centrality; (v) Standard deviation of degree centrality and standard deviation of betweenness centrality [20,21,22].
The significance of the five global indicators for the analysis of terrorist networks is the following: (i) Networks with high density are characterized by a large number of direct physical contacts, while a low density indicates sparse direct physical contacts; (ii) Small world networks have small average communication pathways. Therefore, high values of small worldness indicate the presence of many short communication pathways, usually through shortcuts, while low values indicate that most nodes are separated by large communication pathways; (iii) High centralizations indicate the presence of distinct dominant members with respect to the local feature of interest, while low centralizations indicate the absence of dominant members. High-degree centralization is a manifestation of distinct dominant participators, and high betweenness centralization indicates distinct dominant mediators; (iv) High average degree centrality indicates that most members are strongly connected locally, and low values indicate that the neighborhoods of most members are poorly connected. High average betweenness centrality indicates that most members are effective mediators and low values indicate that most members do not serve as mediators; (v) Standard deviation indicates the average deviation from the average. A high standard deviation of degree centrality indicates the presence of many members with degrees very different from the average degree, and low values indicate that the centrality of most members is very close to the average degree. A high standard deviation of betweenness centrality indicates that the ability for participation of most members is not close to the average ability for participation, and low values indicate that most members have more or less the same ability to act as participators, equal to the average betweenness centrality.
In summary, this work tries to answer the following questions:
Q1:
“How can the presence of distinct roles among the members of a terrorist organization be revealed, using global network indices?”
Q2:
“Is the presence of distinct roles related to terrorist activity?”
Q3:
“Are there early signs of imminent terrorist activity expressed in terms of network indices?”
The research methodology (selected indicators) and the datasets are presented in Section 2. The results and discussion are presented in Section 3 and Section 4. All five indicators are selected in order to highlight the distribution of roles in the network. The conclusions are that Q1 has been addressed mainly by degree centralization and betweenness centralization, Q2 has been addressed by all five indicators and Q3 has been addressed only by betweenness centralization. The proposals for law enforcement authorities are discussed in the conclusion.

2. Methodology and Datasets

The research questions Q1, Q2 and Q3 are addressed in terms of five selected global indicators (density, small worldness, degree centralization, average degree centrality and standard deviation, betweenness centralization, average betweenness centrality and standard deviation), computed for four real terrorist networks from four different countries. The temporal development of the selected global indices addresses question Q1. The monitoring of the fluctuations of the indices in time, compared to the recorded activity of terrorist organizations, addresses question Q2. Combining the answers to Q1 and Q2 gives the option of drawing conclusions regarding question Q3.

2.1. Global Indices

The global indices of a network result from the network geometry of interconnections, and reveal the overall features and qualities of the network [20,21,22].

2.1.1. Density

The density of a network is the ratio of the size (number of edges the network) over the maximal possible number of edges, with range (0,1). The density of an undirected network with N nodes of size E is: 2 E N N 1 [37,38].

2.1.2. Small Worldness

Small worlds are networks lying between regular and random networks. The nodes of regular networks have the same degree, while the degree is distributed randomly in so-called Erdős–Rényi or random networks [20,21,22,39]. Small worlds have small average path lengths and high clustering coefficients compared to those of the corresponding random network, so most nodes can be reached from every other node by a small number of edges. The clustering coefficient of a node [22], also known as the neighborhood density of the node, indicates the extent to which its first neighbors are linked to each other. The clustering coefficient of node κ is calculated by the formula c l u κ = 2 E κ   v κ v κ 1 , where E κ is the number of links among the first neighbors of node κ and v κ is the number of first neighbors of node κ. The average clustering coefficient of the network is: c l u ¯ = κ = 1 N c l u κ N .
The small worldness of the network is assessed by the global index:
S W = c l u ¯ c l u ¯ E R d ¯ d ¯ E R
where c l u ¯ E R is the average clustering of the corresponding Erdős–Rényi network, d ¯ is the average distance (minimal path length) of the network and d ¯ E R is the average distance of the corresponding Erdős–Rényi network. If S W > 1 then the network is small world [39].

2.1.3. Centralizations

Centralization was introduced by Freeman [10] as the degree to which the centrality of the most central node exceeds the centrality of all other nodes [10,15,28,40].
Degree centralization is defined as DEG = κ = 1 N max ν = 1 , 2 , , N DEG ν DEG κ N 2 [41], where DEG ν is the degree centrality of the node ν, ν = 1, 2, …, Ν.
Betweenness centralization is defined as B = κ = 1 N max ν = 1 , 2 , , Ν B ν B κ N 1 [42], where B κ is the betweenness centrality of node κ.

2.1.4. Average Centralities

The average degree centrality is defined as DEG ¯ = κ = 1 Ν DEG κ N .
The average betweenness centrality is defined as B ¯ = κ = 1 Ν B κ N [20,21,22].

2.1.5. Standard Deviations of Centralities

The standard deviation of degree centrality is defined as σ DEG = κ = 1 Ν DEG κ DEG ¯ 2 N .
The standard deviation of betweenness centrality is defined as σ B = κ = 1 Ν B κ B ¯ 2 N [20,21,22].

2.2. Datasets

Searching for data in the field of terrorism is a particularly difficult process. Police services rarely record data in a way that is usable by academic research, and when they do, it is usually classified. Data from two free-access databases are used, namely, the John Jay & ARTIS Transnational Terrorism Database (JJATT) [43] and the Center for Computational Analysis of Social and Organizational Systems (CASOS) at Carnegie Mellon University [44].
The data show four different terrorist organizations from different states and share the following common characteristics: (a) the motives of the members were around radicalized Islam, (b) they were active from the mid19-80s to the middle of the 2000s, (c) hey depict networks of physical contacts, and (d) the data are recorded in time. The data are provided by the codification of the names of the members of the organizations. The correspondence of the code numbers to real names is unknown to the researchers.
The first organization is the “Jamaah Islamiah Section of Indonesia” [45], which was monitored by the Indonesian police from 1985 to 2007 [46]. Its most significant act of terrorism occurred in the year 2004, when it carried out a major bombing of the Australian embassy in Jakarta with numerous wounded and dead [47]. The data depict 27 members of the organization in 11 time periods [45].
The second organization is the “Hamburg Cell”, which was monitored by American and German security services from 1985 to 2006. [48]. The members of this organization appear to have played an important role in the terrorist act of 9/11 [49]. The data depict 34 members of the organization in 15 time periods [48].
The third organization is the “Al-Qaeda Section of Madrid”, which was monitored by the Spanish security authorities from 1985 to 2006 [50]. The largest strike of the organization was carried out in 2003, when an explosive device was detonated on a train, with numerous dead and injured [51]. The data depict 54 members of the organization in 14 time periods [50].
The fourth organization is the “Jamaah Islamiah Section of Philippines”, which was monitored by security authorities in the Philippines from 1985 to 2006 [52]. The organization was very active with many bombings, and with the largest of them taking place in 2000 [53]. It is interesting that in 2005, it also attempted to carry out a serious terrorist attack again, but this was prevented by the timely intervention of the security authorities [53]. The data show 16 members of the organization in 14 consecutive time periods [52].

3. Results

The following results were obtained from the analysis of the above data in terms of the five global network indicators, namely, density, small worldness, degree centralization and betweenness centralization, average degree centrality and average betweenness centrality, standard deviation of degree centrality and standard deviation of betweenness centrality. We developed the relevant software in C++.
The results of the calculations are presented in Section 3.1 and the visual representation of the overall networks in Section 3.2. The temporal developments of density and small worldness are shown in Section 3.3, centralizations in Section 3.4, average centralities in Section 3.5 and standard deviations in Section 3.6.

3.1. Results of the Calculations

The results of the calculations of the density, small worldness, centralizations, average centralities and standard deviation of centralities are presented in the Supplementary Materials due to their large size. The calculations of the relevant local indicators (degree centrality, betweenness centrality) for each node are also included in the Supplementary Materials. The network analysis in terms of these local indicators together with the clustering coefficient has already been discussed [25].

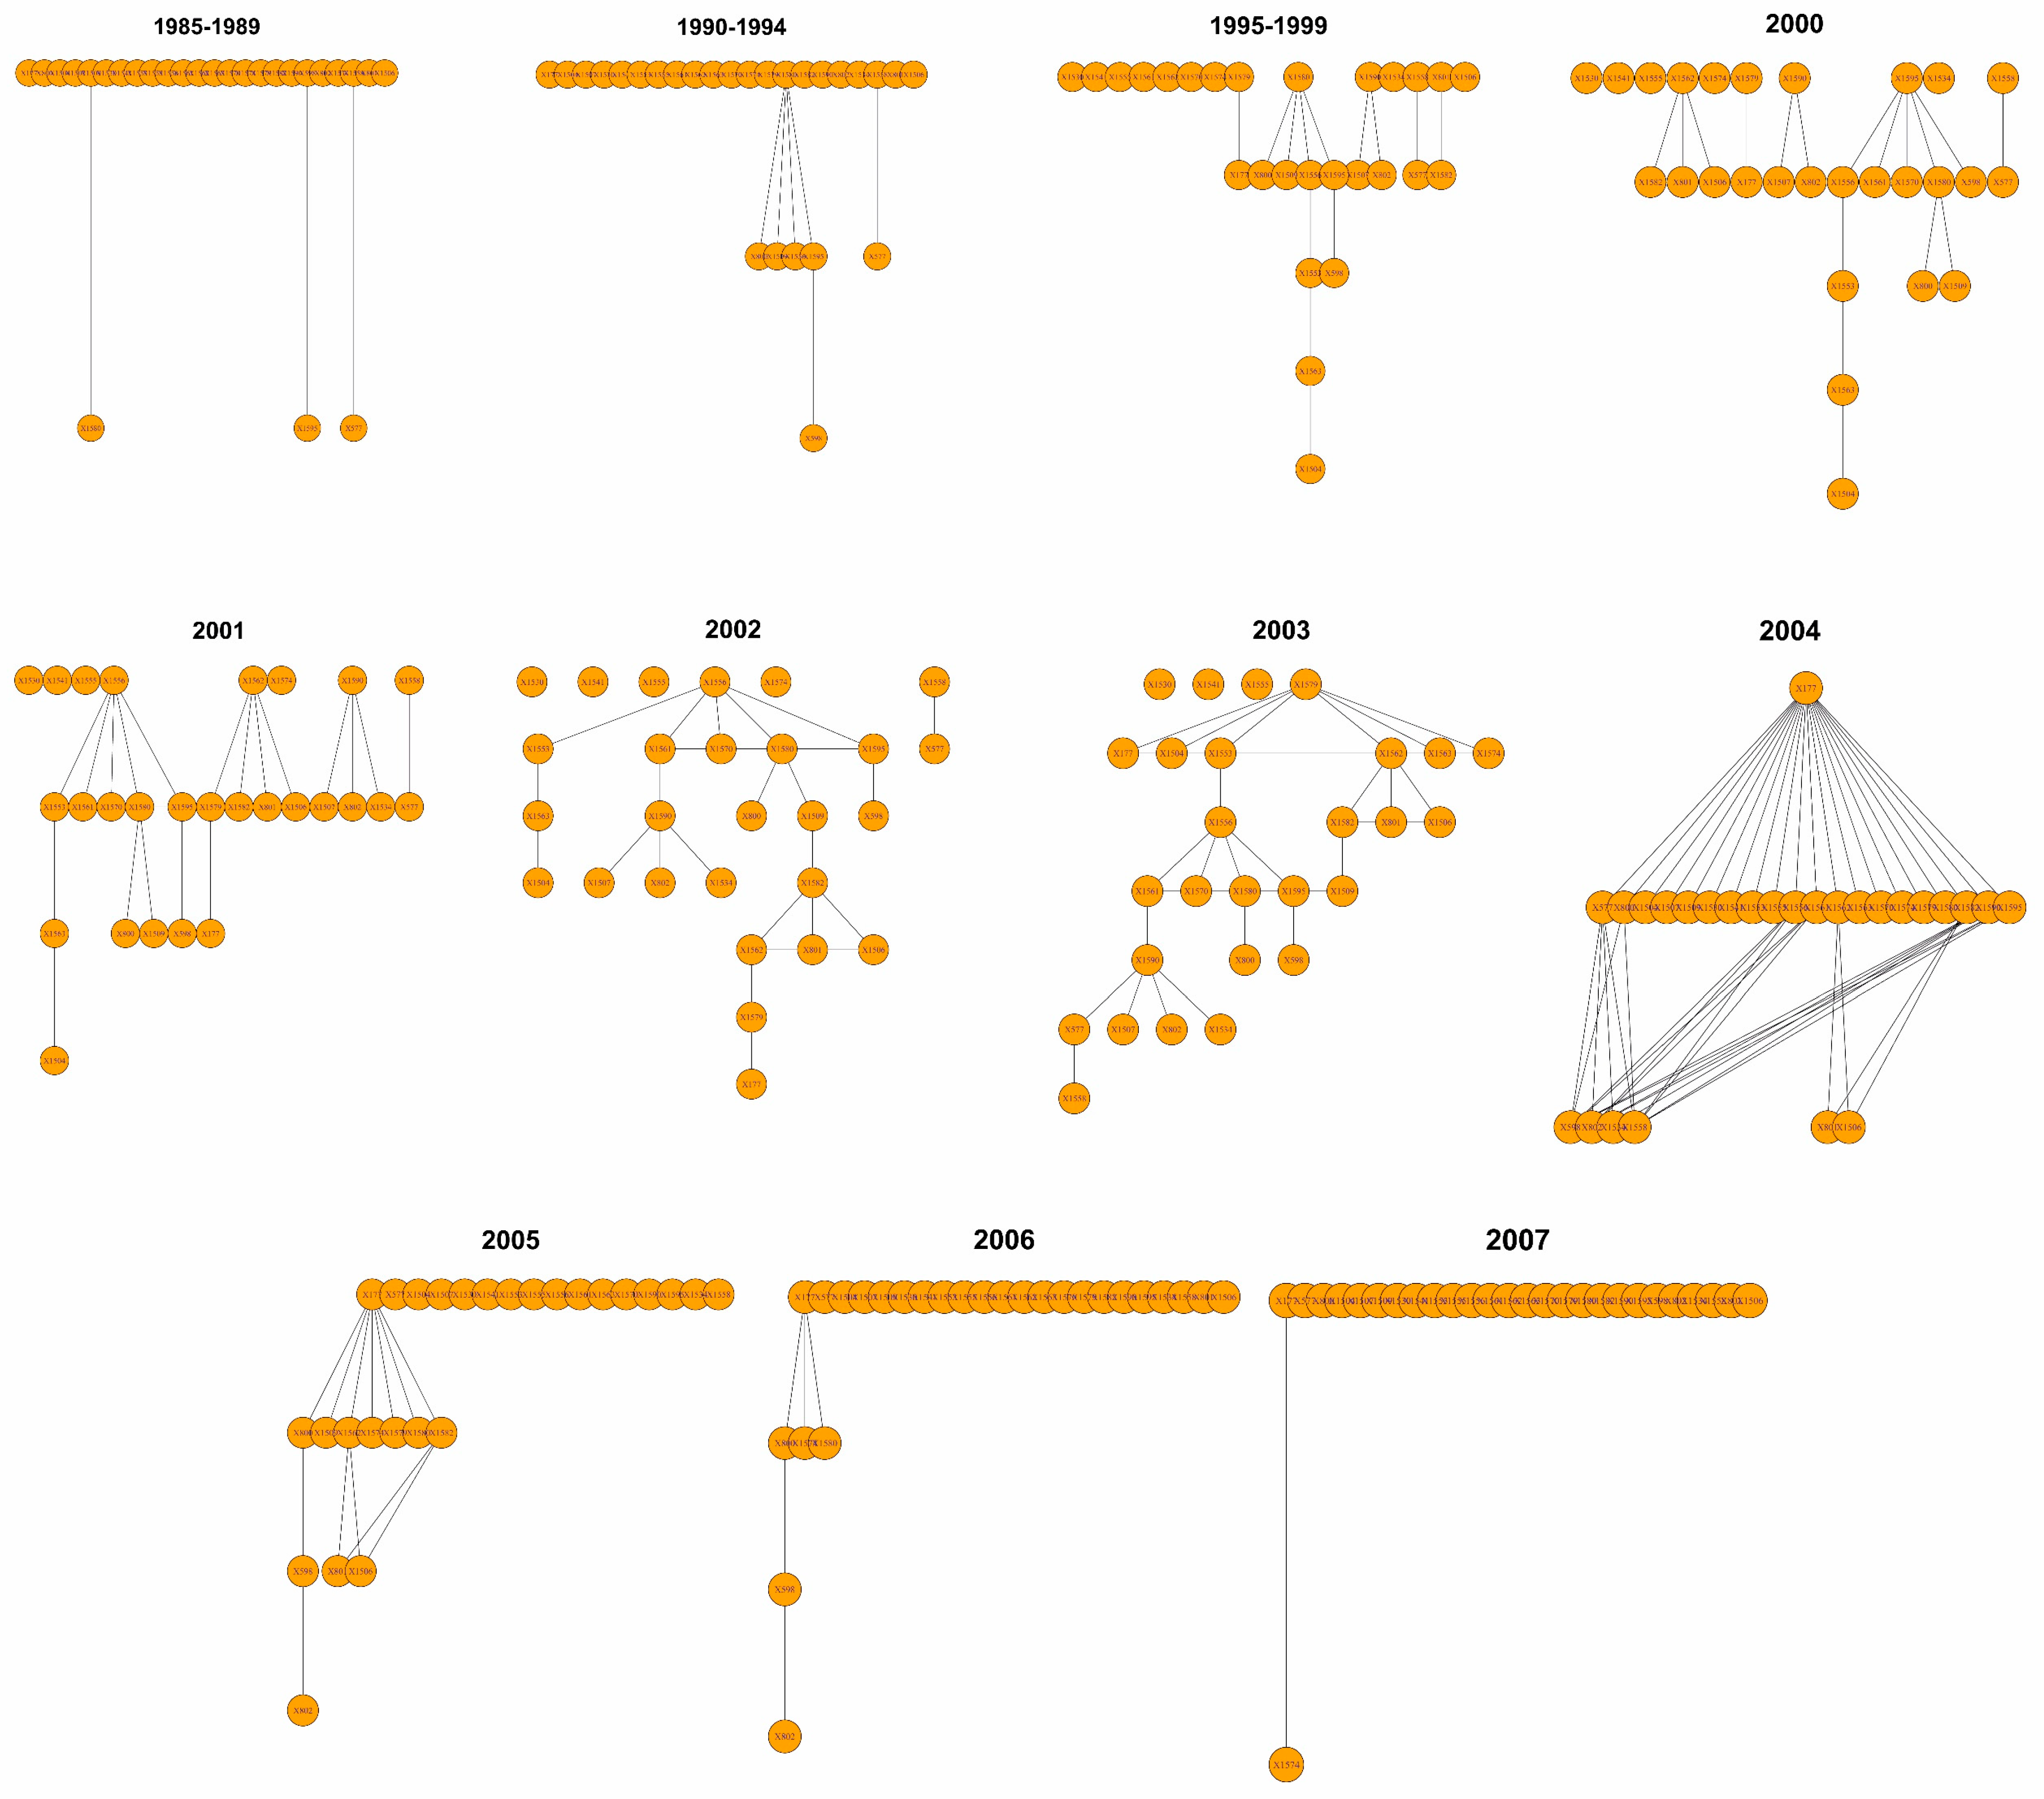
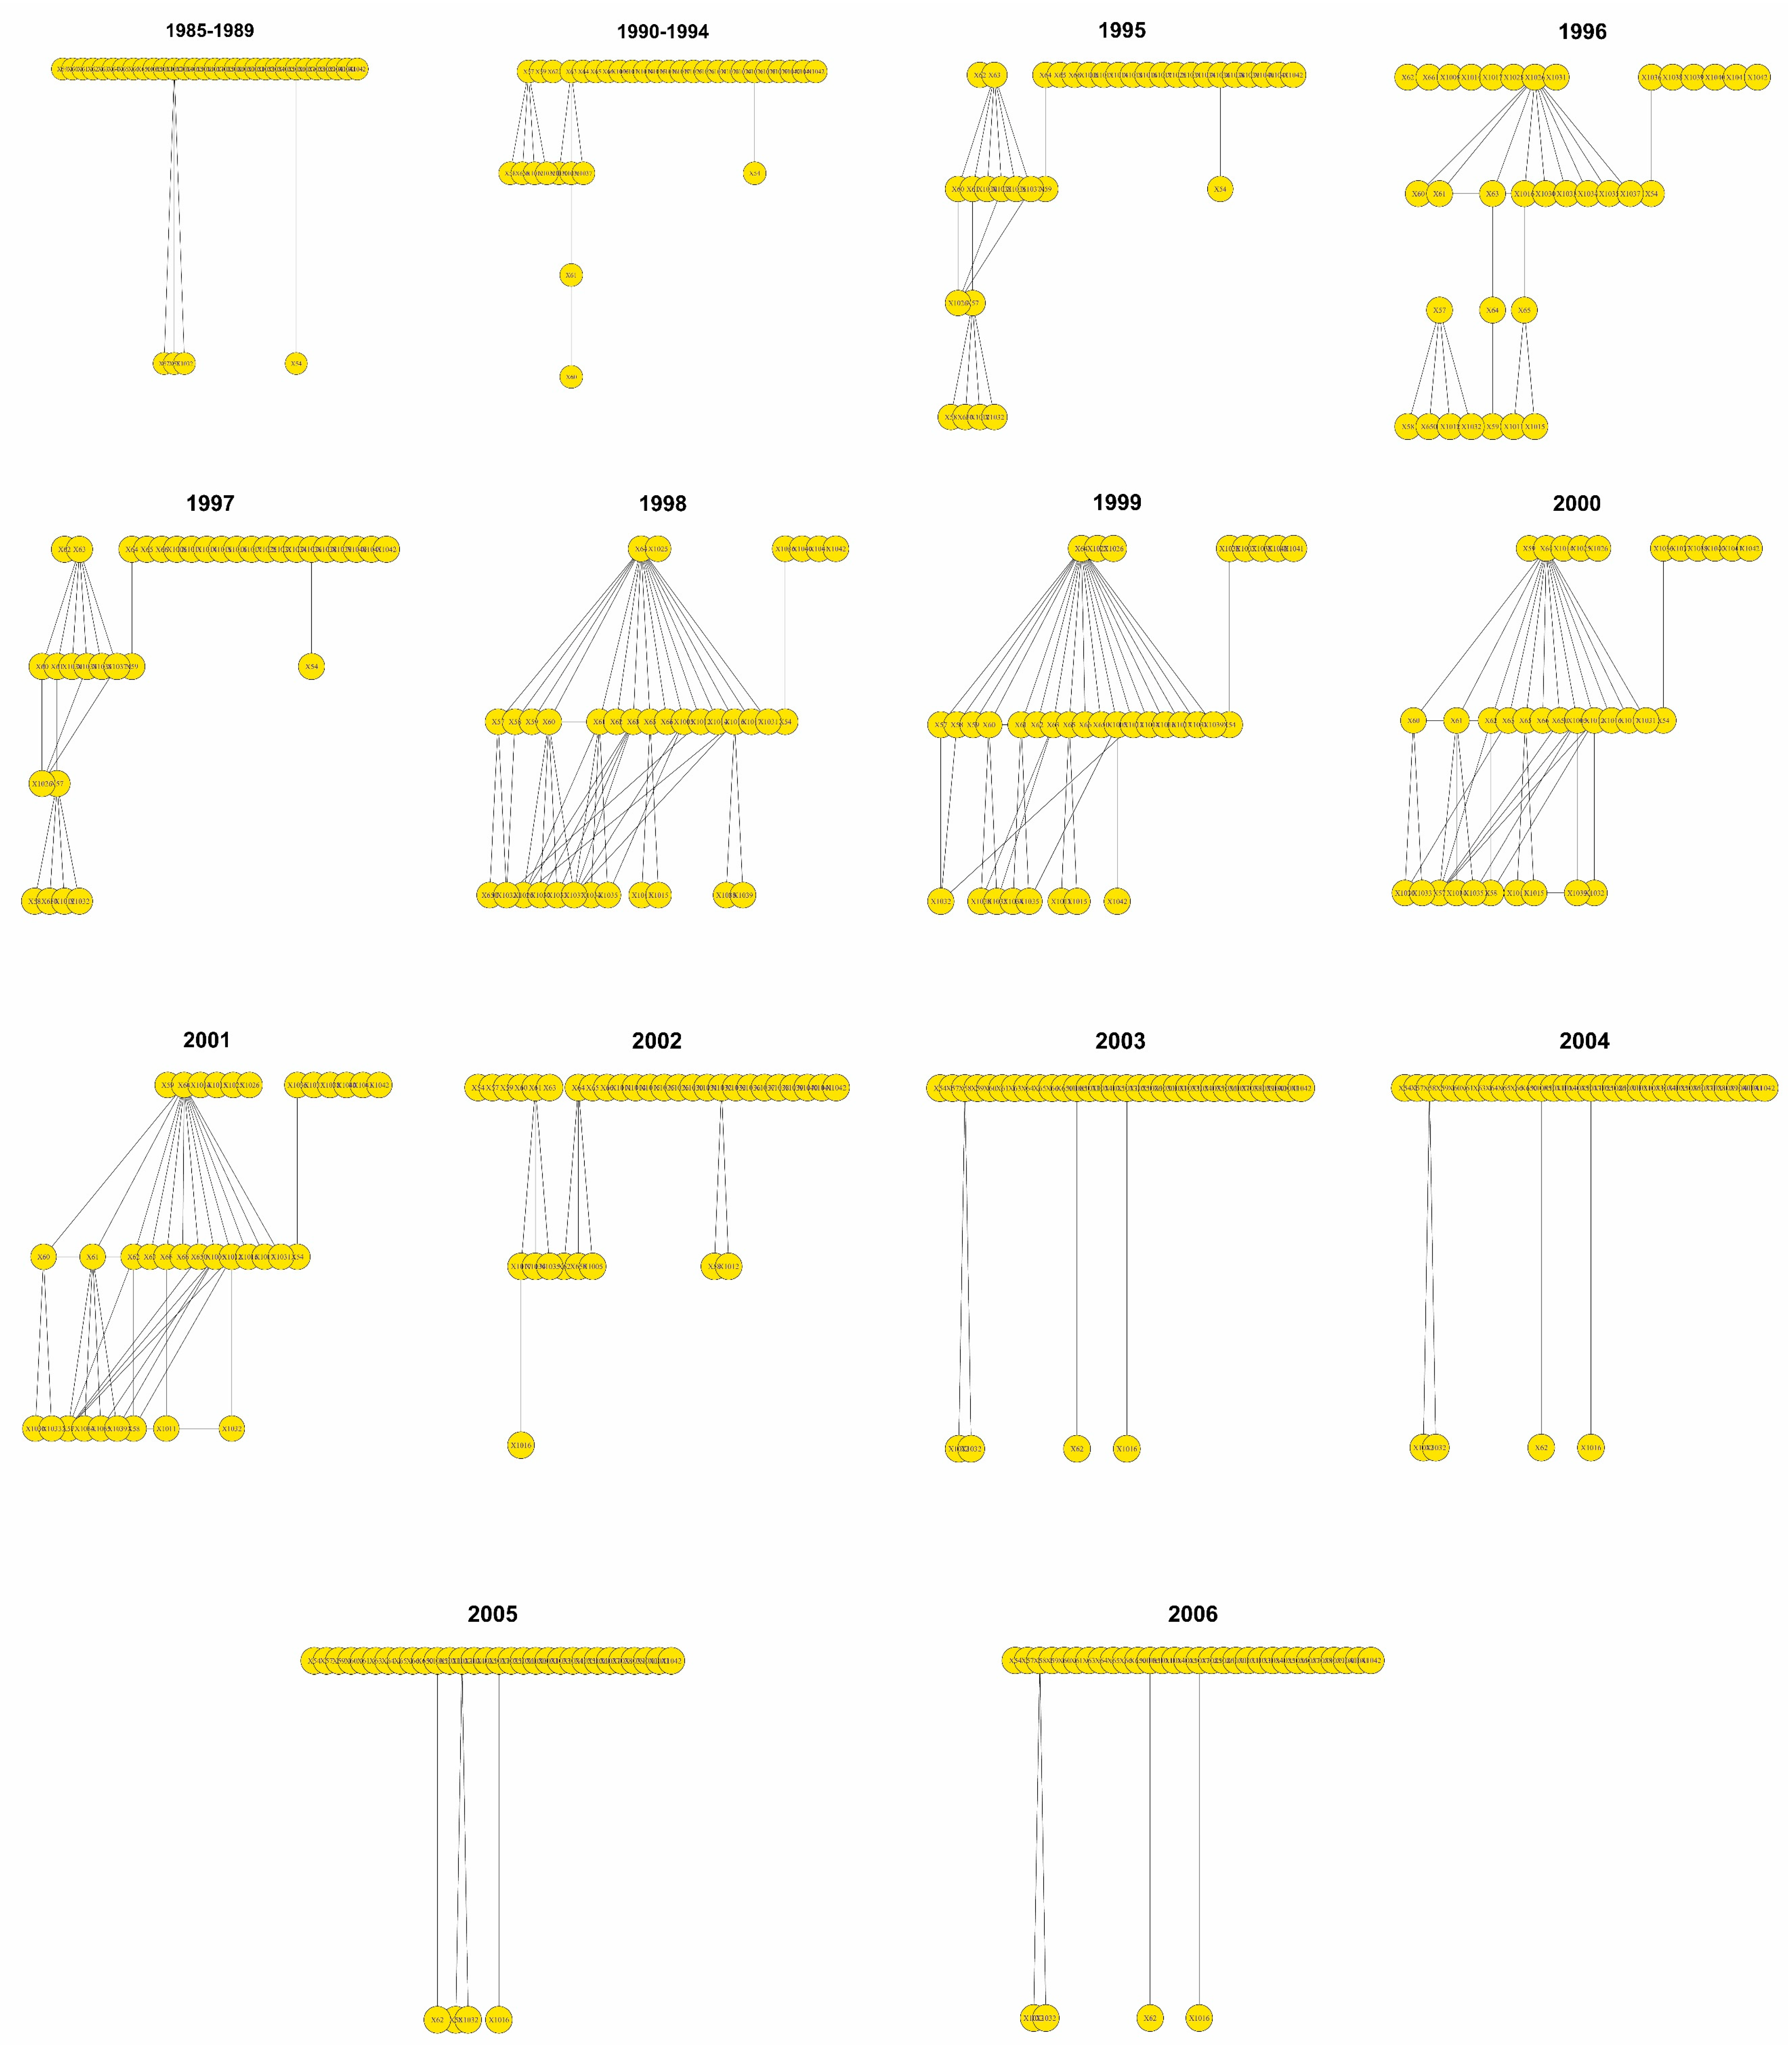
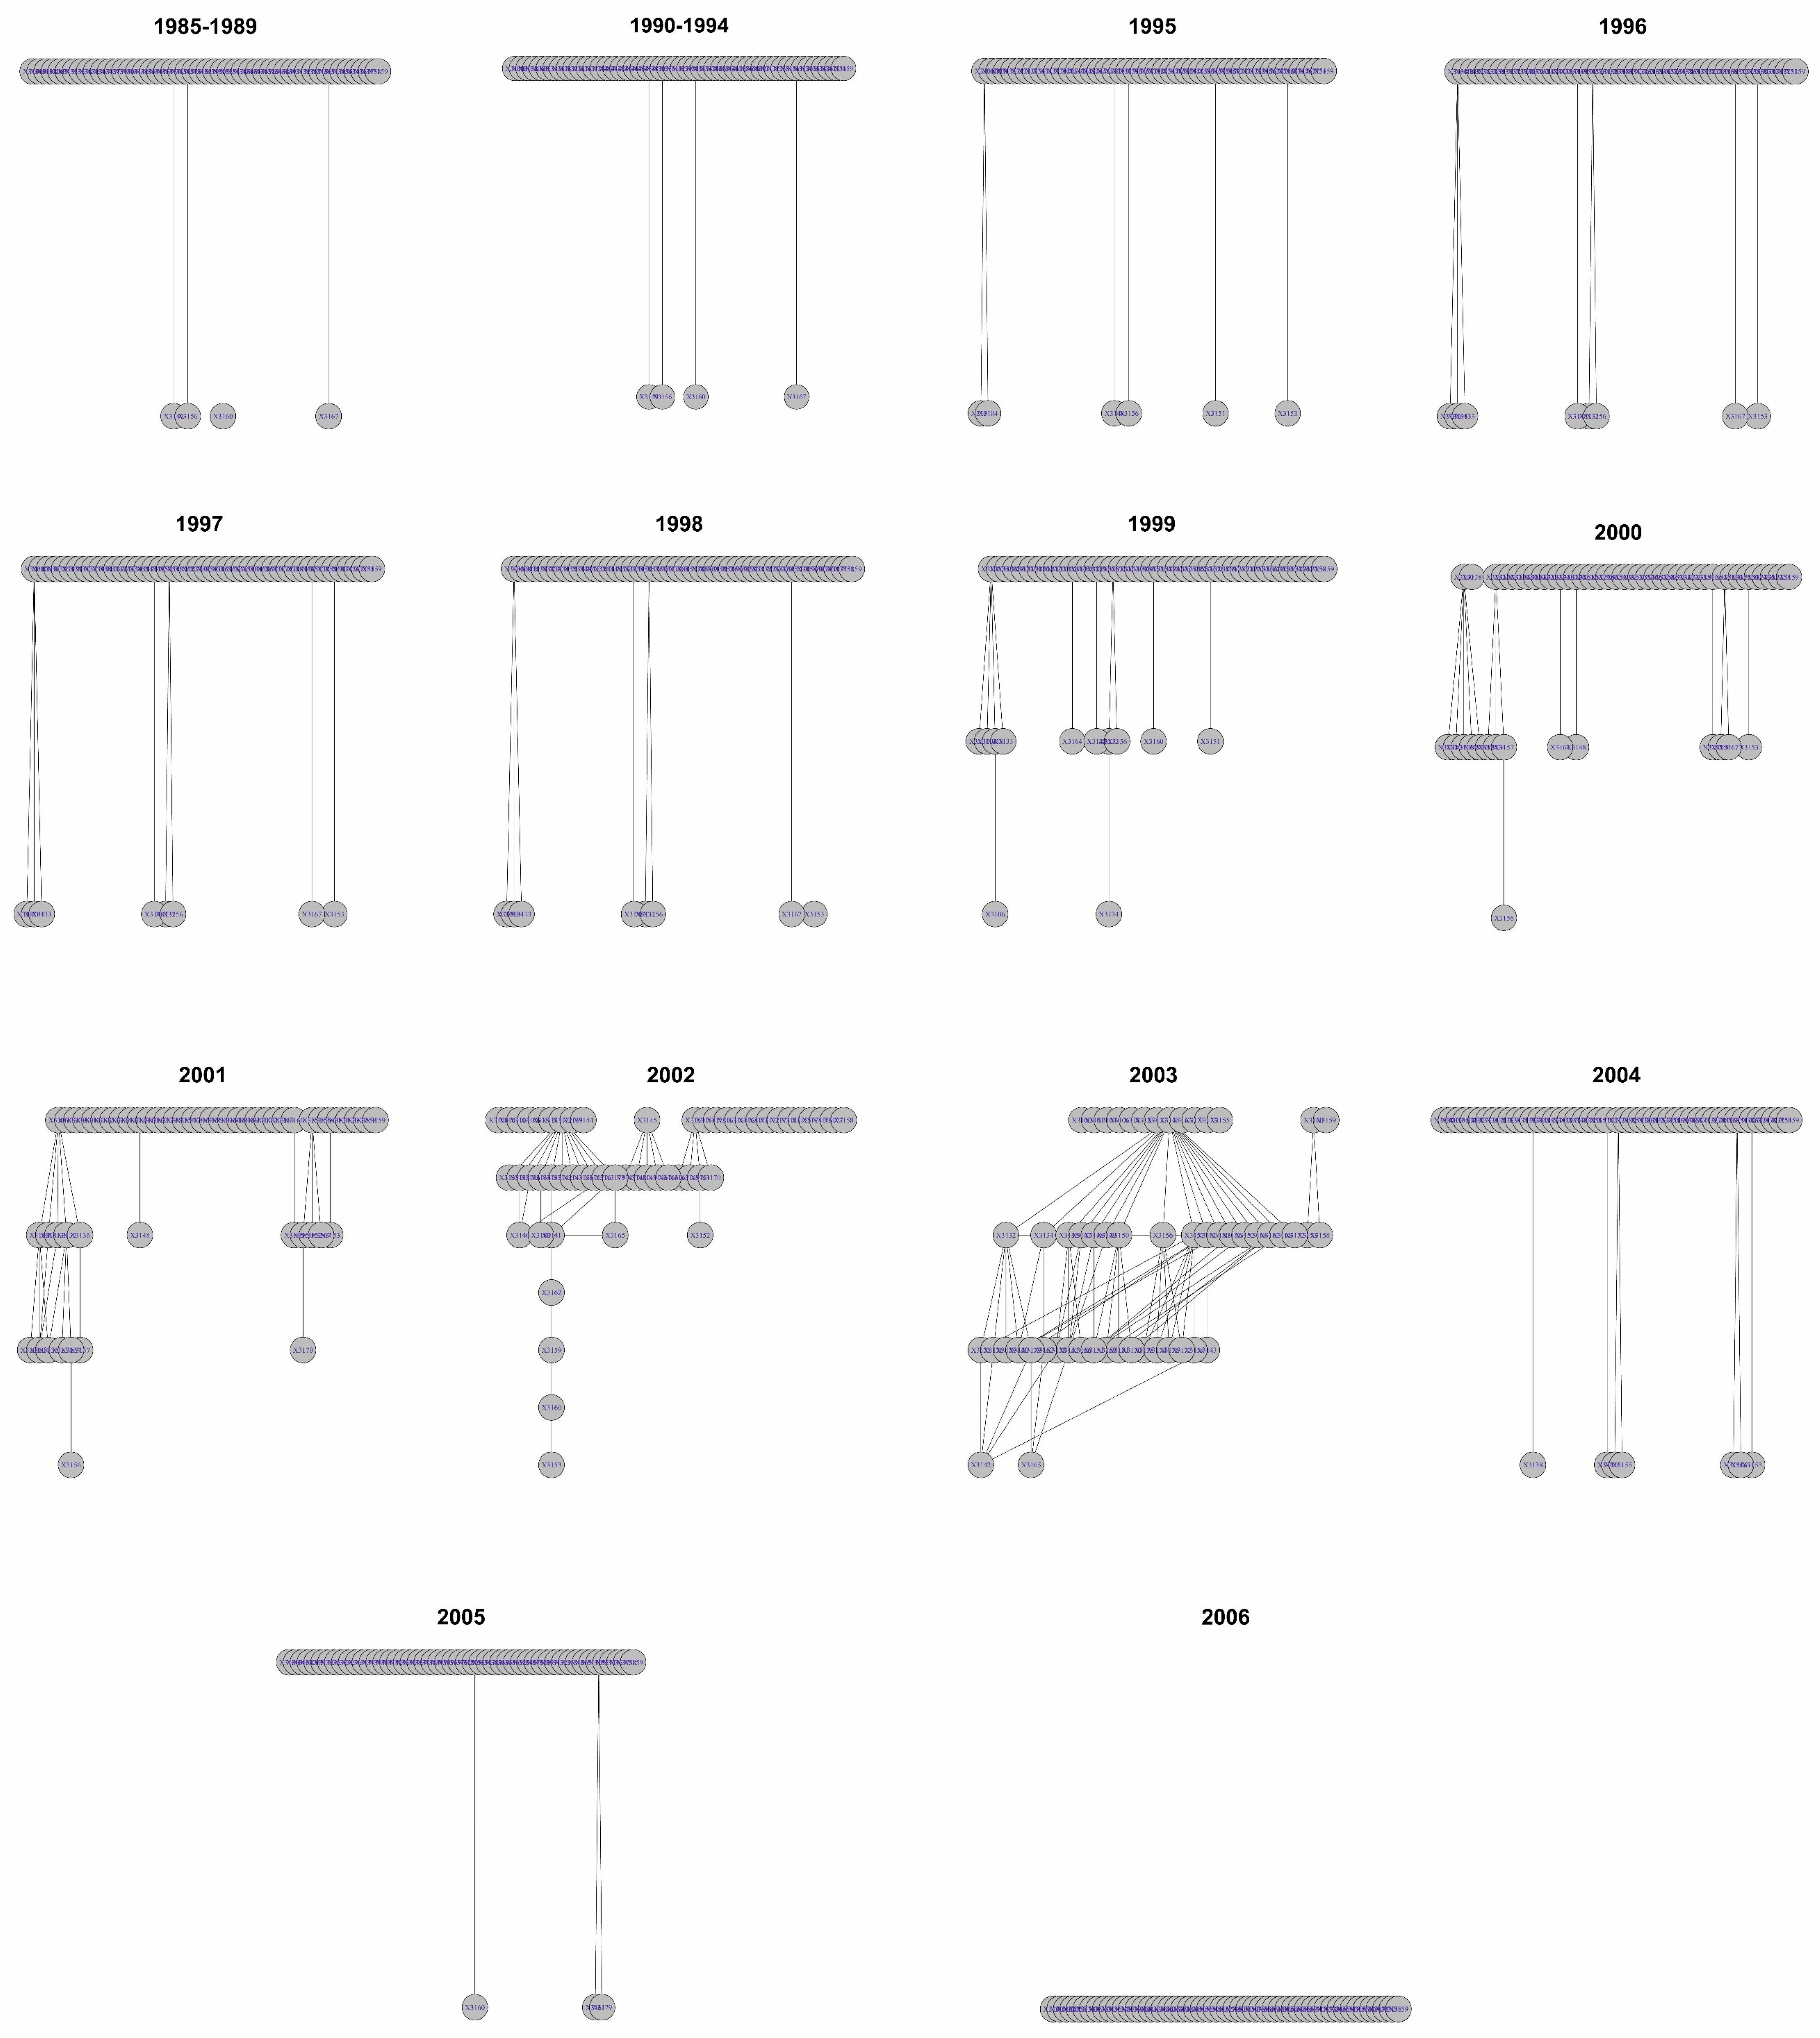
3.2. Visual Representation of Terrorist Networks

The visual representations of the terrorist networks are presented as follows: “Jamaah Islamiah section of Indonesia” (Figure 1), “Hamburg Cell” (Figure 2), “Al-Qaeda section of Madrid” (Figure 3) and “Jamaah Islamiah section of Philippines” (Figure 4). In these figures, all connections appearing during the time periods were taken into account.

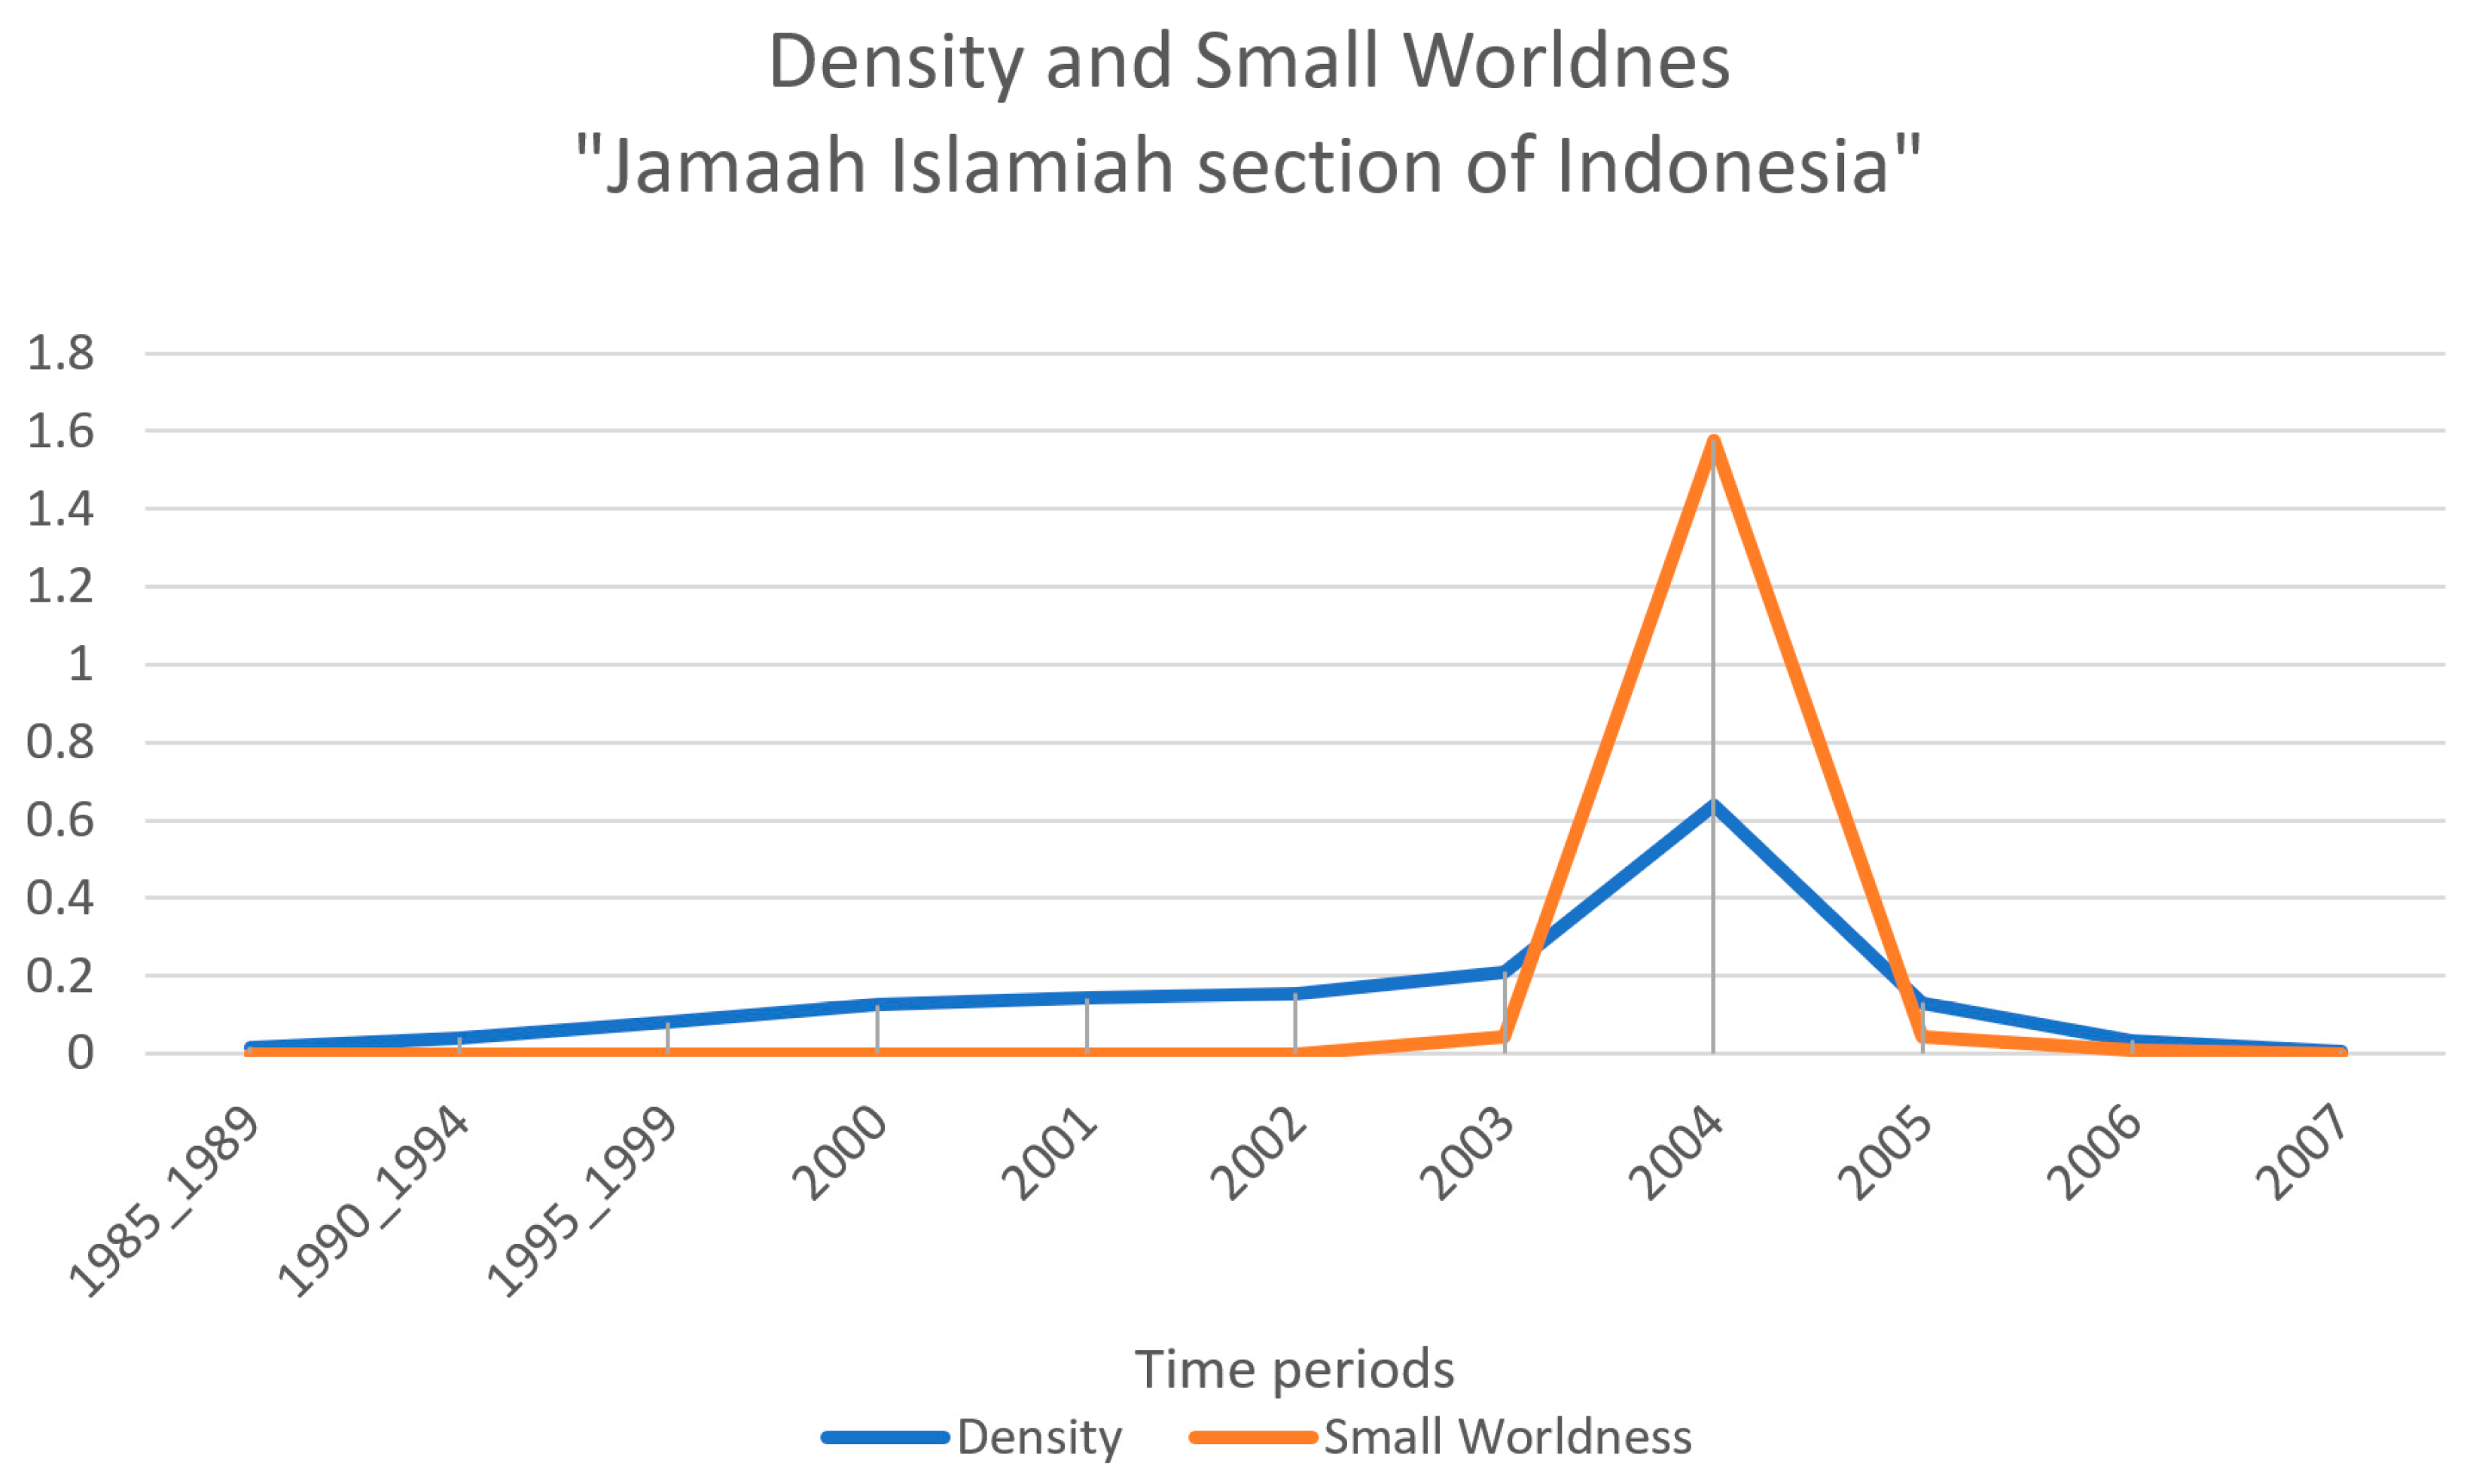
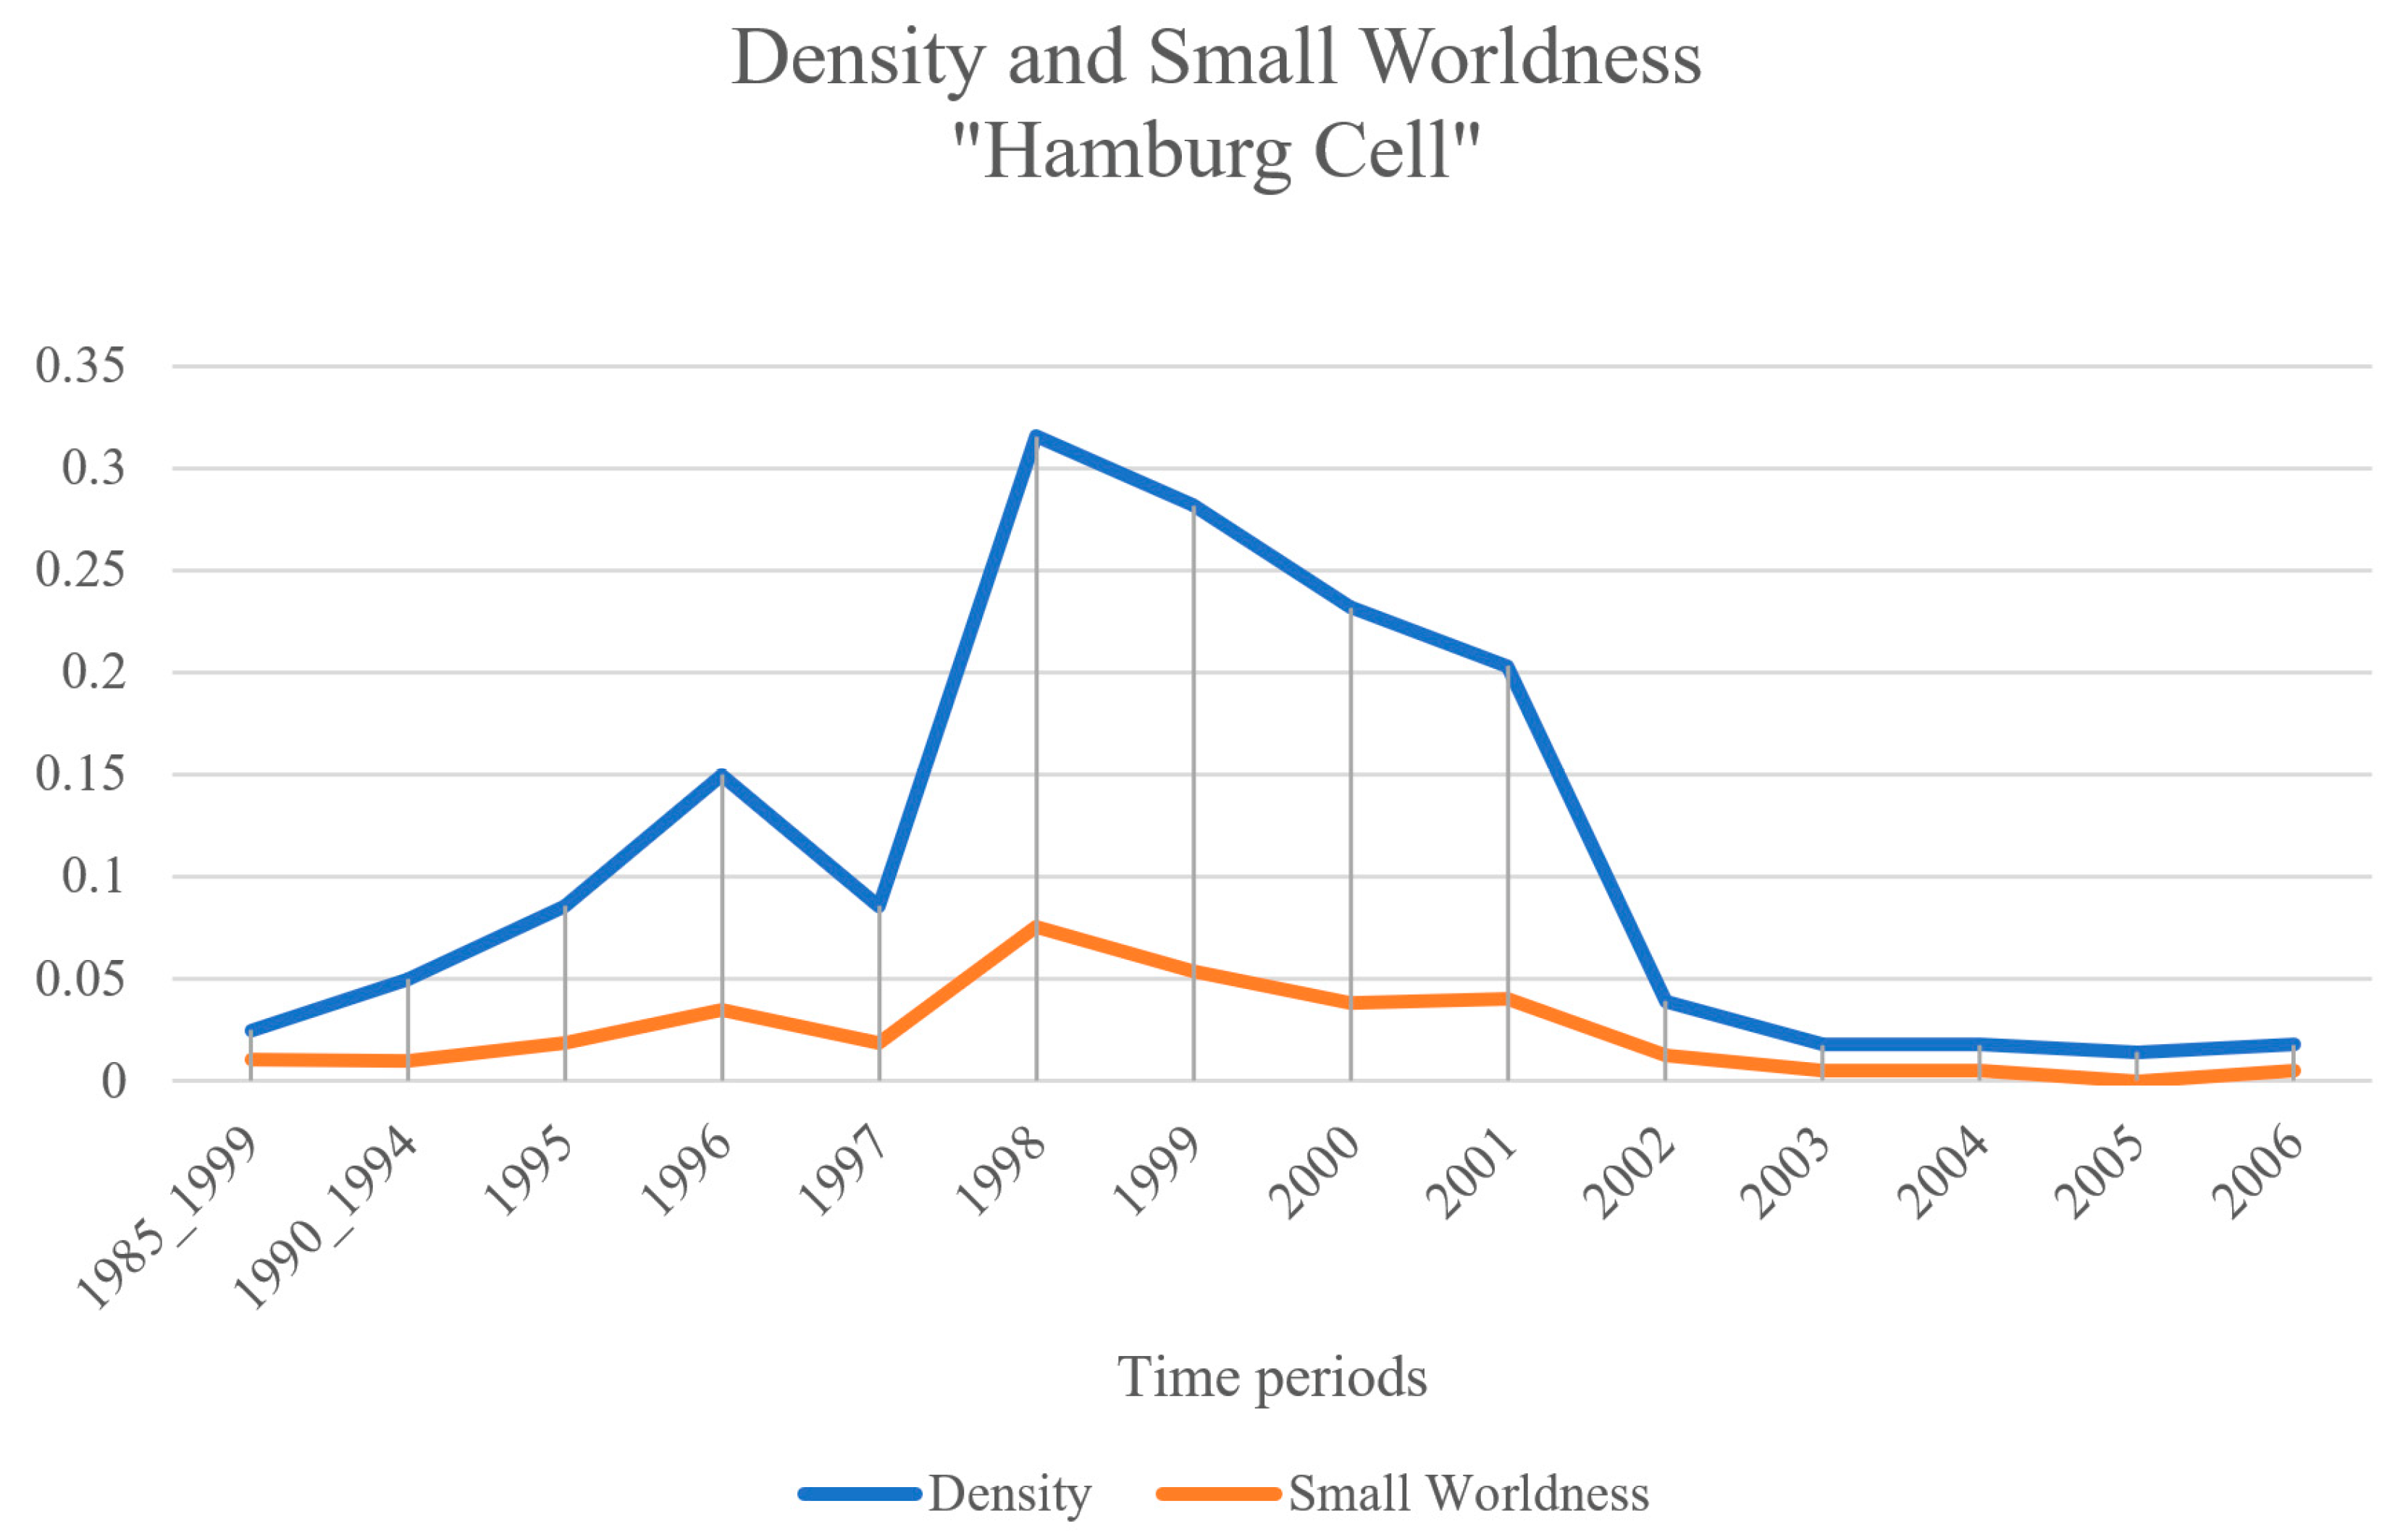
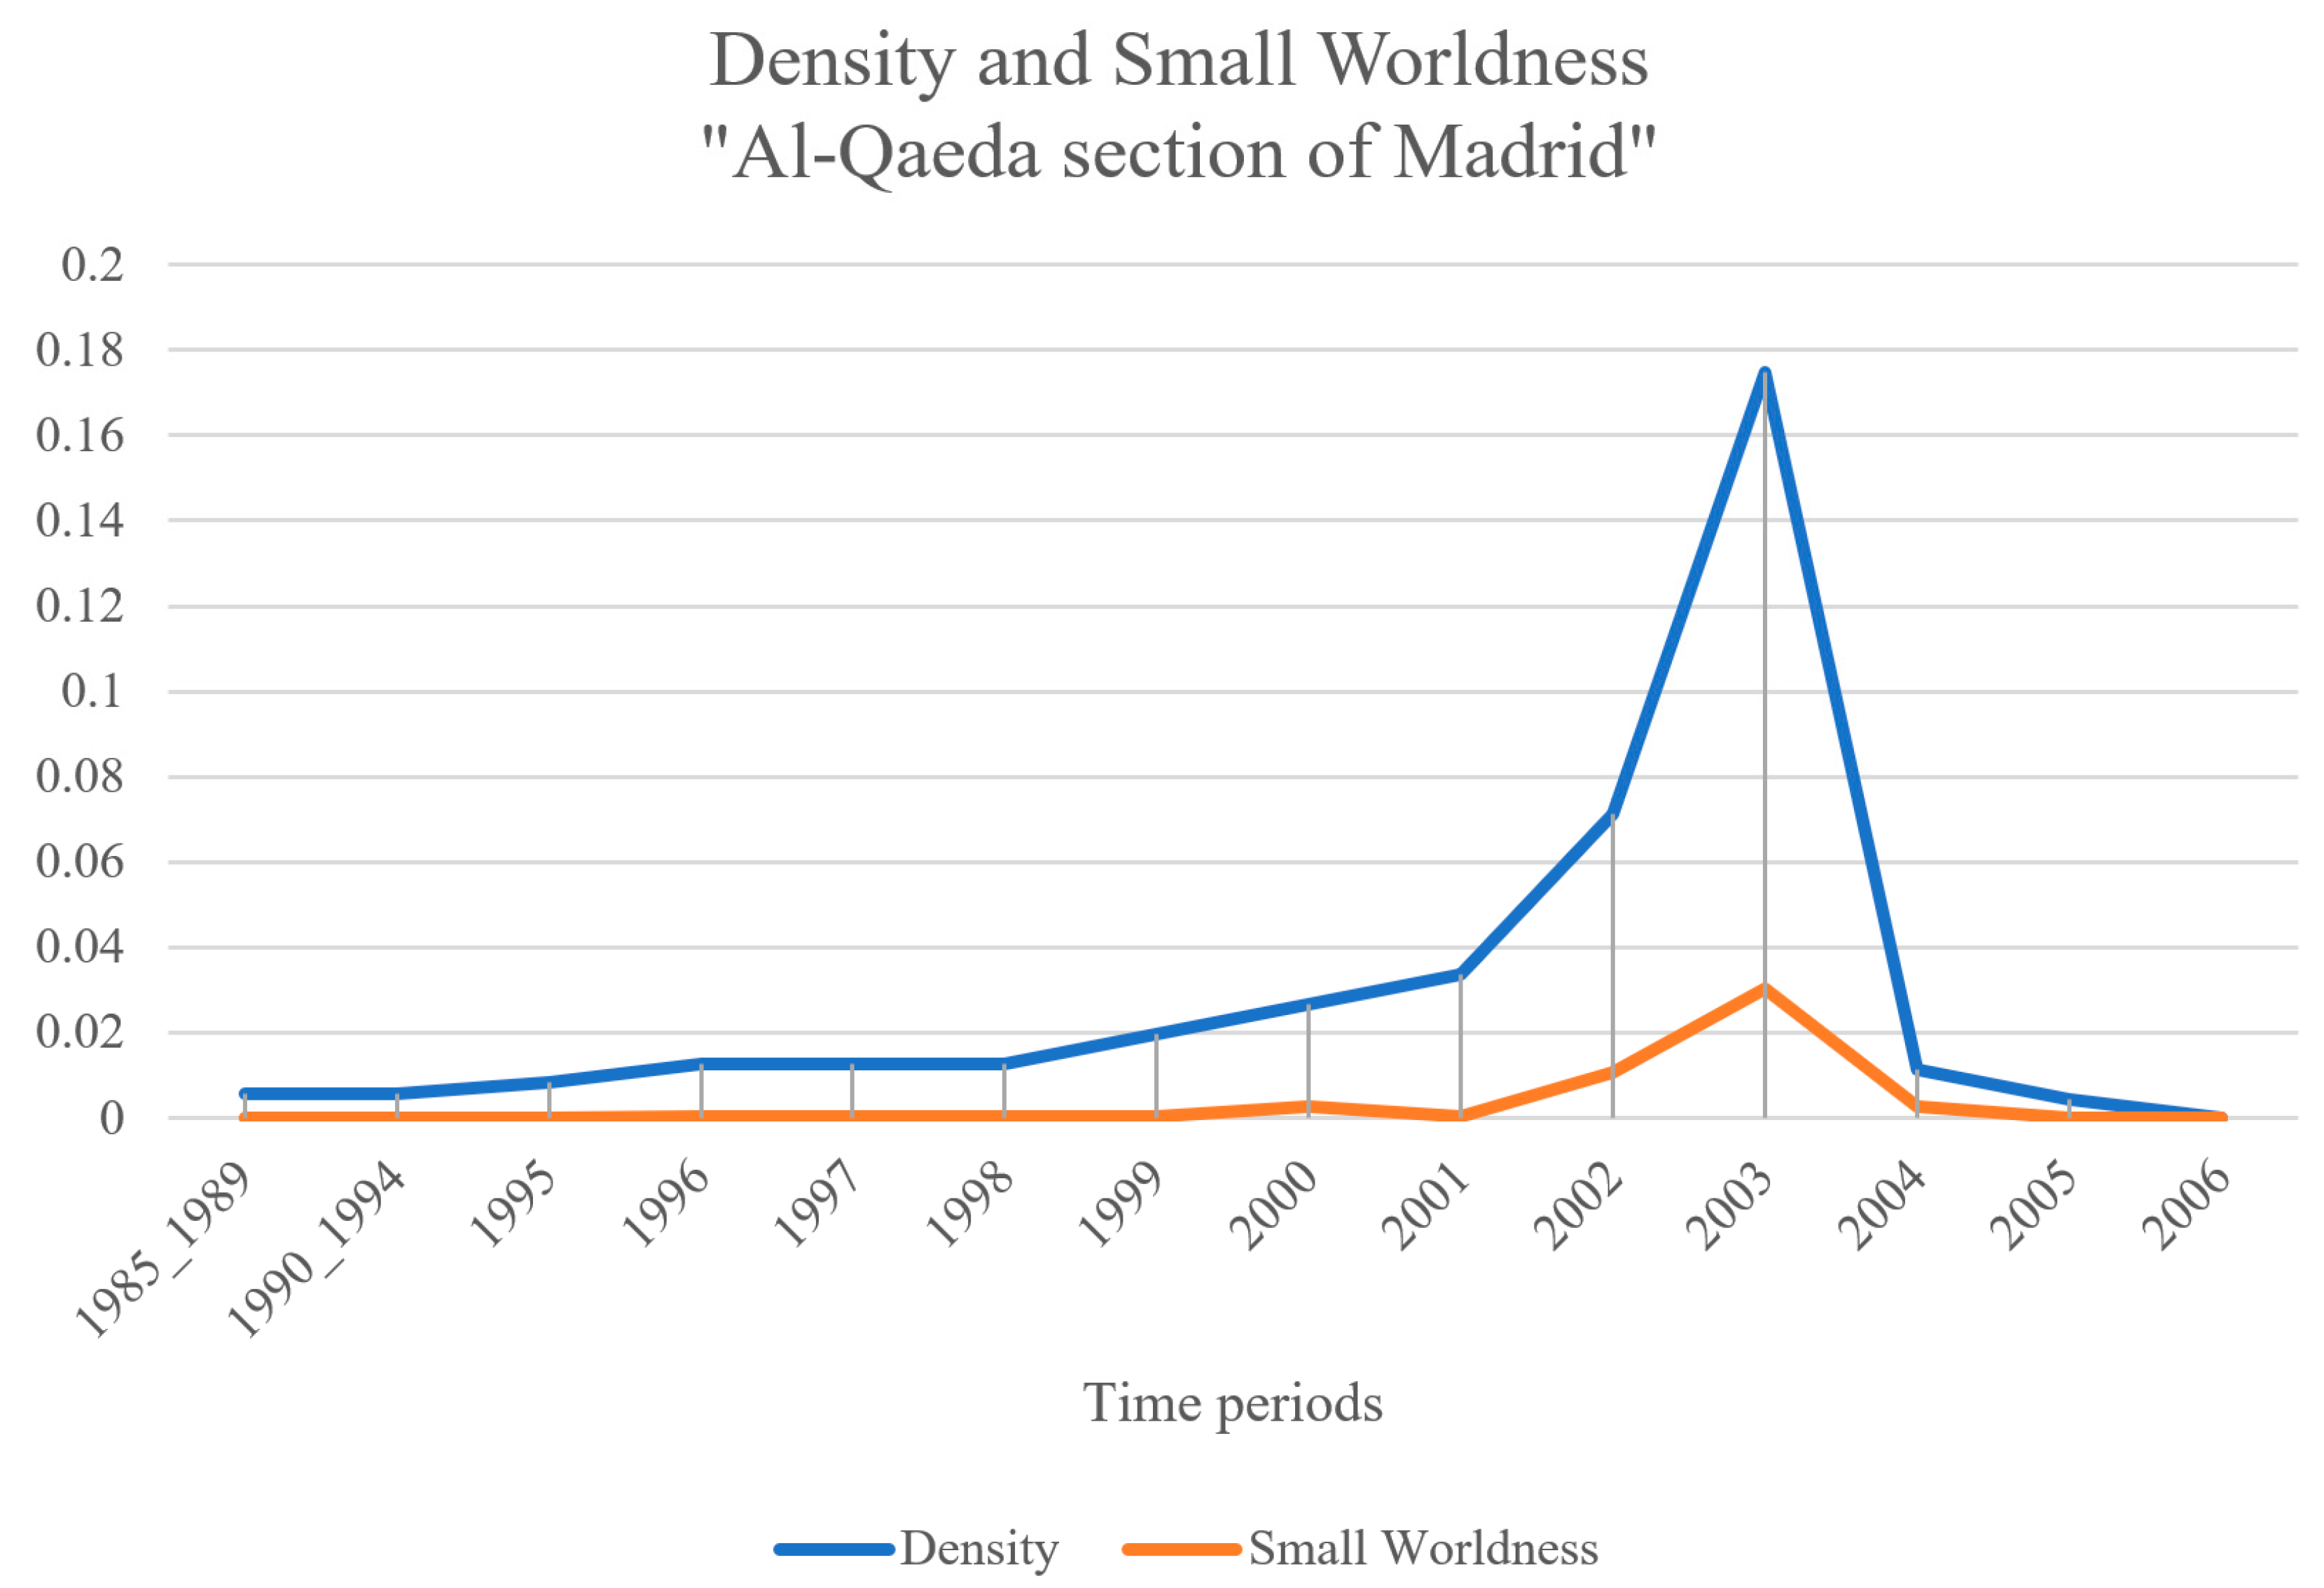
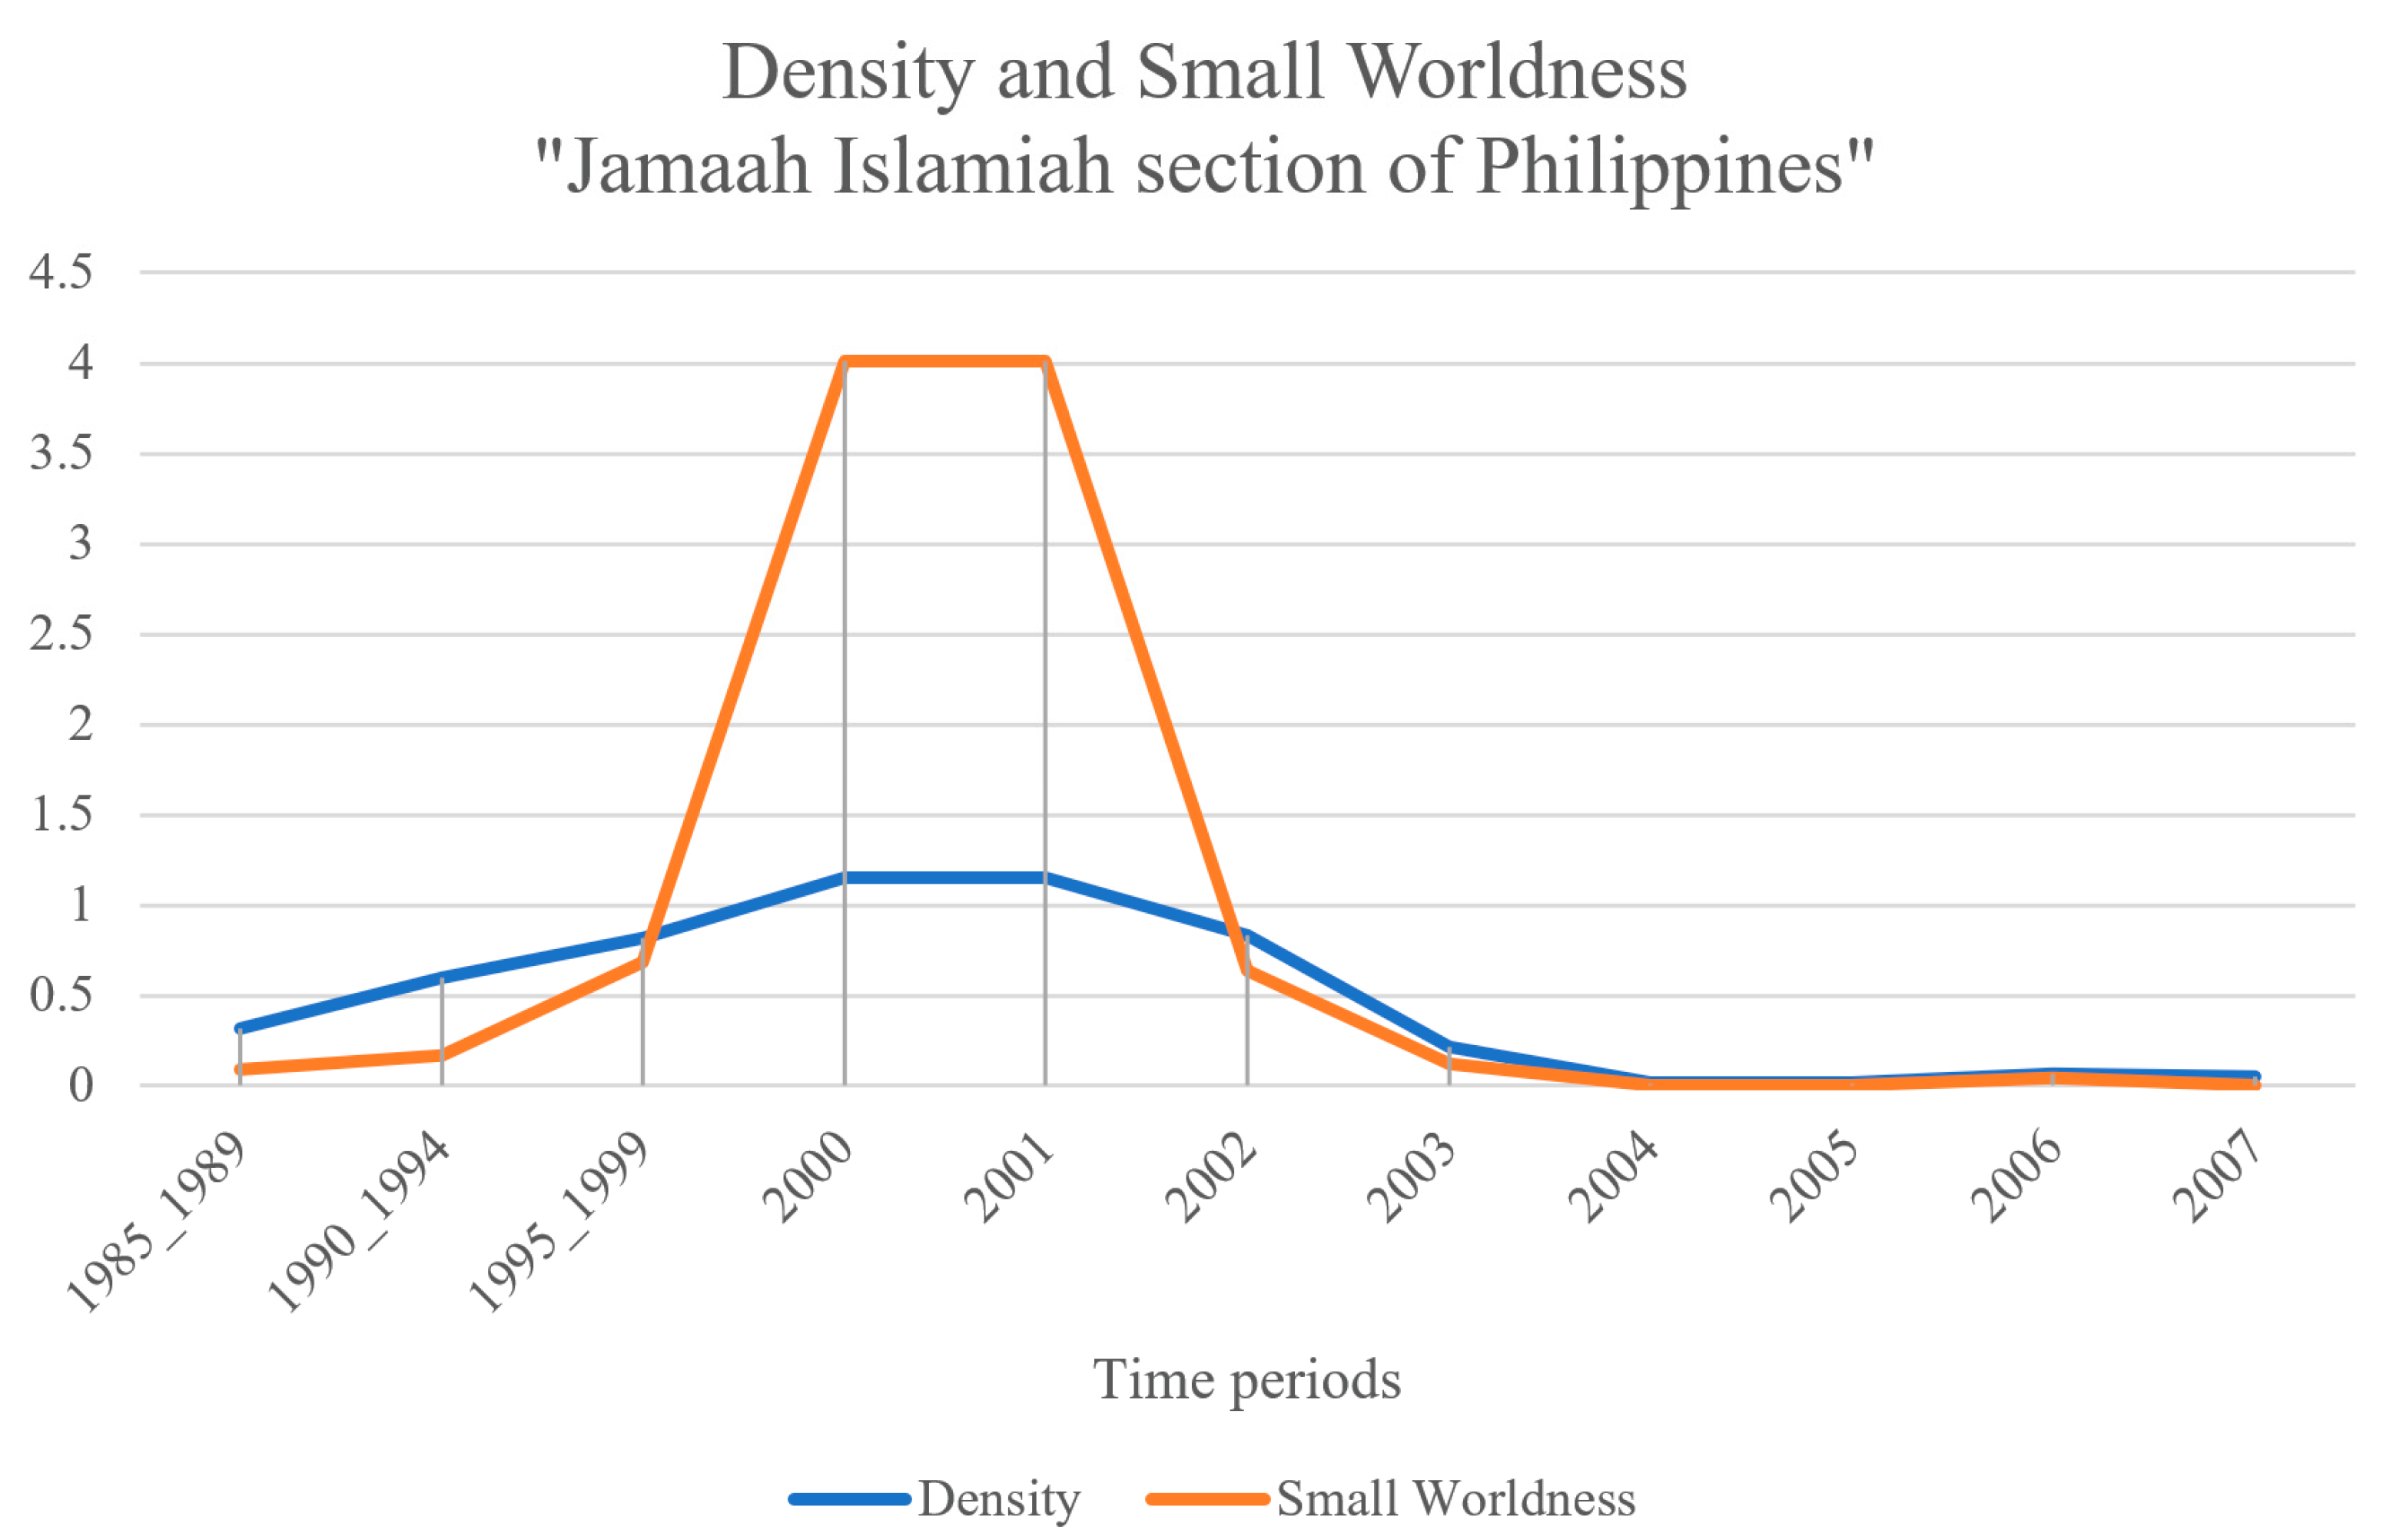
3.3. Temporal Development of Density and Small Worldness

The evolution of the values of density and small worldness indicators are presented for the networks of the four terrorist organizations, namely: “Jamaah Islamiah section of Indonesia” (Figure 5), “Hamburg Cell” (Figure 6), “Al-Qaeda section of Madrid” (Figure 7) and “Jamaah Islamiah section of Philippines” (Figure 8).

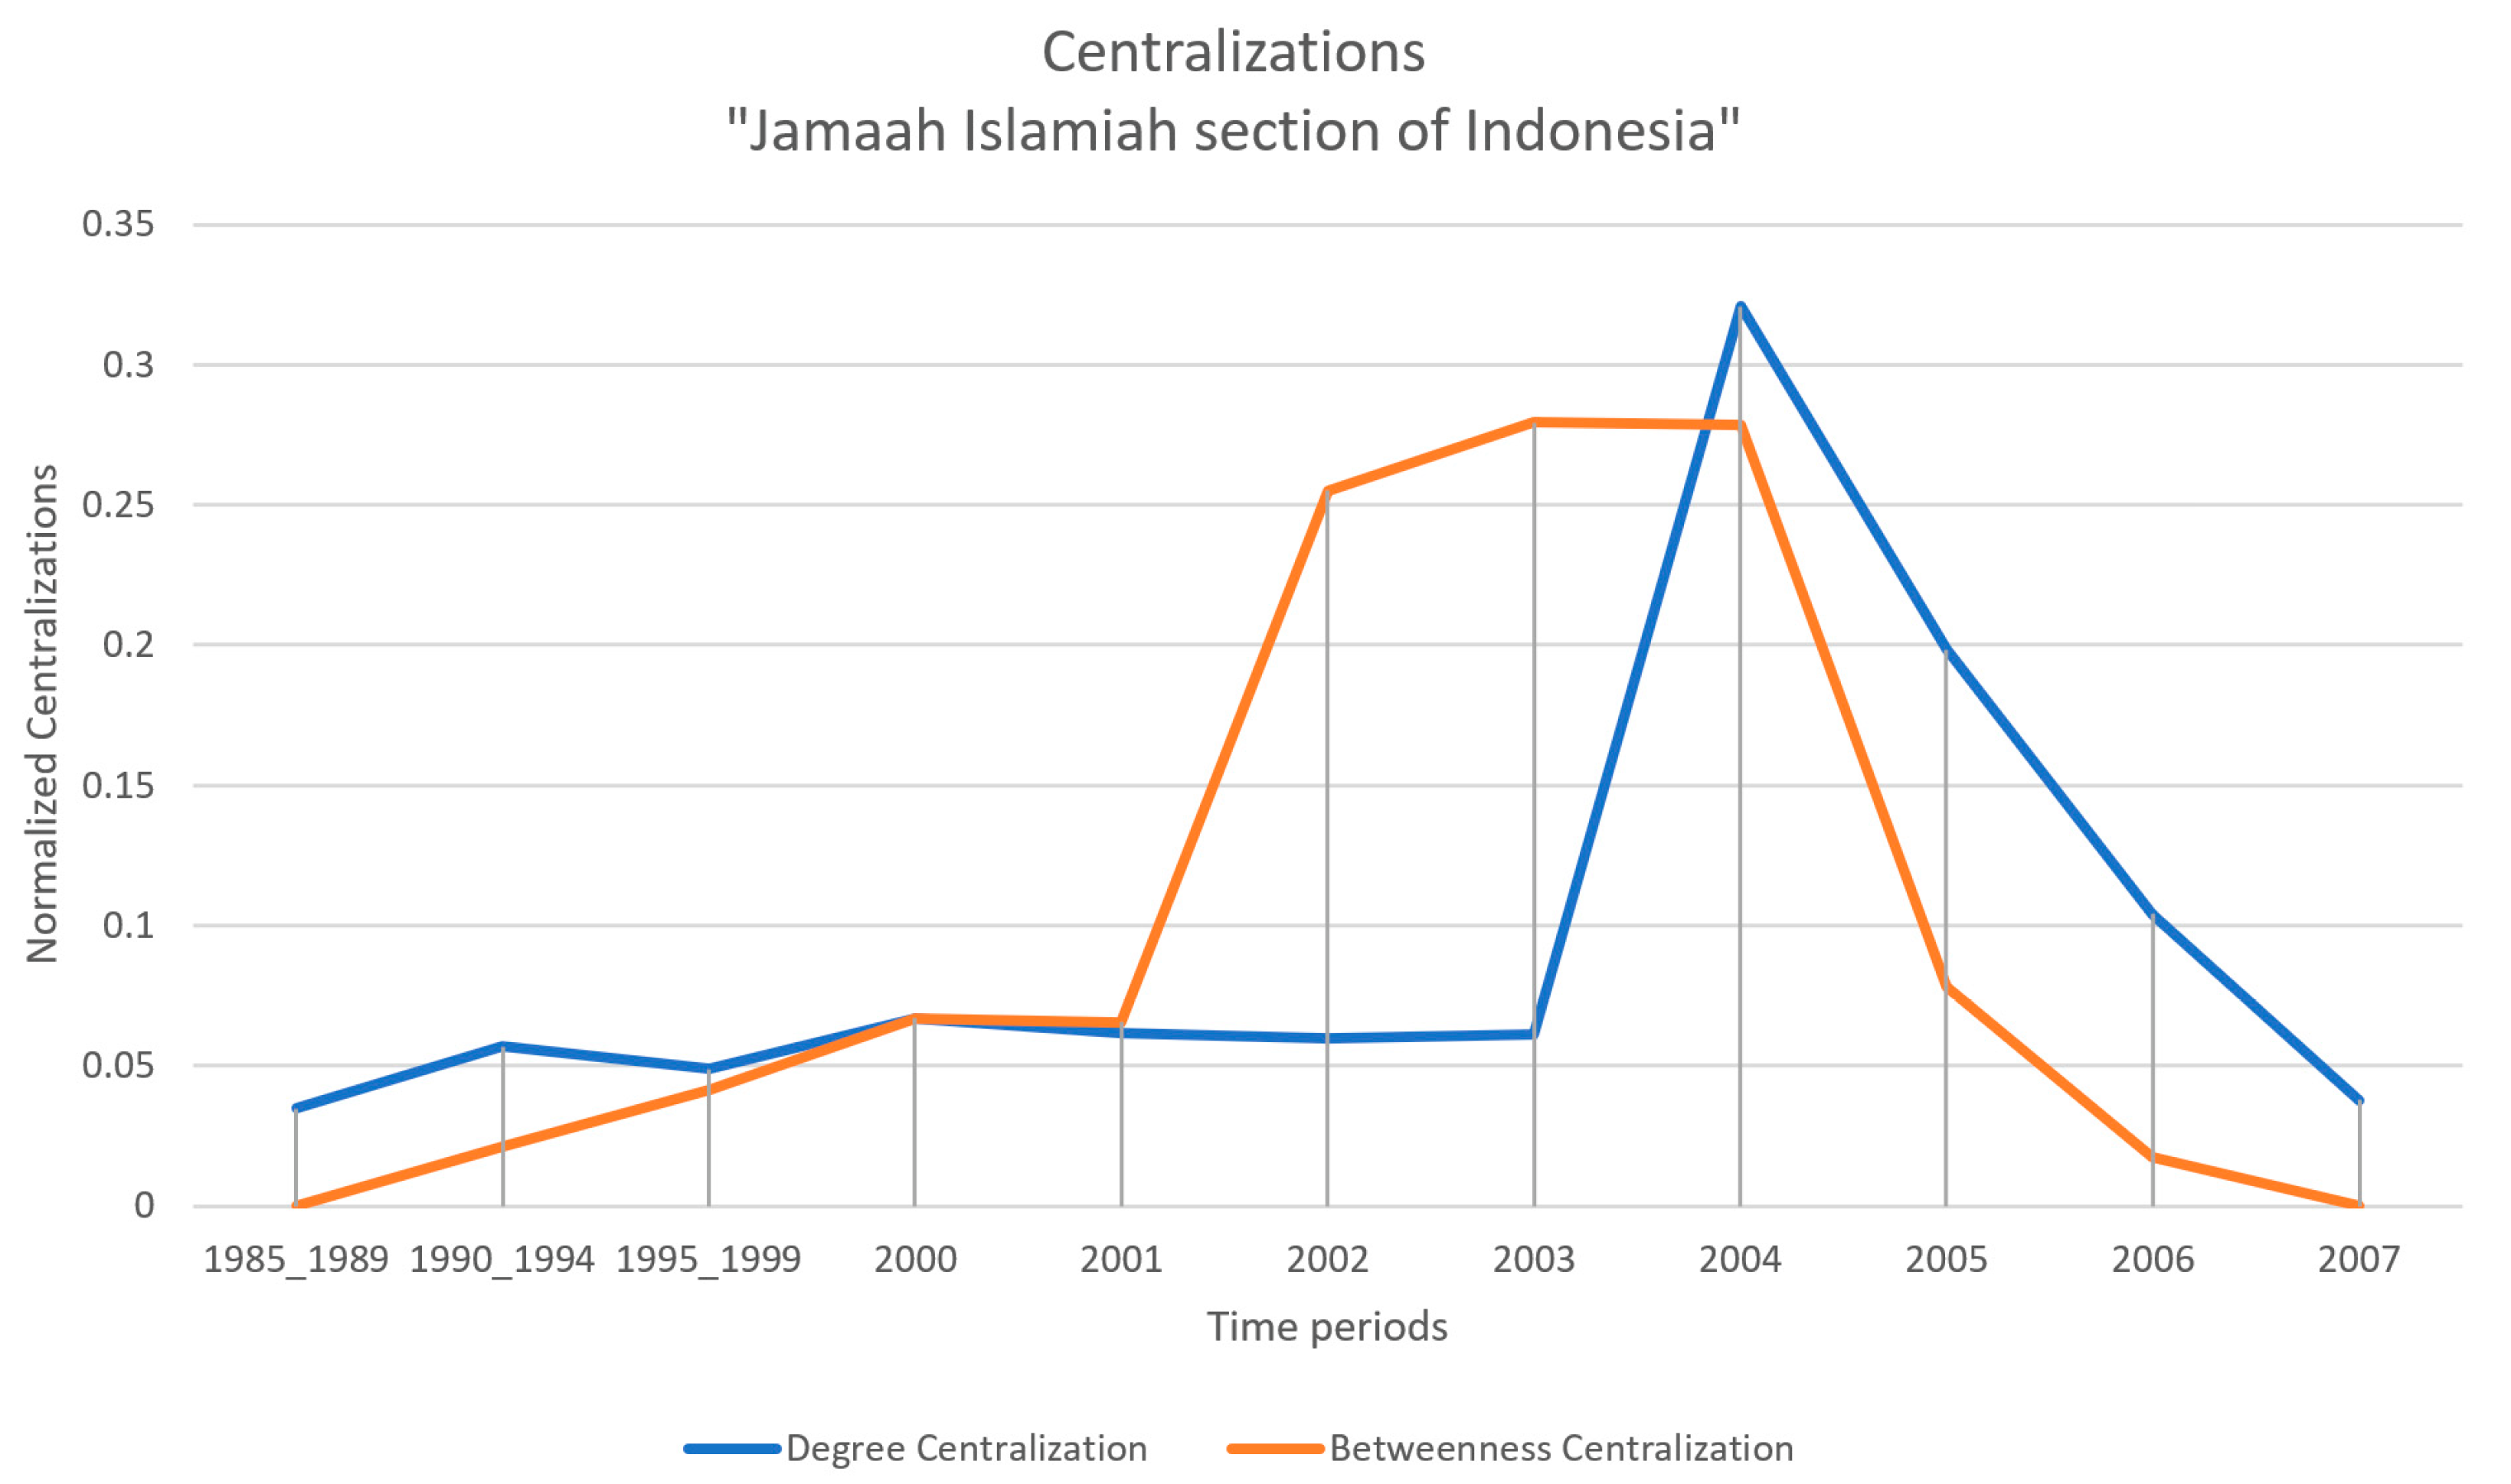
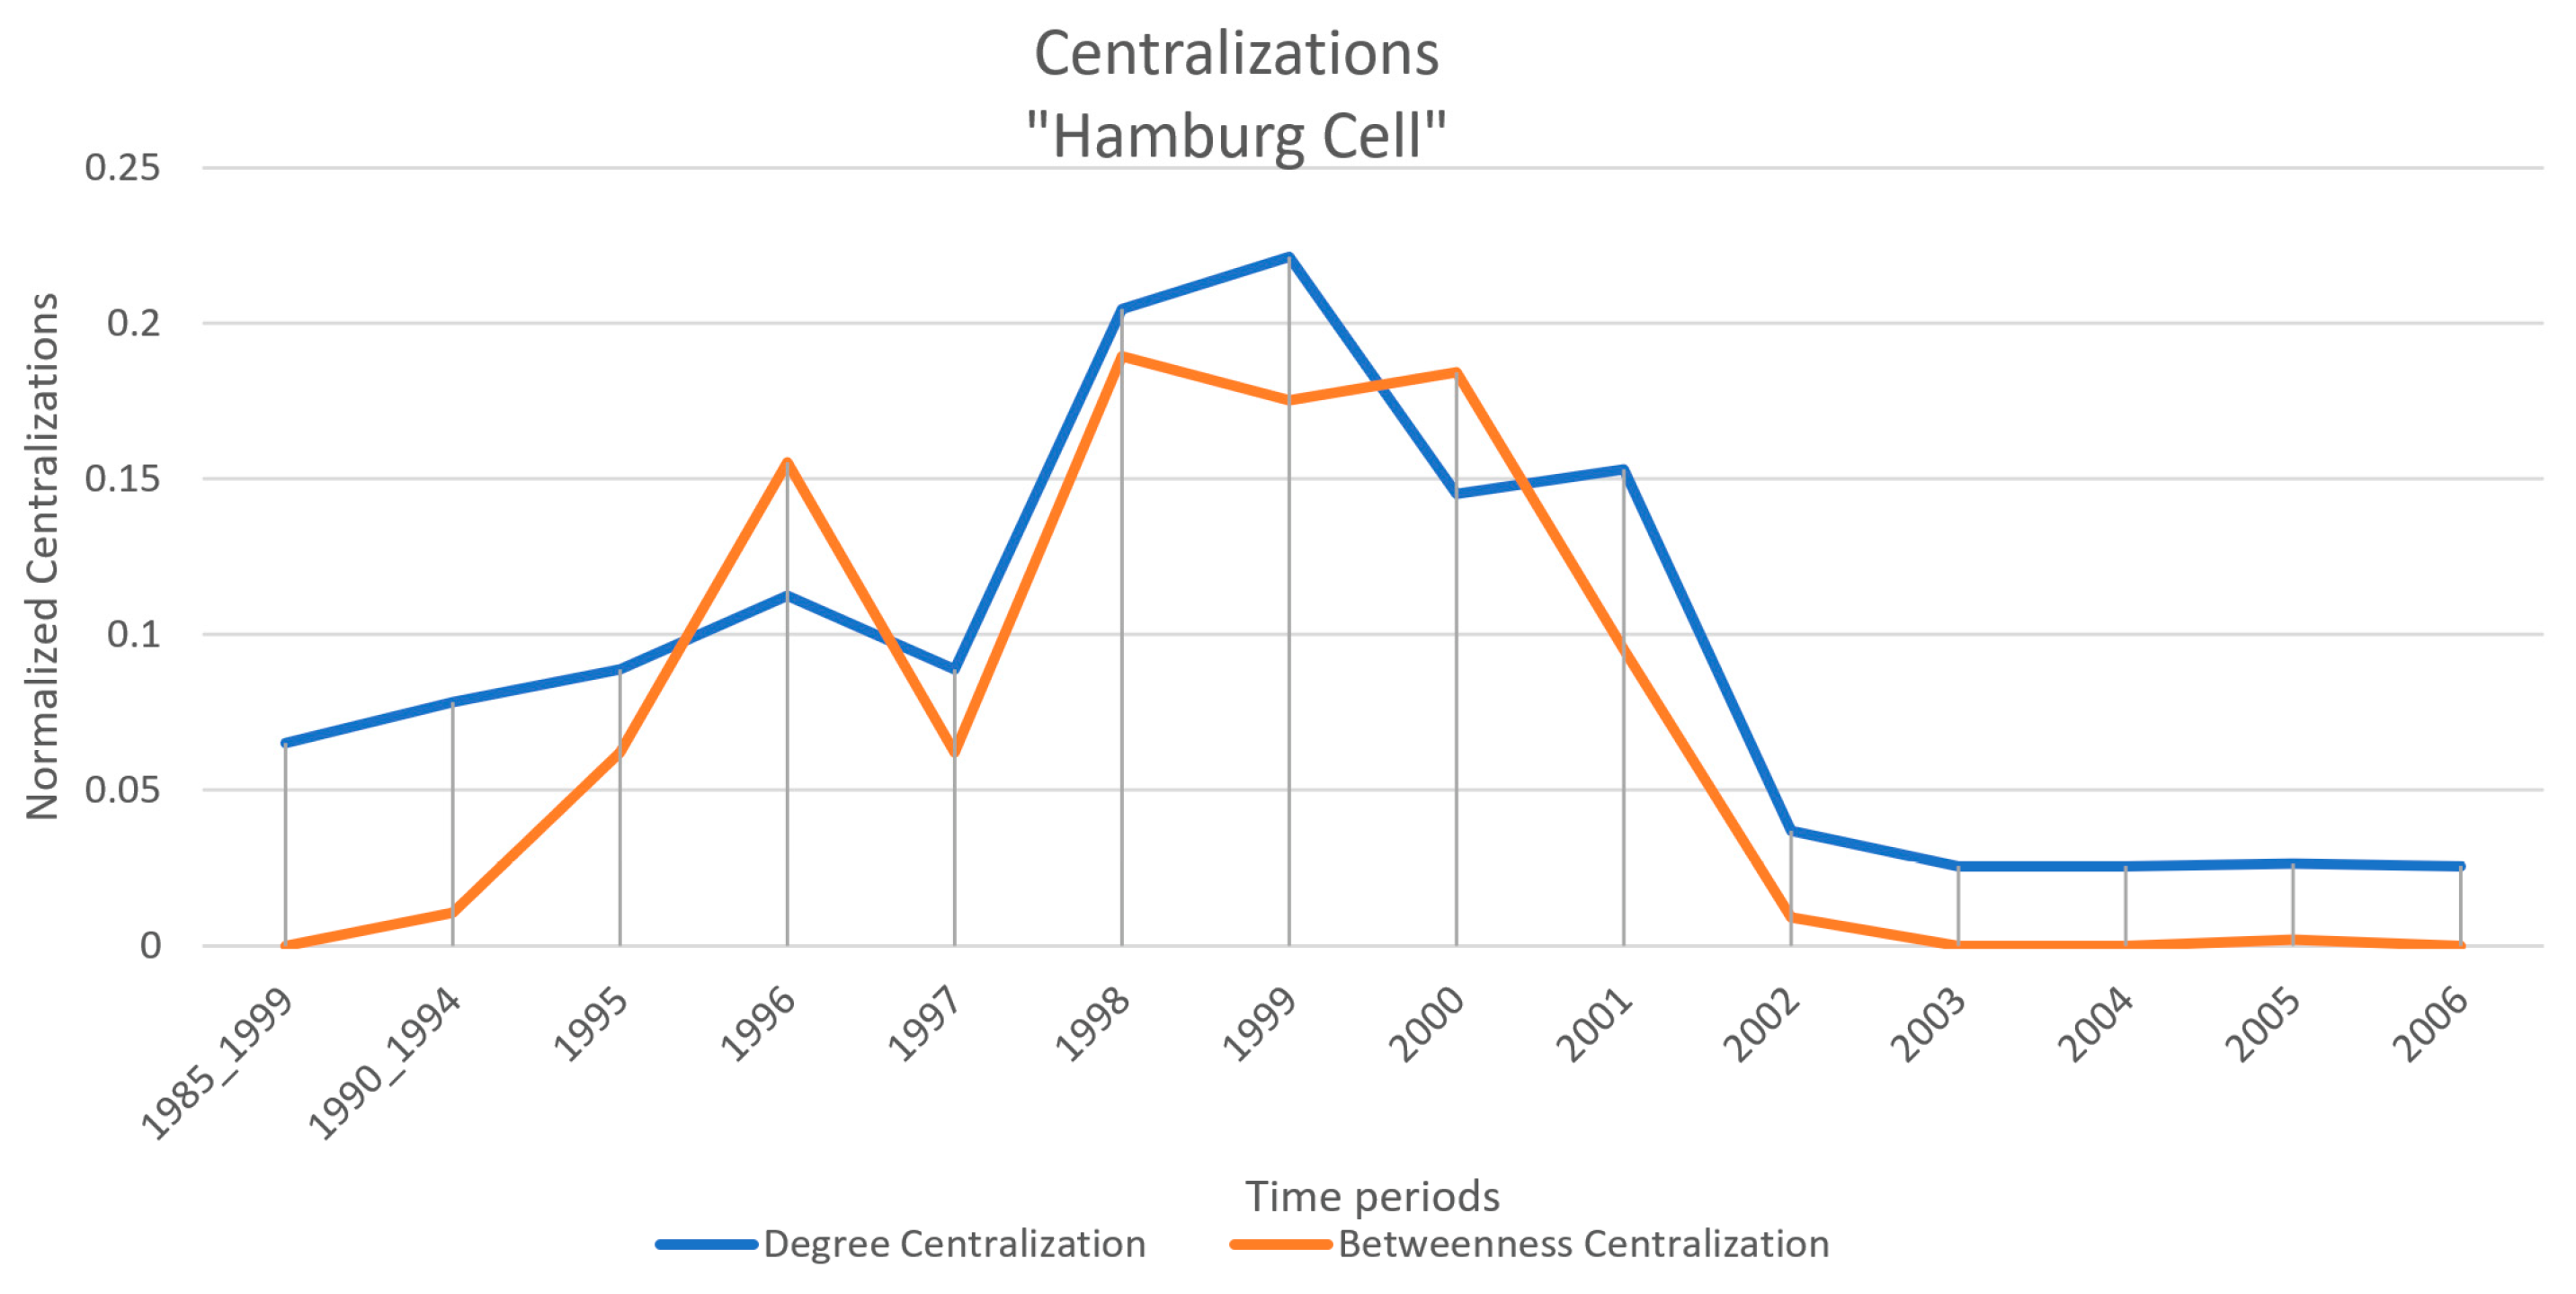
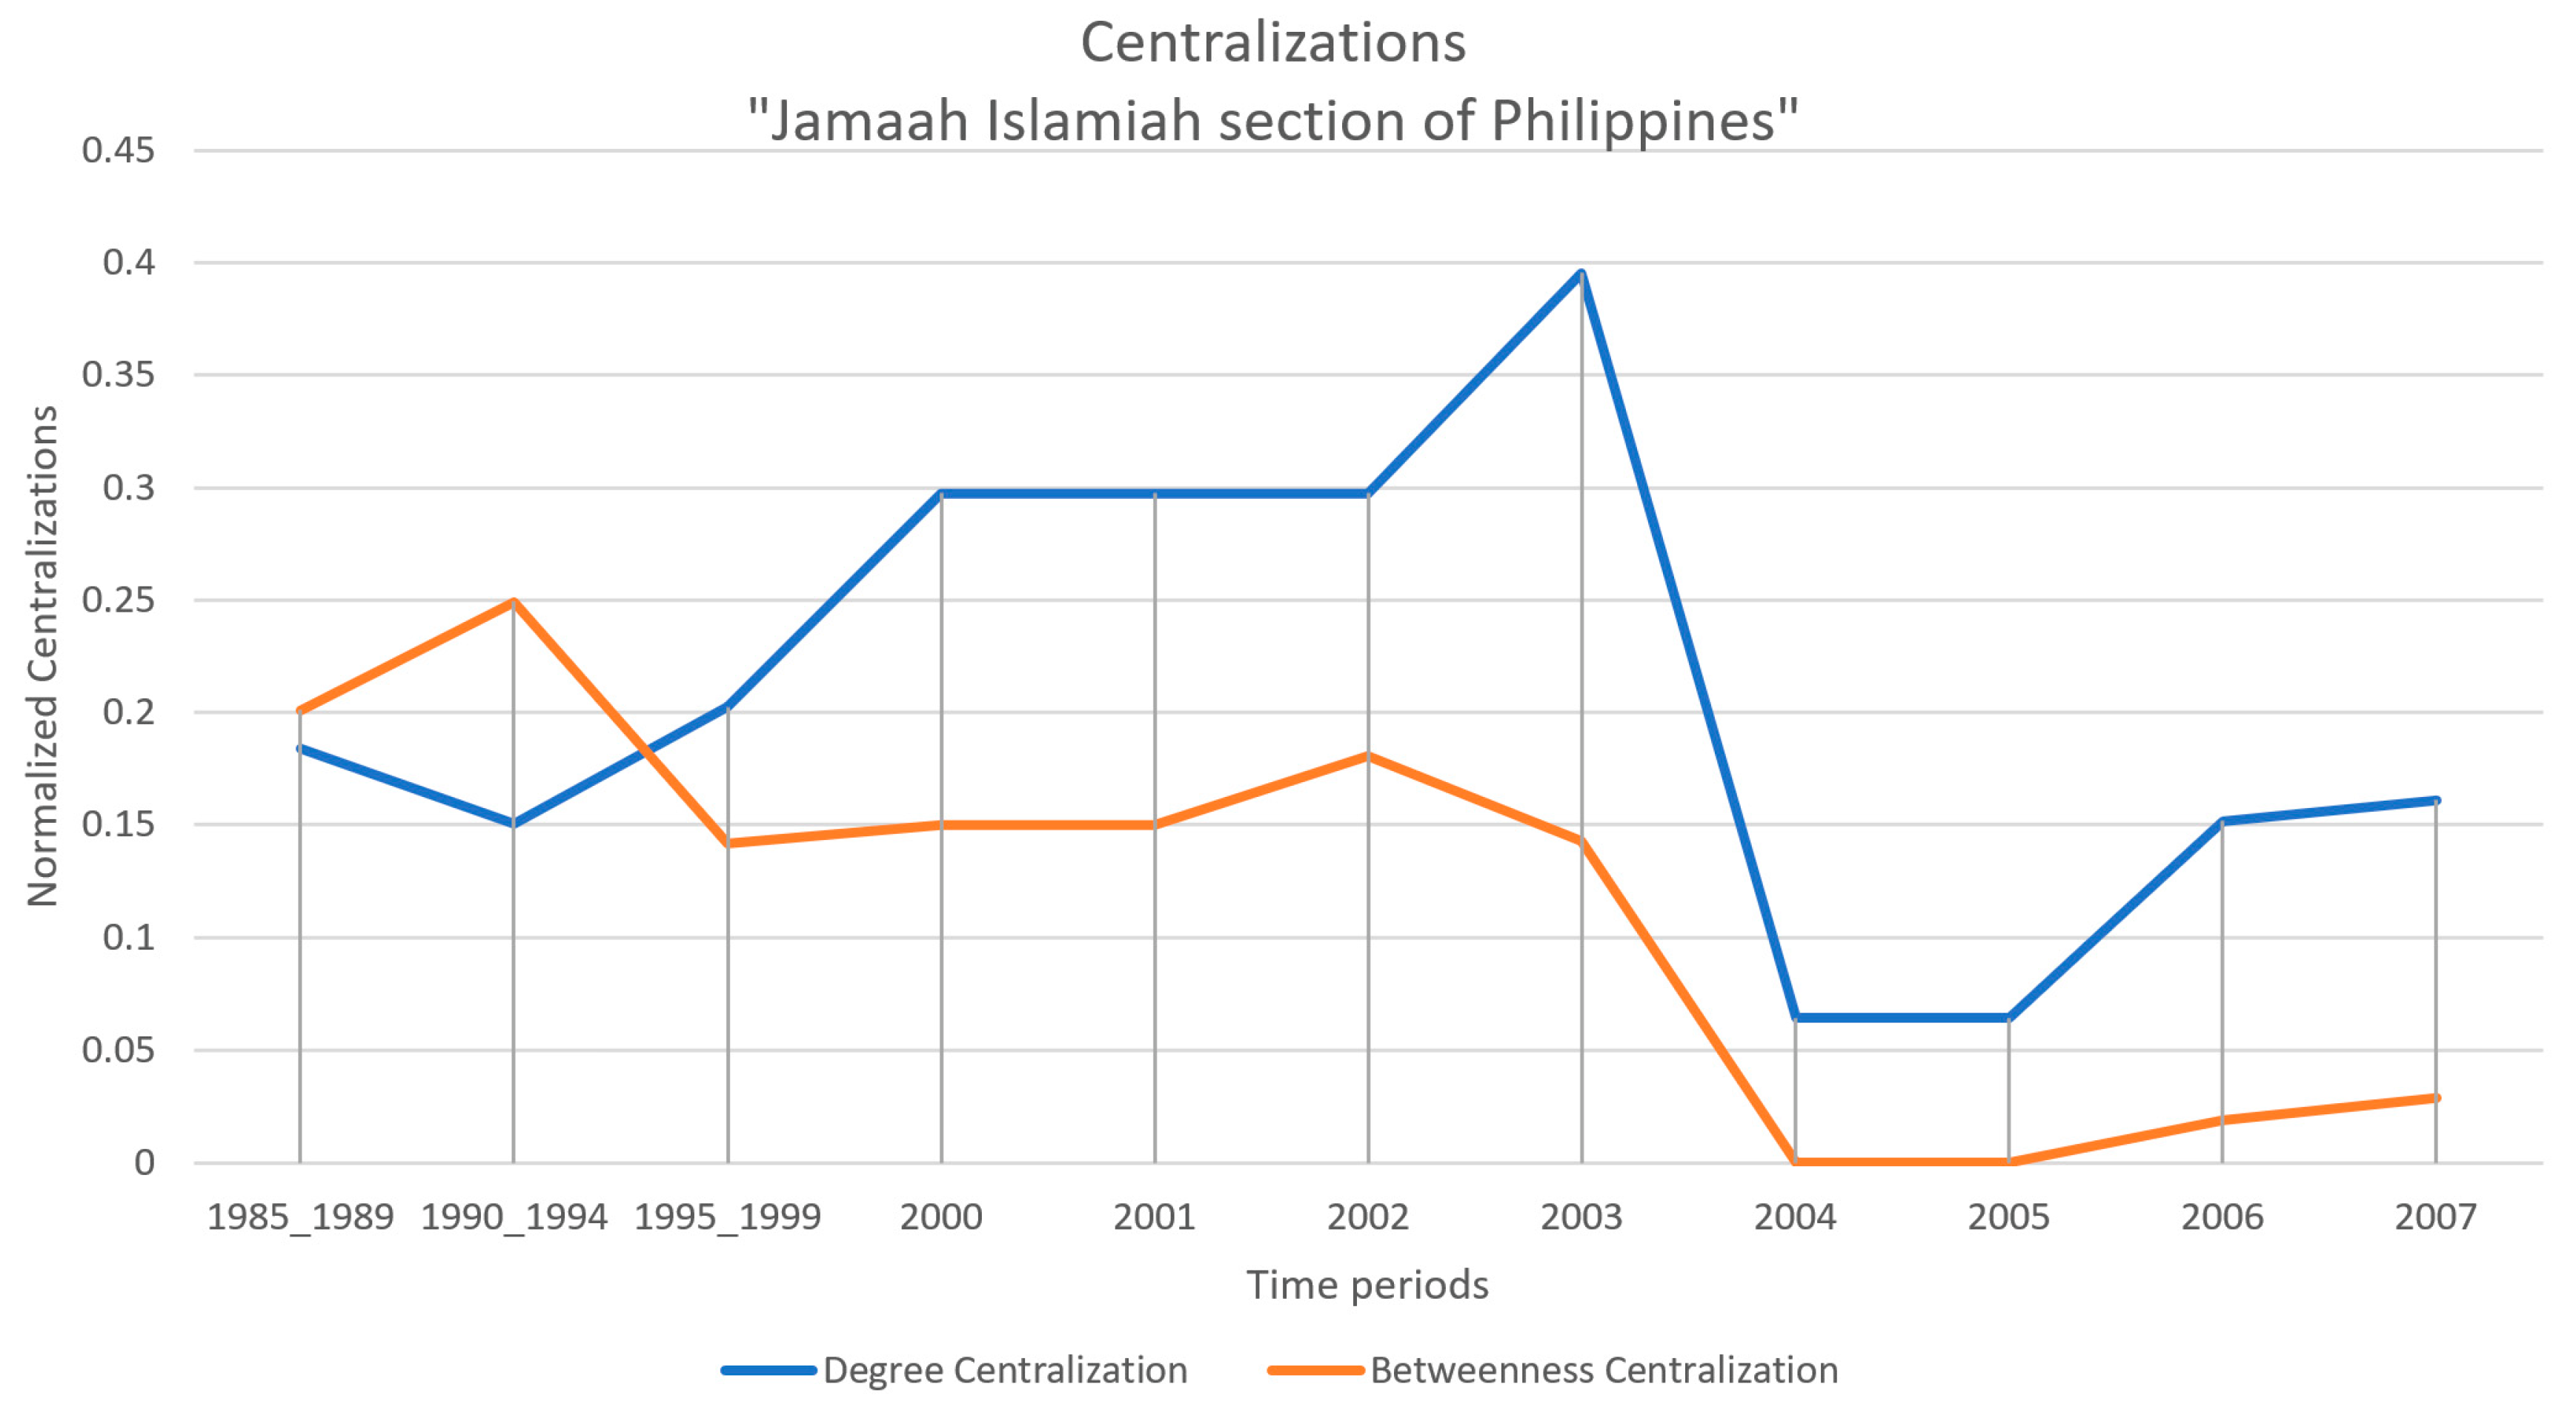
3.4. Temporal Development of Degree and Betweenness Centralization

The evolutions of the values of degree and betweenness centralizations are presented for the networks of the four terrorist organizations, namely: “Jamaah Islamiah section of Indonesia” (Figure 9), “Hamburg Cell” (Figure 10), “Al-Qaeda section of Madrid” (Figure 11) and “Jamaah Islamiah section of Philippines” (Figure 12).

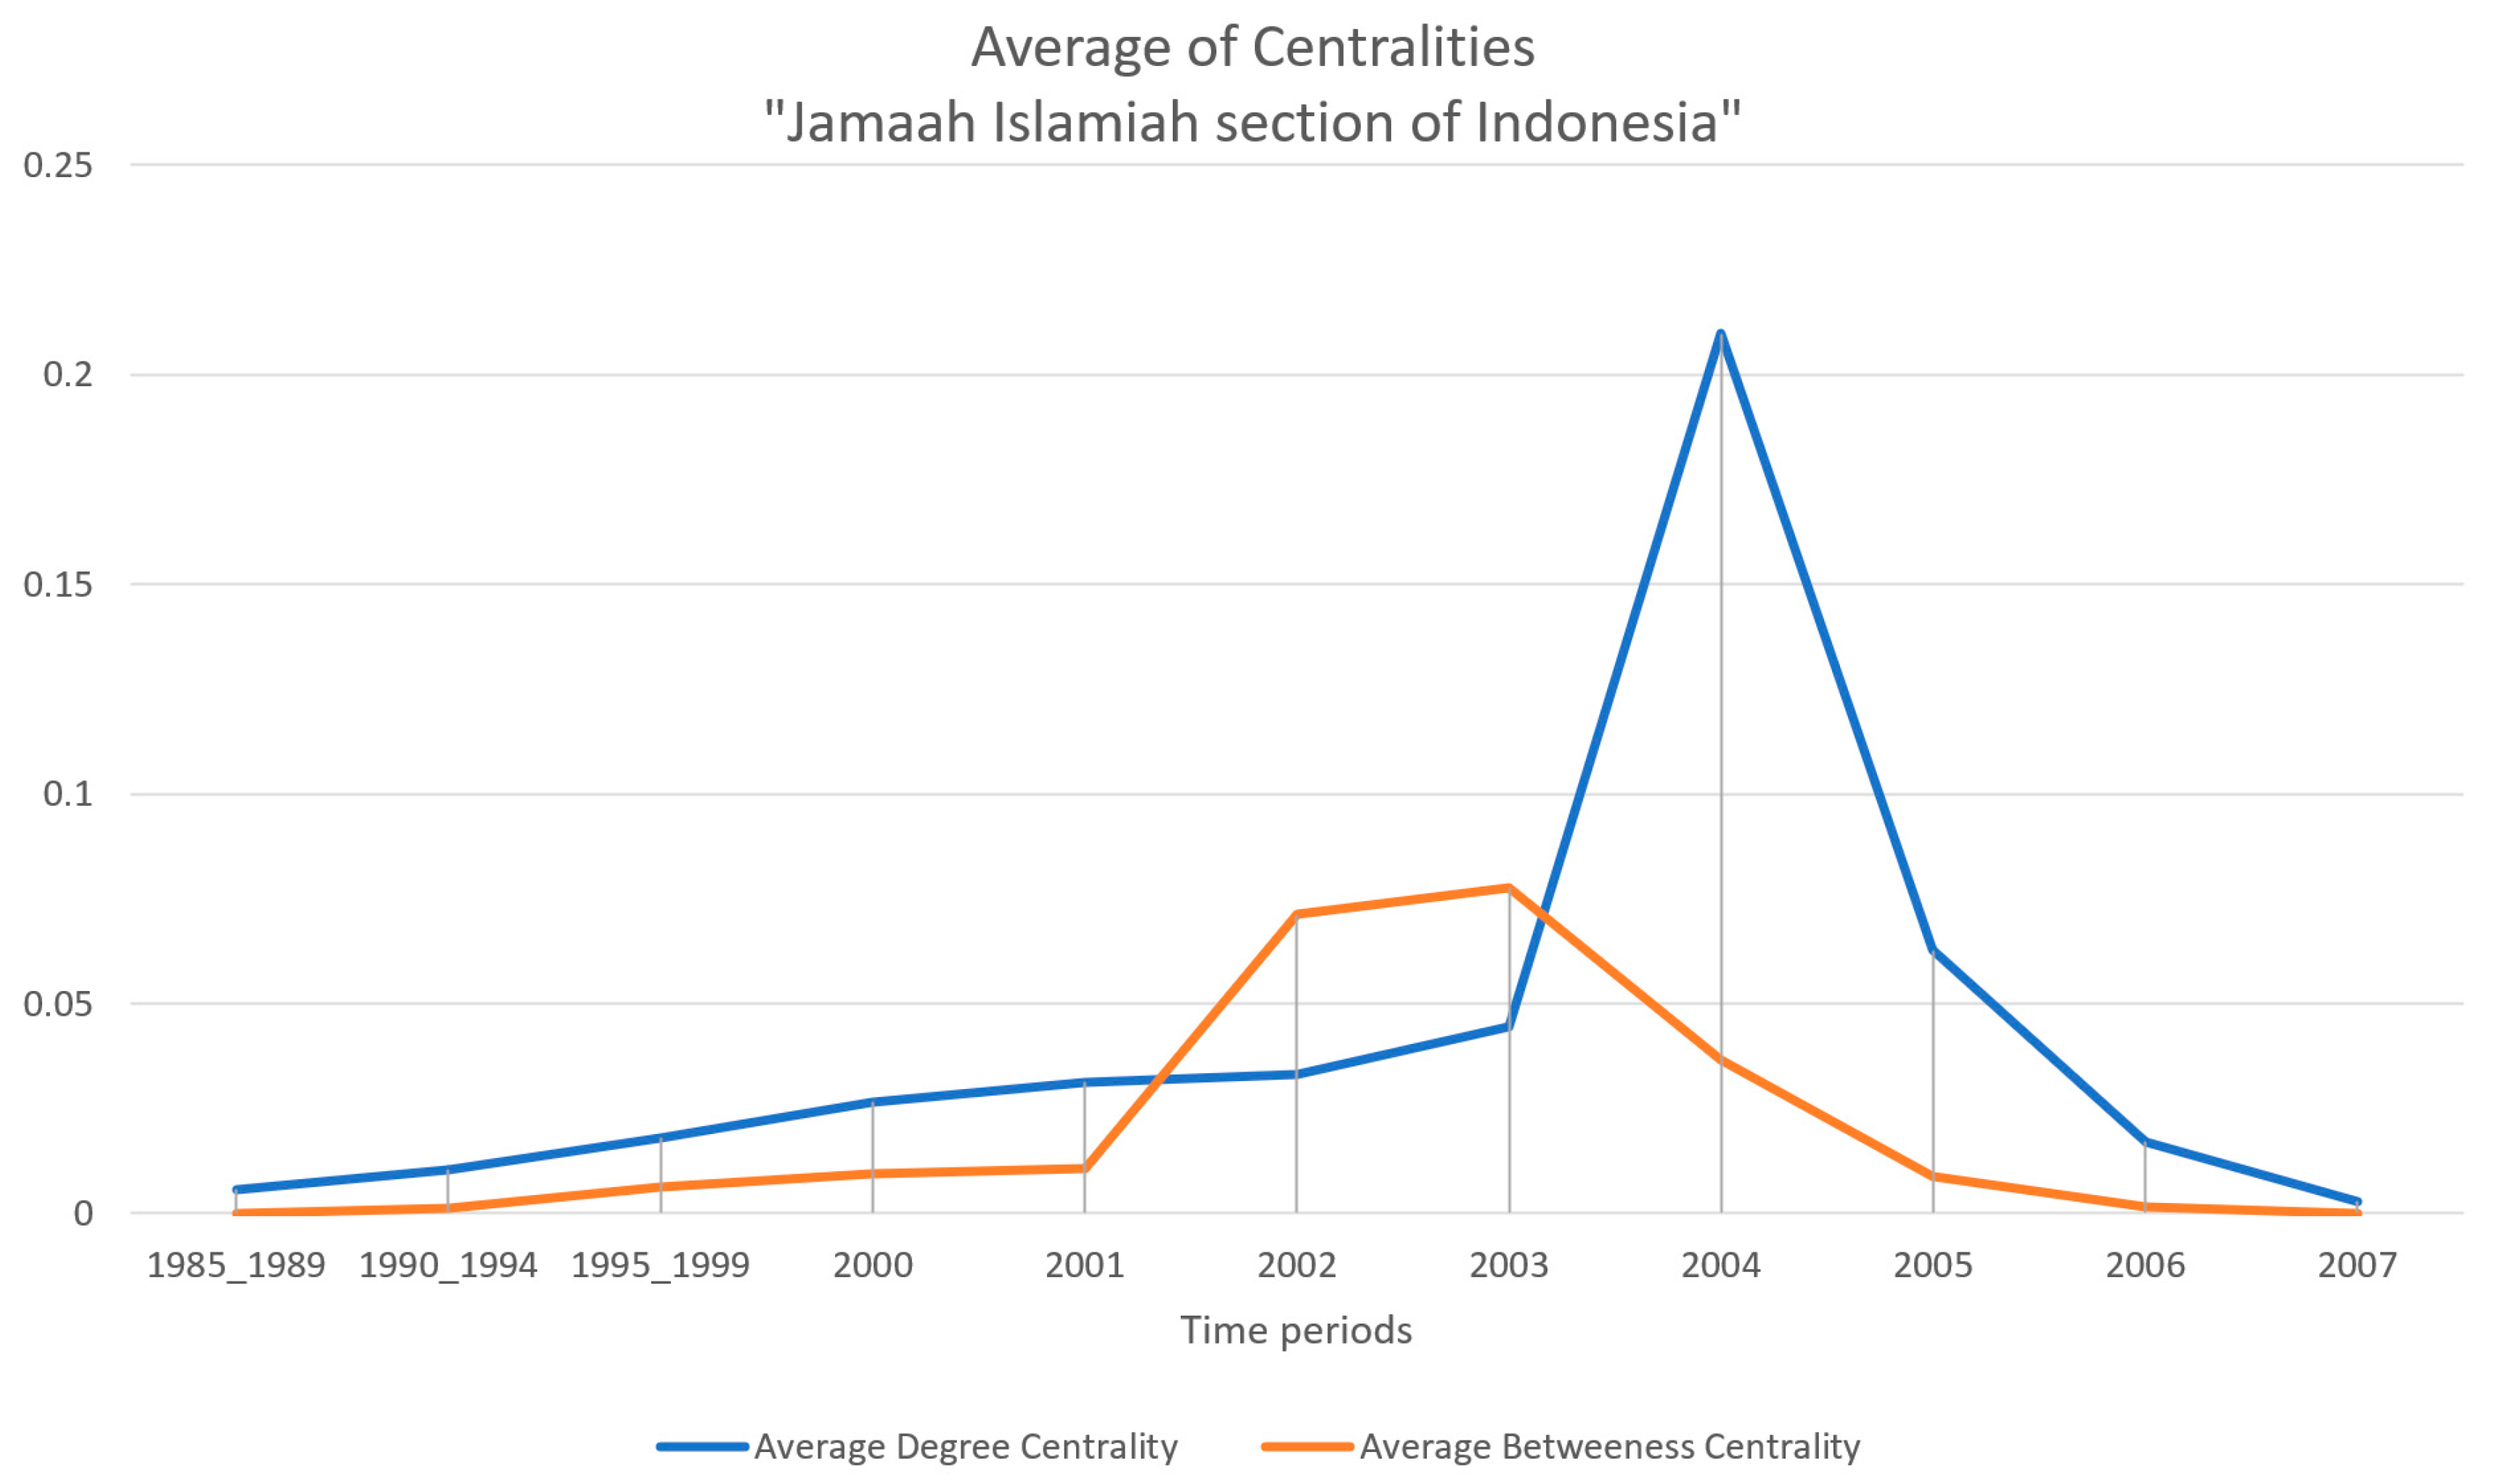
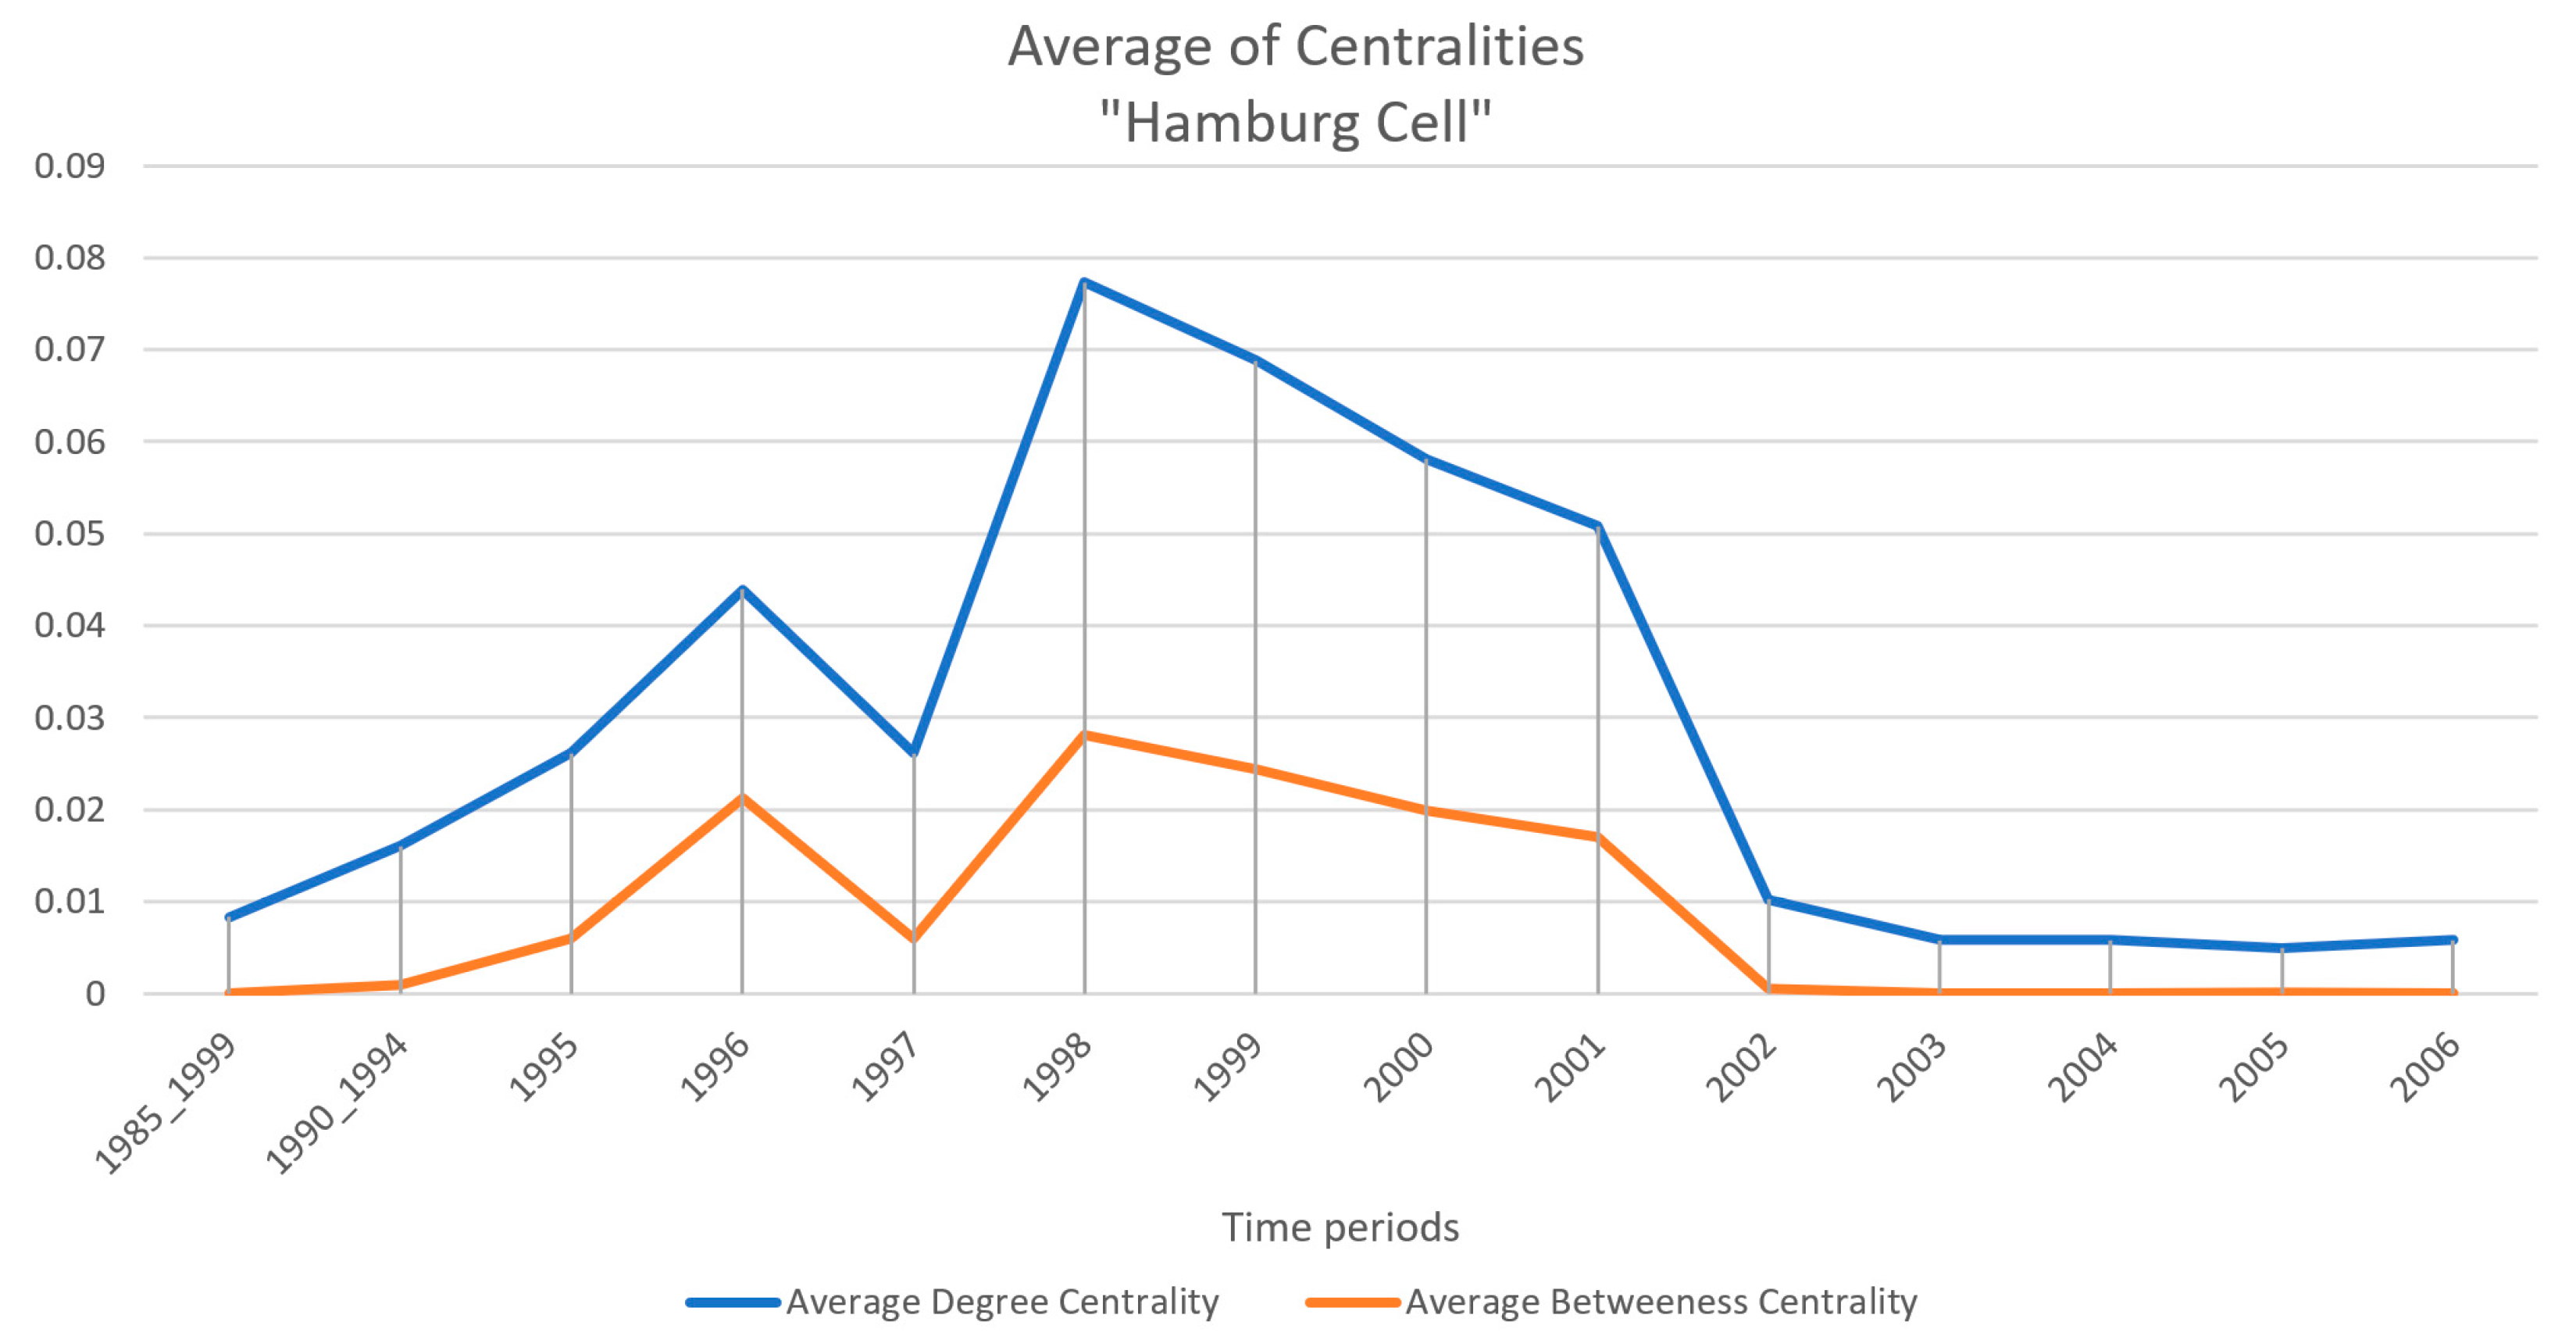
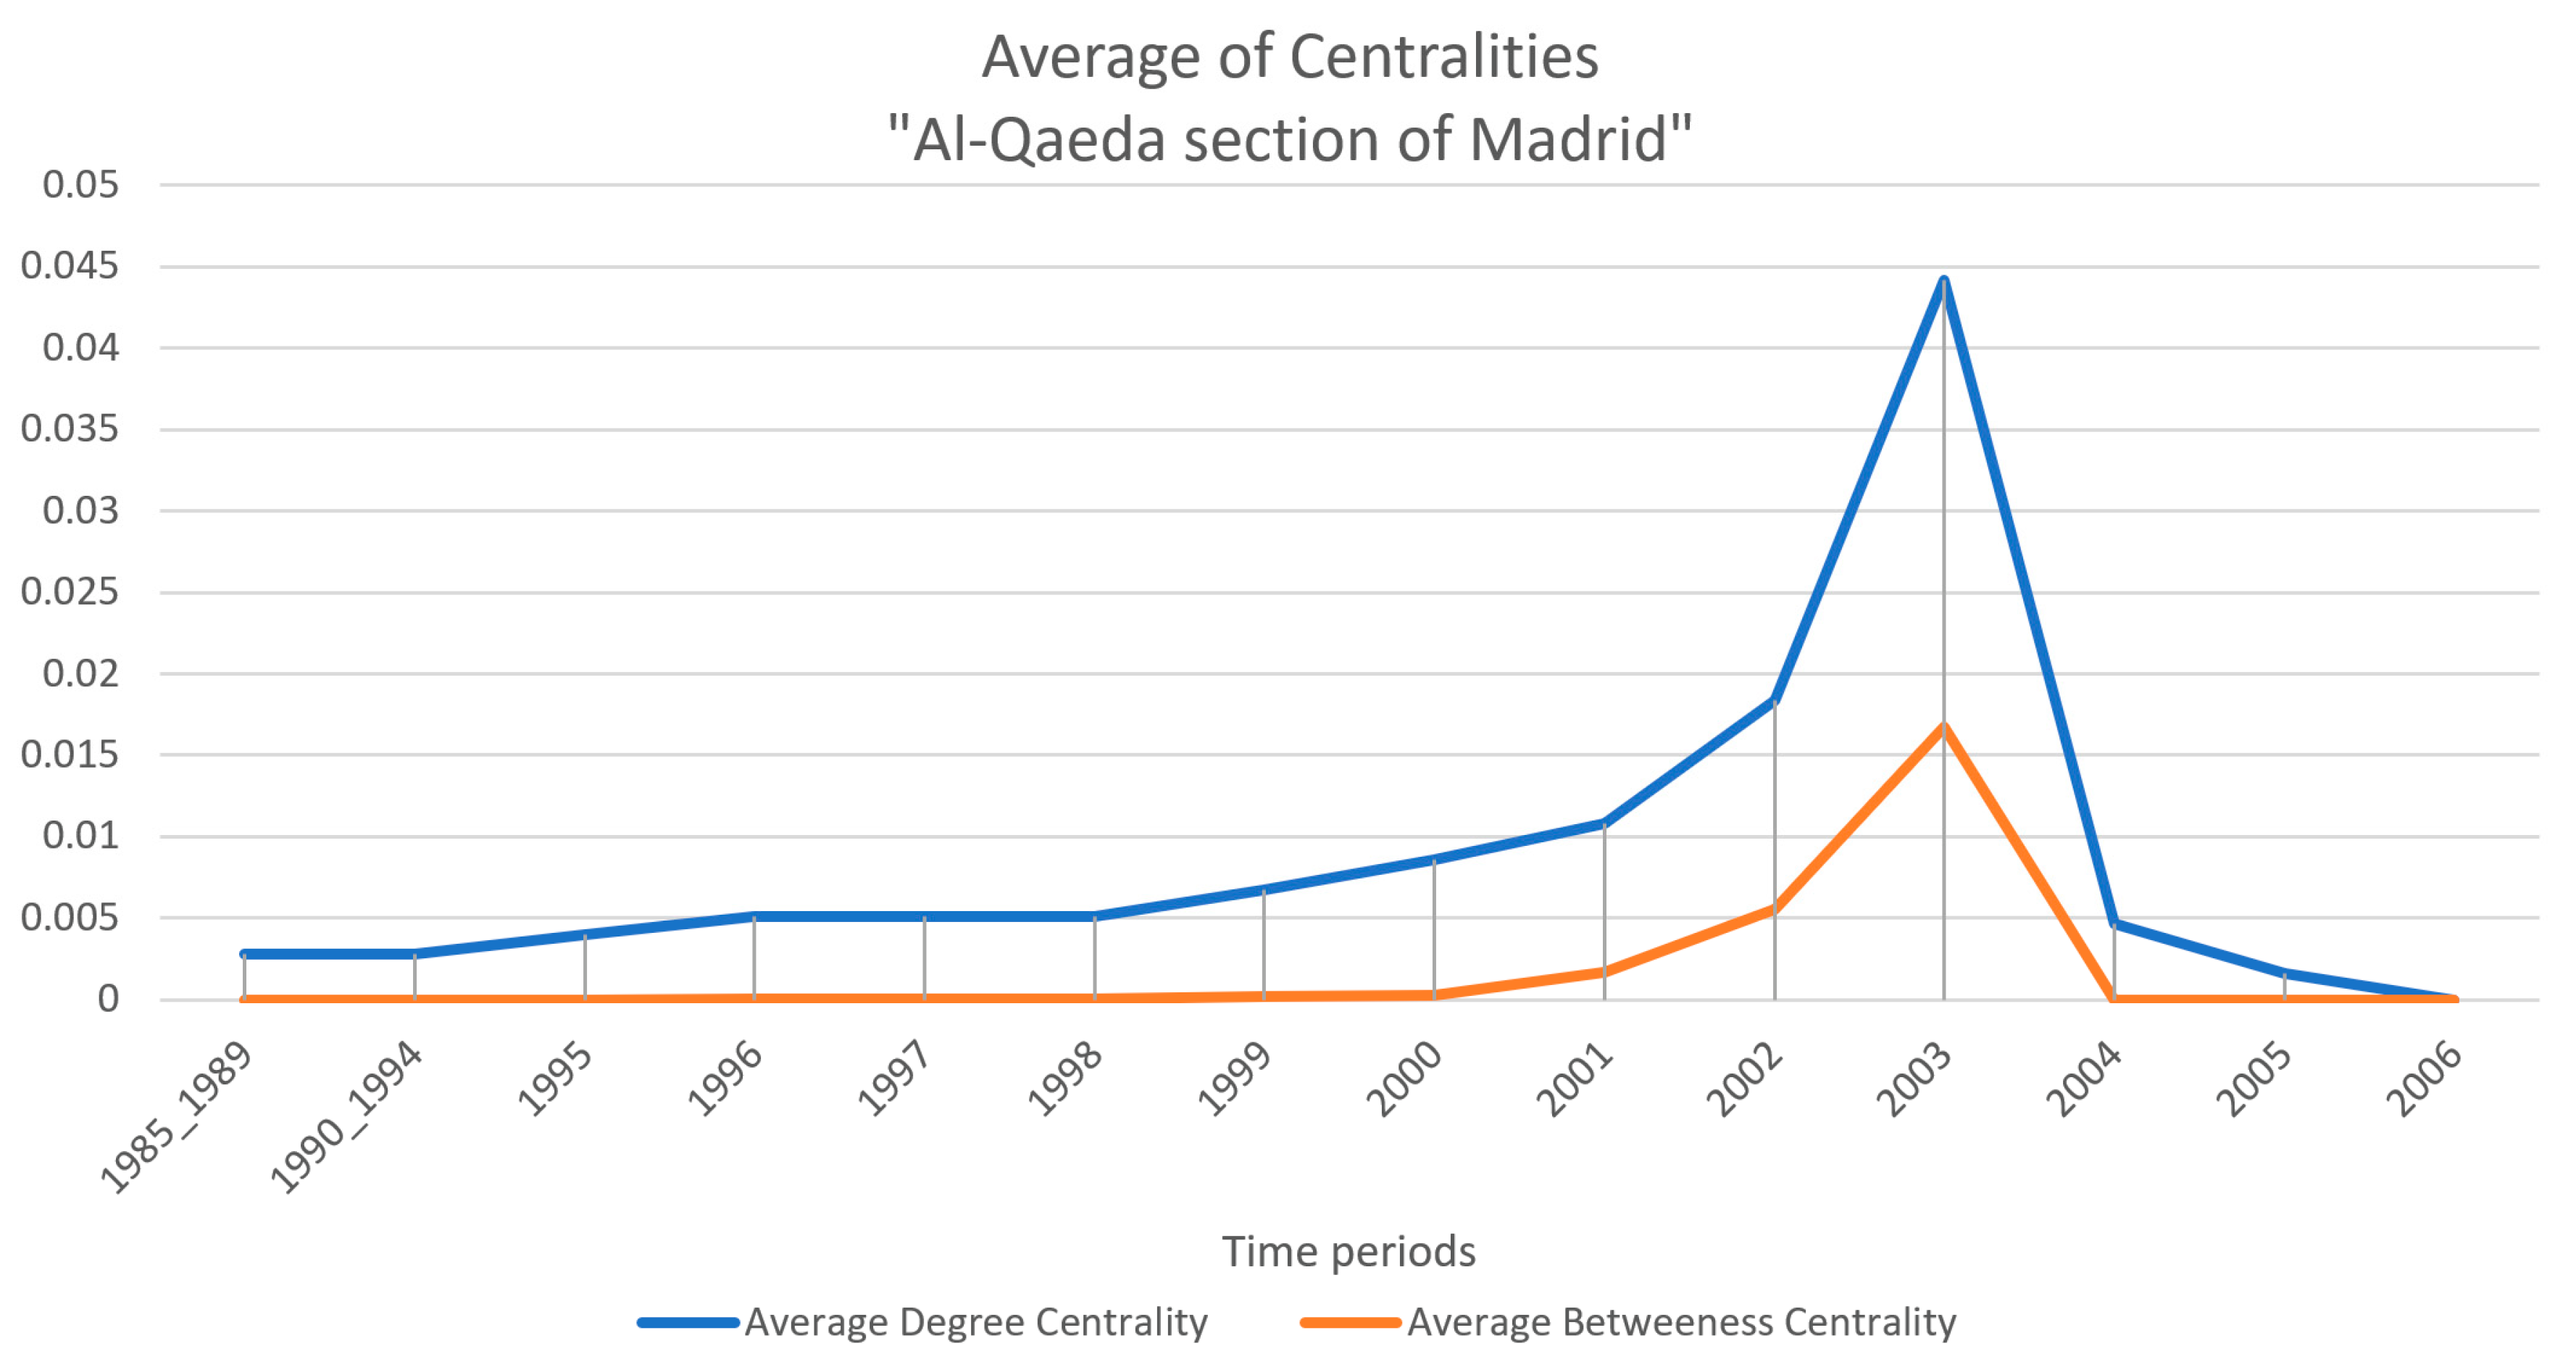
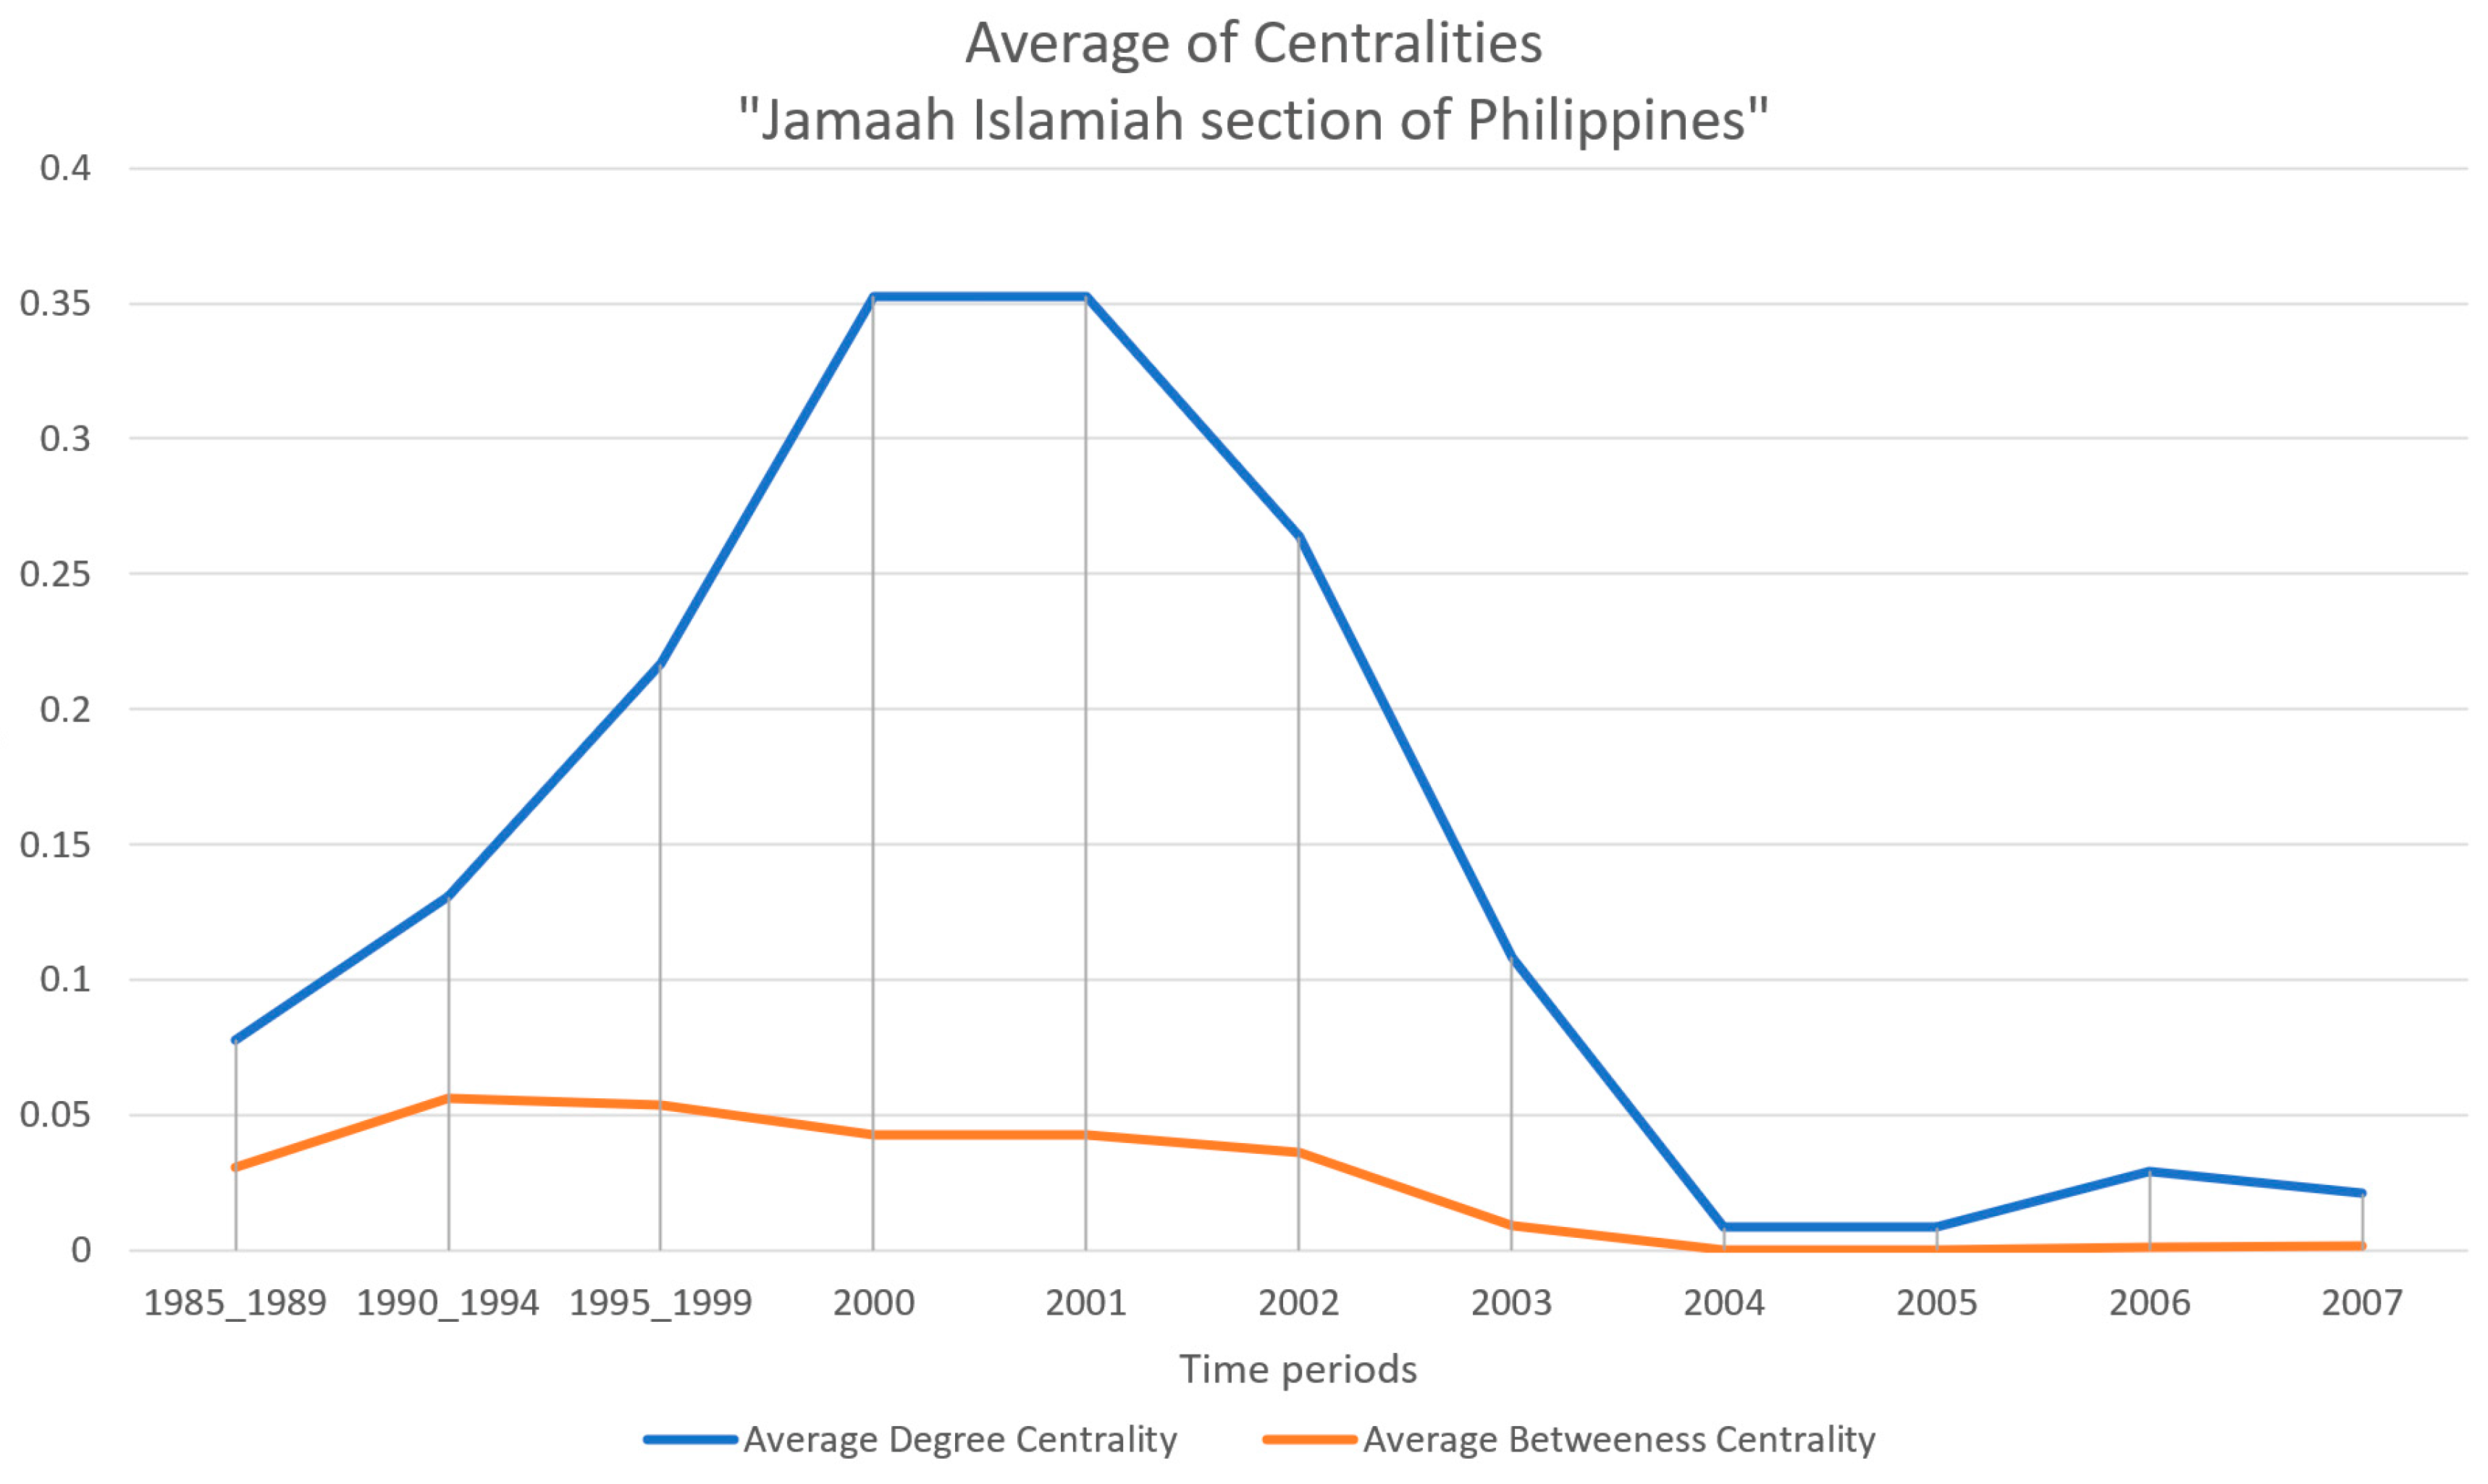
3.5. Temporal Development of Average Degree and Betweenness Centralities

The evolution of the values of the average degree and average betweenness centralities are presented for the networks of the four terrorist organizations, namely: “Jamaah Islamiah section of Indonesia” (Figure 13), “Hamburg Cell” (Figure 14), “Al-Qaeda section of Madrid” (Figure 15) and “Jamaah Islamiah section of Philippines” (Figure 16).

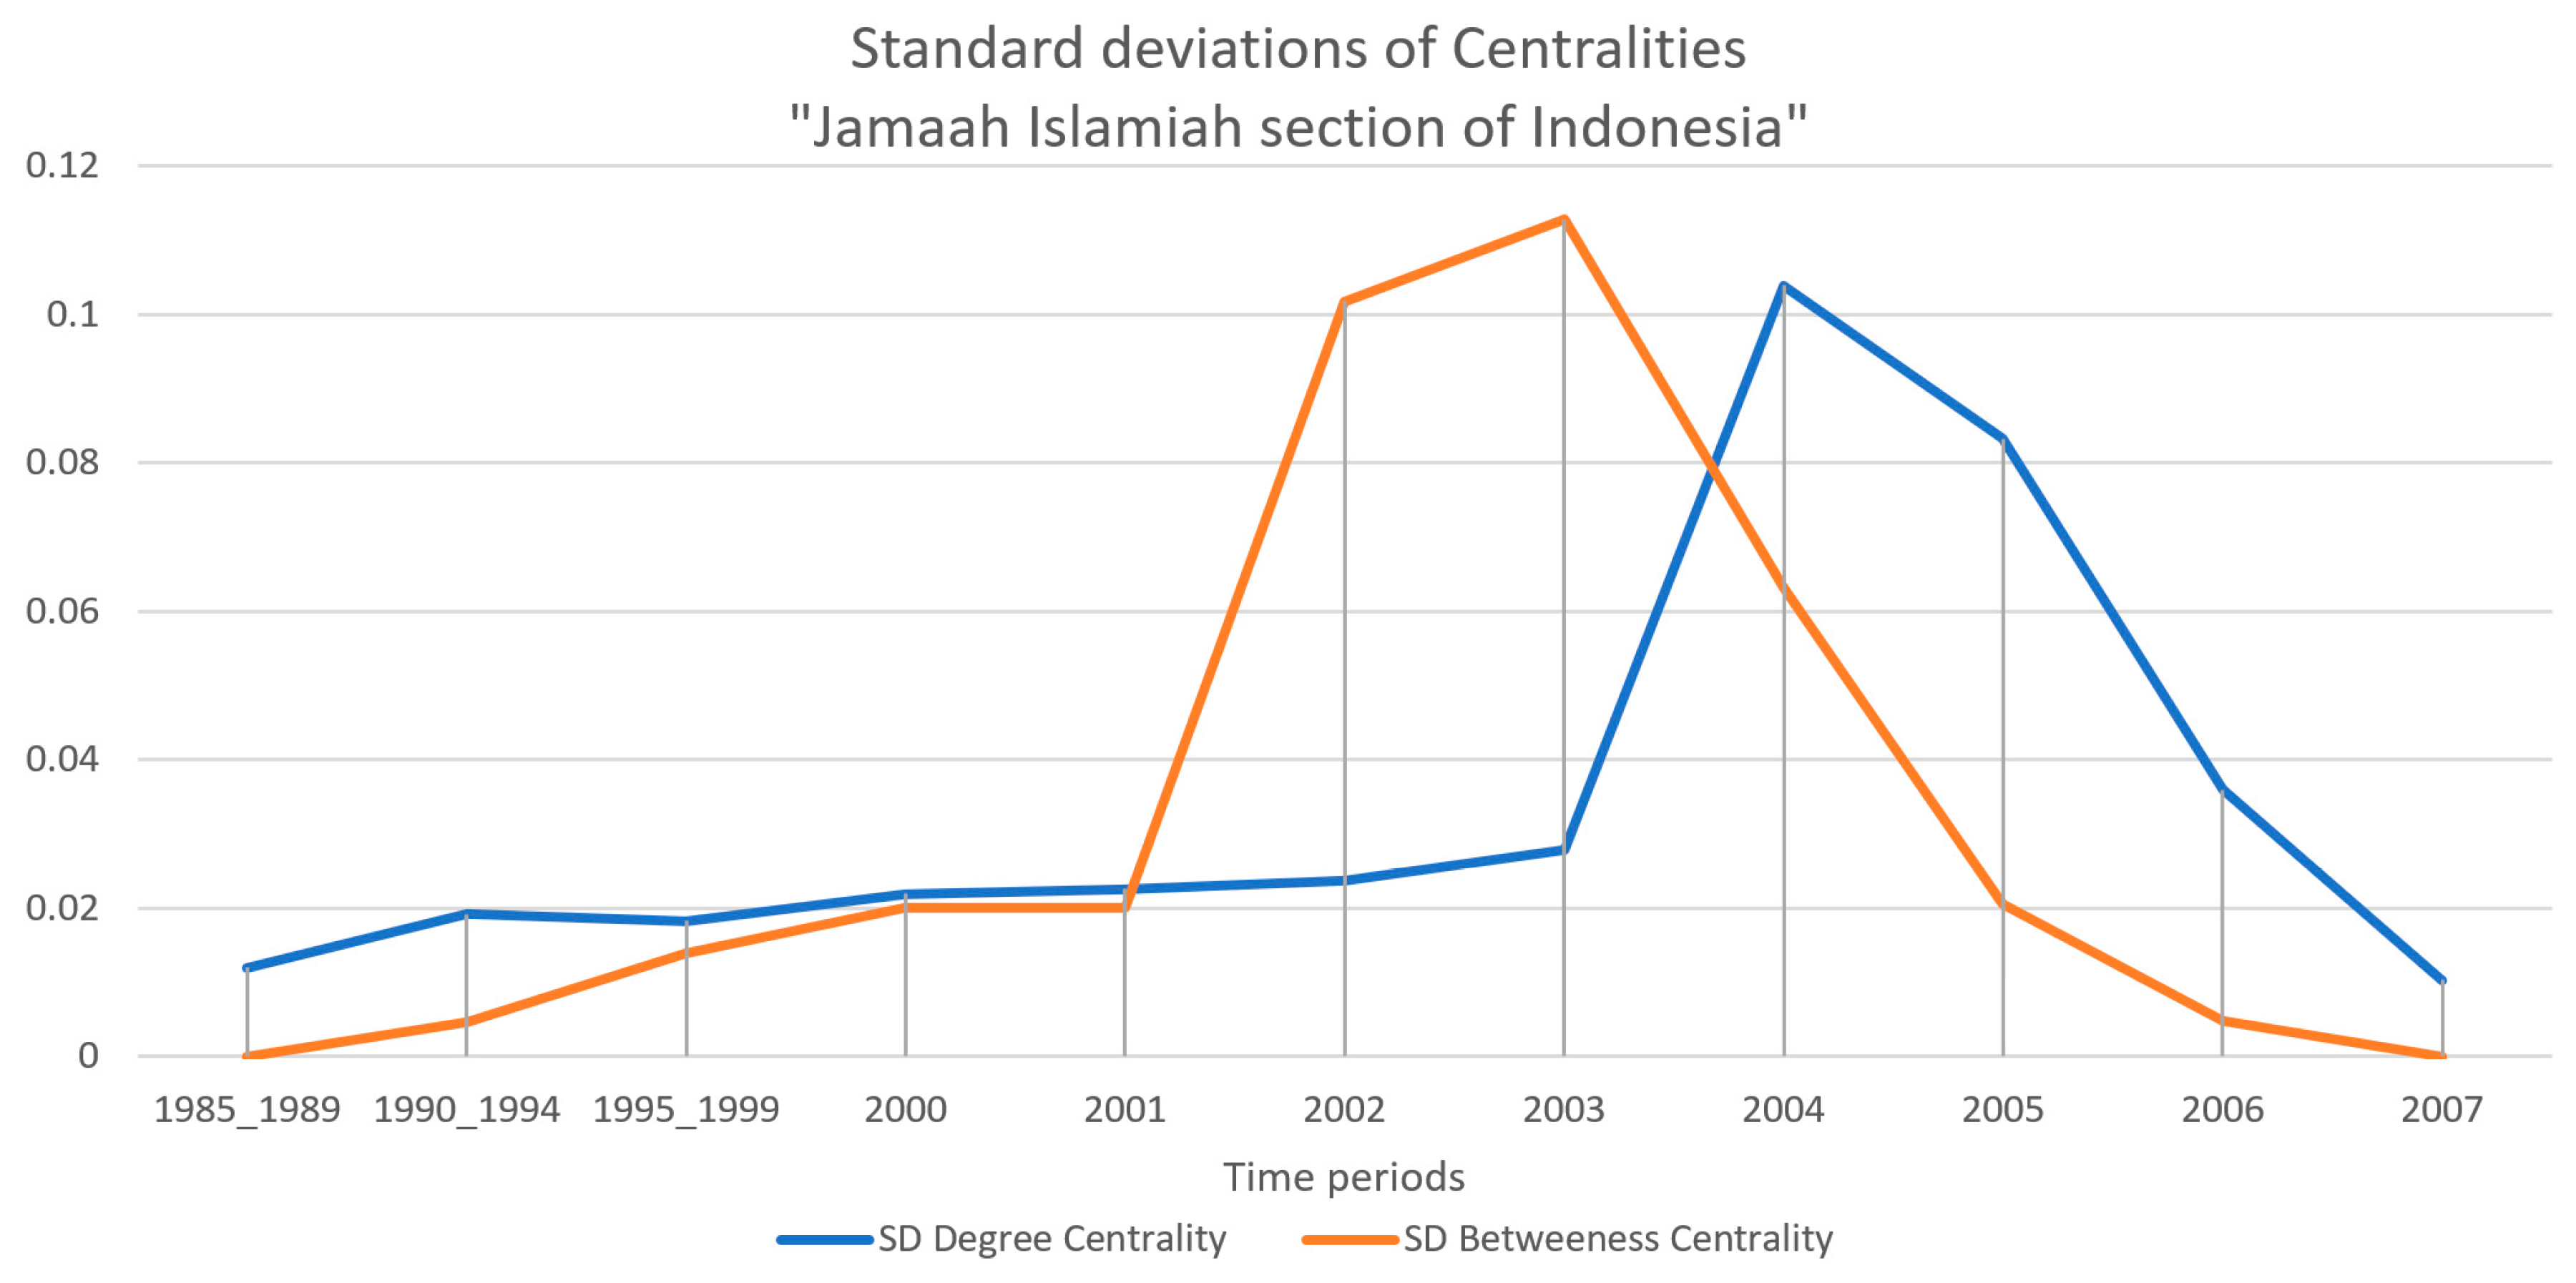
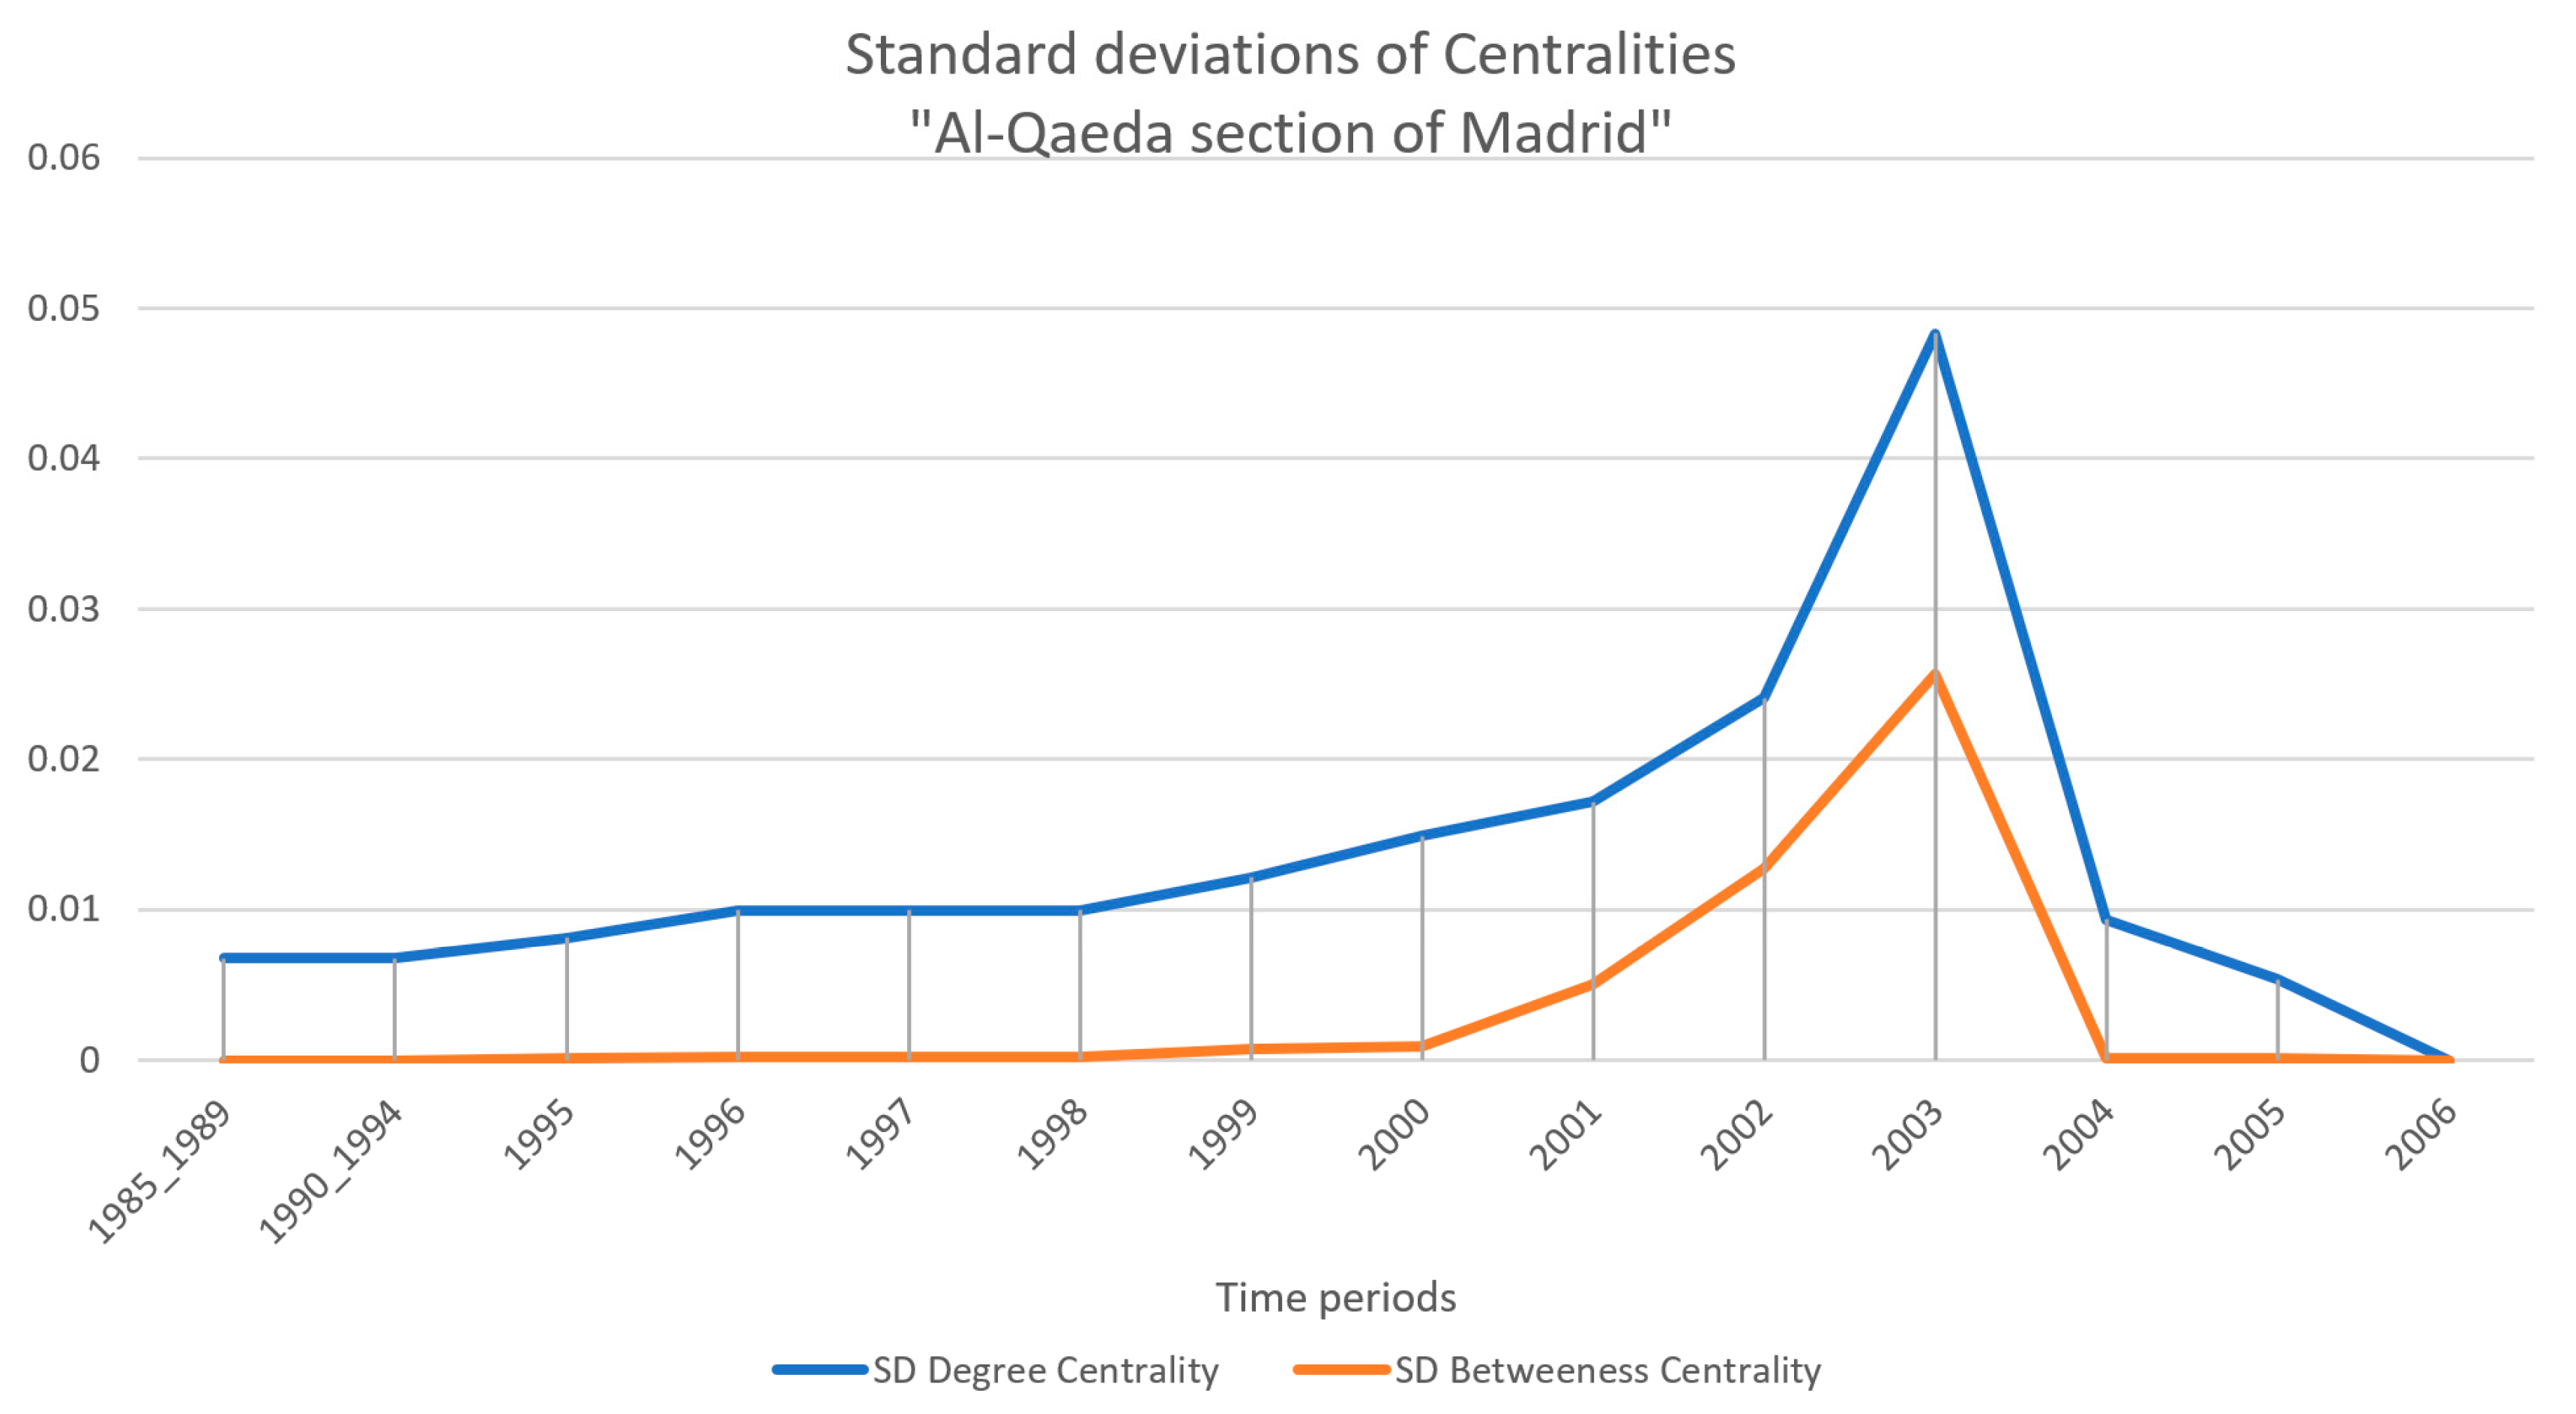
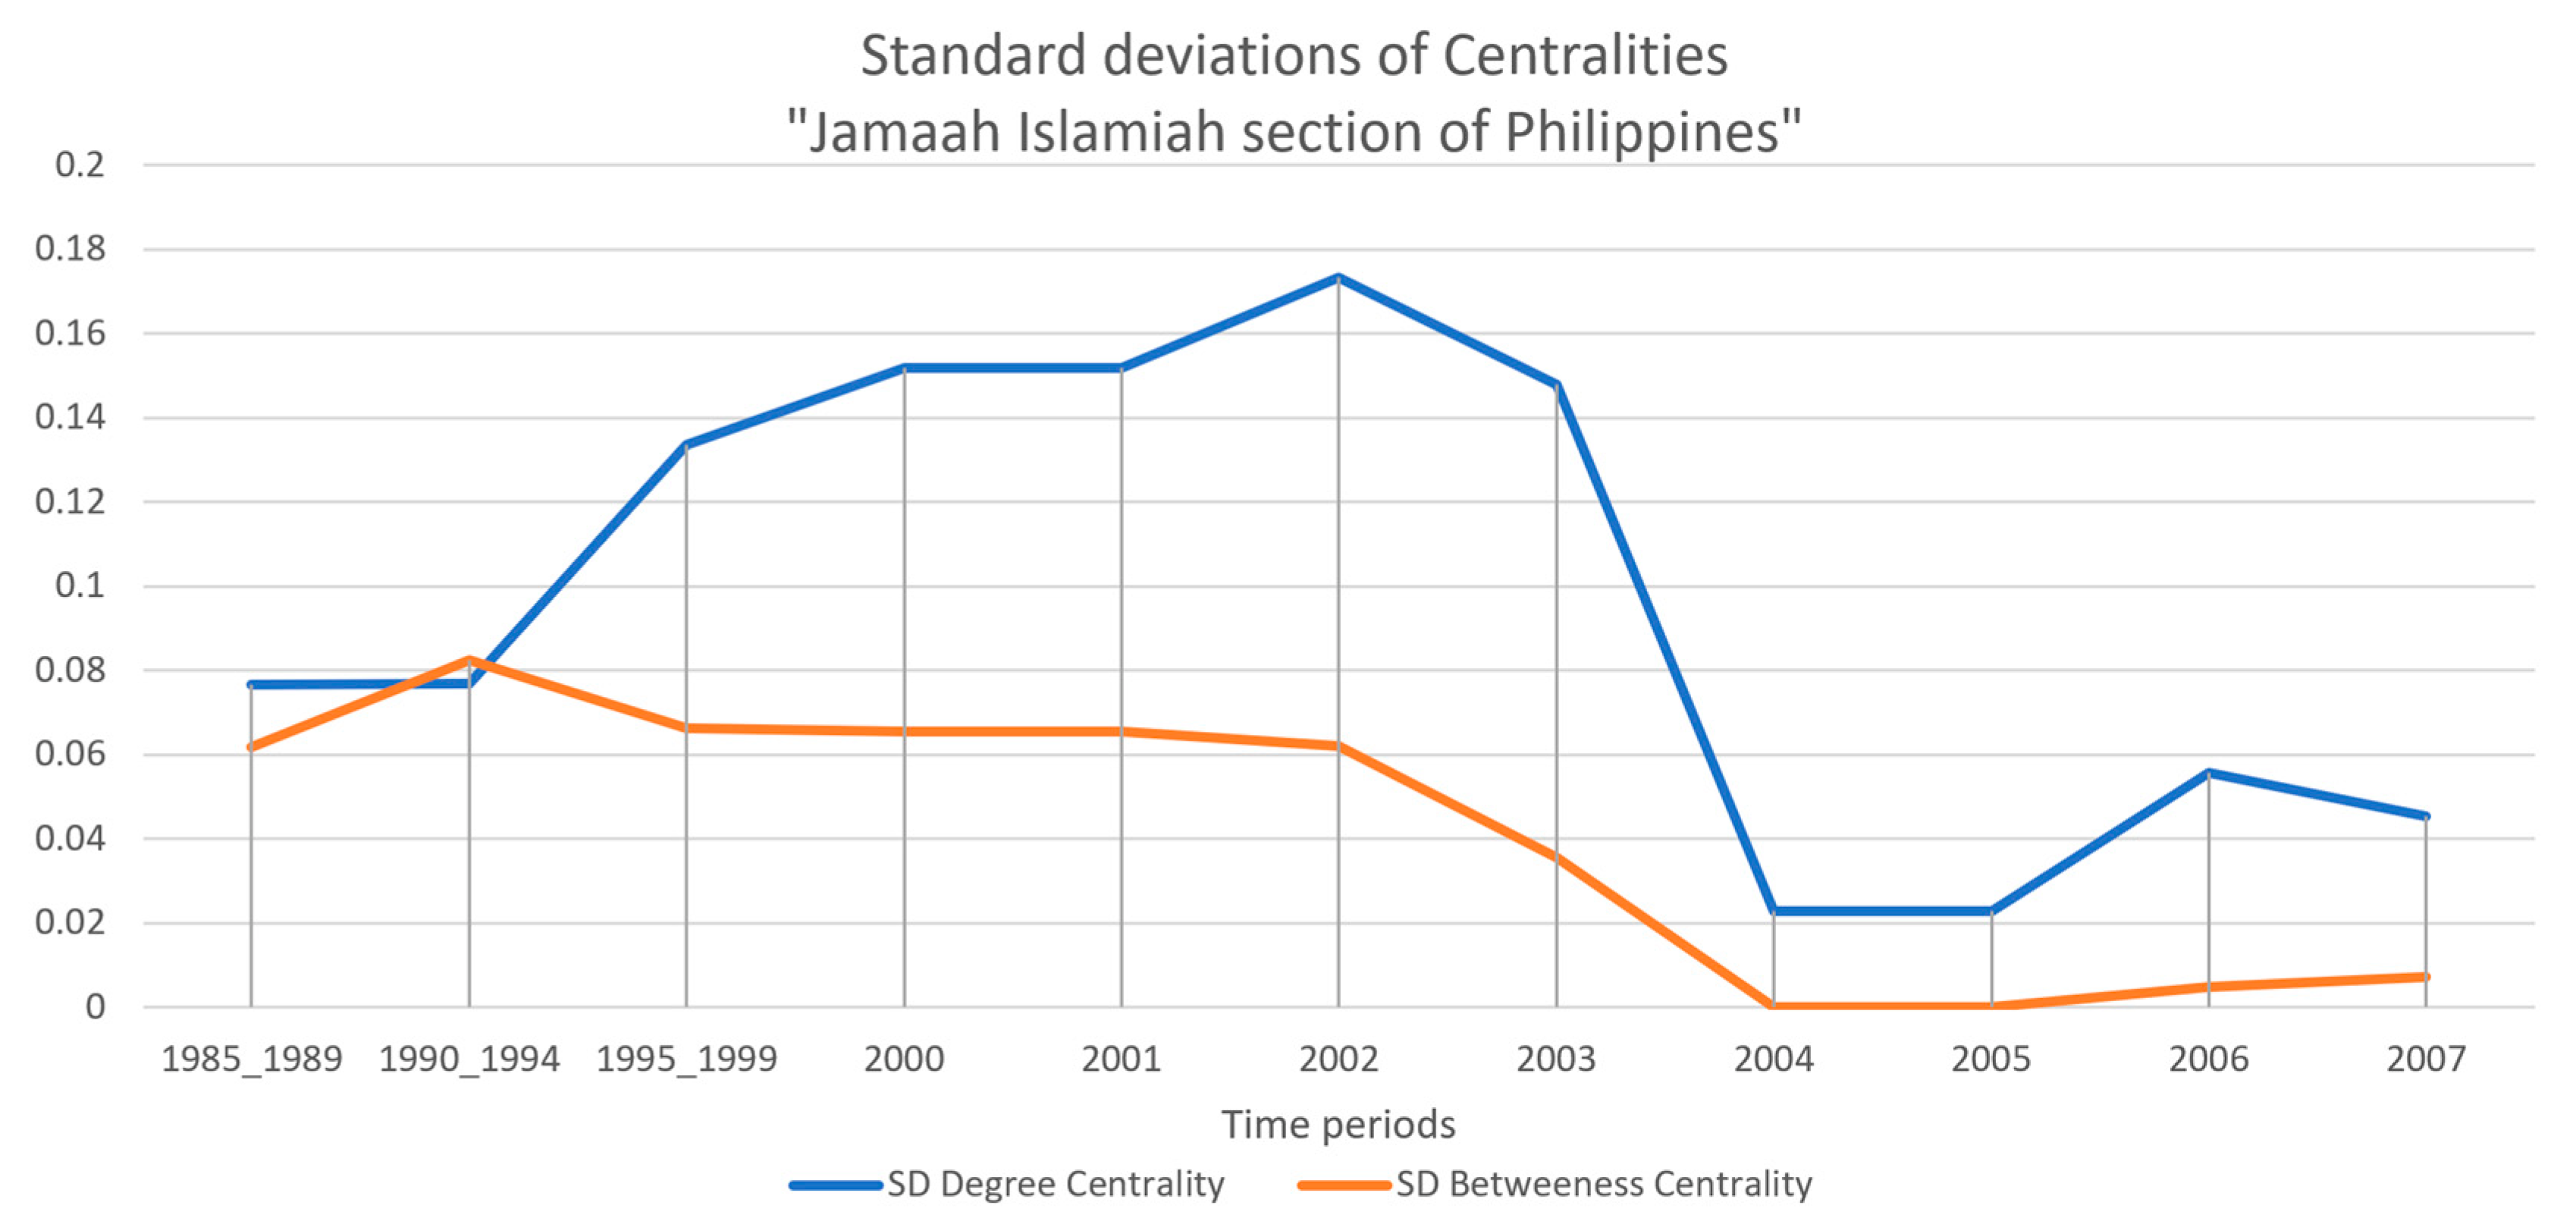
3.6. Temporal Development of Standard Deviation of Degree and Betweenness Centralities

The evolution of the values of the standard deviation of degree centrality and the standard deviation betweenness centrality are presented for the networks of the four terrorist organizations, namely: “Jamaah Islamiah section of Indonesia” (Figure 17), “Hamburg Cell” (Figure 18), “Al-Qaeda section of Madrid” (Figure 19) and “Jamaah Islamiah section of Philippines” (Figure 20).

4. Discussion

As mentioned in Section 2.2, all four networks are weighted and undirected. They differ, however, in the number of nodes and connections. It is important to point out that these organizations acted from 1985 to about 2007, and have radicalized Islam as their point of ideological differentiation. In addition, the data are annual. Therefore, from an investigative perspective, researchers lack the daily imprint enjoyed by law enforcement authorities.
An examination of Figure 5, Figure 6, Figure 7 and Figure 8 shows that communication between the members of each network changes over time. The networks sometimes present a microcosm image, and sometimes do not. These conclusions are of particular interest to law enforcement authorities, as the expected behaviors among common members of a group of people would be for these indicators to show small changes over time. The changes show that the structure of the group is changing. This helps the authorities to conclude that the structure of the organization is also changing. There are periods with a strong distribution of roles, and some others when such a structure is not observed. This is highlighted in Figure 9, Figure 10, Figure 11, Figure 12, Figure 13, Figure 14, Figure 15, Figure 16, Figure 17, Figure 18, Figure 19 and Figure 20. The selected roles (Section 1 and Section 2) are (i) the participators, with many direct contacts, characterized with high degree centrality, and (ii) the mediators, serving as liaison officers connecting the members of the network, therefore characterized by high betweenness centrality.

4.1. Presence of Distinct Roles

The presence of distinct roles for the members of an organization (condition 2 for establishing criminal organization) as participators and/or mediators is revealed by the values of the degree centrality and the betweenness centrality (Section 1).
For the organization “Jamaah Islamiah section of Indonesia”, as clearly shown by Figure 5, the density and small worldness indices peak in the year 2004. Their growth shows a rapid increase immediately after 2003 and a rapid decline after 2004. The same is true of the centralization of degree and betweenness centralities indices, which are depicted in Figure 9. An interesting observation is that betweenness starts increasing earlier than the increase in degree, as confirmed for centralization (Figure 9), for average centralities (Figure 13), and for the standard deviation of centralities (Figure 17). It is clear that distinct roles become more pronounced after 2001, peaking in 2004 and rapidly decreasing afterwards.
For the organization “Hamburg Cell”, the density and small worldness rise slightly in 1996 and decrease in 1997. Then, they peak rapidly in 1998, remaining high with a downward trend until 2001. Then, they decrease sharply (Figure 6). The evolution of degree centralization and betweenness centralization is more or less similar, but with more fluctuations (Figure 10). The temporal development of betweenness centralization precedes the temporal development of degree centralization by one step (year). The same observation can be made on the temporal development of the averages and standard deviations (Figure 14 and Figure 18). It is clear that some distinct roles appear in 1996, and then the presence of roles decreases in 1997. Afterwards, a sudden increase in all indices appears, reaching its maximum in 1998. Strong distinct roles are present until 2001, and afterwards no roles are present.
For the organization “Al-Qaeda section of Madrid”, the density and small worldness peak in 2003, and are rapidly decreasing afterwards (Figure 7). Both the degree centralization and the betweenness centralization reach their maximum in 2003 (Figure 11). As the degree centralization reaches a small plateau in 2000–2001, betweenness centralization continues to grow. Immediately after 2003, both indicators decrease rapidly. The average centralities and the standard deviation of centralities increase rapidly up to 2003, and then also decrease rapidly (Figure 15 and Figure 19). It is clear that distinct roles appear in 2003, then the presence of roles rapidly decreases.
For the organization “Jamaah Islamiah section of Philippines”, the density and small worldness indices show a rapid increase from 1999 to the year 2000, when they peak (Figure 8). Afterwards, they remain at the same level until 2001, and then decrease rapidly. However, the degree and betweenness centralizations fluctuate (Figure 12). Betweenness centralization peaks in 1990–1994, followed by a decline and a new peak in 2002. Afterwards it drops rapidly. The degree centralization increases in the period 1990–1994, then increases until 2000, and after a plateau in 2000–2002, it increases again, reaching a maximum in 2003. Afterwards, it also drops rapidly until 2004. Both indicators slowly increase after 2005, without reaching previous values. The average degree centrality increases slowly from 1985 till 2000, remaining at the maximum value until 2001 and then decreasing until 2004. A slight increase appears in 2005, which drops again in 2006 (Figure 16). The average betweenness centrality increases slowly from 1985 till 1994, and decreases slowly afterwards until 2007 (Figure 16). The temporal development of the standard deviations of degree and betweenness (Figure 20) is more or less similar to the temporal development of centralizations (Figure 12). It is clear that distinct roles appear in 2000; participators then decrease in 2003, while mediators decrease in 2002. An attempt to re-allocate roles appears after 2005, which does not seem to persist beyond this point.

4.2. Relation of the Presence of Distinct Roles with Terrorist Activity

The four organizations show distinctive hierarchical structural changes in time. More specifically, a change in centralization is observed during terrorist actions (2004 for “Jamaah Islamiah section of Indonesia”, Figure 1; during 1998–2001 for “Hamburg Cell”, Figure 2; in 2003 for “Al-Qaeda section of Madrid”, Figure 3; during 2000–2003 for “Jamaah Islamiah section of Philippines”, Figure 4). The changes are also assessed via the presence of distinct roles. It is scientifically interesting and useful for law enforcement authorities to examine whether periods of high values or abrupt changes in the network indicators (Section 3) are associated with actual terrorist activities.
The indicators of the organization “Jamaah Islamiah section of Indonesia” peaked in 2004. This year, the organization carried out a big terrorist attack on the Australian embassy in Jakarta [47].
The members of the organization “Hamburg Cell” had a leading role in the events of 9/11 in New York. From the variation in indices, we can observe the following: (a) The first peak appeared in 1996. This year, the plan for the attack on the twin towers was elaborated, with the recommendation of Khalid Shaikh Mohammed to Bin Laden. (b) The second peak appeared in 1998, when Mohamed Atta, Marwan al-Shehhi and Ramzi Bin al-Shibh moved to Hamburg to organize the core that would carry out the attack. (c) The plateau of high values persisted until 2001, when all indices were rapidly decreasing. This was the year of the big attack [49].
The indicators of the organization “Al-Qaeda section of Madrid” peaked in 2003. That is when the organization carried out a big terrorist attack on a Madrid train at the beginning of the year 2004 [51].
The indicators of the organization “Jamaah Islamiah section of Philippines” are particularly high in the period 2000 to 2001, when a series of major terrorist events took place. Although the degree centralization increased in 2003, the members of the organization did not take part in the big attack, because many of them were arrested. Again in 2005, when the indicators showed a slight upward trend, the actions of the organization were prevented by law enforcement authorities [53].

4.3. Early Signs of Imminent Terrorist Activity

The presence of distinct roles in networks is clearly related to the realization of major terrorist events (Section 4.2). Early signs of imminent terrorist acts would be beneficial to law enforcement authorities, as they could increase reaction time. From this perspective, the changes in betweenness centralization precede the changes in degree centralization in all four organizations (Section 4.1, Figure 9, Figure 10, Figure 11 and Figure 12). It is remarkable that Figure 5, Figure 6, Figure 7, Figure 8, Figure 9, Figure 10, Figure 11, Figure 12, Figure 13, Figure 14, Figure 15, Figure 16, Figure 17, Figure 18, Figure 19 and Figure 20 are more or less homothetic, except for Figure 9, Figure 13 and Figure 17, where a time shift of the peaks can be observed.
In other words, in all four organizations—“Jamaah Islamiah section of Indonesia”, “CellHamburg”, “Al-Qaeda section of Madrid” and “Jamaah Islamiah section of Philippines”—mediators appear before participators in the act of terrorism.

5. Conclusions

The identification of possible members of terrorist organizations and their roles has already been studied with the tools of network analysis combined with entropy [25]. In this work, the research questions Q1, Q2 and Q3 are addressed in terms of the five selected global indicators (density, small worldness, degree centralization and betweenness centralization, average degree centrality and average betweenness centrality, standard deviation of degree centrality and standard deviation of betweenness centrality). The indicators have been computed for four real terrorist networks from four different countries.
Question Q1 has been addressed mainly by degree centralization and betweenness centralization (Section 4.1, Figure 9, Figure 10, Figure 11 and Figure 12). Question Q2 has been addressed by monitoring the fluctuations of all five indicators through time (Section 4.2, Figure 1, Figure 2, Figure 3, Figure 4, Figure 5, Figure 6, Figure 7, Figure 8, Figure 9, Figure 10, Figure 11, Figure 12, Figure 13, Figure 14, Figure 15, Figure 16, Figure 17, Figure 18, Figure 19 and Figure 20). Question Q3 has been addressed only by betweenness centralization, combining the answers to Q1 and Q2 (Section 4.3, Figure 9, Figure 10, Figure 11 and Figure 12).
The variation in indicators (Section 4.1) indicates the presence of distinct roles and responsibilities developed among the members of the organization. This is one of the four conditions for a group to be classified as a “terrorist organization” [2,3]. With the above-described network-based quantitative methodology, law enforcement authorities can rely on objective, unbiased means of proof, disentangled from the subjectivity of witness statements.
A comparison of the variation in the selected indicators with the facts (Section 4.2) shows that periods with an increased level of indices or sharp changes in the indices are periods with highly probable terrorist activity.
The remarkable observation that the changes in betweenness centralization precede the changes in degree centralization in all four organizations (Section 4.1, Figure 9, Figure 10, Figure 11 and Figure 12) is a clear early sign for law enforcement authorities to prepare defenses for a terrorist threat in a timely manner.
This analysis used yearly data, which were available for academic use. However, daily data are available to law enforcement authorities, allowing the real-time monitoring of network indices. The proposed methodology is directly useful to law enforcement authorities in two ways: (a) the procedural proof of the establishment of a terrorist organization is supported by new statistical indicators, and (b) early signs of imminent terrorist acts can be derived from the temporal analysis of relevant statistical indicators.
The proposed methodology is directly applicable to all kinds of telecommunication data. The restriction to physical contact networks is only due to a lack of available data over the several years of observation.

Supplementary Materials

The following supporting information can be downloaded at https://www.mdpi.com/article/10.3390/math10071092/s1, Supplementary Material S1: The results of the calculations of the centralities and the entropies of the “Jamaah Islamiah section of Indonesia”; Supplementary Material S2: The results of the calculations of the centralities and the entropies of the “Hamburg Cell”; Supplementary Material S3: The results of the calculations of the centralities and the entropies of the “Al-Qaeda section of Madrid”; Supplementary Material S4: The results of the calculations of the centralities and the entropies of the “Jamaah Islamiah section of Philippines”.

Author Contributions

Conceptualization, A.Z.S.; methodology, A.Z.S., E.I., C.B., V.T. and I.A.; software, A.Z.S. and G.C.M.; supervision, V.T. and I.A.; writing original draft, A.Z.S.; writing—review and editing, A.Z.S., E.I. and C.B. All authors have read and agreed to the published version of the manuscript.

Funding

This project was funded by subcontracting services of the Aristotle University of Thessaloniki (AUTH).

Data Availability Statement

The data used in this study have been collected and published (freely for academic and research use) by the following organizations: (1) John Jay & ARTIS Transnational Terrorism Database (JJATT). (http://doitapps.jjay.cuny.edu/jjatt/index.php (accessed on 31 December 2021)); (2) Center for Computational Analysis of Social and Organizational Systems (CASOS) at Carnegie Mellon University. (http://www.casos.cs.cmu.edu/tools/datasets/external/index.php (accessed on 31 December 2021)). The humans depicted in the data are represented by code numbers. The number–human correspondence is not provided to the users of the data.

Conflicts of Interest

The authors declare no conflict of interest.

References

  1. Jackson, R.; Smyth, M.B.; Gunning, J. Critical Terrorism Studies: A New Research Agenda; Routledge: London, UK, 2009; ISBN 978-1-134-05051-2. [Google Scholar]
  2. Council of the European Union; European Union. Criminal Offence to Participate in a Criminal Organisation. Off. J. Eur. Union 1998, 31998F0733, 1–3. [Google Scholar]
  3. Council of The European Union. Fight Against Organised Crime. Off. J. Eur. Union. Available online: https://www.consilium.europa.eu/en/policies/eu-fight-against-crime/ (accessed on 1 August 2021).
  4. Pacheco, J.M. Crime as a Complex System: Comment on “Statistical Physics of Crime: A Review” by M.R. D’Orsogna and M. Perc. Phys. Life Rev. 2015, 12, 32–33. [Google Scholar] [CrossRef] [PubMed]
  5. Primicerio, M. The Role of Mathematical Modelling in Modern Criminology: Comment on “Statistical Physics of Crime: A Review” by M.R. D’Orsogna and M. Perc. Phys. Life Rev. 2015, 12, 34–35. [Google Scholar] [CrossRef] [PubMed] [Green Version]
  6. Ribeiro, H.V. We Need More Empirical Investigations and Model Validation for a Better Understanding of Crime: Comment on “Statistical Physics of Crime: A Review” by M.R. D’Orsogna and M. Perc. Phys. Life Rev. 2015, 12, 36–37. [Google Scholar] [CrossRef]
  7. Rodríguez, N. Recent Advances in Mathematical Criminology: Comment on “Statistical Physics of Crime: A Review” by M.R. D’Orsogna and M. Perc. Phys. Life Rev. 2015, 12, 38–39. [Google Scholar] [CrossRef]
  8. D’Orsogna, M.R.; Perc, M. Physics for Better Human Societies: Reply to Comments on “Statistical Physics of Crime: A Review”. Phys. Life Rev. 2015, 12, 40–43. [Google Scholar] [CrossRef]
  9. Kolaczyk, E.D.; Csárdi, G. Network Topology Inference. In Statistical Analysis of Network Data with R; Springer International Publishing: Cham, Switzerland, 2020; pp. 115–140. ISBN 978-3-030-44129-6. [Google Scholar]
  10. Freeman, L.C. Centrality in Social Networks Conceptual Clarification. Soc. Netw. 1978, 1, 215–239. [Google Scholar] [CrossRef] [Green Version]
  11. Wasserman, S.; Faust, K. Social Network Analysis: Methods and Applications; Cambridge University Press: Cambridge, MA, USA, 1994; ISBN 978-0-521-38707-1. [Google Scholar]
  12. Restrepo, J.G.; Ott, E.; Hunt, B.R. Characterizing the Dynamical Importance of Network Nodes and Links. Phys. Rev. Lett. 2006, 97, 094102. [Google Scholar] [CrossRef] [PubMed] [Green Version]
  13. Rodríguez, J.A.; Estrada, E.; Gutiérrez, A. Functional Centrality in Graphs. Linear Multilinear Algebra 2007, 55, 293–302. [Google Scholar] [CrossRef] [Green Version]
  14. Klein, D.J. Centrality Measure in Graphs. J. Math. Chem. 2010, 47, 1209–1223. [Google Scholar] [CrossRef]
  15. Boldi, P.; Vigna, S. Axioms for Centrality. Internet Math. 2014, 10, 222–262. [Google Scholar] [CrossRef] [Green Version]
  16. Hughes, C.E.; Bright, D.A.; Chalmers, J. Social Network Analysis of Australian Poly-Drug Trafficking Networks: How Do Drug Traffickers Manage Multiple Illicit Drugs? Soc. Netw. 2017, 51, 135–147. [Google Scholar] [CrossRef]
  17. Baika, L.; Campana, P. Centrality, Mobility, and Specialization: A Study of Drug Markets in a Non-Metropolitan Area in the United Kingdom. J. Drug Issues 2020, 50, 107–126. [Google Scholar] [CrossRef]
  18. de Bie, J.L.; de Poot, C.J.; Freilich, J.D.; Chermak, S.M. Changing Organizational Structures of Jihadist Networks in the Netherlands. Soc. Netw. 2017, 48, 270–283. [Google Scholar] [CrossRef]
  19. Gutfraind, A.; Genkin, M. A Graph Database Framework for Covert Network Analysis: An Application to the Islamic State Network in Europe. Soc. Netw. 2017, 51, 178–188. [Google Scholar] [CrossRef]
  20. Vespignani, A.; Caldarelli, G. Large Scale Structure and Dynamics of Complex Networks: From Information Technology to Finance and Natural Science; World Scientific: Singapore, 2007; ISBN 978-981-4475-41-9. [Google Scholar]
  21. Estrada, E. The Structure of Complex Networks: Theory and Applications; OUP Oxford: Oxford, UK, 2012; ISBN 978-0-19-959175-6. [Google Scholar]
  22. Newman, M. Networks; Oxford University Press: Oxford, UK, 2018; ISBN 978-0-19-252749-3. [Google Scholar]
  23. Kolaczyk, E.D.; Csárdi, G. Modeling and Prediction for Processes on Network Graphs. In Statistical Analysis of Network Data with R; Springer International Publishing: Cham, Switzerland, 2020; pp. 141–167. ISBN 978-3-030-44129-6. [Google Scholar]
  24. Kolaczyk, E.D.; Csárdi, G. Descriptive Analysis of Network Graph Characteristics. In Statistical Analysis of Network Data with R; Springer International Publishing: Cham, Switzerland, 2020; pp. 43–68. ISBN 978-3-030-44129-6. [Google Scholar]
  25. Spyropoulos, A.Z.; Bratsas, C.; Makris, G.C.; Ioannidis, E.; Tsiantos, V.; Antoniou, I. Entropy and Network Centralities as Intelligent Tools for the Investigation of Terrorist Organizations. Entropy 2021, 23, 1334. [Google Scholar] [CrossRef] [PubMed]
  26. Agreste, S.; Catanese, S.; De Meo, P.; Ferrara, E.; Fiumara, G. Network Structure and Resilience of Mafia Syndicates. Inf. Sci. 2016, 351, 30–47. [Google Scholar] [CrossRef] [Green Version]
  27. Barrat, A.; Barthélemy, M.; Vespignani, A. Dynamical Processes on Complex Networks; Cambridge University Press: Cambridge, MA, USA, 2008; ISBN 978-1-107-37742-4. [Google Scholar]
  28. Opsahl, T.; Agneessens, F.; Skvoretz, J. Node Centrality in Weighted Networks: Generalizing Degree and Shortest Paths. Soc. Netw. 2010, 32, 245–251. [Google Scholar] [CrossRef]
  29. Yang, C.C.; Ng, T.D. New Brunswick, NJ Terrorism and Crime Related Weblog Social Network: Link, Content Analysis and Information Visualization. IEEE Intell. Secur. Inform. 2007, 55–58. [Google Scholar] [CrossRef]
  30. Saramäki, J.; Kivelä, M.; Onnela, J.-P.; Kaski, K.; Kertész, J. Generalizations of the Clustering Coefficient to Weighted Complex Networks. Phys. Rev. E 2007, 75, 027105. [Google Scholar] [CrossRef] [PubMed] [Green Version]
  31. Memon, B.R. Identifying Important Nodes in Weighted Covert Networks Using Generalized Centrality Measures. In Proceedings of the 2012 European Intelligence and Security Informatics Conference, Odense, Denmark, 22–24 August 2012; pp. 131–140. [Google Scholar]
  32. Kolaczyk, E.D.; Csárdi, G. Dynamic Networks. In Statistical Analysis of Network Data with R; Springer International Publishing: Cham, Switzerland, 2020; pp. 207–223. ISBN 978-3-030-44129-6. [Google Scholar]
  33. Chaisson, E.J.; Chaisson, E. Cosmic Evolution: The Rise of Complexity in Nature; Harvard University Press: Cambridge, MA, USA, 2001; ISBN 978-0-674-00987-5. [Google Scholar]
  34. Thurner, S.; Hanel, R.; Klimek, P. Introduction to the Theory of Complex Systems; Oxford University Press: Oxford, UK, 2018; ISBN 978-0-19-255507-6. [Google Scholar]
  35. Holme, P.; Saramaki, J. Temporal Network Theory; Springer: Berlin/Heidelberg, Germany, 2019. [Google Scholar]
  36. Holme, P.; Saramaki, J. Temporal Networks. Phys. Rep. 2012, 519, 97–125. [Google Scholar] [CrossRef] [Green Version]
  37. Wang, J.; Mo, H.; Wang, F. Evolution of Air Transport Network of China 1930–2012. J. Transp. Geogr. 2014, 40, 145–158. [Google Scholar] [CrossRef]
  38. Huang, Y.; Lu, S.; Yang, X.; Zhao, Z. Exploring Railway Network Dynamics in China from 2008 to 2017. ISPRS Int. J. Geo-Inf. 2018, 7, 320. [Google Scholar] [CrossRef] [Green Version]
  39. Humphries, M.D.; Gurney, K. Network ‘Small-World-Ness’: A Quantitative Method for Determining Canonical Network Equivalence. PLoS ONE 2008, 3, e0002051. [Google Scholar] [CrossRef]
  40. Das, K.; Samanta, S.; Pal, M. Study on Centrality Measures in Social Networks: A Survey. Soc. Netw. Anal. Min. 2018, 8, 13. [Google Scholar] [CrossRef]
  41. Kang, S.M. Equicentrality and Network Centralization: A Micro–Macro Linkage. Soc. Netw. 2007, 29, 585–601. [Google Scholar] [CrossRef]
  42. White, D.R.; Borgatti, S.P. Betweenness Centrality Measures for Directed Graphs. Soc. Netw. 1994, 16, 335–346. [Google Scholar] [CrossRef] [Green Version]
  43. John Jay & ARTIS Transnational Terrorism Database. Available online: http://doitapps.jjay.cuny.edu/jjatt/index.php (accessed on 16 December 2021).
  44. CASOS Computational Analysis of Social and Organizational Systems (Carnegie Mellon University). Available online: http://www.casos.cs.cmu.edu/index.php (accessed on 26 June 2021).
  45. John Jay & ARTIS Transnational Terrorism Database Austrailian Embassy Bombing Data Set [Data Set]. 2016. Available online: http://doitapps.jjay.cuny.edu/jjatt/index.php (accessed on 1 August 2021).
  46. Jemaah Islamiyah—Wikipedia. Available online: https://en.wikipedia.org/w/index.php?title=Jemaah_Islamiyah&oldid=1025043319 (accessed on 26 June 2021).
  47. Australian Embassy Bombing in Jakarta-Wikipedia. Available online: https://en.wikipedia.org/wiki/Australian_Embassy_bombing_in_Jakarta (accessed on 10 August 2021).
  48. John Jay & ARTIS Transnational Terrorism Database Hamburg Cell 9/11 [Data Set]. 2001. Available online: http://doitapps.jjay.cuny.edu/jjatt/data.php (accessed on 1 August 2021).
  49. Hamburg Cell—Wikipedia. Available online: https://en.wikipedia.org/w/index.php?title=Hamburg_cell&oldid=977822420 (accessed on 10 August 2021).
  50. John Jay & ARTIS Transnational Terrorism Database Madrid Train Bombing 2004 [Data Set]. 2004. Available online: http://doitapps.jjay.cuny.edu/jjatt/data.php (accessed on 1 August 2021).
  51. Madrid Train Bombings—Wikipedia. 2004. Available online: https://en.wikipedia.org/w/index.php?title=2004_Madrid_train_bombings&oldid=1037095728 (accessed on 10 August 2021).
  52. John Jay & ARTIS Transnational Terrorism Database Phillippines Bombing [Data Set]. 2000. Available online: http://doitapps.jjay.cuny.edu/jjatt/data.php (accessed on 1 August 2021).
  53. Rizal Day Bombings—Wikipedia. Available online: https://en.wikipedia.org/w/index.php?title=Rizal_Day_bombings&oldid=1033689495 (accessed on 10 August 2021).
Figure 1. Temporal development of the Hirarchical structure of “Jamaah Islamiah section of Indonesia”. We observe a change of centralization in 2004.
Mathematics 10 01092 g001
Figure 2. Temporal development of the hierarchical structure of “Hamburg Cell”. We observe a change of centralization during 1998–2001.
Mathematics 10 01092 g002
Figure 3. Temporal development of the hierarchical structure of “Al-Qaeda section of Madrid”. We observe a change of centralization in 2003.
Mathematics 10 01092 g003
Figure 4. Temporal development of the hierarchical structure of “Jamaah Islamiah section of Philippines”. We observe a change of centralization during 2000–2003.
Mathematics 10 01092 g004
Figure 5. Temporal development of density and small worldness for the “Jamaah Islamiah section of Indonesia”. Both density and small worldness increase rapidly starting in 2003, reaching a maximum in 2004 and decreasing rapidly, falling to zero in 2005. The observed temporal development is more pronounced for small worldness, by an order of magnitude. More specifically, the small worldness increase is about by 3000%, while the density increase is about 200%.
Mathematics 10 01092 g005
Figure 6. Temporal development of density and small worldness for the “Hamburg Cell”. Both indices increase in 1996, then decrease in 1997, and then increase rapidly again, reaching a maximum in 1998. Afterwards, both indices decrease slowly till 2001, and then decrease rapidly. The observed temporal increase in 1996 is about 45% for small woldrness and about 65% for density, while in 1998 the temporal increase is the same for both (about 250%).
Mathematics 10 01092 g006
Figure 7. Temporal development of density and small worldness for the “Al-Qaeda section of Madrid”. Both indices reach a maximum in 2003, increasing rapidly after 2002 and falling rapidly after the maximum value in 2003. Afterwards, both indices decrease slowly till 2001, and then decrease rapidly. The observed temporal increase in 2003 is more or less the same for both (about 200% for the small woldness and 200% for density).
Mathematics 10 01092 g007
Figure 8. Temporal development of density and small worldness for the “Jamaah Islamiah section of Philippines”. Both indices increase till 2000, reach a plateau during 2000 and 2001 and then fall rapidly till 2002. Afterwards, both indices decrease slowly till 2003 and then take values very close to zero. The observed temporal development is more pronounced for small worldness by an order of magnitude. More specifically, the small worlness increase is about 450%, while the density increase is about 50%.
Mathematics 10 01092 g008
Figure 9. Temporal development of degree and betweenness centralizations for the “Jamaah Islamiah section of Indonesia”. Both indices increase, reaching a maximum in 2004, and then decrease. Degree centralization increases rapidly after 2003, and then decreases. Betweenness centralization increases rapidly two years earlier, i.e., after 2001, and then decreases rapidly.
Mathematics 10 01092 g009
Figure 10. Temporal development of degree and betweenness centralizations for the “Hamburg Cell”. Both indices fluctuate, with three maximum values. The first maximum appears in 1996 for both centralizations; the second maximum appears in 1997 for betweenness centralization and one year later for degree centralization, and the third maximum appears in 2000 for betweenness centralization and one year later for degree centralization.
Mathematics 10 01092 g010
Figure 11. Temporal development of degree and betweenness centralizations for the “Al-Qaeda section of Madrid”. Both indices increase, reach a maximum in 2003, and then decrease. In the period 2000–2001, degree centralization reaches a small plateau, while betweenness centralization increases. Both indices rapidly decrease after 2003.
Mathematics 10 01092 g011
Figure 12. Temporal development of degree and betweenness centralizations for the “Jamaah Islamiah section of Philippines”. Both indices fluctuate. Betweenness centralization increases to a maximum in 1994, then decreases up to 1999, before increasing again till 2002, and afterwards it rapidly decreases till 2004. Degree centralization increases from 1994 to 2000, then reaches a plateau at 2002, and afterwards it rapidly decreases up to 2004. Both indices slowly increase after 2005, without reaching their previous values.
Mathematics 10 01092 g012
Figure 13. Temporal development of average degree centrality and average betweenness centrality for the “Jamaah Islamiah section of Indonesia”. Both indices increase, reach a maximum and then decrease. The average degree centrality reaches its maximum in 2004, while the average betweenness centrality does so in 2003.
Mathematics 10 01092 g013
Figure 14. Temporal development of average degree centrality and average betweenness centrality for the “Hamburg Cell”. Both indices fluctuate, with two maximum values in 1996 and 1998. Both indices decrease rapidly after 2001.
Mathematics 10 01092 g014
Figure 15. Temporal development of average degree centrality and average betweenness centrality for the “Al-Qaeda section of Madrid”. Both indices increase, reach a maximum in 2003 and then decrease rapidly.
Mathematics 10 01092 g015
Figure 16. Temporal development of average degree centrality and average betweenness centrality for the “Jamaah Islamiah section of Philippines”. Both indices increase, reach a maximum and then decrease. The average degree centrality reaches a maximum in 2000 and rapidly decreases from 2001 to 2004; it starts increasing slowly again one year later. The average betweenness centrality reaches a maximum in 1994, decreases slowly up to 2002 and then rapidly decreases to zero by 2004, without increasing again afterwards.
Mathematics 10 01092 g016
Figure 17. Temporal development of the standard deviation of degree centrality and the standard deviation of betweenness centrality for the “Jamaah Islamiah section of Indonesia”. Both indices increase, reach a maximum and then decrease. The average degree centrality reaches a maximum in 2004, while the average betweenness centrality does so in 2003.
Mathematics 10 01092 g017
Figure 18. Temporal development of the standard deviation of degree centrality and the standard deviation of betweenness centrality for the “Hamburg Cell”. Both indices fluctuate, with two maximum values in 1996 and 1998. Both indices decrease rapidly after 2001.
Mathematics 10 01092 g018
Figure 19. Temporal development of the standard deviation of degree centrality and the standard deviation of betweenness centrality for the “Al-Qaeda section of Madrid”. Both indices increase, reach a maximum in 2003 and then decrease rapidly.
Mathematics 10 01092 g019
Figure 20. Temporal development of the standard deviation of degree centrality and the standard deviation of betweenness centrality for the “Jamaah Islamiah section of Philippines”. Both indices increase, reach a maximum and then decrease. The average degree centrality reaches a maximum in 2002 and rapidly decreases from 2003 to 2004; it then starts increasing slowly one year later. The average betweenness centrality reaches a maximum in 1994, decreases slowly till 2002, and then rapidly decreasing to zero by 2004, before starting to increase slowly one year later.
Mathematics 10 01092 g020
Publisher’s Note: MDPI stays neutral with regard to jurisdictional claims in published maps and institutional affiliations.

