1. Introduction
Transport and mobility (T&M) activities represent a key sector in global economies. It not only plays an important role in the social and economic development of modern societies, but is also an important source of energy consumption that causes significant environmental and social problems. The emergence of demand-based economics (services) and e-commerce (products) has exponentially increased the number of T&M operations in urban and metropolitan areas. Thus, T&M activities have a profound effect on the development of so-called smart cities, the scope of which combines sustainable development with intelligent management of real-time data collected through IoT devices (e.g., sensors, cameras, etc.) and analyzed through cloud systems to improve the performance of various services in urban areas [
1]. In recent years, city governments have implemented various action plans in order to make cities more energy efficient and environmentally sustainable. The instances of new mobility paradigms are car-sharing and ride-sharing, which are becoming ever more popular in modern cities. In addition, due to the increase in zero-emission vehicles (electric vehicles, bicycles, etc.) in our cities, we have to face strategic planning and operational challenges [
2]. For example, smart cities must ensure that there are enough charge stations for electric-based vehicles and parking stations for car-sharing mobility. In addition, the dynamics of smart cities require the provision of efficient real-time routing plans to ridesharing mobility and autonomous vehicles. Therefore, we need a new family of “agile” algorithms that are able to provide real-time routing plans and re-compute them as new data on the traffic status is obtained and processed. The success of these real-time algorithms is based on the use of IoT, which provides a continuous data stream on the state of traffic in the city. This data stream is used to feed these optimization algorithms with continuous and contextualized knowledge about system changes with a high degree of confidence.
To generate this data stream, smart cities are fully connected using an IoT platform that will dynamically gather real-time information about the city. This platform is made up of different components that allow data flow from sensors, cameras, or on-board units (OBUs) embedded in vehicles to internet gateways, or road side units (RSUs), where the raw data will be pre-processed before moving it to the edge or fog computing servers, where these data will be fully processed, filtered, normalized, and analyzed to yield real-time analytics. Larger amounts of data, however, can be very useful to obtain meaningful insights for short and mid-term action. Therefore, data will also be stored in a data warehouse at the cloud level for later processing. This will allow to perform cognitive, descriptive, predictive, or prescriptive models using analytics algorithms, thus enhancing the solutions provided by the optimization algorithms.
In order to exploit the full potential of IoT, governments promote open data initiatives to facilitate the quick development of new services in smart cities. This creates the opportunity of remotely track, manage, and control devices that generate new intuition and usable information from massive stream of real-time data. In addition, it brings different advantages in optimizing public services [
3,
4]. One of the main services that is becoming essential in smart cities is the effective waste management [
5]. Traditionally, waste management made use of models and technologies to optimize waste collection, storage, and disposal methods, such as geographical information systems (GIS), or routing and scheduling optimization methods [
6]. However, due to the lack of IoT platforms, real-time decisions could not be possible, causing additional costs.
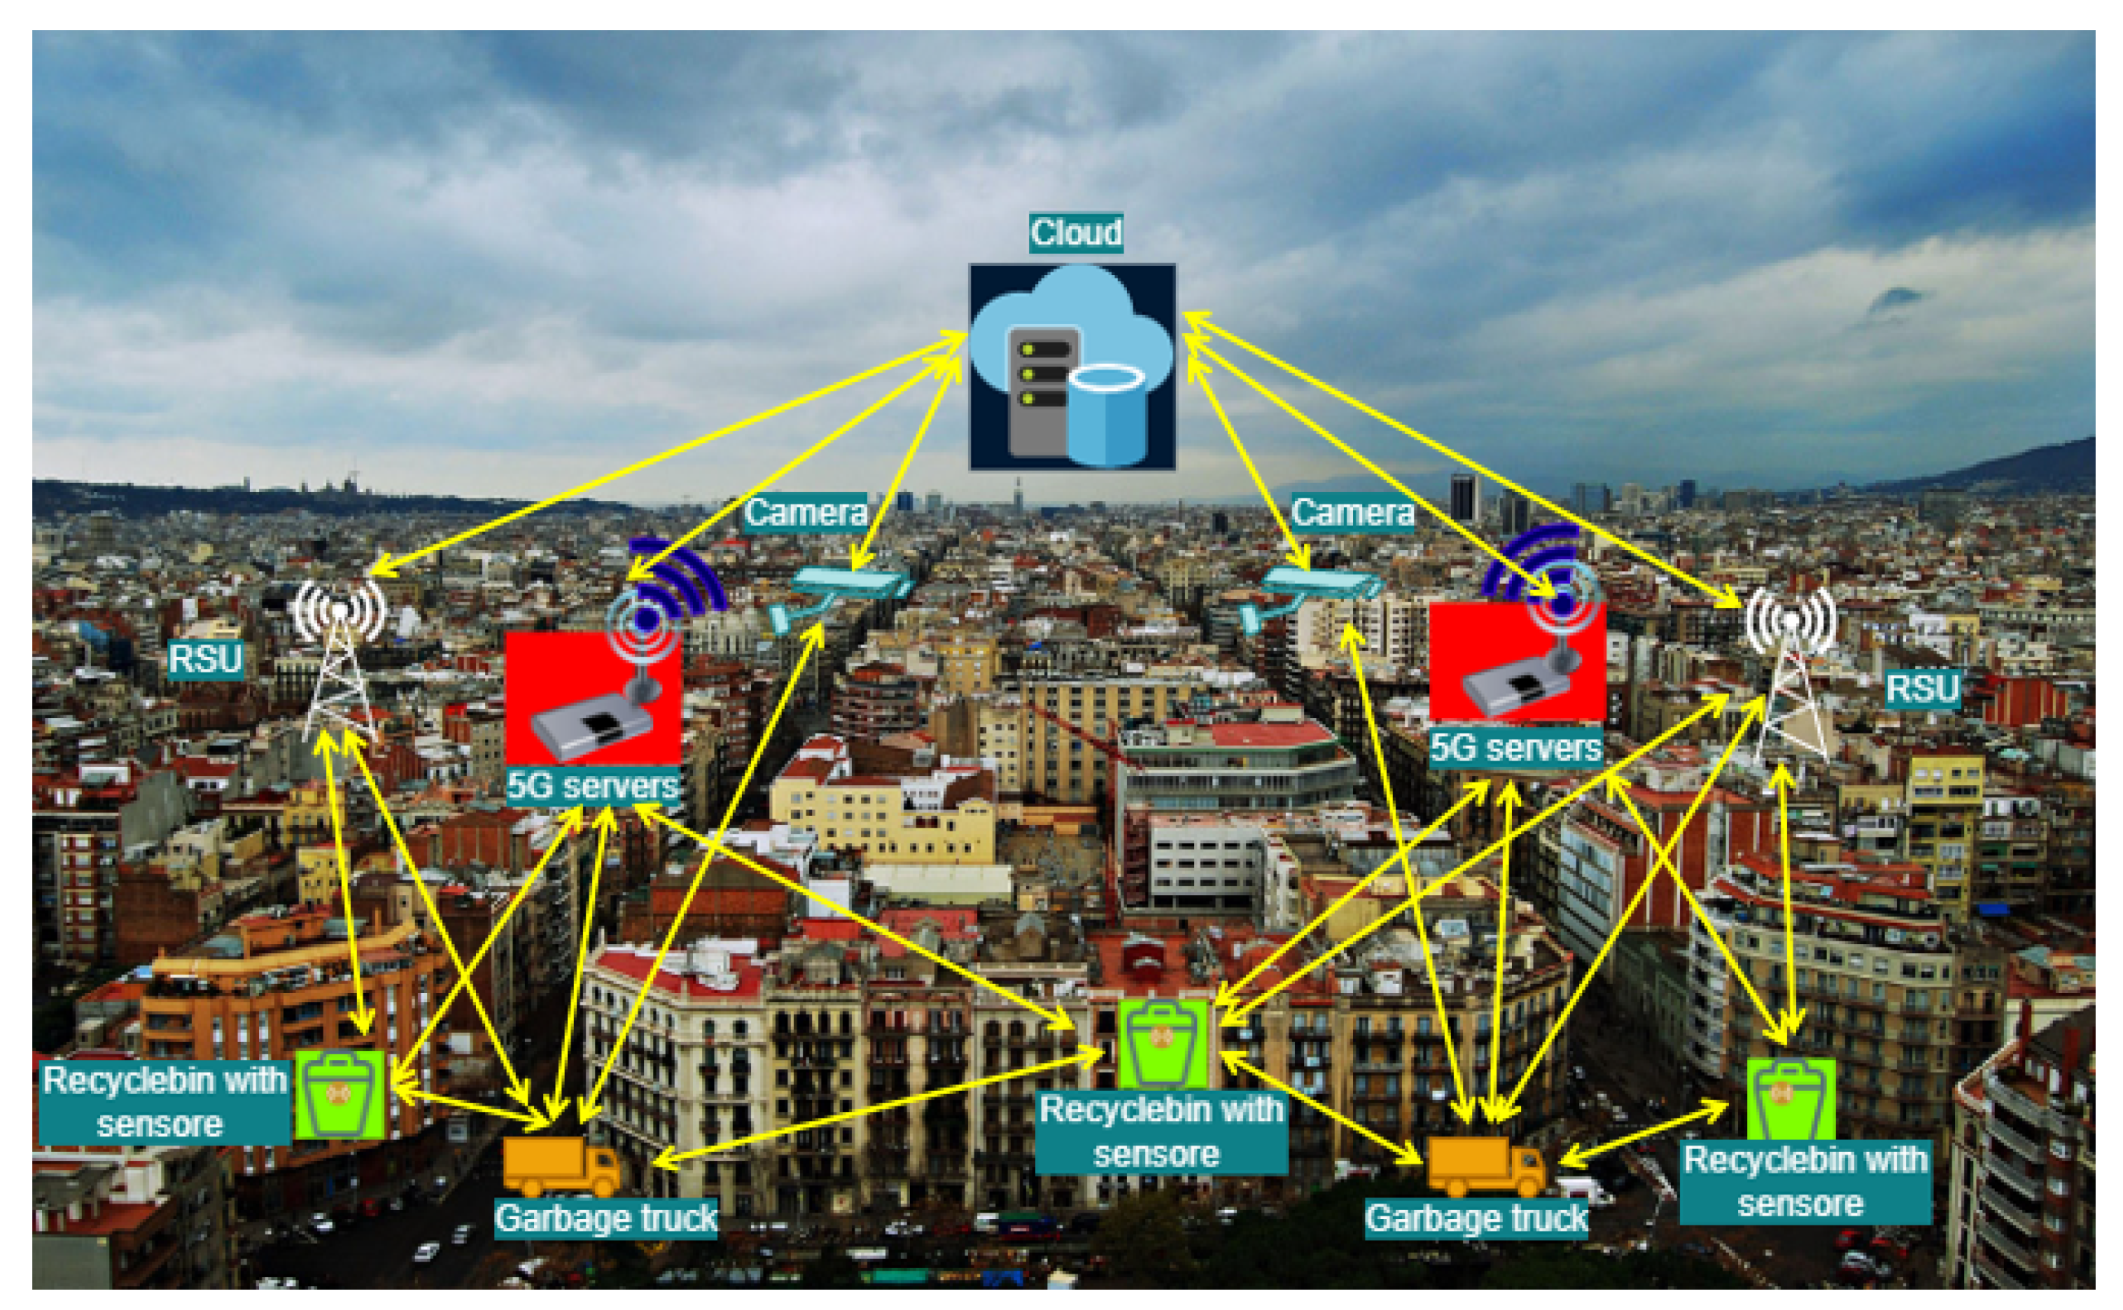
Figure 1 shows an example of smart city, where the recycling bins distributed across the city have a small sensor inside, enabling continuous data streams for knowing their saturation level in real-time. These data, as well as data gathered by traffic cameras, are sent to the OBUs that are installed on garbage trucks to re-optimize the routing plan using agile algorithms. Moreover, these data are also sent to the cloud to feed the T&M analytics algorithms to acquire knowledge, which will be used to support stakeholders to take decisions in real-time scenarios. Thus, IoT technologies help to decide in real-time better routing decision in uncertain networks [
7], based on the current traffic flow and the updated level of the bins. This, in turn, allows for reducing the pollution and energy consumption, thus improving the quality of life and economical value of the society [
8].
This paper aims to present some analytics algorithms that comprise cognitive, descriptive, predictive, or prescriptive tasks in the T&M field, and their integration with a continuous data stream captured from IoT. Moreover, we discuss the agile optimization algorithms and their benefits when they are combined with IoT analytics. This integration allows us to re-optimize the system every few seconds, with continuously optimized and contextualized knowledge about changes in the system. To quantify the benefits of IoT, we present a numerical example for the waste collection problem in the city of Barcelona, which has been modeled as a team orienteering problem (TOP). In the classical version of the TOP, a fixed fleet of vehicles has to visit a number of pre-selected nodes while going from an origin depot to a destination depot. These nodes have been selected by the decision-maker at the very beginning of the day and cannot be changed during the route. Each time a node is visited for first time, a reward is collected. The goal is to maximize the total accumulated reward without exceeding the maximum distance/time allowed per vehicle route. Although the literature on the TOP is quite extensive, some issues remain to be addressed. For example, most works assume that all the problem inputs, such as traveling times between pairs of nodes, are both known in advance and static. In contrast, this paper considers a more realistic scenario in which the traveling times are dynamic. To address this problem, we combine an approach based on a planning horizon with a trigger mechanism in which the solution is re-computed at the beginning of each period of the planning horizon if the trigger condition is met. This solution approach is enhanced with an agile biased-randomized heuristic, which is fed with open real-world data gathered from the city of Barcelona. Each time the data stream provides updated information to the algorithm, this information is taken into account to recompute the solution in a few milliseconds.
In this context, the main contributions of this work are: (i) to describe a more realistic version of the TOP, which includes dynamic traveling times and mandatory nodes; (ii) to introduce a dynamic solving methodology based on planning horizon and a trigger mechanism; and (iii) to test our algorithm in a realistic dynamic environment using real-world data obtained from open repositories.
The rest of the paper is organized as follows:
Section 2 presents the role of transport analytics in smart city T&M activities and the optimization approaches.
Section 3 briefly presented along various research topics in IoT analytics, big data stream, agile optimization, and TOP. We present a case study in
Section 4.
Section 5 describes our proposed solution approach to solve the DTOP-MV in smart cities.
Section 6 discusses computational results. Lastly,
Section 7 summarizes our main conclusions and provides future research lines.
2. Analytics and Optimization Approaches
2.1. Context and Applications
With the growing urban population around the world, the development of efficient and sustainable urban T&M activities is in urgent need. Road transport is the predominant method of transporting goods in Europe, as well as in other parts of the globe. Since the start of the new century, the direct costs associated with this type of transport have increased significantly. In Europe, almost
of the European Union’s (EU’s) GDP is lost each year due to traffic congestion. Furthermore, road transport is inherently associated with large amounts of indirect or external costs, congestion, pollution, safety and security costs, mobility, latency costs, etc. However, they are often neglected due to the difficulty of quantifying them. In addition to these tangible costs, many others, such as the environmental costs of producing and using fossil fuels, enter the green equation. According to this background, the need to develop sustainable and efficient T&M models and systems has become essential. Ref. Savelsbergh and Van Woensel [
9] outlined that “city logistics is about finding efficient and effective ways to transport goods in urban areas while taking into account the negative effects on congestion, safety, and environment”. On the one side, the different challenges facing T&M in modern business models—e.g., e-commerce, same-day delivery, location-based services, etc.—driven by fierce competition and challenging customer demands must be addressed. On the other side, technological advances in the use of electric vehicles and new modes of movement—such as car-sharing and ride-sharing—promise to reduce the negative effects of urban T&M activities [
1]. The increasing utilization of alternative means of transport has been supported by research on related problems. Thus, the expanded use of electric vehicles in the urban transport fleet and the strategic location of charging stations created different new vehicle routing problems (VRP) and facility location (FLP) problems [
10]. Regarding the fleet size and mix, [
11] model the electric VRP with time windows and recharging stations. Multi-round heuristics are utilized to solve the VRP with multiple driving ranges introduced by [
12] and later by [
13]. For the FLP in the case of battery charging stations [
14] offers a combined exploration of optimal locations for origin-destination travel and a variety of alternative stations. From an environmental point of view, other interesting way of urban freight transport is the use of bicycles [
15], providing a new paradigm of urban distribution [
16].
2.2. IoT Analytics and Collective Intelligence
City T&M is a very expansive concept that originates a wide range of challenges in the field of research [
17]. Regarding T&M activities, despite the availability of common technologies and tools to reinforce empirical evidence-based decision-making processes, many companies are still far from fully exploiting the potential of such scientific advances in their day-to-day operational processes. With the rapid development of IoT and cloud technologies, utilization of IoT analysis and collective intelligence have become important pillars of agile optimization for T&M systems Xhafa [
18], Bibri [
19]. Moreover, IoT technologies provides new business models and value to companies Lee [
20]. Taking environmental costs into the account when generating vehicle routes is a concept that has evolved over time Figliozzi [
21], Sawik et al. [
22]. However, as Demir et al. [
23] points out, new methods are needed to estimate environmental costs. Some of the more efficient ones are estimating the willingness-to-pay Lera-López et al. [
24], Lera-López et al. [
25], Haddak et al. [
26] and the experimental economics techniques Denant-Boemont et al. [
27], Croson and Gächter [
28], Breidert et al. [
29]. Hence, based on new technologies and devices, such as smart sensors, IoT, and cloud platforms, waste collection process in smart cities can be greatly improved. For example, Navghane et al. [
30] proposed to use sensor, microcontroller, and Wi-Fi modules to periodically measure the garbage level of the containers and employ this information to improve the waste collection management.
2.3. Optimization, Meta-Heuristics, and Simulation Methods
Optimization and simulation techniques—such as agile algorithms, simheuristics, and learnheuristics—are key methods for delivering efficient scale solutions for a variety of strategic, tactical, and operational decisions on T&M systems and sustainable development issues in urban areas [
31]. By sharing different resources, such as customers, vehicles, warehouses, experts, etc., companies at one level of the supply chain are expected to improve their level of usage and service through economies of scale. Therefore, transport analysis and smart algorithms are essential tools for analyzing and quantifying the potential benefits of modern T&M concepts and practices, from horizontal collaboration between shipping companies to emerging mobility modes, such as car-sharing and ride-sharing.
Hezarkhani et al. [
32] discussed profit sharing options through joint delivery planning of logistic service providers. Strategies on the vertical supply chain level have also been considered in the literature. Liu and Lee [
33] presented a hybrid variable neighborhood algorithm with tabu search in which a VRP with time windows is considered and combined with inventory control decisions. Bertazzi and Secomandi [
34] studied an inventory routing problem (IRP) with stochastic demands using a hybrid roll out algorithm. Belloso et al. [
35] reduced empty backhauls and analyzed the use of heuristic-based algorithms
Hereby, the dynamic nature of optimization problems might refer to dynamic input variables to routing, location, and scheduling problems, such as customer demands and travel times, which can be transferred and processed in almost real-time through the use of modern information and communication technologies, IoT, as well as efficient agile optimization algorithms, metaheuristics, or simheuristics [
36].
2.4. Uncertainty in Transport and Mobility
In modern T&M systems, one of the major problem is uncertainty that leads to stochastic and dynamic problems. Simheuristics Juan et al. [
37], and learnheuristics Calvet et al. [
38] are tools that have been successfully applied in many large-scale real-time configurations to eliminate uncertainty and dynamics in optimization problems in a natural way. For discovering new horizons of the state of the art methodologies, T&M is essential for the development of an integrated and comprehensive approach based on open data initiatives, transport analytics, information technologies (IoT, 5G, etc.), sustainability models, and agile optimization. Some of the opportunities are presented in the following:
T&M Models for electric vehicles and sharing strategies comprising the use of car-sharing and ride-sharing, shared parking slots, use of shared integration centers, use of shared vehicles and workers, the integration of electric vehicles in the fleet, etc. They need IoT analytics and agile optimization to solve real-time route planning, allocation, as well as profiling of energy consumption of electric vehicles for optimizing their autonomy;
T&M models for home-delivery services. Likewise, this case study needs IoT analysis and agile optimization to solve route planning problems in real time. Eventually, this task identifies and categorizes the best practices related to the development, integration and implementation of management information systems as part of T&M smart city activities.
3. Related Work
This section reviews some related work in the context of IoT analytics, big data stream, agile optimization, team orienteering problem, as well as the effect of IoT in the context of waste management.
3.1. IoT in Smart Cities
Smart cities are created through IoT that develops and expands digital services and functions for different groups of users. IoT provides raw information from smart cities and since many application scenarios need efficient analytic systems, IoT analytic techniques have been raised. Furthermore, the growing amount of data generated through IoT also requires more efficient solutions to support the day-to-day operations in smart cities. To improve transportation management, Dai and Ma [
39] optimized the traffic in smart cities by analyzing different road traffic problems. Huang and Nazir [
40] presented the method of analytic network process for evaluating smart cities. Hossain et al. [
41] considered the concept of edge computing in IoT for minimizing the latency of edge devices that generate data for cloud transfer and proved that the processing of these huge data can greatly increase the performance indicators of smart cities. Bellini et al. [
42] provided a survey on IoT-enabled smart cities, as well as a review of the main smart city approaches and frameworks to highlight the main trends and open challenges of adopting IoT technologies for the development of sustainable and efficient smart cities. According on multicriteria decision making and based on total interpretative structure model and existing literature, Sharma et al. [
43] found 15 performances indicators that blocked the implementation of IoT in smart cities in India. Based on ensemble method and IoT techniques, Tekouabou et al. [
44] presented a system that integrated a predictive model to optimize the conjecture of space availability in smart parking. Desikan et al. [
45] proposed topology control techniques based on fog gateways, cost-efficient IoT network in the phase of construction and resource utilization in maintenance phase to manage and construct the network of IoT for a large-scale smart city.
3.2. IoT and Big Data Stream, Agile Optimization
Due to the large network of physical devices that exceed the ordinary computer network, a large number of big data streams will be generated soon, and the benefits of using the IoT depend on the ability to gain hidden insights of massive data De Francisci Morales et al. [
46]. In this matter, because of the lack of balance between data utility and privacy in the privacy preservation method, Chamikara et al. [
47] proposed an efficient data stream perturbation algorithm that can provide better data efficiency, accuracy, and attack resilience with the comparison of similar methods and the classification accuracy. To understand the performance parameters of data stream classification, Masrani et al. [
48] considered real and synthetic datasets and used an active learning method that prop up on demand labeling of instances and control the labeling budget to improve its accuracy in data stream. Nha et al. [
49] used the simulation of urban mobility (SUMO) package and traffic control interface (TRACI) to simulate the behavior of the various route planning algorithms and then compare and analyze their performance in real-world road networks. Kechagias et al. [
50] provided a cloud-based software system that supports logistics companies’ needs to efficiently schedule deliveries and perform vehicle routing by utilizing a multi-objective algorithm that reduces distribution costs and environmental emissions. Additionally, sensor inaccuracy, errors, and network faults can cause uncertain data streams that lead to problems during big data processing. Hence, Makhmutova and Anikin [
51] examined different algorithms for evaluating uncertain big data streams in terms of noise resistance, performance, and scalability.
In the past few years, many application domains integrated and used real-time optimization in the areas, such as internet of vehicles, virtual network function placement, and network controller placement. In this regard, Peyman et al. [
52] reviewed and identified the existing work of IoT in intelligent transportation systems and developed an approach for solving a dynamic ride-sharing problem in the context of edge/fog computing based on agile optimization algorithms. Mrazovic et al. [
53] developed technology to improve the utilization of Barcelona city loading and parking areas based on mobility data analysis. In addition, a novel approach to planning multiple vehicles’ routes using a collective optimization task was proposed, as opposed to traditional solutions that only compute optimal routes for each vehicle individually. Shao et al. [
54] proposed a smart product-service system (SPSS) approach to designing an IoT-based route optimization system (ROS), it uses IoT devices to acquire real-time information and feedbacks of vehicles and drivers to iterate the transport network and improve the planned vehicle routes. Martins et al. [
55] reviewed existing work in the context of car-sharing, ride-sharing, carpooling optimization, and provided a comparison between analytical methods in that field.
3.3. IoT and Waste Management
Because of the effectiveness of IoT services, different waste management studies considered the use of IoT. Vishnu et al. [
56] studied and proposed two types of architectures, public bin level monitoring unit and home bin level monitoring unit, for smart cities to track bins in public and residential area to improve the traditional waste management systems. Bharadwaj et al. [
57] provided a complete IoT based system to automatically track, collect, and manage the solid waste in Bengaluru city. Furthermore, by combining the use of IoT devices, such as micro-controller, ultrasonic sensor, moisture sensor, and image processing, Khan et al. [
58] proposed a solution to make cities clean and pollution-free. Haque et al. [
59] randomly selected four waste bin locations in the city of Michigan and proposed a system to improve the travel distances in comparison to the traditional waste collection system. Furthermore, Adeleke and Olukanni [
60] adapted an existing model on facility location problems to the solid waste management problem, also introducing different optimization algorithms that waste collection managers can use to address specific problem factors to improve the quality of the provided service.
3.4. Team Orienteering Problem
Since the TOP is NP-hard, many solution approaches have been proposed for solving the TOP and its extensions. Ke et al. [
61] proposed a approach called Pareto mimic algorithm (PMA) for solving the TOP. This algorithm maintains a population of incumbent solutions, which are updated using Pareto dominance. It uses a mimic operator to generate new solutions by imitating incumbent solutions and a swallow operator in order to insert infeasible nodes and then repair the resulting infeasible solutions. Gedik et al. [
62] used a constraint programming model and two branching strategies to formulate and solve the TOP with time windows by applying interval variables, global constraints and domain filtering algorithms. Yahiaoui et al. [
63] studied a clustered team orienteering problem (CluTOP) using an exact method based on a cutting planes approach and a hybrid heuristic that combines an adaptive large neighborhood search (ALNS) and split procedure. In this problem, customers are grouped into clusters, and a profit is associated with each cluster. This profit is obtained only if all of the customers in the cluster are served. Bayliss et al. [
64] proposed a learnheuristic approach (combination of heuristics with machine learning) to solve an aerial-drone team orienteering problem with travel times between targets depend on a drone’s flight path between previous targets. Hanafi et al. [
65] studied a multi-visit TOP with precedence constraints using an enhancement of the kernel search (KS) framework that makes use of different sorting strategies. Although the literature on the TOP is quite extensive, most works assume that travel times between two nodes are constant in value. However, in practical situations, especially in urban areas, these travel times are highly dynamic, and may be influenced by external factors, such as traffic congestion. Hence, to fill this gap, in this paper we considered dynamic time-dependent travel times using public traffic situation data obtained from open data repositories.
Table 1 summarizes the different approaches of the literature. The majority of the works reviewed focus on IoT, optimization, and data analysis concepts in order to improve performance and provide better services. Furthermore, only a few works address waste management, agile optimization, and big data streams. To close this gap, we use data from open repositories to apply a combination of the aforementioned concepts in solving a realistic waste collection management problem. In particular, we consider real-time data that can be fed into our agile algorithms for solving the dynamic TOP with mandatory visit (TOP-MV).
4. An Illustrative Case Study
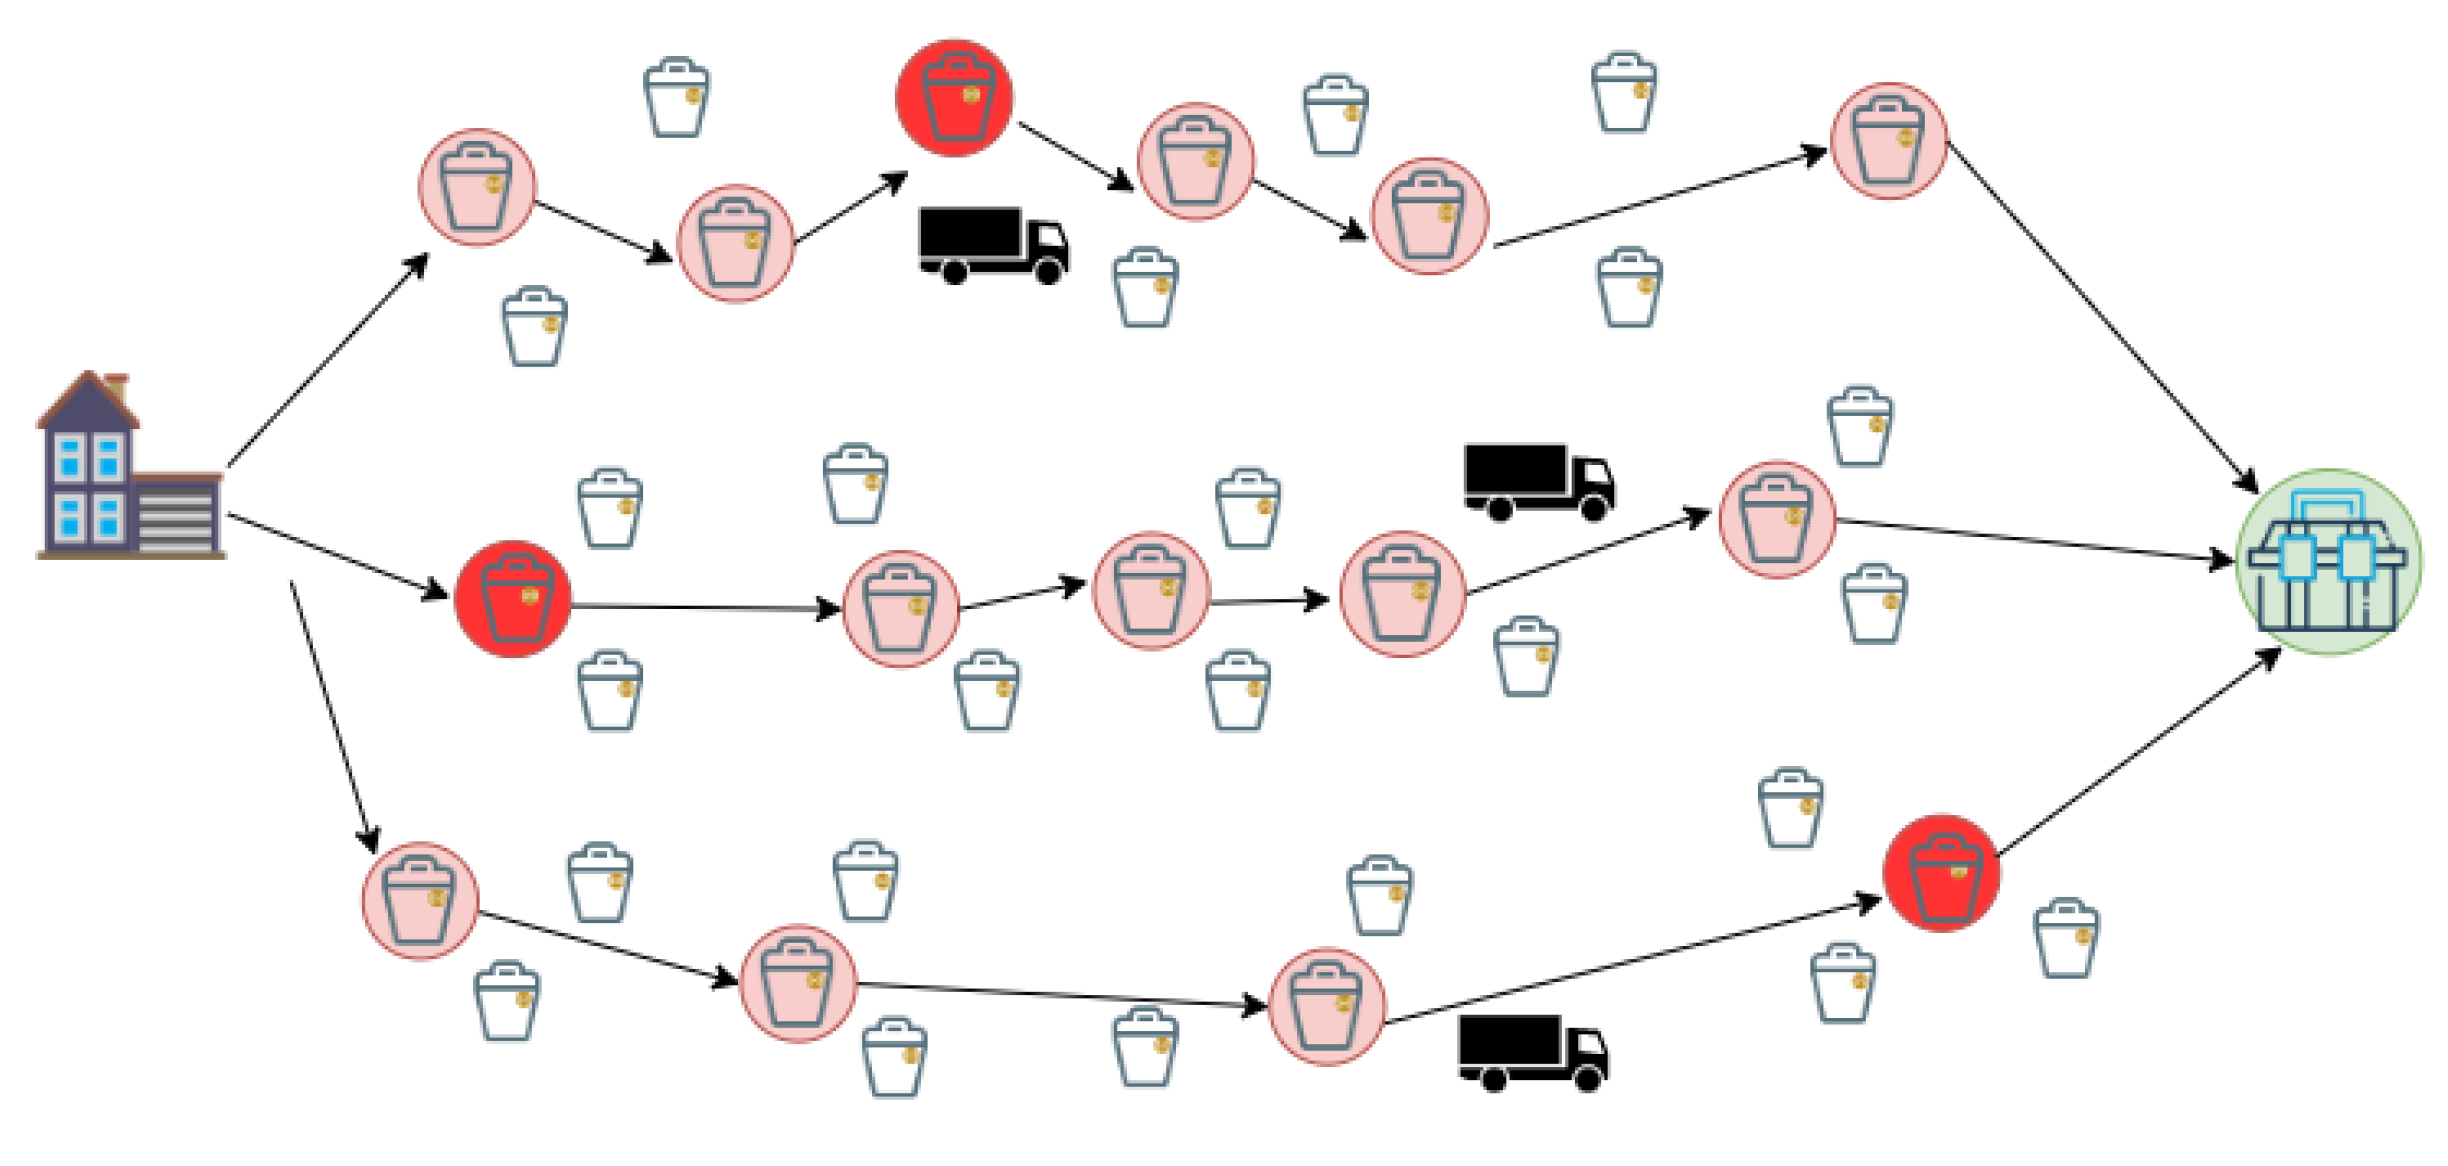
The static waste collection TOP consists in designing a set of open routes intended to pick up the waste (
Figure 2). This waste has been disposed in multiple collection points across the city. These points are connected by edges, which represent streets in cities. Each collection point has a given reward, which represents the level of waste in the container, as well as coordinates, e.g., latitude and longitude. A single vehicle is assigned to each route and visits each collection point once. The set of vehicles is assumed to be homogeneous and the fleet size is constant. Additionally, each vehicle has a maximum amount of time to complete its route, i.e., a maximum time constraint. Due to the time constraint and the limited number of vehicles, not all containers can be visited. As a result, the challenge is not only to design the routes, but also to choose which containers to visit. Our selection criteria is based on both the distance between the container’s location and the vehicle’s origin and destination points, as well as the saturation level of the container. The goal of this TOP is then to maximize the waste collected by each vehicle within the time constraint. In real-life waste collection process, containers that all full or reach a certain saturation threshold must always be visited to empty the waste, therefore, our TOP is further extended into TOP with mandatory visits (TOP-MV).
In formal terms, our TOP-MV can be defined on a directed graph , where N is the set of nodes, and E is the set of edges connecting these nodes, i.e., }. The start and end nodes are fixed to nodes 1 and , respectively. The set N is formed by a set I of collection points, a singleton set O representing the origin facility, and a singleton set F representing the end facility, such that . Set I contains a subset M which includes all the mandatory collection points. Each collection point is associated with a non-negative reward , and a service time , the reward refers to the quantity of waste to be collected and the service time represents the time required to collect the waste of the container. Each edge is traversed in a time . Routes are performed by a set K of vehicles. The total accumulated travel time that the vehicle has spent after visiting customer i, can not exceed the maximum time budget . Each collection point must be visited at most once by only one vehicle. Mandatory collection points must always be visited. Each vehicle is assigned to only one route. Each route must start in the origin facility and finish in the end facility . The goal of the TOP is to determine a set of routes, limited by a given time budget , that visit a subset of N that includes the mandatory nodes, and maximizes the total collected reward.
TOPTW-MV can be modeled as a mixed integer linear program with the binary decision variable
, which takes the value 1 if the edge
is traversed by a vehicle to collect the reward at node
j, and 0 otherwise. The objective function is to maximize the total collected reward:
Constraint (
2) imposes that each customer node has at most one edge departing from it. Likewise, constraint (
3) imposes that at most one edge enters each customer node. Constraint (
4) guarantees that, for each customer node, the number of incoming edges is equal to the number of outgoing edges. Constraint (
5) ensures mandatory visits. Constraint (
6) imposes that the number of vehicles starting at the origin facility and the number of vehicles arriving at the destination destination is the same. Constraint (
7) imposes that the number of routes must be less or equal to the number of available vehicles
k. Constraints (
8) and (
9), guarantee the connectivity of the solution and the maximum travel time requirement. Constraint (
10) avoids degenerated routes. Finally, Constraints (
11) and (
12) specify the range of the associated variables.
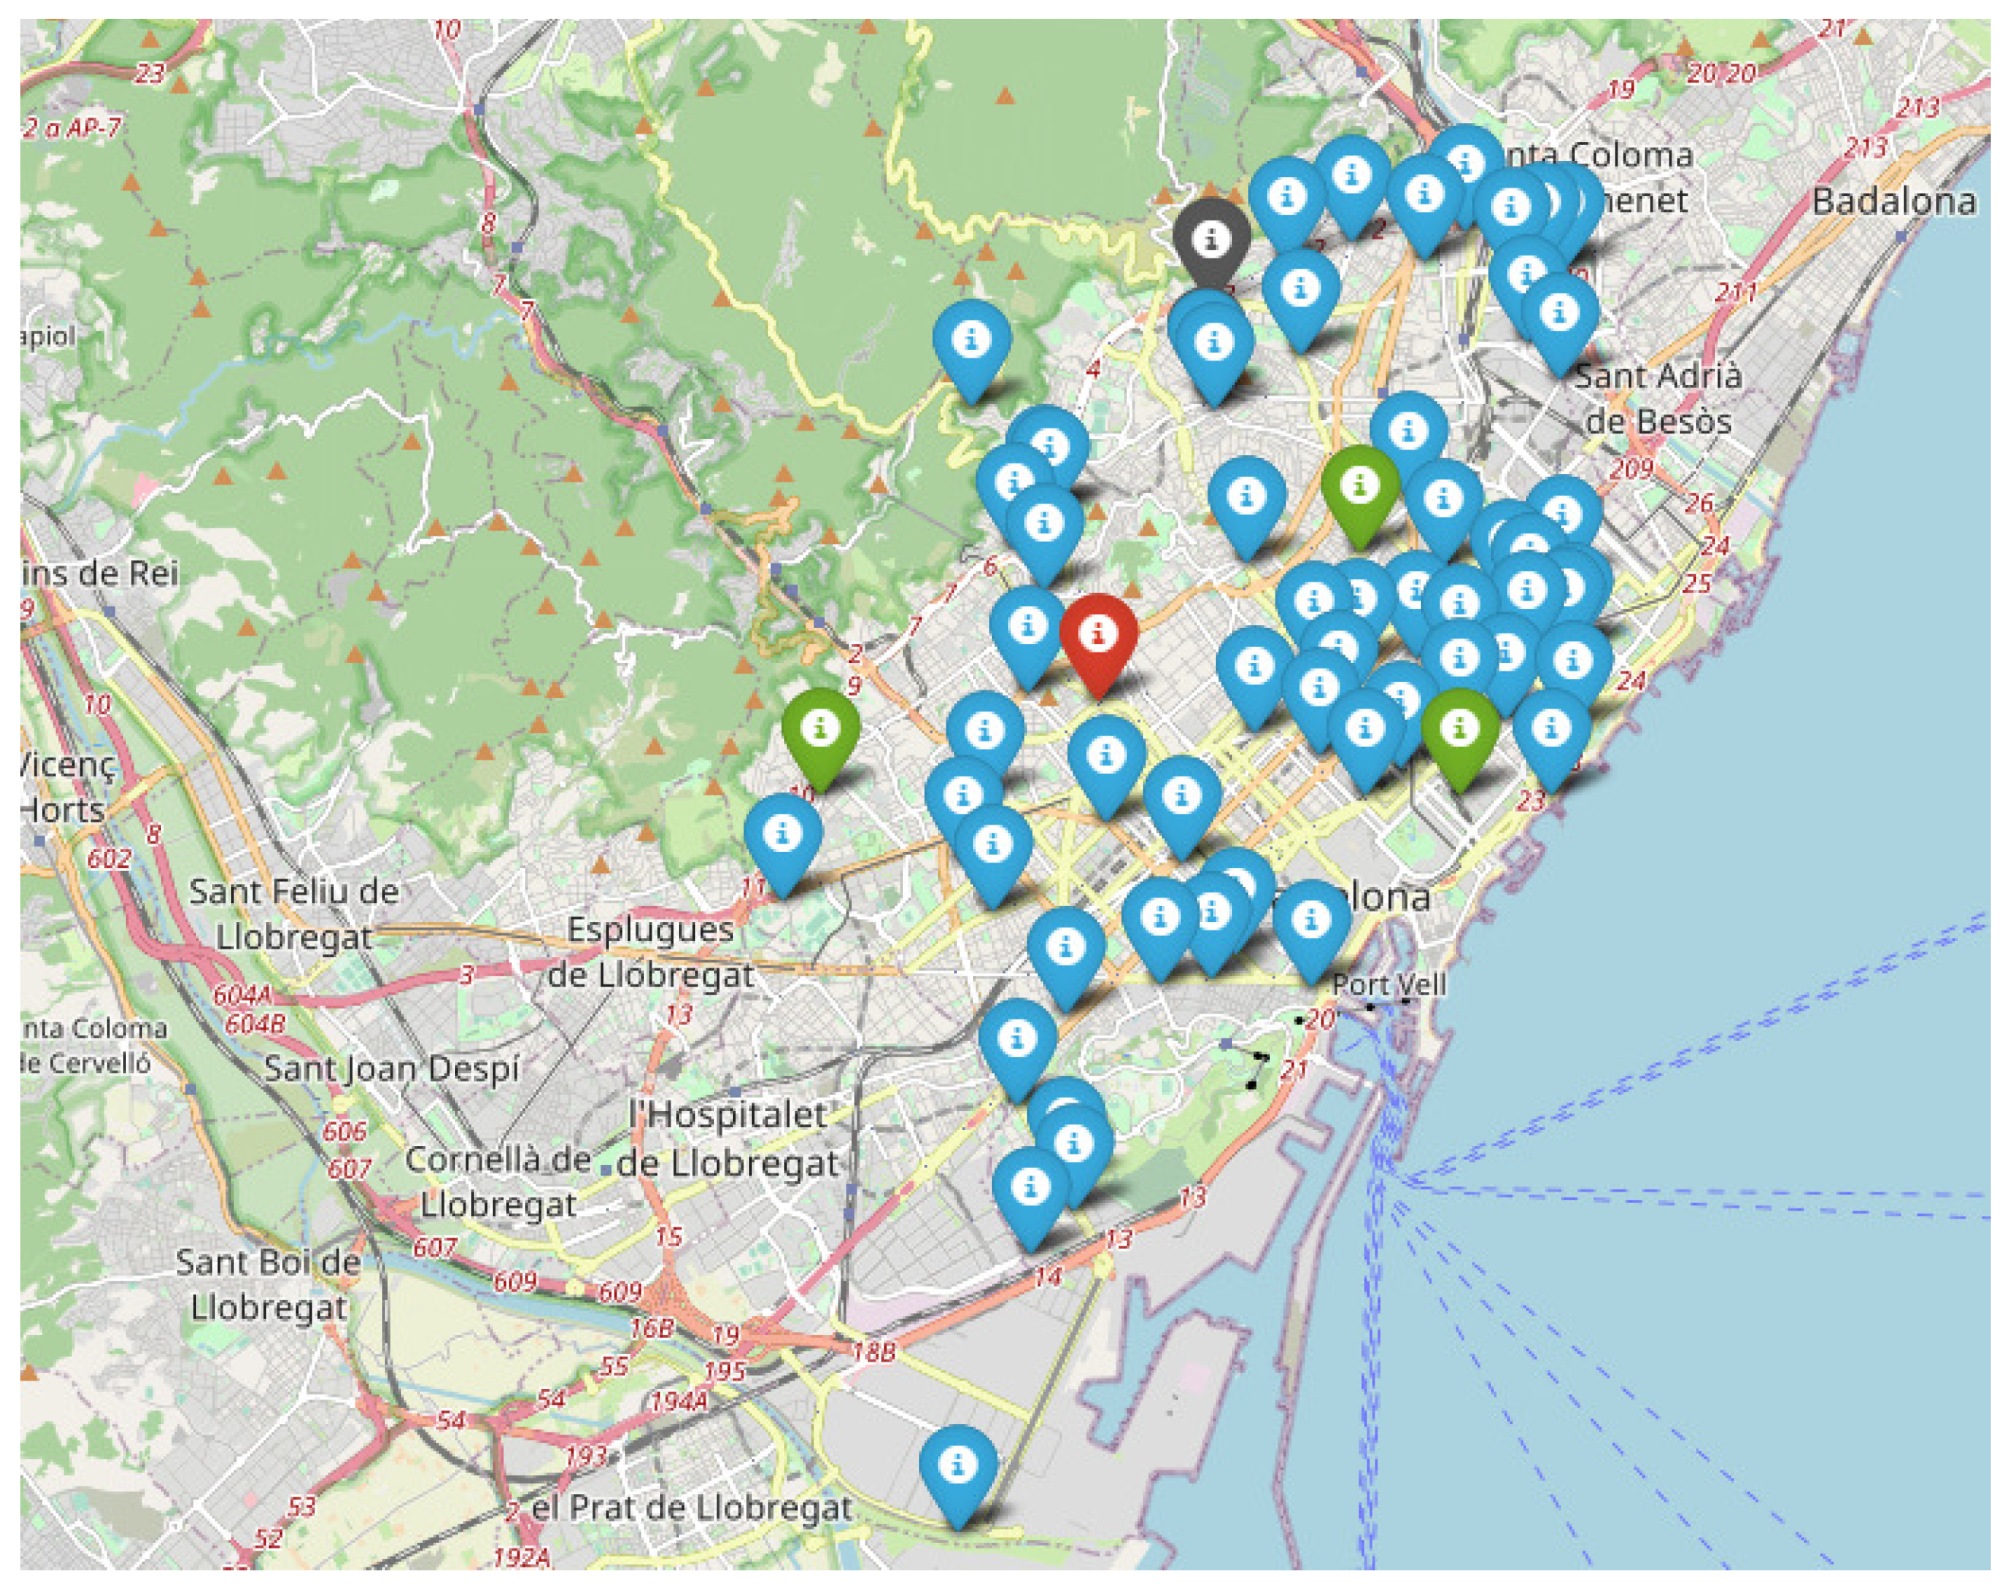
The data used to test our approach are obtained from Open Data BCN, particularly,
Petrol stations in the city of Barcelona is used to model our waste collection problem (WCP). The location of the petrol stations distributed in the metropolitan area of the Barcelona city is considered as the location of the waste containers and the waste level of each container is assumed to be provided daily by sensors installed in these waste containers. The dataset contains 61 different records, 59 of them are considered as the waste containers to be visited, and the remaining 2 are considered as the origin and destination node. The origin depot is indicated as red point, the destination treatment facility is indicated as black point, and the three mandatory visit points are indicated as green points in
Figure 3, the rest of collecting locations are shown in blue points.
The static version of the TOP-MV assumes that the traveling times between two nodes is known in advance and static, once the solution has been designed, it cannot be further modified. However, in a real life scenario, traveling times are highly dynamic and it may be influenced by external factors, such as traffic jams, accidents, and weather conditions. Therefore, we developed a case study to address a DTOP-MV, in which traffic state information obtained from
Traffic state information by sections of the city of Barcelona are considered when constructing the solution routes. This dataset provides updated traffic state information in sections of the city of Barcelona every five minutes. This traffic state information are mostly measured by sensors installed under the asphalt that measure variations in the magnetic field caused by the passage of metal masses (vehicles). Additionally, sensors with infrared technology and cameras with image processing are also used. The information of each detector station is translated at the service level of the associated section based on particular defined thresholds for each of the stations. The current traffic state is classified as
, representing six different traffic states: no data, very-fluid, fluid, dense, very-dense, congestion, and cut off. The geometry of the street sections (described in terms of latitude and longitude) can be found in
Street sections relations of the public road of the city of Barcelona. The static travel time of each pair of nodes is calculated from Open Source Routing Machine (OSRM) API. OSRM is specially built for large georeferenced datasets, it uses OpenStreetMap data to find the optimal route by different trip modes, such as by car, by bicycle, or on foot [
66].
5. Solution Approach
In this section, we describe our implemented approach for solving the DTOP-MV. In general, there are two approaches to solving dynamic optimization problems regardless of the particular optimization method used. In the first one the optimization algorithm is run continuously, reacting to the changes in the environment. In the second one, planning horizon of length
T is divided into discrete number of time periods and the algorithm is performed once per time periods. Once the algorithm is executed, any new information collected during the current time slot are passed to the next run of the algorithm, which is scheduled for the subsequent time period, and the problem instance of the current time slot remains unchanged for the rest of the time period [
67].
In practice, the latter approach is more commonly used because of its efficiency and practicality. In this study, we extend the second approach by incorporating a trigger mechanism for the re-planning procedure. Initially, the planning horizon of length T is split in a sequence of m equidistant time periods, each of length p, where . At the beginning of each time period, in the time , where , the algorithm checks if the current traffic situation is different compared to the previous period. If the traffic situation has changed, the re-planning procedure is triggered to re-calculate the optimal route for the remaining non-visited collection points. Algorithm 1 outlines the savings-based heuristic for solving the DTOP-MV in a given period n. This heuristic is embedded into a multi-start metaheuristic framework to provide a good trade-off between solution quality and computational time. The input parameters are: the starting node of the route, a list of containers consisting of location coordinates, and waste level and the end depot with its location coordinates; the number of vehicles, and the and parameters for computing the savings list and the biased-randomized heuristic, respectively. The algorithm works as follows, in stage 1, a dummy solution is constructed, which is composed of a set of routes. Each collection point is only connected by origin depot and end depot. In the stage 2, an enriched savings list of edges is constructed, the savings associated with the edge connecting each pair of nodes and is computed as . The input parameter is set within ; represents the time required to traverse the edge , represents the time to travel from origin depot o to node j, and represents the time to travel from node i to end depot f. Finally, and are the reward of each node. These savings values consider both the traveling time and the aggregated reward collected by visiting each pair of nodes from the network, and the resulting savings list is sorted in descending order according to their corresponding savings. The main loop iterates while the list is not empty. For each iteration, the edge at the top of the savings list is selected to perform the merging procedure, the edges containing mandatory nodes are always ranked at the top of the list to ensure that they are always selected. The associated routes are merged only if the resulting route does not violate the time constraint. The selected edge is removed from the savings list whether the merging is performed or not.
This saving heuristic is deterministic because the merging process always selects the edge with highest savings from the savings list. We extend this heuristic into a biased-randomized heuristic (BRH) by introducing a certain degree of randomness into the original greedy constructive algorithm. (Algorithm 1). To introduce this biased-randomized behavior, a geometric distribution, Geom(
) with
, is employed in this paper. By selecting
, the BRH can generate different alternative promising solutions until the stopping criteria of the multi-start framework is met (maximum time or maximum number of iterations), and the solution with the highest reward is returned. This returned solution is the final version of our static solution and it is later used as the initial solution for our dynamic solution. Algorithm 2 outlines the planning horizon based approach for solving the DTOP-MV. At the beginning of the planning horizon (period
), the algorithm produces an initial static solution considering the current traffic state, and the routes remain unchanged for the rest of the time period. In the next period, the algorithm checks if the re-planning trigger condition is met, i.e, whether traffic situation of the current period is different than the previous period. If the trigger condition is met, the algorithm preserves the nodes visited in the previous periods and re-plans the vehicles’ routes for the remaining non-visited nodes, considering the current traffic data and using the first stop of the current period as origin. If the trigger condition is not met, the current solution is preserved for the next period. This process is repeated at the beginning of each time period until the end of the planning horizon. The basic idea of this approach is to allow vehicles to re-plan routes periodically according to the updated traffic conditions obtained from the big data stream by the open data server to maximize the total reward obtained while complying with the maximum allowed route time constraint.
| Algorithm 1 Multi-Start approach algorithm for solving a static TOP-MV |
- 1:
input: - 2:
origin: starting node - 3:
containers: list of containers and the end depot - 4:
k: number of vehicles - 5:
: parameter for computing the savings list - 6:
: parameter for the geometric distribution - 7:
end input - 8:
functionBiased-Randomized Algorithm(origin, containers, k, , ) - 9:
← dummySolution(origin, containers) - 10:
savings ← genSavingsList(origin, containers, ) - 11:
while savings ≠ ∅ do - 12:
← pick(savings, ) - 13:
, ← getRoutes() - 14:
if checkMerging(, , k) then - 15:
← merge(, ) - 16:
← replace(, ) - 17:
end if - 18:
savings ← remove(savings, ) - 19:
end while - 20:
sol ← add(sol, ) - 21:
return sol - 22:
output: - 23:
sol: a solution - 24:
end output - 25:
functionMulti-Start(origin, containers, k, , ) - 26:
bestSol ← Heuristic(origin, containers, k) - 27:
while end not reached do - 28:
sol ← BRA(origin, containers, k, , ) - 29:
if fee(sol) > fee(bestSol) then - 30:
bestSol ← sol - 31:
end if - 32:
end while - 33:
return bestSol - 34:
output: - 35:
bestSol: the best solution - 36:
end output
|
| Algorithm 2 Planning Horizon approach for solving DTOP-MV |
- 1:
input: - 2:
origin: starting node - 3:
containers: list of containers and the end depot - 4:
k: number of vehicles - 5:
: parameter for computing the savings list - 6:
: parameter for the geometric distribution - 7:
end input - 8:
functionDTOP-MV(origin, containers, k, , ) - 9:
dynamicSol ← Multi-Start(origin, containers, k, , ) - 10:
fordo - 11:
if TrafficState() ≠ TrafficState(n) then - 12:
for do - 13:
origin, containers ← update(origin, containers, n) - 14:
sol ← BRA(origin, containers, 1, , ) - 15:
dynamicSol ← update(dynamicSol, sol) - 16:
end for - 17:
end if - 18:
end forreturn dynamicSol - 19:
output: - 20:
dynamicSol: the dynamic solution - 21:
end output
|
6. Computational Results
In this section, we provide the results of numerical experiments to illustrate both the problem and the solving methodology, comparing different approaches. A total of 36 instances with different fleet size and starting time were tested. The reward for each waste container was randomly generated and is the same for all the instances. The traffic conditions in each period
n are represented by a coefficient
, representing six different traffic states described in
Section 4, respectively: no data, very-fluid, fluid, dense, very-dense, congestion, and cut off.
is obtained from the current traffic state of tram 506 of the
Traffic state information from sections of the city of Barcelona in period
n, it is assumed to be the general traffic state of the city as most part of the city have similar traffic situations in the same time period.
affects the time
required to traverse this edge
. For instance, if
is the static time required for going from container
i to container
j, then the real time for traversing the edge
in the period
n, affected by the traffic conditions, is computed according to Equation (
13).
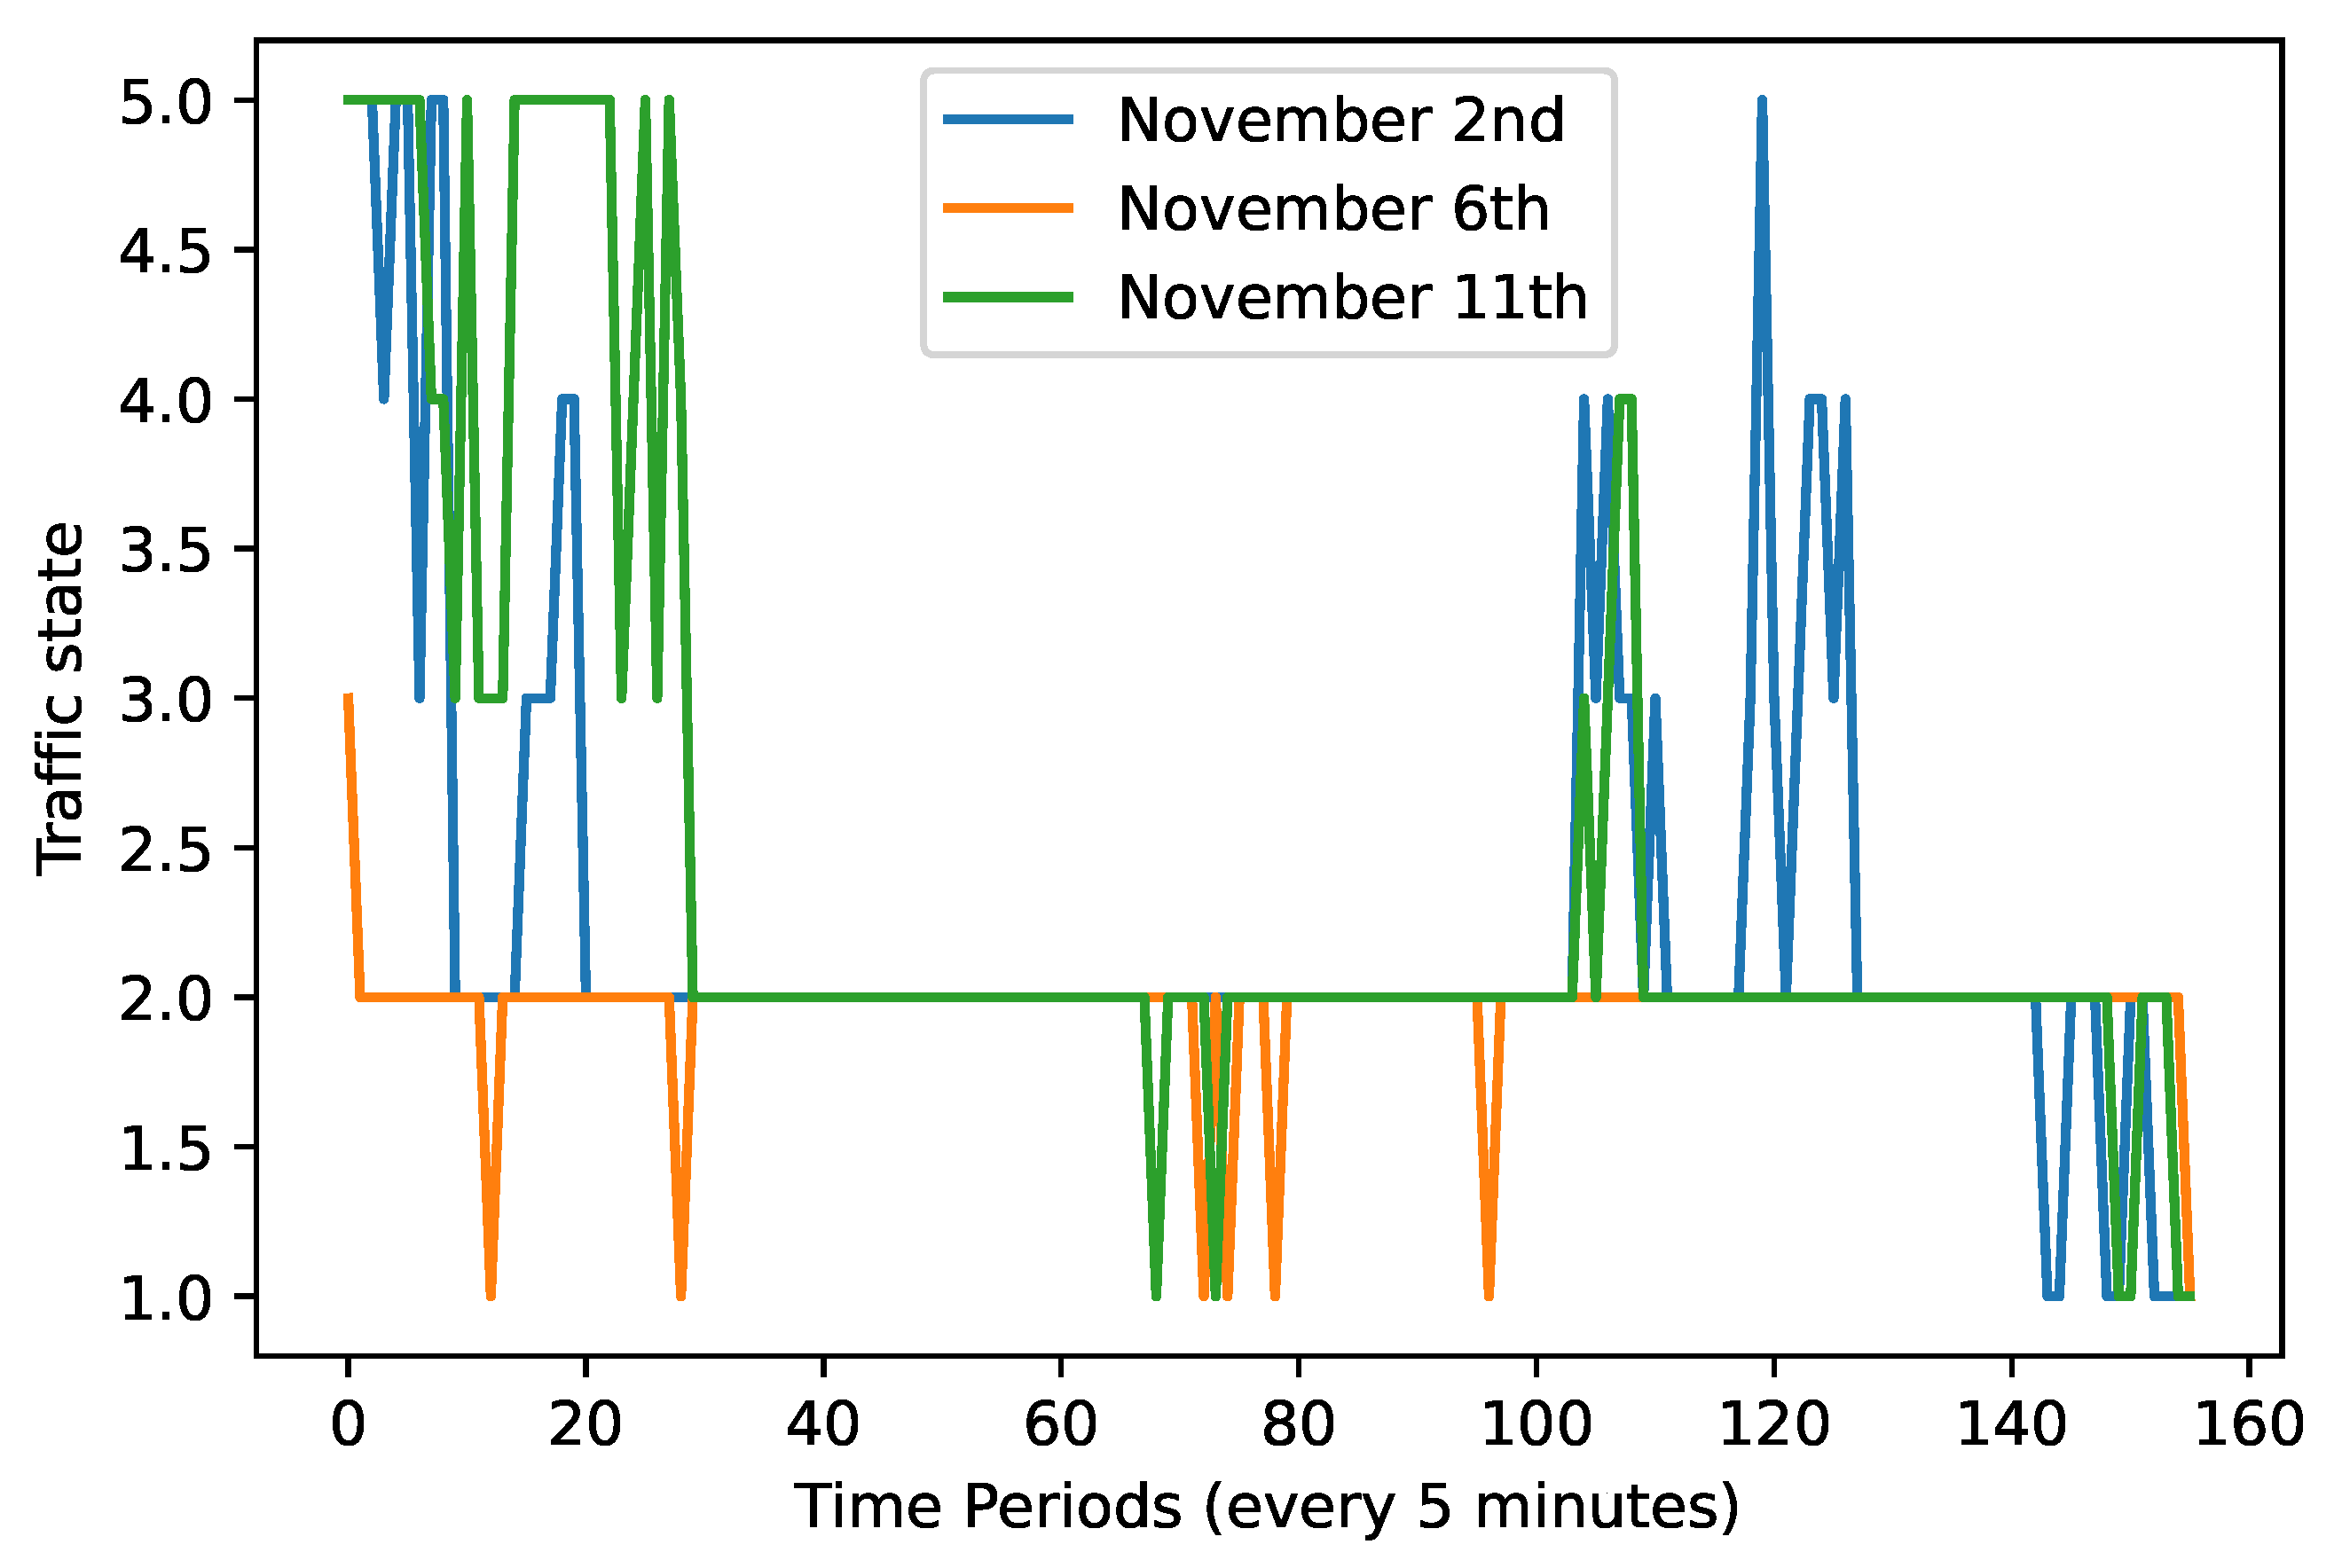
Figure 4 shows the traffic situation in the city between 9 a.m. and 9 p.m. in time periods of 5-min interval for 3 different days. As we can observe, the most common traffic state in the city is 2 (fluid traffic situation). In rush hours, such as 9 a.m. to 11 a.m. (time period from 0 to 25) and 5:30 p.m. to 7 p.m. (time period from 100 to 120), the city tends to have higher traffic density and variability than the rest of the time periods. Additionally, working days (2 and 6 November) also have higher traffic density and variability than weekend days (11 November). Therefore, to test our approach under different levels of dynamism, a series of computational experiments including rush hour, non-rush, working days, and weekend days are conducted. The planning horizon
T of the algorithm is set to 2 h and the length of each period
p is set to 30 min. The maximum allowed route time
is set to 3 h and the service time
is set to 5 min for all the container. The maximum computational time for the biased-randomization process is set to 1 s. Finally, in case the route time exceeds the maximum allowed time
, for every minute exceeded, a penalization of 20 reward per minute is subtracted from the total reward of the route.
The algorithm described in this paper has been implemented in Python 3.8. The experiments were carried out on an
7-8750 CPU at 2.20 GHz with 16 GB of RAM memory installed. The results of our experiments comparing our best static solution (OBS) and our best dynamic solution (OBD) are summarized in
Table 2. It is structured as follows. The first column indicates the name of the instance considered. The instance name sets the starting day and hour of the route and the number of available vehicles. For example, Nov-11d-09h-1v is the instance starting at November 11th 9 a.m. with 1 vehicle. A combination of 3 different days with 4 different starting hour, consisting of 2 rush hour (9 h and 18 h) and 2 non-rush hour (12 h and 15 h) with different fleets size are studied. The next six columns describe the number of nodes visited, the cost (real traveled time of the routes considering the updated traffic situation) and the reward obtained by both approaches. Each time value in this table is shown in the format
hours:minutes:seconds, and includes both the time spent traveling throughout the route and the service time. Finally, the gap in the last column represent the percentage difference between the reward attained by the OBD and the one attained by the OBS. A positive gap means that the OBD obtains a higher reward than the OBS. Instances with a
gap mean that no traffic changes have occurred during the planning horizon, therefore, no re-planning procedure is performed and the dynamic solution is the same as the static solution. As expected, most of these instances are in the non-rush hours, where the variability of the traffic situation is low. The average values of each set of instances are shown in the last row. There are no negative gaps between OBS and OBD, and the average gaps between OBS and OBD are always positive regardless of the instance size. The average gap is
,
, and
for each set of instances, respectively. The decrease in average gap with respect to the fleet size is mainly due to the increased number of reward obtained by both solutions. The positive difference between the reward obtained by OBD and OBS is actually greater as the fleet size increases.
These positive gaps between OBS and OBD proves the importance of considering the intrinsic dynamism of the system. Indeed, on average, the reward obtained by OBD is always much greater than OBS, in which the solution is not adaptable to external changing conditions. It is also worth remarking that, in OBS solutions, there are a greater number of instances that violate the time constraint than OBD solutions. However, the average cost of the OBD for all the three group of instances is closer to the than the OBS’s. This is not surprising because the vehicles in OBD can re-plant the route according to the updated traffic situation, therefore, it allows vehicles to visit more containers and take more advantage of the remaining time if the traffic density decreases or finish the routes earlier to avoid exceeding the time limit if the traffic density increases.
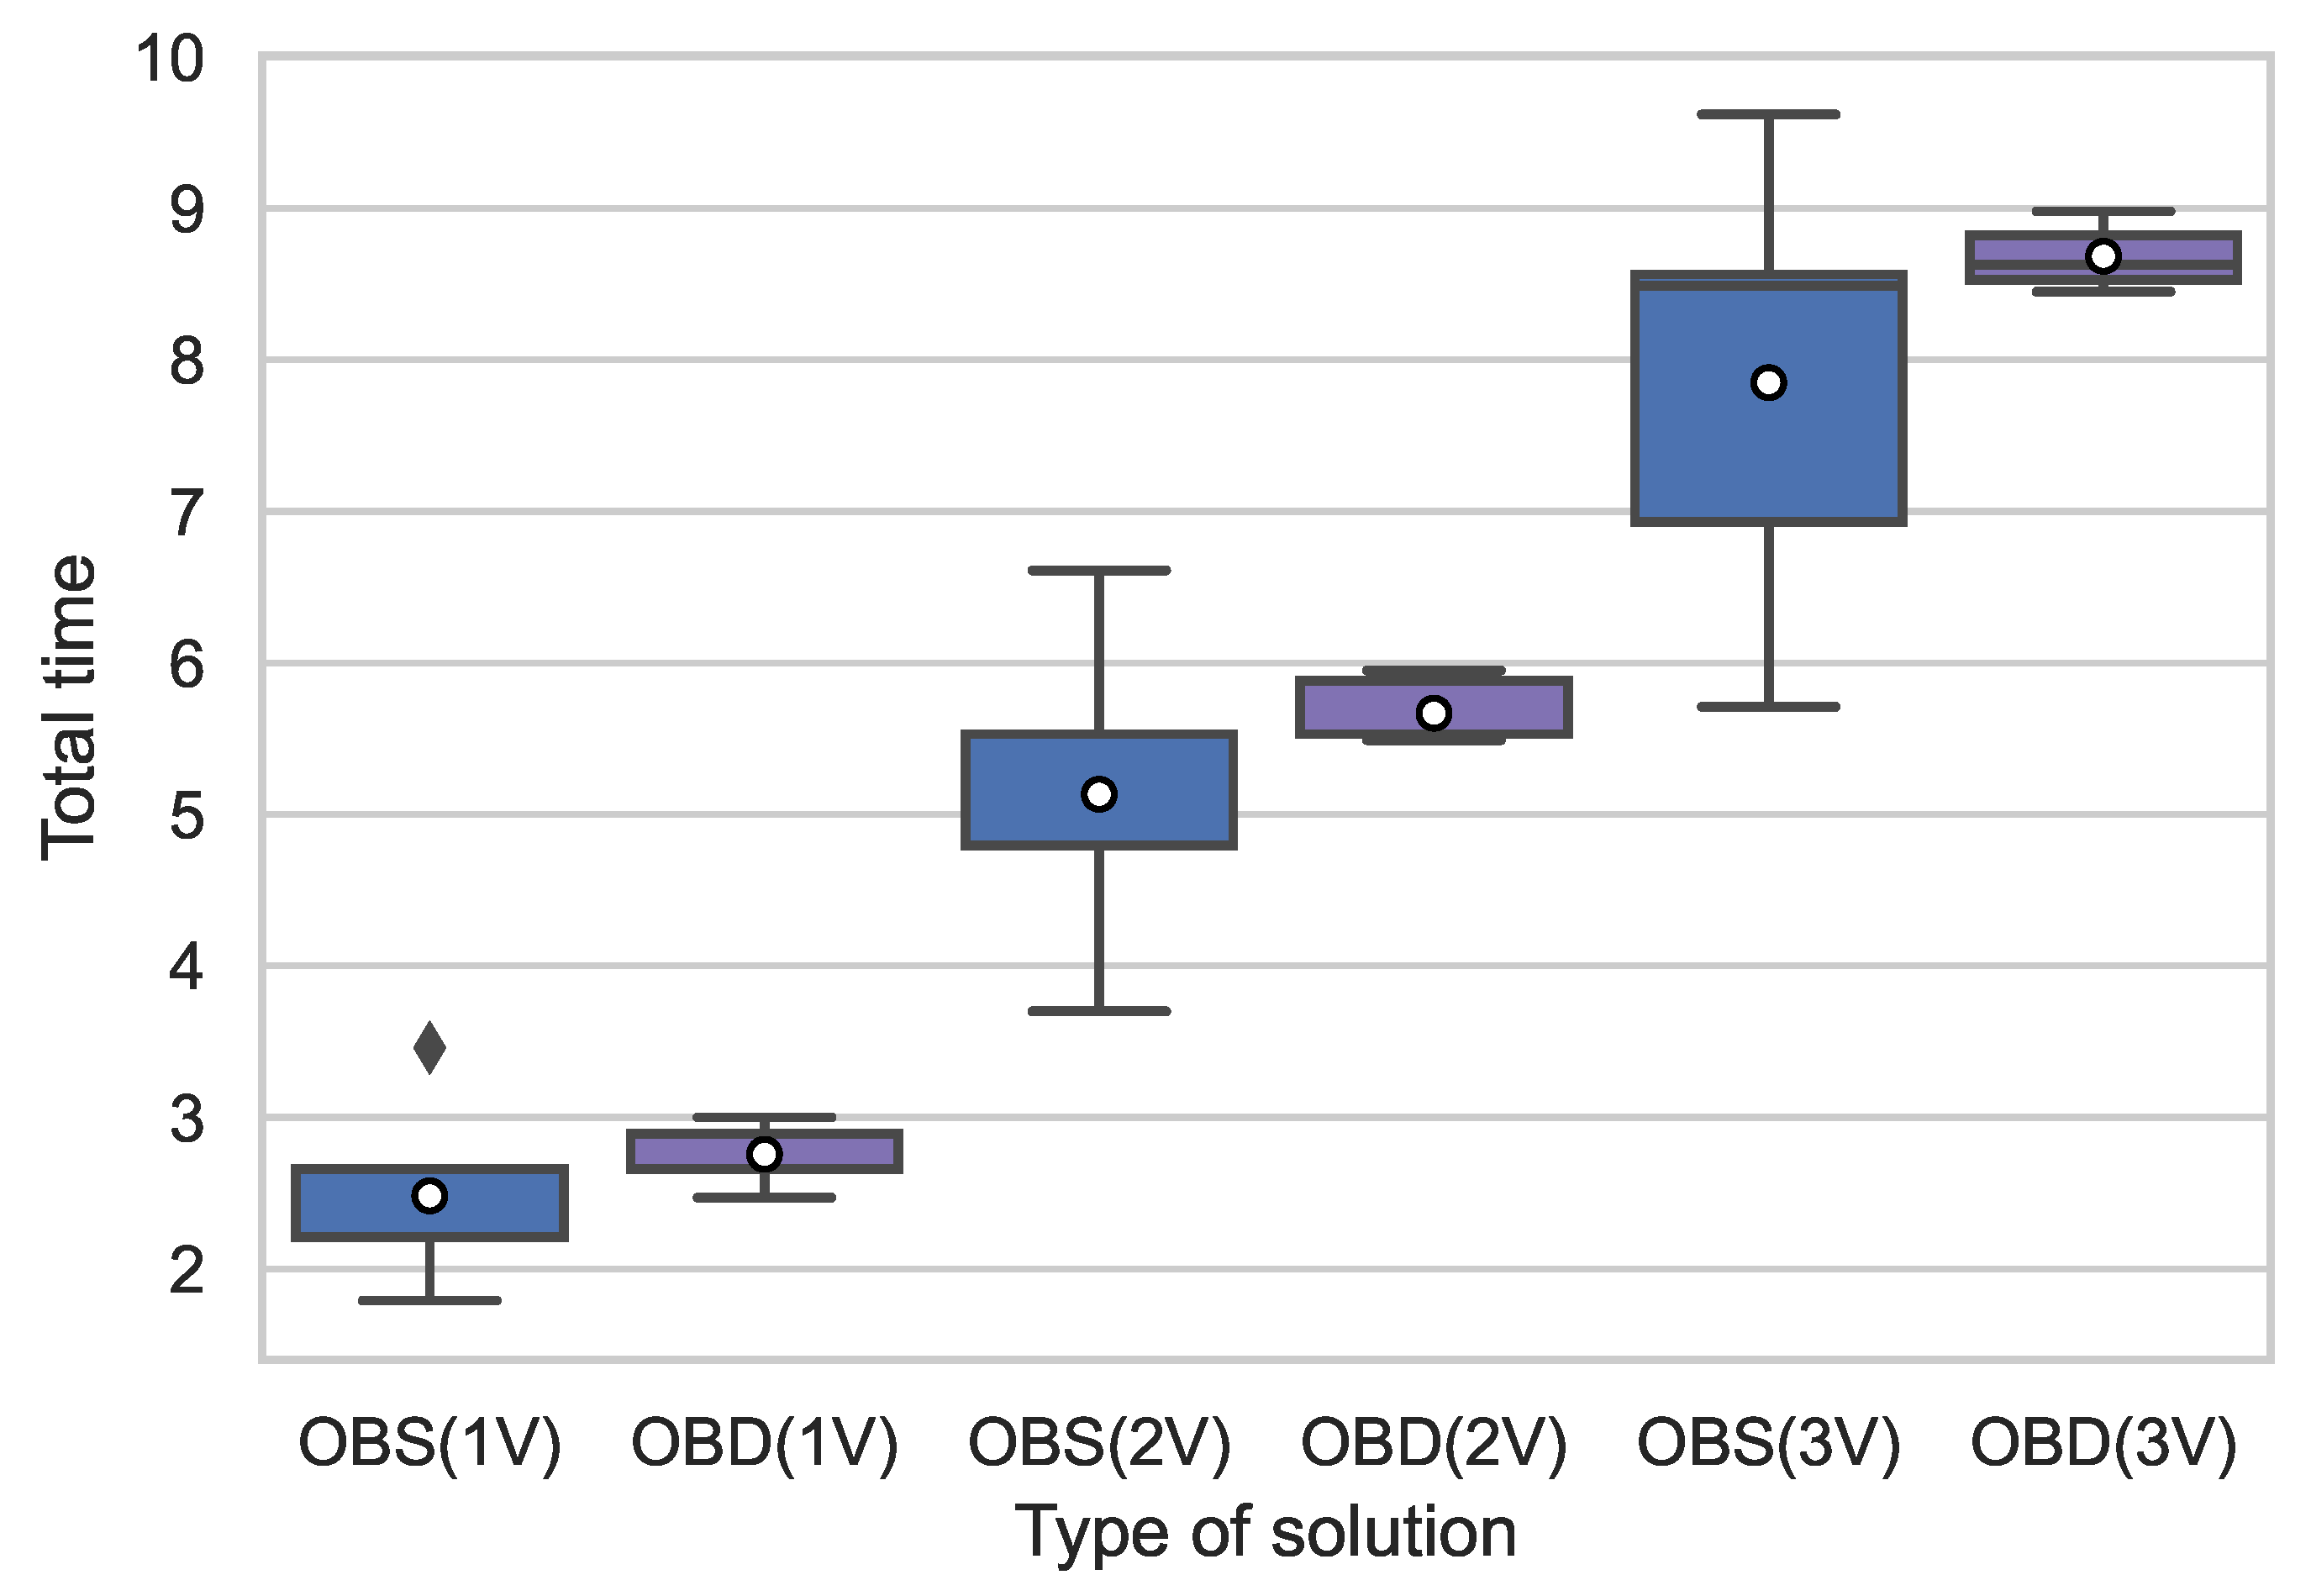
Figure 5 displays the distribution of the travel cost for all the instances. Shown plots correspond to the instances with 1 to 3 vehicles, as well as to the OBS (blue charts) and the OBD (purple charts). The white circle indicates the mean value of each sample and the black diamond marker represents the outliers of the sample. This figure clearly shows that our dynamic approach can greatly reduce the travel time variability, which can be noticed by comparing the range between the extreme points in each box plot. Compared to OBS solutions, OBD solutions tend to have travel time much closer to the time budget
in order to take advantage of the remaining times to visit more containers, and in the meantime, it has much lower probability of exceeding the time limit to incur penalization cost than OBS solutions.
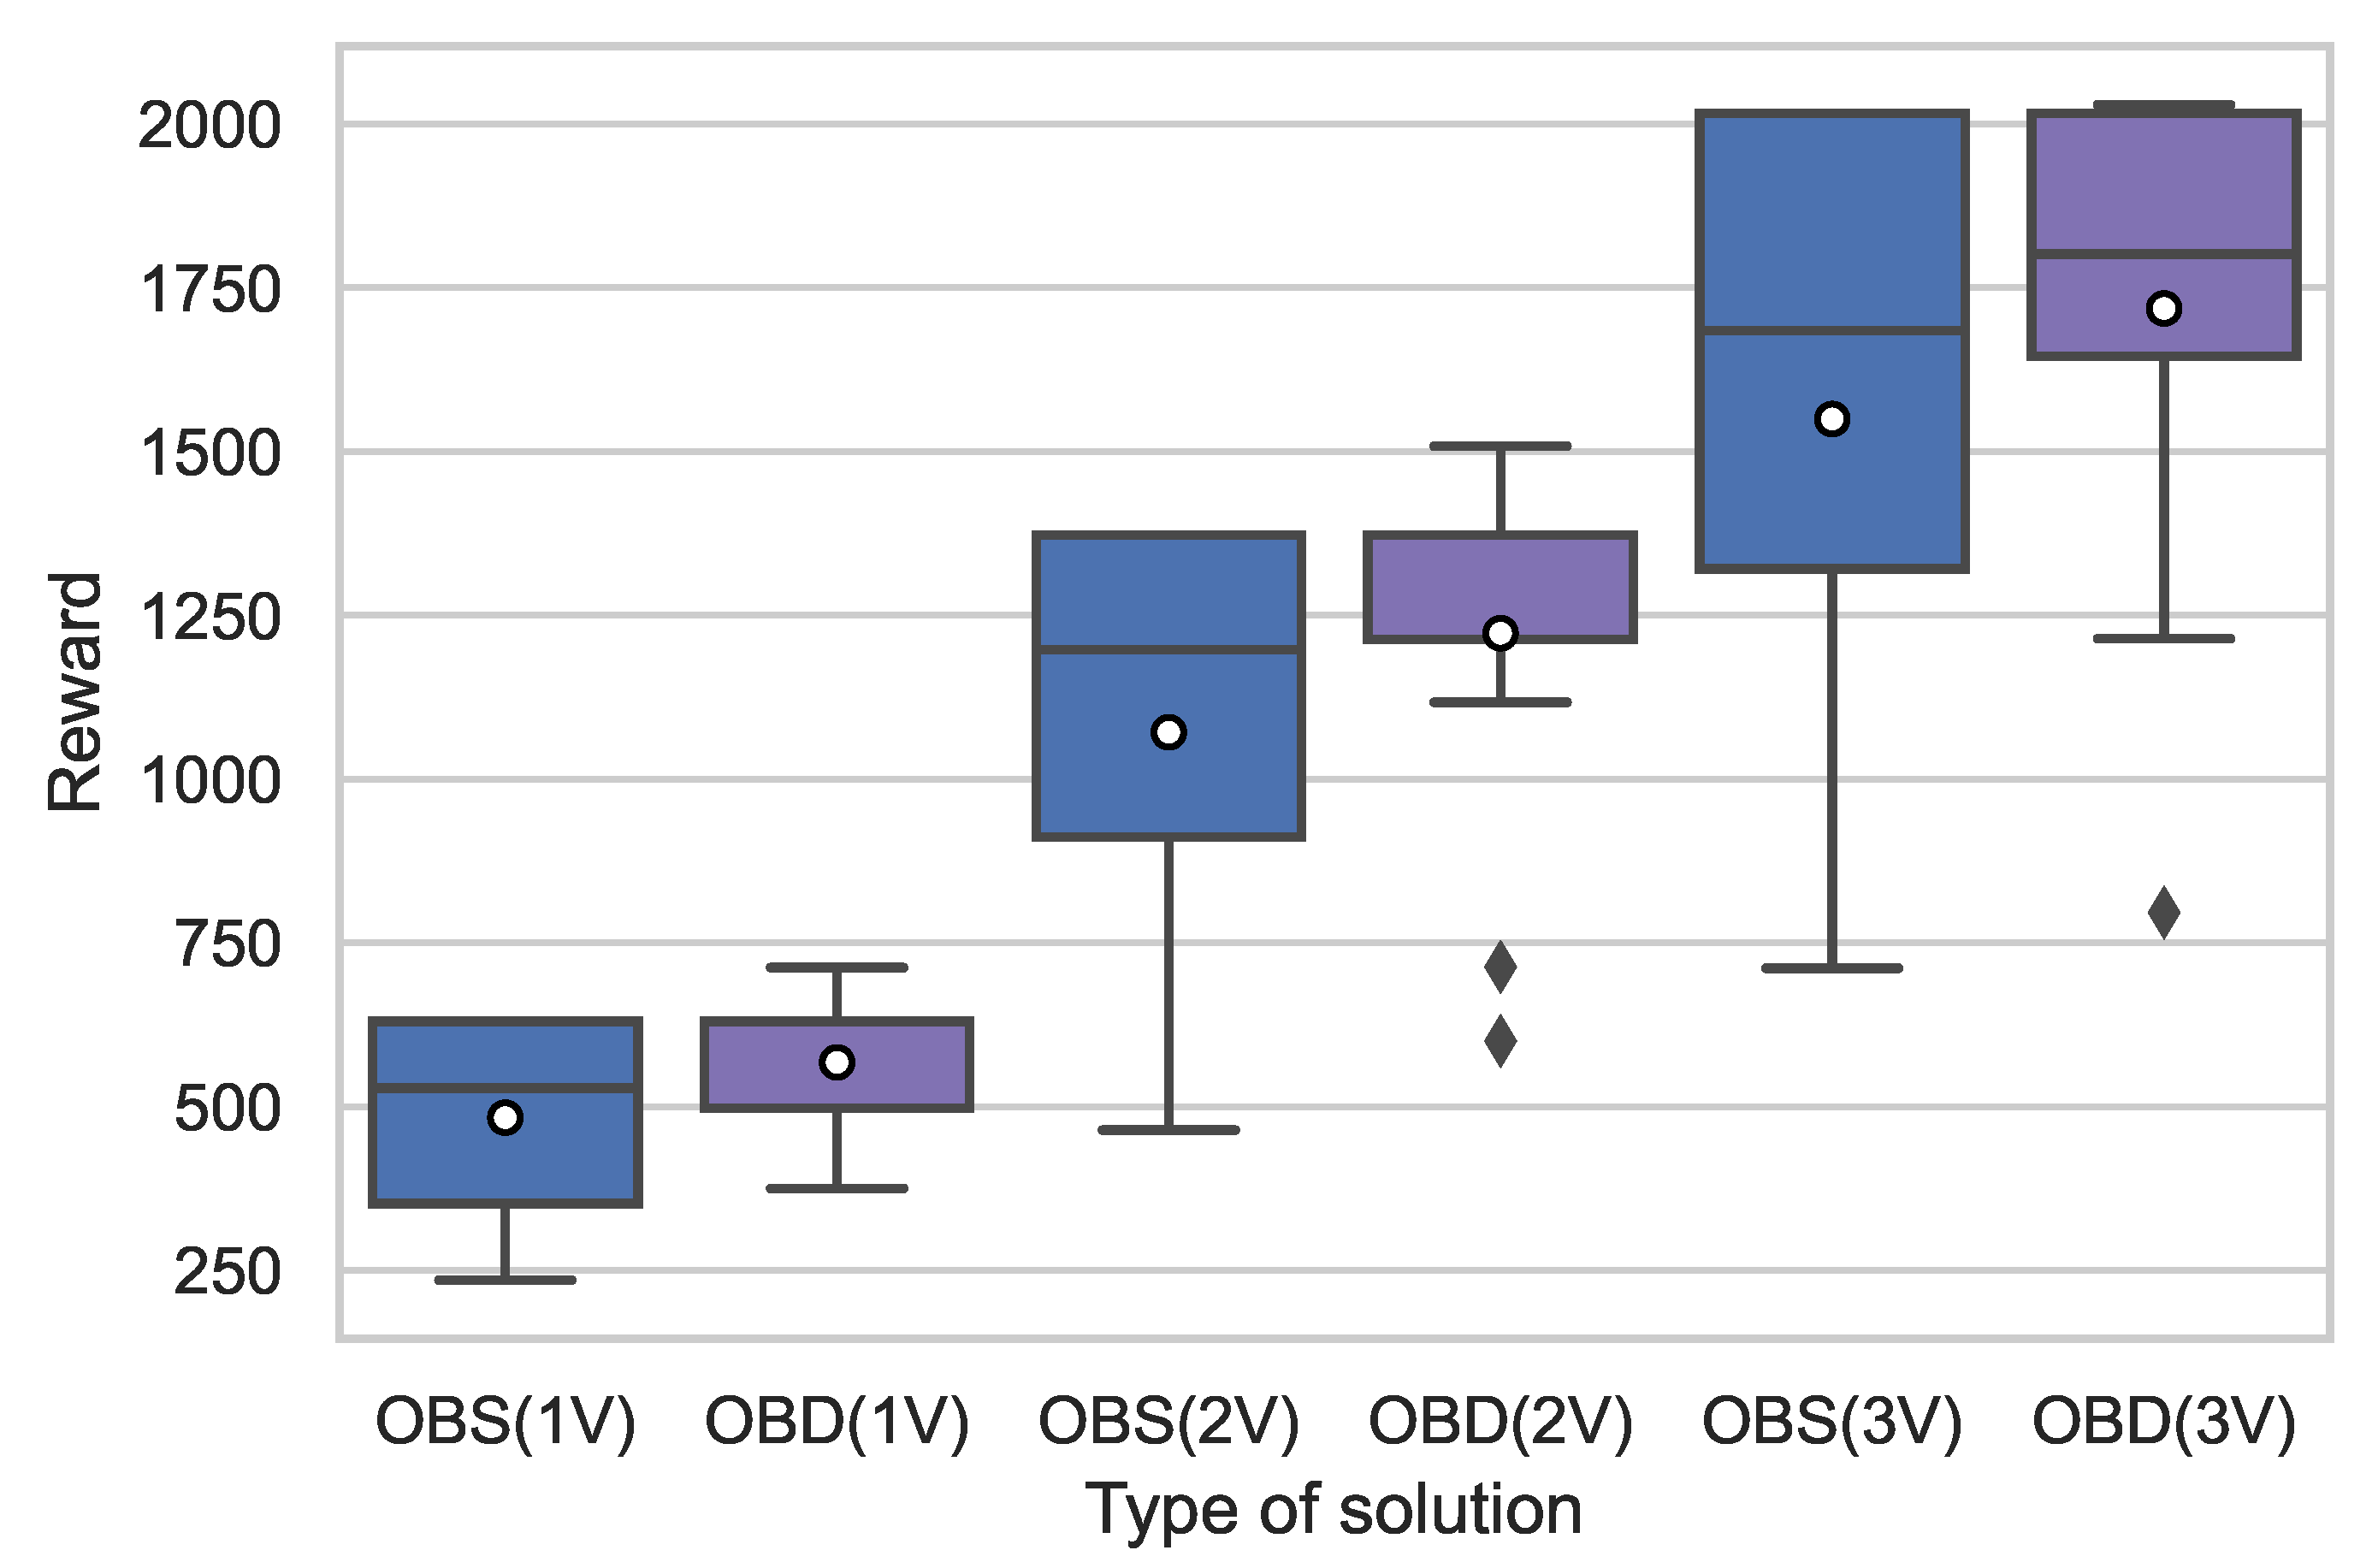
Figure 6 displays the distribution of the reward obtained for all the instances. As indicated by the white circle, the average reward obtained by the dynamic solution is always greater than that of the static solution, regardless of the fleet size. Additionally, both the upper bound and lower bound of the dynamic solution are greater than the static solution, which means that our dynamic solution can always obtain a higher reward than the static solution in both worst and best case scenarios. These results indicate that, in terms of reward, our dynamic approach always outperforms the static approach, in which the solution is not adaptable to external traffic conditions.
7. Conclusions and Future Research
In this paper, we discussed how the combination of IoT analytics from Big Data streams with agile optimization can improve various T&M activities in urban areas, especially in the context of smart cities, where users of public and private transportation systems can obtain relevant real-time information from open data repositories. To illustrate the benefits of these concepts, we studied a waste collection problem by modeling it as a DTOP-MV. To the best of our knowledge, this is the first time that this realistic extension of the TOP, which includes dynamic traveling times obtained from real-life open data repositories, has been studied. Our developed methodology employs a planning horizon approach which allows us to re-design the routes according to real-time information gathered from open data repositories in order to enhance the vehicle routing decision under dynamic changes of the traffic environments. In order to illustrate the effectiveness of our approach, a series of computational experiments is provided. In these experiments, our proposed dynamic approach is compared against a traditional static approach to quantify the differences between ignoring or not the dynamism in traveling times. The results of the experiments clearly show that our proposed dynamic approach outperforms the static one in terms of rewards, it illustrated how a good collection plan under static conditions can become a sub-optimal plan when dynamism is introduced into the scenario. Furthermore, the positive results from instances with different fleet sizes also prove the flexibility and scalability of our algorithm in terms of fleet sizes. Therefore, compared to traditional static approaches, our dynamic approach is more suitable in practical situations, especially in urban areas, where the travel time between two points can be easily influenced by fluctuating traffic conditions, such as traffic congestion in rush hours. Additionally, besides solving WCP, our proposed approach can also be extended into other practical applications such as tourist trip design problems, resource allocation problems (e.g., allocation of fire trucks during large wildfires) and vehicle routing problems with optional nodes. Nevertheless, it is worth mentioning that we have not included the loading capacity constraints in our model. However, when larger items must be transported, this constraint can be relevant and, therefore, should be included in the algorithm.
For future research, we plan to incorporate Predictive Transport Analytics, i.e, machine learning models to forecast the dynamic inputs of the optimization problem and feed this information to the agile optimization engine, which will then enable the T&M system to take real-time decisions while considering the future environment of the problem.


