1. Introduction
Online Social Networks (OSNs) redefined the way we communicate. Since their inception, they evolved from a way to share media and information among small friends networks to an entire medium to consume and share content. With the increased number of users, social networks began to work as a news aggregation medium. In fact, a study conducted by Pew Research Center concluded that in 2020, 71% of adults in the United States use OSNs to get some type of news content, with 53% of the respondents stating that they use this medium often or sometimes for news consumption [
1]. The popularity of the medium and the anonymity allowed on the creation of new accounts contributed to the rise of malicious actors. In the early days of OSNs, these actors were responsible for the propagation of spam. However, these actors, or as we may more properly name them, malicious accounts, are now focusing on the propagation of false or extremely biased information with the main objective of influencing users’ perception on topics such as politics and health. This content is often known as “fake news” and its effects already affected real-world events, such as elections and health-related topics, namely, conspiracies regarding the new coronavirus (COVID-19) pandemic. Historically, the impact of false information already had severe consequences. For example, in 1983 a conspiracy began to spread that HIV was fabricated in a United States facility [
2]. This rumour circulated worldwide and was reported by a television newscast
https://www.nytimes.com/2018/11/12/opinion/russia-meddling-disinformation-fake-news-elections.html (accessed on 10 November 2021). Although it was posteriorly fact-checked, the consequences are still present today, with some studies suggesting the existence of a high percentage of believers in HIV-related hoaxes [
3,
4].
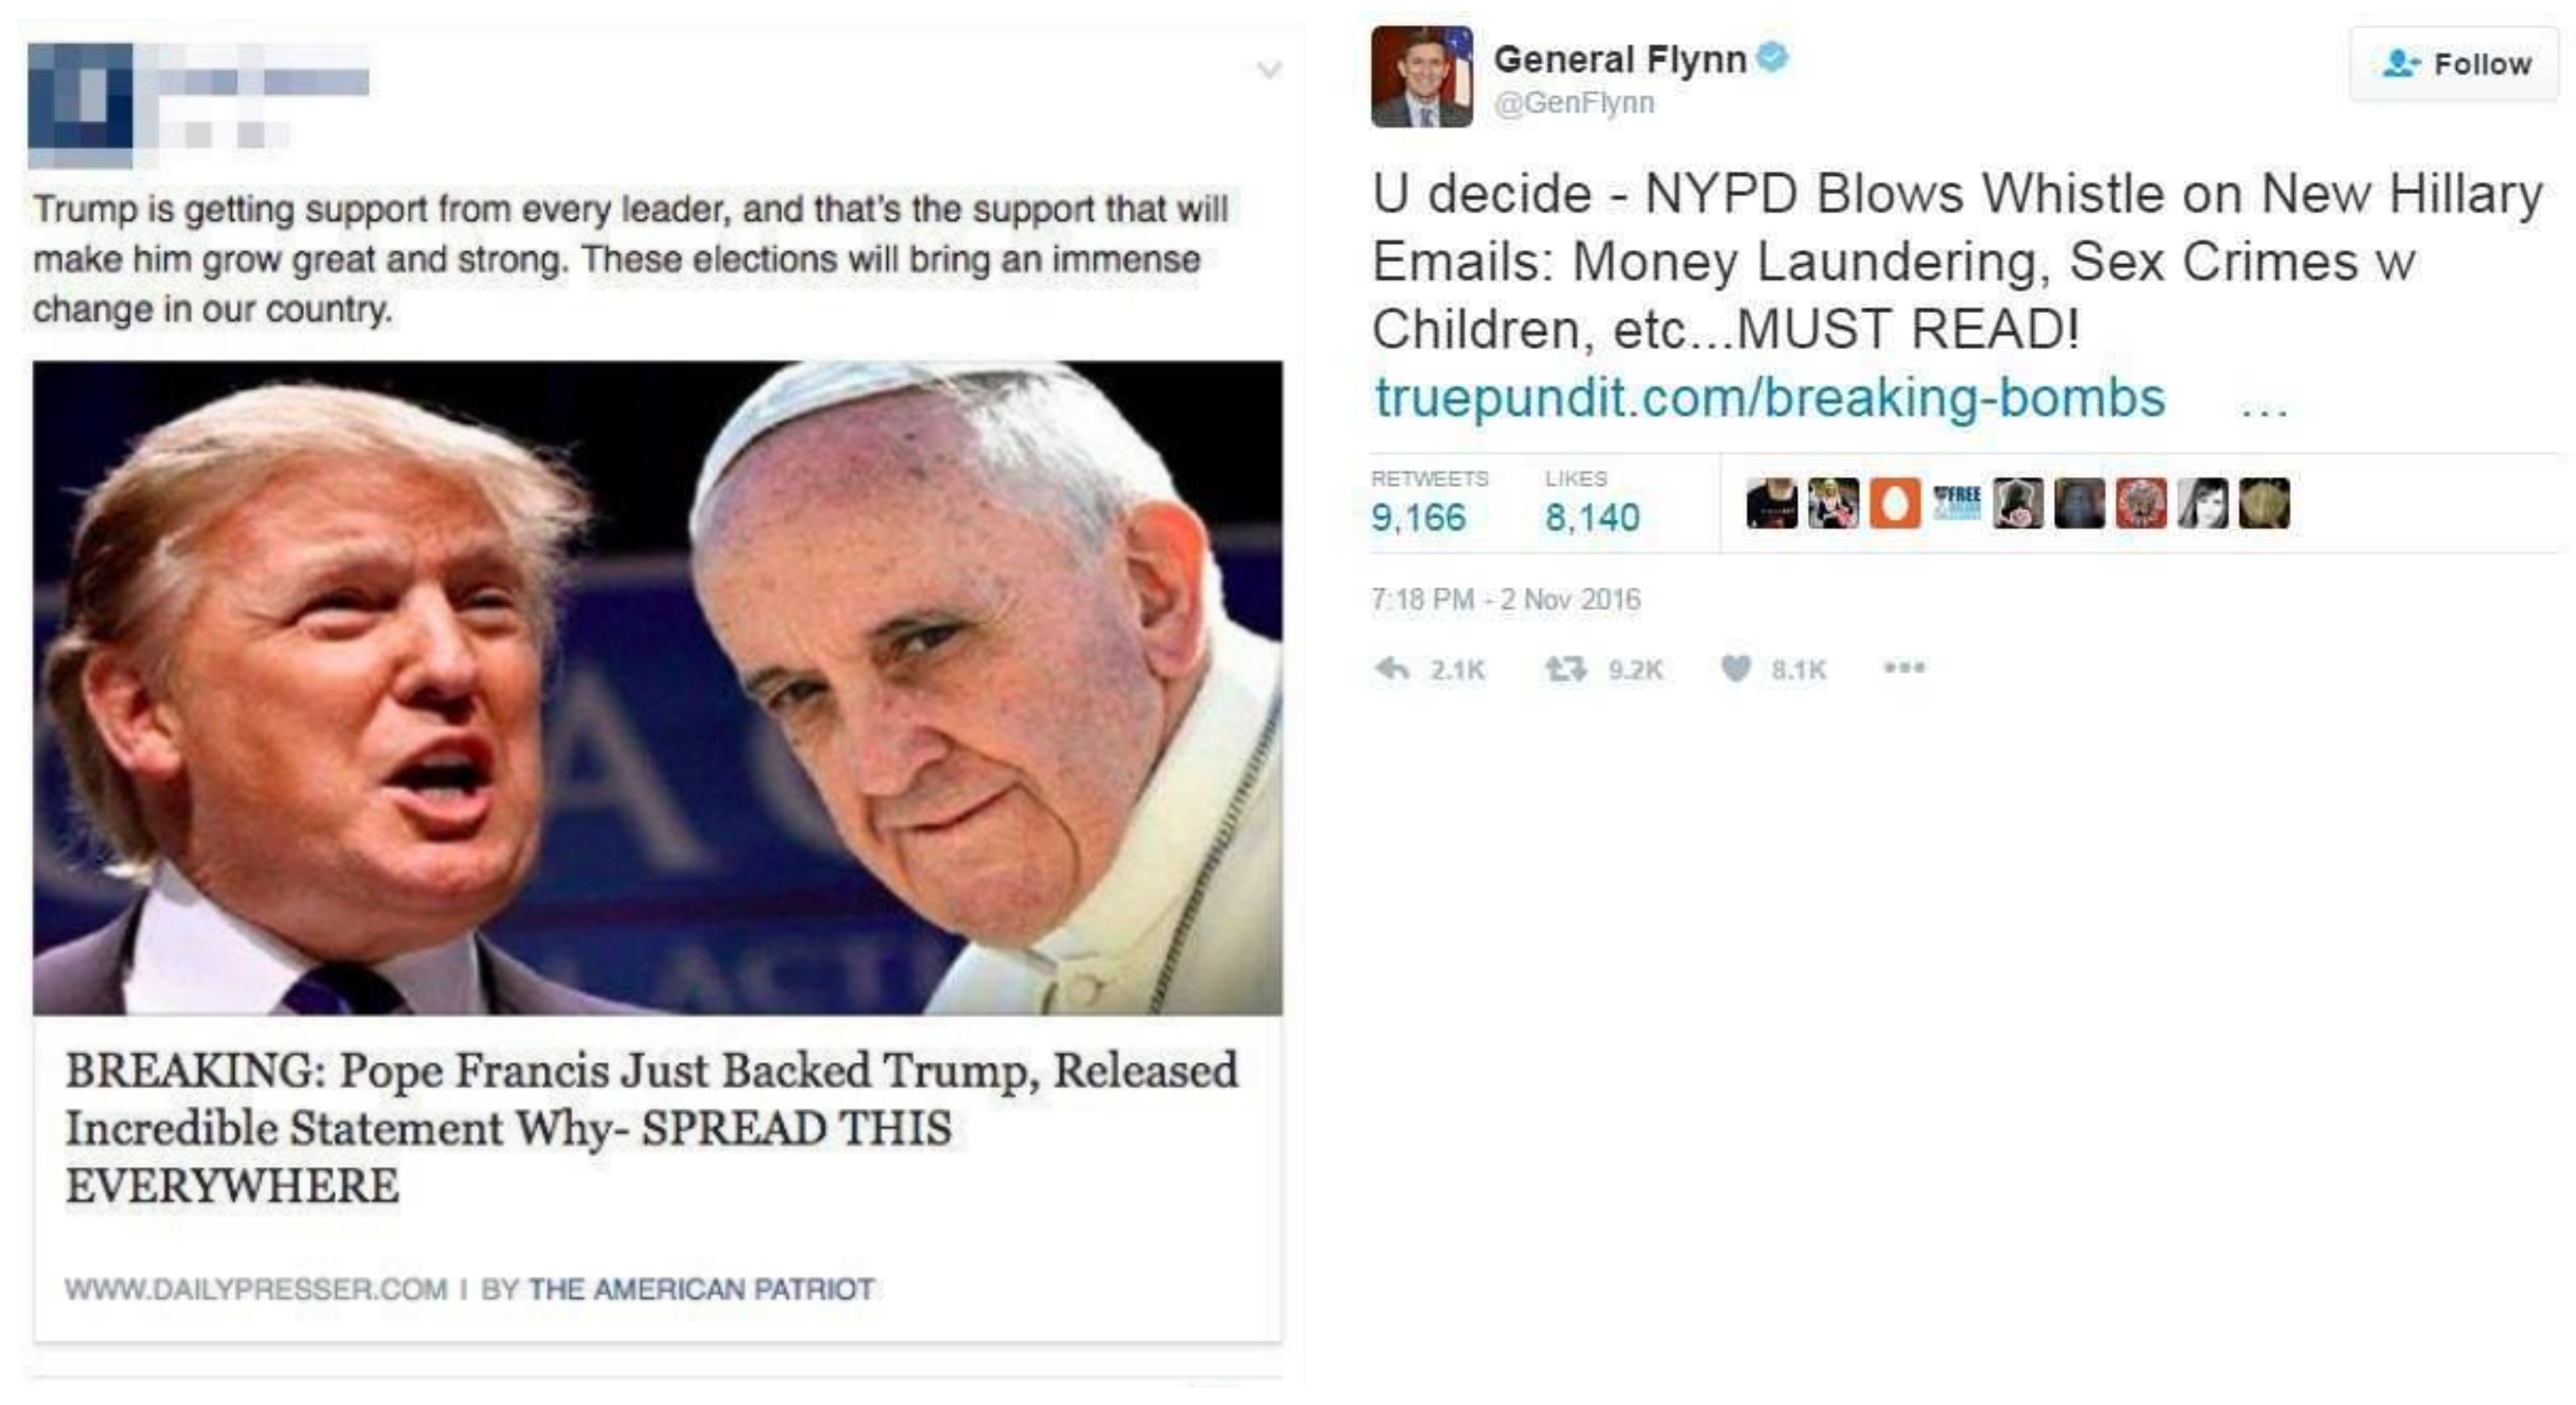
More recently, an investigation conducted by a special counsel (commonly known as “The Muller Report”) provided evidence on the interference of Russia in the United States Presidential Elections in 2016 by spreading false information in social networks [
5]. Some examples of popular fake news amid the 2016 United States Presidential Election are presented in
Figure 1. Finally, with respect to COVID-19 the effect of fake news has caused distress and emotional overload [
6] as well as a decline on the intent of taking the vaccine [
7].
Due to the severity of the problem, efforts to mitigate the diffusion of fake news were conducted by the research community. These efforts are evident by the increasing number of publications each year regarding the term “fake news” [
8]. However, studies that focus on the detection of fake news in social networks use data retrieved in a short period of time or specific to a particular event (e.g., elections). Thus, the performance obtained by each model can be influenced by the lack of diversity of the topics or the repetitive fake news being diffused concerning a particular event. This means that the models are evaluated in the same topics and events they were trained in, leading to a possible over-fitting scenario. Consequently, when applying these models in a more pragmatic, real-world situation, it is not clear if they are able to generalize their predictive capability to other topics thus achieving a stable performance through time. This information is essential to guarantee the development and deployment of fake news detection systems since the longevity of these with respect to performance is essential to avoid constant adjustments or retraining of the models.
In this work, we focus on developing fake news detection models in social networks and evaluate their performance in a long-term period. The data used in the training and evaluation of the models spans 18 months of fake and true news that includes important events favorable to the spreading of false information, such as the 2020 US presidential elections and the rise of the COVID-19 pandemic.
The remaining of this paper is structured as follows: in the next section, the current state of the art of fake news detection is described. In
Section 3 the problem and experimental workflow is presented. Finally,
Section 5 describes the results achieved and
Section 7 presents the conclusions of this work.
2. State of the Art
Research on fake news has substantially increased amid the 2016 United States presidential elections, where the term gained mainstream attention. However, credibility and trust in social networks were already studied previously to this event. For example, information credibility on Twitter was studied in different events such as the 2010 Chile earthquake [
9], 2011 Mumbai Blasts [
10], 2012 Hurricane Sandy [
11], and 2013 Boston Marathon Bombings [
12,
13]. Although the majority of these works focus on the analysis of social network publications containing fake news and how they differ from real news in specific events, at least one of them [
9] used Machine Learning for the fake news detection task. Machine Learning models use large amounts of labeled examples to make predictions on unlabeled data. These models’ usage and performance were increasing in the past few years, and these technologies were already implemented in different domains such as stress diagnosis [
14], stock prices [
15] and cancer prognosis [
16].
In 2016, given the increased attention and influence that fake news had on important events such as Brexit and the United States presidential election, research on the topics began to escalate and expand to new domains. Analyses on the impact of fake news on both these events were conducted in several research studies. For example, a particular emphasis was given in the propaganda made by bots in the Brexit referendum [
17,
18,
19] while in the 2016 US Presidential Election, research focused on the detection and analysis of rumour [
20], the characterization of the fake and real news Twitter networks and how they relate to each of the candidates [
21], and the consumption of fake news prior to the election day [
22]. Other events were also tackled during this period, namely, the 2016 Austrian Presidential elections [
23], the 2018 Brazilian Presidential elections [
24], and the 2019 European Parliament Elections [
25].
More recently, the 2019 coronavirus pandemic again showed that fake news and misinformation is a problem far from solved, with conspiracy theories emerging online. Several studies are being developed to analyze the diffusion of misinformation in social networks [
26,
27] as well as the study of bots and the information they spread [
28,
29].
Complementing event-specific studies, Castillo et al. [
30] analyzed two months of Twitter data regarding trending topics and assessed the credibility of tweets using supervised machine learning approaches. The authors combined user, message, topic, and propagation features to achieve an 89% accuracy. However, the data was only referring to specific topics and in a short period of time. In addition, chronological progression was not considered in the evaluation of the performance of the model. Concerning big data fake news analysis, the study conducted in [
31] contains data from 2006 to 2017. However, the main focus of that paper is assessing the characteristics and diffusion patterns of fake news instead of developing methods for its detection.
When discussing the detection of fake news in social networks, two lines of work emerge. The first is tackling fake news as a traditional machine learning classification task where, given a set of input features, the goal is to determine if a post is real or fake. The other is “stance detection”, which aims to detect a rumour or false piece of information given the stance of social network users. The latter was discussed in several studies where the stance of the propagation tree of the rumour (i.e., the comments and shares of the original post) may contribute towards the correct identification of the veracity of the rumour [
32,
33]. However, these approaches require the propagation tree which implies that early detection is very limited.
The work presented in this paper can be included in the most traditional approach where, depending on the features chosen, early detection of fake news posts can be achieved. Formally, the fake news detection task can be presented as follows: given a set of input features and a target variable which often takes the values of “real” and “fake”, we aim at approximating the unknown function f such as ).
In the current literature, several different groups of input features and machine learning models were used to tackle this task. Concerning features, studies centred on using account, post, text, and propagation features. The features retrieved based on account information include the number of followers and friends, verification status, account age, and number of posts [
9,
34,
35]. In addition, the absence/presence of biography, profile picture, and banner are also frequently used [
36]. Depending on the social network, specific features can be also retrieved. For example, some studies use the account’s gender and username type which is available in the Weibo social network [
37,
38,
39].
Post-based features are derived from the information of the publication either by analyzing the text or by extracting social networks specific indicators (e.g., likes, comments, shares). Common features used in fake news detection include text statistics such as the text length, number of words, and percentage of uppercase letters in the tweet. Punctuation is also often analyzed with the presence of exclamation and interrogation marks being the most frequent features. In addition, the quantification of hashtags, mentions, URLs, and other social-network-related entities are also often considered. Furthermore, additional features can be extracted from the post’s text using Natural Language Processing (NLP) techniques. The sentiment, parts of speech, and entities (using named entity recognition) present in the text are a few examples of the features used in several studies [
9,
34,
35,
36].
Bag of words and word embedding models (such as Word2Vec) were also explored as input features in the task of fake news detection [
20,
34,
40], as well as features based on the psychological meaning of words (using the LIWC tool [
41]) due to the psycho-linguistic characteristics transmitted in fake and real tweets. Less used features include readability scores, link credibility via WOT (
https://www.mywot.com/ (accessed on 10 November 2021)), and Alexa rank (
https://blog.alexa.com/marketing-research/alexa-rank/ (accessed on 10 November 2021)) [
36].
Finally, the integration of media in social media posts allows a large number of additional features that can be retrieved. Although there is a large study area on the identification of fake/manipulated images on social networks, research such as [
42] combine text and image features for the identification of fake and real news in tweets. The authors proposed visual features such as clarity score, coherence score, diversity and clustering score to show that the combination of these features with more traditional based ones yields a better overall performance on the detection of fake and real news tweets. Another work [
43] combines text and image features (extracted from the pretrained VGG-19 neural network) to detect fake news and discriminate between different events. However, both these approaches are limited to the social media posts that have media attached.
A final group of features used in the fake news detection task, and sometimes overlaps with the stance detection approach, involves propagation and link-based features. For example, features based on the analysis of cascade of retweets such as depth, maximum sub-tree, and maximum node are proposed in [
30]. In addition, the work by Wu [
38] also presents additional propagation features based on the reposts of the original post (i.e., the post to be analyzed) such as the average sentiment, doubt, or surprise of reposts, as well as the interval of time between the original message and the reposts.
Regarding the supervised models and metrics commonly used in fake news detection, these are frequently adopted from more traditional classification tasks (e.g., sentiment detection). For example, the studies by [
30,
35,
40] use Decision Trees and achieve an F-score between 0.83 and 0.86. In [
37,
38,
39] and again [
35], Support Vector Machines (SVMs) are the best performing models, accomplishing F1-scores between 0.74 to 0.90. The use of ensemble models is also considered in some studies. For example, in [
34] XGBoost achieves the best performance (0.9 of F1-score) from a set of traditional and ensemble models. A less common approach is the harmonic Boolean approach presented in [
44] that relies on the users’ social feedback to predict if a post is a hoax or non-hoax. Although the authors describe excellent results (99% accuracy), the model relies on crowd sourcing the opinion of users based on past behaviour. Thus, it seems unfeasible to apply this model in the absence of social feedback.
More recently, several works focused on the use of more complex models (deep learning) in the fake news detection task. However, these models are more frequently applied in articles from fake and real news websites. Kalyar et al. [
45] used several word-embeddings and BERT encoders with machine learning and deep learning classifiers in news articles propagated during the 2016 United States Presidential Elections. Similarly, BERT was also used to detect fake news spreaders [
46] and for the classification of false and real claims [
47].
Nevertheless, the majority of these results are achieved in small datasets or in a cross-validation, or train-test split scenario, where the chronological order of publications is not considered. More specifically, the time of publication is often discarded in the selection of the training and testing samples. An exception to this is the work in [
48] where the authors consider time as an important factor in the analysis of their models. However, this study is conducted in news articles and not in social media posts.
Therefore, contrary to the current literature, in this paper, we focus on evaluating different sets of features/models in a longer time period and using it as an important feature. Thus, instead of using data based on two months [
30] worth of real and fake news tweets or tweets and rumours based on a specific event [
12,
13], we approach the problem in a novel but more pragmatic direction where the data for training and testing is chronologically ordered and where our evaluation is performed in (at least) 16 months worth of Twitter data (18 months of data where the largest period of time used for model training is 2 months). This not only allows us to focus on studying the longevity of the different combinations of features and models, but also how they perform with the appearance of new topics never seen before on the training stage (such as the COVID-19 pandemic or the 2020 US Presidential Election). The evaluation of these models from a longevity perspective is worthy of studying to better plan for a fake news detection system that can be applied and work in a real-world scenario, where the topics being discussed in social networks are constantly changing.
3. Problem Statement
As it was stated previously, few studies conducted experiments regarding the development and evaluation of fake news detection models in a long-term perspective and taking into account the eventual problems and real-world limitations that can affect models’ performance. Therefore, instead of focusing on a short interval of time or on a specific event, in this study we assess the performance of fake news detection models through time contributing towards the main goal of approaching the current state of the art to more realistic and applicable solutions. In fact, a models’ longevity is an important issue to tackle when considering real-world applications since a fake news detection system that begins to lose performance through time may have a great impact on the information that passes to its users. Therefore, when aiming at developing a real-world application to detect fake news posts in social networks, it becomes crucial to study how time can affect the performance of the models.
Several problems can affect the performance of fake news detection models as time goes by. For example, the topics regarding fake and real news can change, consequently affecting the information diffused in social networks. Since the problem gained mainstream attention in the 2016 US presidential elections, several events served as a motto for the diffusion of fake news in social networks (e.g., Brexit, 2020 US presidential elections, and COVID-19). Analyzing the current approaches to the problem, it becomes unclear what is the longevity of the systems trained before they are affected (or even if they are) by the time-dependency or variation of the context in fake and real news content. More specifically, two main components can be affected by the time-dependency of fake news content: the importance that input features or indicators represent (i.e., their ability to distinguish between fake and real news posts), and the most suitable model for the task since some models can perform better through time than others.
In
Section 2, we described the different sets of features used in the literature and the different results achieved by the respective models with some achieving very different results depending on the study conducted. This lack of consensus on the performance of the different sets of features/models can be due to the limited data where the evaluation is conducted. In other words, some combination of features can work better on a particular event or in data regarding a short time interval. However, an overall lack of understanding of the importance of these features through time is missing. Therefore, our first research question is the following:
RQ1: What groups of features are the most important and more stable (i.e., feature importance is maintained) through time with the addition of chronological ordered data?
To answer this research question, we select different groups of features and assess their importance in the data collected, by analyzing what groups of features better describe our target variable (i.e., the “fake”/“real” label) using tweets from 15-, 30-, and 60-day periods. Therefore, we can analyze the importance of the features on the different time batches to better understand if more data causes a variation in feature importance. Although we could use the complete dataset to conduct this analysis, we limit our knowledge of the test data to mimic the behaviour of a real-world scenario where future data are unknown. In addition, we also opt for this decision to avoid influencing our second analysis.
Our second analysis concerns the evaluation of machine learning models in the identification of fake news in social networks through time. In other words, considering the “traditional” machine learning models and ensembles used in the literature, what are the ones that present better longevity given a fixed time interval of training data and, are they affected by topics changing? More specifically:
RQ2:Is the performance of the fake news detection models compromised through time and with the variation of the topics discussed?
We hypothesize that specific features and models can have better performance over time than others. For example, training a model with a bag of words and evaluated through time could decrease fast in performance due to the dynamic of the topics discussed in fake news content since the vocabulary used in training may lose significance over time. Alternatives that rely less on domain-specific words could provide better performance. For example, features such as text statistics (e.g., number of words, percentage of uppercase letters) or sentiment and emotion cues are more generally associated with domain and topic independence due to the majority of lexicon-based techniques used in these approaches.
In addition, state-of-the-art methods such as Word2Vec can provide useful features from the text. In particular, Google pretrained Word2Vec seem feasible for the task since it was trained in a corpus of news that contains 100 billion words. Experiments conducted previously on the classification of reliable and unreliable accounts [
49] showed that Word2Vec features have a large importance in a context where the topics being discussed change. In addition, custom-made Word2Vec can also be a suitable alternative to encompass and provide a better approach the vocabulary used in unreliable content.
To assess the two research questions, we developed an experimental setup where we consider different groups of features and models from the literature. However, we will be evaluating their performance through time in a dataset extracted during 18-month time period. This way, we can assess the robustness of the models through the rise of new topics (e.g., COVID-19) as well as confidence on the results achieved due to the large time range of the dataset.
4. Experiment Workflow
In this section, we detail the different steps of our experimental workflow. We begin by describing the data extraction and annotation process. We then briefly present the groups of features used. Finally, we detail the machine learning models as well as the metric chosen for the task.
4.1. Data Extraction
Our main goal in this paper is to evaluate the feature importance and performance of fake news detection models in a more pragmatic scenario, where features and models are evaluated using tweets chronologically ordered. However, in the current literature, there is no clear consensus among researchers on the definition of “fake news”.
For example, the authors in [
50] define it as a text “intentionally written to mislead consumers” while in Potthast et al. [
51], fake news is presented as “the observation that, in social media, a certain kind of ’news’ spread much more successfully than others, and that these ’news’ are typically extremely one-sided (hyperpartisan), inflammatory, emotional, and often riddled with untruths”. Another example can be seen in [
52] where the authors adopt the definition that fake news websites are those which “intentionally publish hoaxes and disinformation for purposes other than news satire”.
In this work, our definition of fake news is very similar to the one presented in [
51]. Thus, we define a post as fake news if it contains at least one reference to a website whose articles are included in one of the following categories:
false: the content is information that was fabricated or distort the events reported in real news (thus making them false).
clickbait: the article’s headline distorts the content of the body (e.g., by using sensationalism or exaggerating the article’s content) deceiving users to click in the associated URL.
bias: the content expresses an extremely biased opinion or narrative, presenting or omitting facts that favour the position taken or demean and insult opposing stances.
junksci: the content provided is often science-related and may refer to scientific conspiracies (e.g., miracle cures) or unclear/false scientific theories.
hate: the content is related to hate speech, advocating for discrimination or hatred based on sexual orientation, race, or others.
unreliable: the content provided is unclear and needs further investigation to determine its veracity.
To determine whether a website’s content is fake news, we used the OpenSources (
https://github.com/BigMcLargeHuge/opensources (accessed on 10 November 2021)) database. OpenSources contains a large list of online news sources where each source is analyzed and annotated according to the content of their articles. For each source, a maximum of 3 ordered labels (i.e., from the most predominant type of content to the least) is assigned. However, in this work, we focus on the most predominant label. In addition, we only selected 6 out of all the 12 different categories presented in OpenSources, since the remaining categories do not fit our definition of fake news (e.g., “satire” or “political”).
On the other hand, we define a social media post to be “real news” if it shares content from reliable sources. Thus, similarly to what was done previously with fake news, we used a set of reputable sources extracted from MediaBiasFactCheck (MBFC) (
https://mediabiasfactcheck.com/ (accessed on 10 November 2021)). Similar to OpenSources, MBFC presents manual annotations by experts concerning the content and bias of a large group of websites. For the “real news” category, we aggregate the websites from the “left-centre bias”, “least bias”, “right-centre bias”, and “proscience” since these present a high factual reporting score and low bias content. These categories include news outlets such as CBS, BBC, NBC, The Guardian, Economist, Sky News, ProPublica, ABC News, and Reuters. We will use distant labelling to extract posts containing real and fake news. Similar methods have already been adopted in related works [
53,
54]. Due to easy data accessibility and worldwide use, we chose Twitter as our social network for this process. We implemented a crawler that uses the Twitter Search API to extract tweets that include links to the websites categorized as fake and real news. This process is done by using each website URL as a search query. Consequently, the retrieved tweets include the domain or a subdomain (i.e., an article) of the website queried. For each website, a maximum of 100 tweets was extracted daily. Tweets retrieved using the sources from the selected OpenSources categories were assigned the label “fake news”, and tweets from the trustworthy MBFC sources were assigned the label “real news”.
The final dataset of tweets contains data from 22 July 2019 to 18 January 2021. For this experiment, we removed retweets from the sample and balanced the classes by day, meaning that in each day, the same number of fake and real tweets is considered. The reasons behind this decision are the following: retweets are removed due to the influence that these may have on the performance of the models. More specifically, retweets can appear on both training and testing data. Therefore, retweets captured several times can impact the performance of the model positively (retweets on the testing set are accurately classified due to their presence on the training set) or negatively (models being trained in a large number of retweets and failing to capture the diversity of both classes). Concerning balancing both classes, we opted for this approach due to the imbalance artificially generated by the different number of sources in both classes. In addition, in a real-world detection system, depending on the user’s behaviour and connections, the system may be dealing with different scenarios concerning the number of fake and real posts. Thus, for this experiment, we decided to balance both classes. The final dataset consists of approximately 618k tweets with 309k tweets for each class.
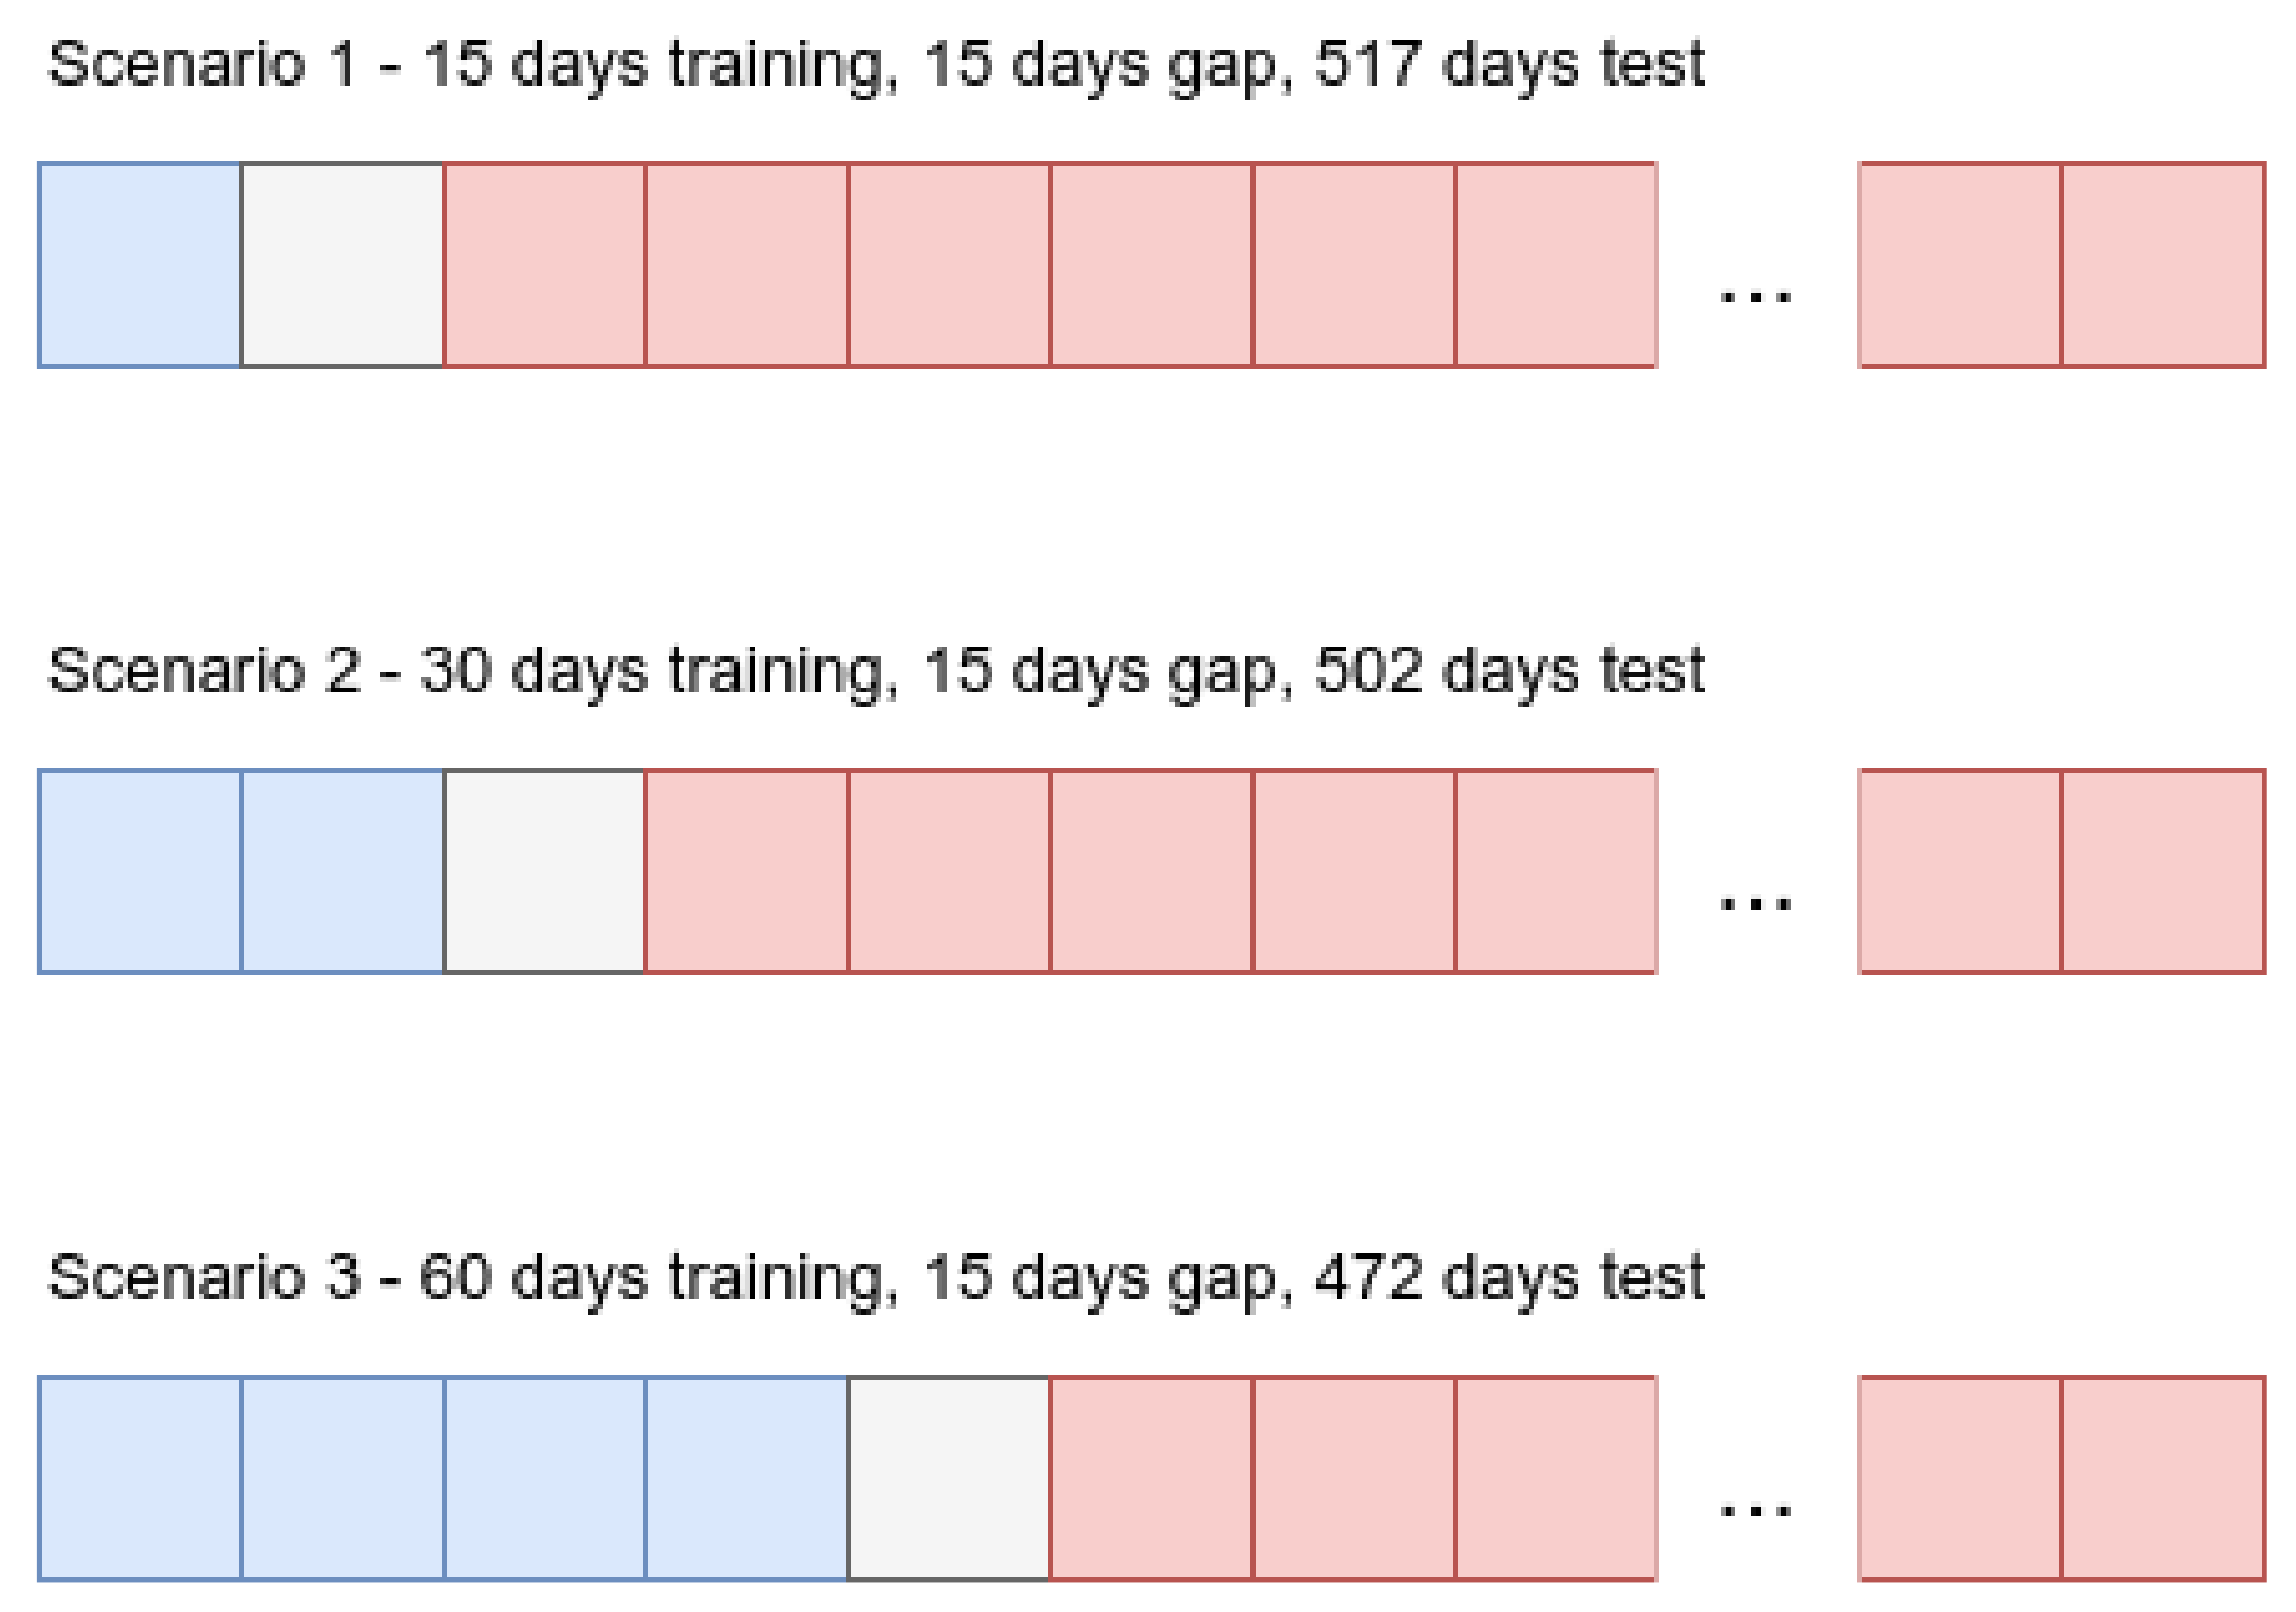
Since our goal is to evaluate the longevity of the models, we use time intervals to distinguish our training and testing data. More concretely, we approach the splitting of the data from a time series perspective where the train data and test data are ordered chronologically and are separated by a data gap. In addition, instead of focusing on the percentage of the data for each training and testing set, we divided the data using days as our splitting unit. Therefore for the training data, we experimented with three different time intervals: 15, 30, and 60 days. Furthermore, we introduced a 15-day gap between the training and testing data to minimize the impact of very similar tweets in the training and testing dataset. A representation of the three scenarios considered is presented in
Figure 2.
4.2. Feature Extraction
As mentioned previously, we implemented several features from the revised literature to understand their time dependency and importance towards the fake news detection task. We decided to exclude social-based features due to the limitations on the extraction methodology (i.e., the posts are extracted at an early stage and social interactions are still limited). In addition, we also opted to exclude account indicators due to a large number of repeated accounts on our data through time and to avoid the models distinguishing between fake news accounts instead of fake news posts.
We divided the features into the following groups considering their main characteristics and the size of each group.
Bag of words
The first set of input features uses a binary Bag of Words model to represent each post’s text. This set is intended to be used as baseline features for the classification task.
Word2Vec (Google pretrained model)
Google Word2Vec model is a state-of-the-art approach used in several studies and consists of approximately 1 billion words extracted from news articles. The large corpus in which it was trained and the large vocabulary it contains may be more accurate in capturing additional context than other approaches.
Word2Vec (Custom FakeNewsCorpus Model)
To complement the absence of more recent information on the Google pretrained Word2Vec and to include fake news examples in training data, we built a custom model of Word2Vec using the FakeNewsCorpus dataset. Succinctly, the dataset is composed of 1 million news articles from fake and real sources more information is provided in [
55]. We opted to use only the headlines of each article to build the model due to the high computational cost of including all articles from the dataset. However, it is important to highlight that the headlines used in the training of this Word2Vec model are dated prior to the tweets used in the 15, 30, and 60-day batches.
Lexical categories (Empath)
Empath [
56] is a tool similar to LIWC [
41] that extracts lexical categories from text. However, instead of relying simply on a lexical approach, it learns word-embeddings from 1.8 billion words. More specifically, Empath uses fiction stories to create word-embeddings. Then, based on a small seed of categories and terms, it extends each category based on related terms using the word model. The main difference of Empath and other approaches is that unlike Word2Vec, and similar to LIWC, these categories are posteriorly validated by human annotators, that remove the unfitted terms for each class. In addition, Empath presents 200 categories with high correlated results (0.906 average Pearson correlation) with LIWC, which makes it a suitable and more accessible alternative.
Context-free features
This set refers to features that are extracted from the text but not necessarily domain- and time-specific terms or words. We hypothesize that analyzing features that are more independent of context and topics, and are not based on language models, can bring an advantage in the performance of the models in a long-term period. The features used in this group include text statistics (such as the number of words and exclamation marks and uppercase percentage), parts of speech (such as the percentage of pronouns, nouns, and verbs) as well as sentiment and readability features.
4.3. Feature Analysis
To evaluate the impact of the different sets of features in the task of fake news detection in social media, we extracted features for each group in a 15-, 30-, and 60-day window. The following steps were then applied to each of the datasets to eliminate redundant features. First, features with a variance smaller than 10% were removed. Second, features that present a correlation value superior to 90% were also discarded. To evaluate the importance of the features in the different scenarios, we applied mutual information score. This scores measures the dependency between the features evaluated and the target variable. The higher the score, the higher the dependency. In addition, using this score we included an extra set of features composed of the best features from the different groups. Combining the data with the different groups of features results in 18 different datasets to be evaluated.
4.4. Models and Evaluation
Concerning the models and evaluation, we opted by selecting some of the most common models in the literature and that were previously mentioned in
Section 2. Therefore, we used SVMs (radial and linear kernel), Decision Tree, Naive Bayes, and K-Nearest Neighbors (KNN). In addition, we complemented this selection with the following ensemble models: Gradient Boost Classifier (GBC), Random Forest, and AdaBoost. We briefly describe each model below.
Decision Tree
Decision Tree [
57] is a tree-based model where each node has an associated feature and condition. Information gain is used to select each condition for each node. Then, for each new prediction, the tree is navigated starting from the root node until one of the leaves (which contain the possible labels).
Support Vector Machines
In classification tasks, SVMs [
58] attempt to separate examples from both classes using an hyperplane. SVM models can be Linear or Non-Linear. In Linear SVM, the assumption made is that both classes can be separated by a linear space. In Non-Linear SVM, a kernel function is used to create a new hyperplane so data can be separated in a linear fashion. In this work we used the two variations. In the Non-Linear SVM, we opted by a radial basis function (RBF).
K-Nearest Neighbour
KNN [
59] is a model that uses the neighbourhood to classify a new entry. More specifically, the most similar
k data points are used. Finally, majority voting over the k neighbors’ classes is performed to determine the new node class.
Naive Bayes
Naive Bayes [
60] is a generative model that relies on the Bayes rule to determine the label of a test entry given the input features in classification problems. Different Naive Bayes models exist based on the assumptions of the distribution of the data. It is called ’naive’ because it assumes total independence of the variables.
In Equation (
1), the Bayes rule is presented Y is the output label while
is the set of input features.
Thus, the likelihood of a label given the input features is determined by the likelihood of the features given the label, the likelihood of the label, and the likelihood of the features.
The performance of traditional machine learning models is often improved with the use of ensemble models. These consist of a combination of multiple models where each model’s output contributes towards the final prediction. A simple ensemble approach can be the use of majority voting to decide the final prediction based on a set of different machine learning models.
Random Forests
Random forests are constructed using an ensemble of decision trees. Each decision tree is trained using a random subset of the training data as well as a subset of the input features. The final prediction is made based on the class that has the highest voting (whether it is by count or average probability).
Adaptive Boosting
Adaptive Boosting [
61] consists of an ensemble of weak models arranged in a sequential fashion where each new model learns having into account the errors of the previous models. Usually, the models used are decision trees with only one node and two leaves (also called decision stumps).
Gradient Boost
Gradient Boost [
62] for classification tasks adapts a similar approach to Adaptive Boosting. However, decision trees are usually used (instead of decision stumps). In addition, decision trees are used to predict the residual instead of the label itself. The residual predictions from the different trees combined with a learning rate are then used to make the final prediction of the label.
We also added a random baseline model (i.e., a model that chooses a class at random) for each of the experiments. With respect to the evaluation metric, we rely on the weighted F1 measure. For a better comprehension of this metric, we must first describe the concepts of True Positive (TP), True Negative (TN), False Positive (FP), False Negative (FN), Precision, and Recall.
A combination of feature set/model, given an input (i.e., the set of features), will produce a prediction (fake or real). A total of four different scenarios can occur depending on the correct label and the predicted label. A corrected predict instance is considered a TP or TN, depending on what class we are considered (p.e. the positive class can be associated with the “real news” class while the negative can be related with the “fake news” class). On the other hand, an incorrect prediction can be defined as FP in the cases where a negative instance is predicted as positive and FN in the remaining scenario.
This results are usually presented in a confusion matrix like the one presented in
Table 1.
F-measure is a metric that uses Precision and Recall (or True Positive Rating), which are label-based metrics. Precision attempts to measure the performance of the model with respect to the positive cases, while Recall measures the model’s ability to correctly classify all positive instances. Precision and Recall are presented in Equations (
2) and (
3), respectively
The F-measure is then the combination of Precision and Recall and a
coefficient that weights the importance of each component. The equation is presented in Equation (
4) A
increases the importance of recall while
increases the weight of precision. In the revised literature, the majority of works used
which corresponds to a balanced F-measure and is usually referred to as
measure.
It is important to highlight that the measure is computed regarding a particular class. However, the majority of works in the literature are focused on the performance of the system regarding both classes (fake news and real news). measure in one class can also be misleading if these are imbalanced since the values are only presented with respect to a single class and both classes are relevant to the problem.
Several solutions are possible. In this work, we opt for the weighted
measure where the weight is defined by each class support.
The weighted
measure is presented in Equation (
5) where
and
are the f1-measure value for the fake news and real news class (respectively) and
and
the support (i.e., number of entries) in each class.
5. Results
In this section, we present the results of feature analysis and the different performances of each feature/model combination.
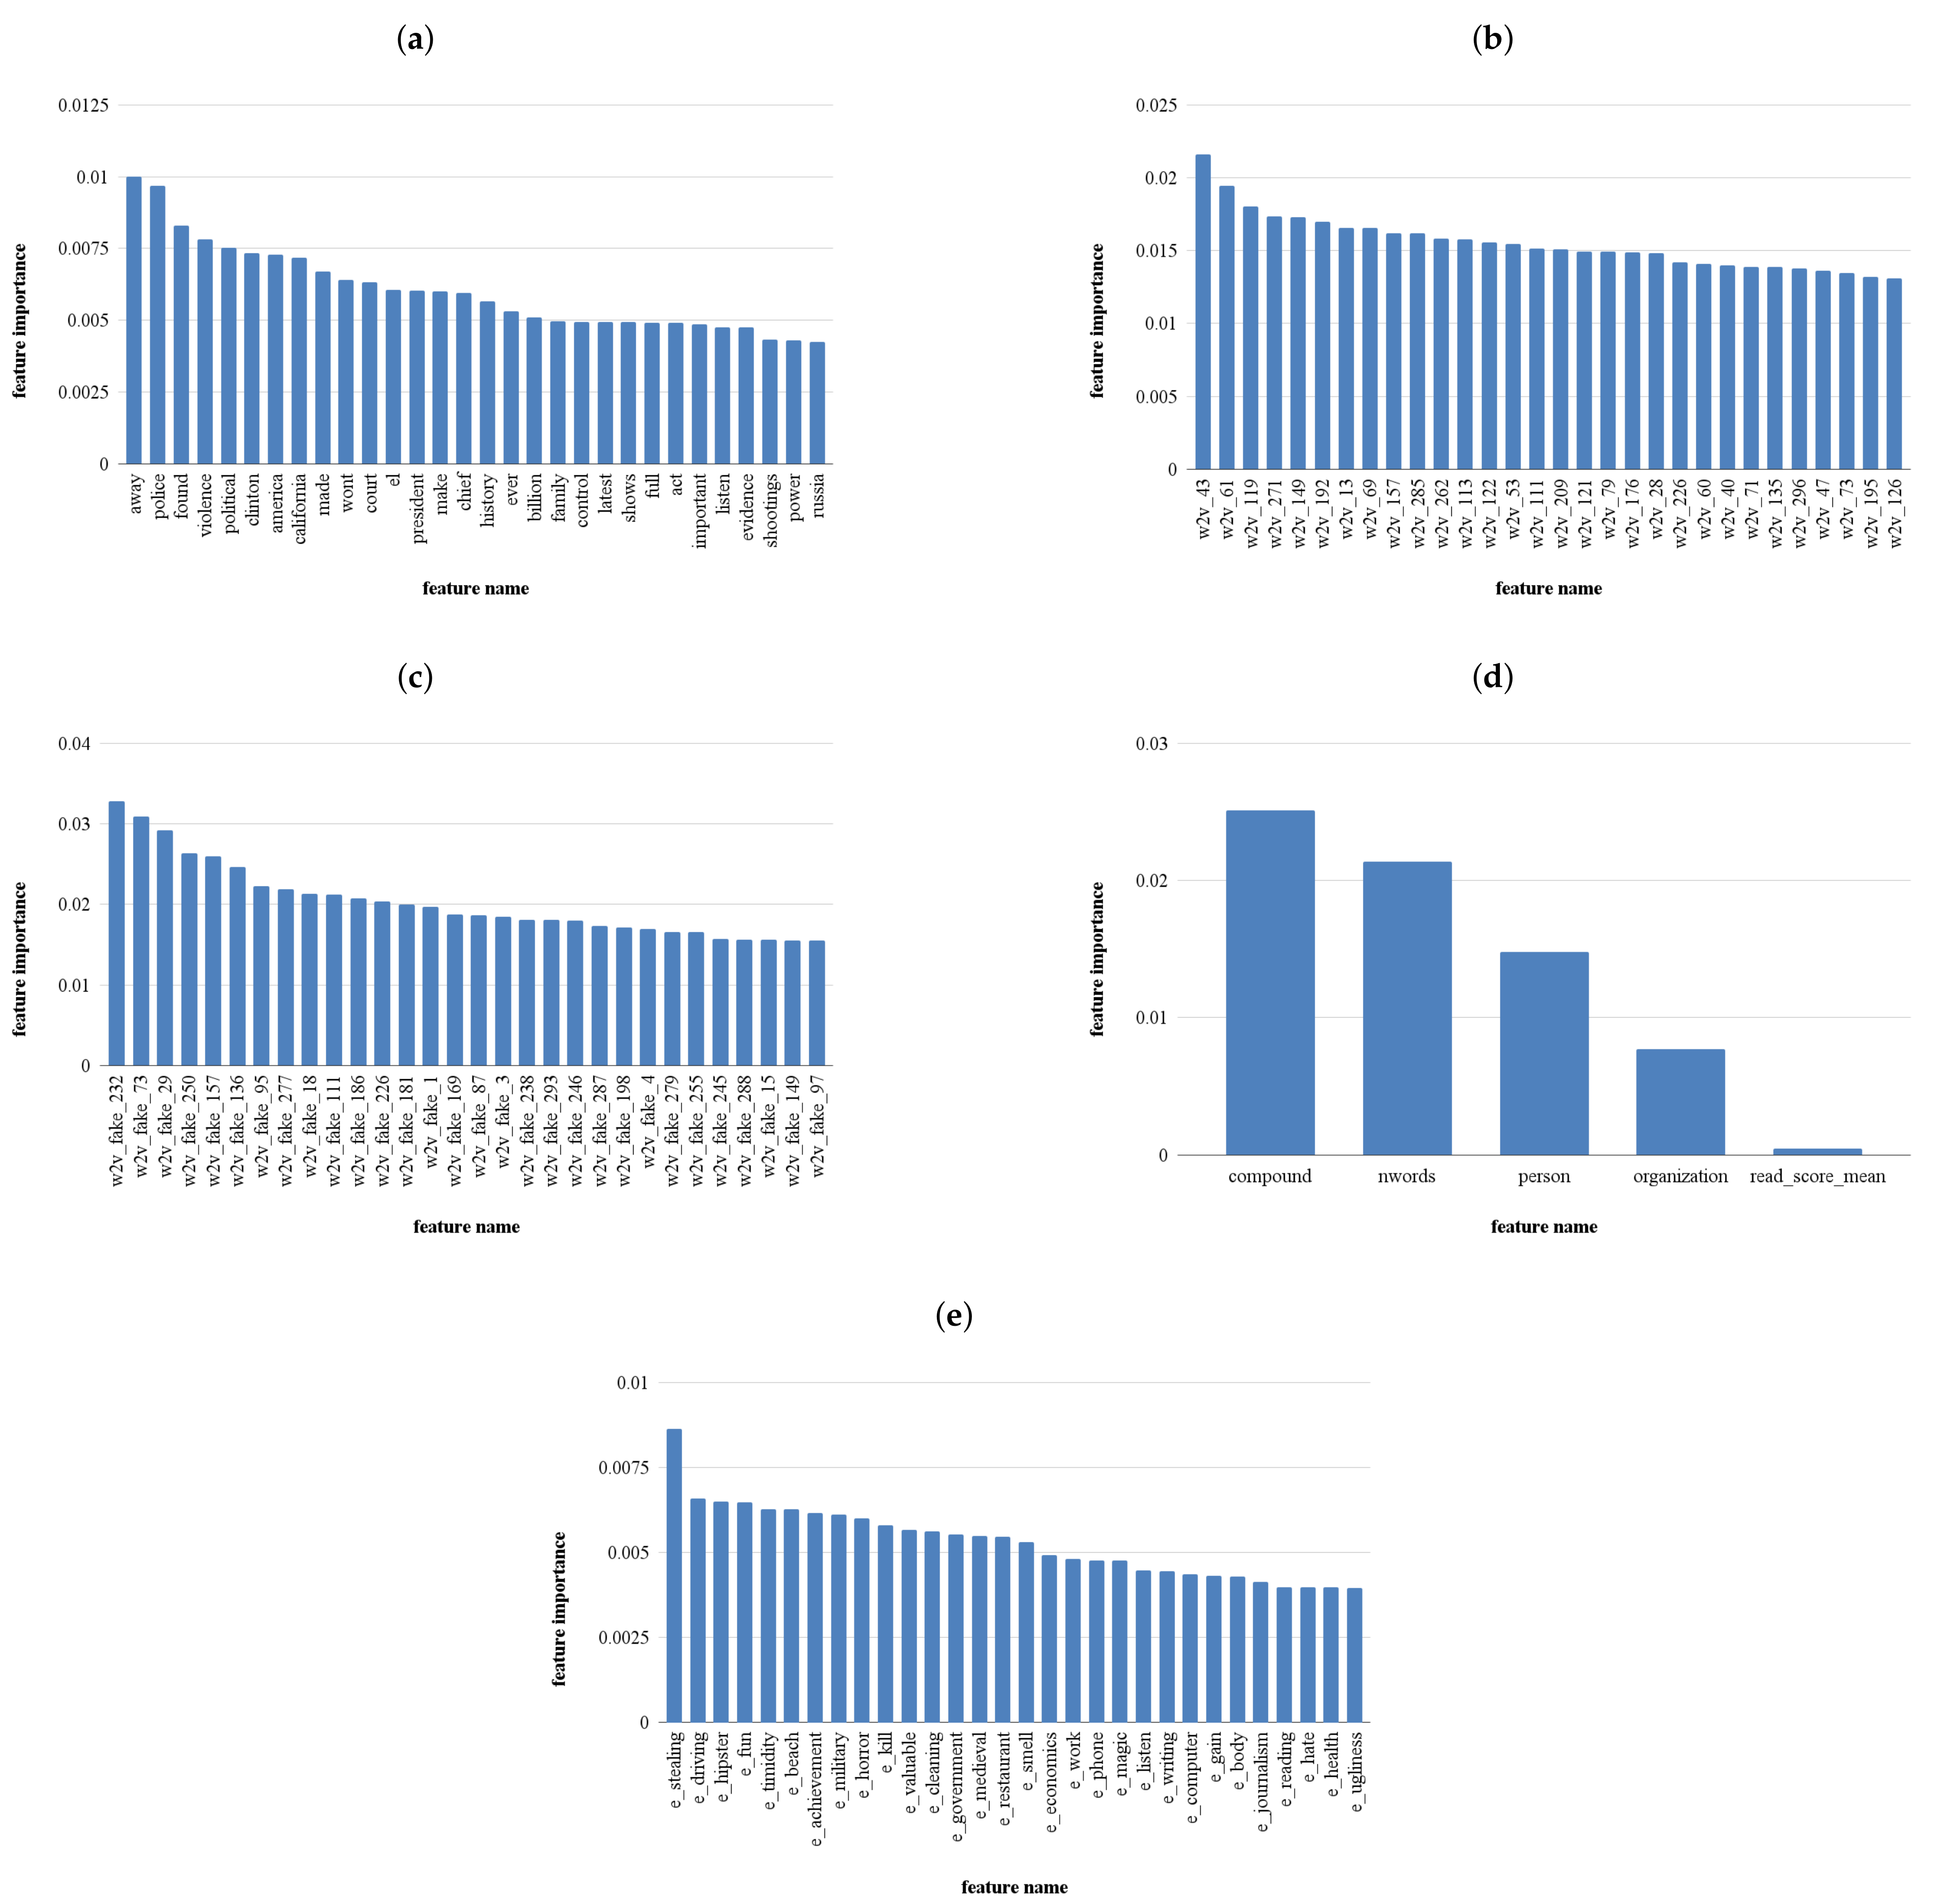
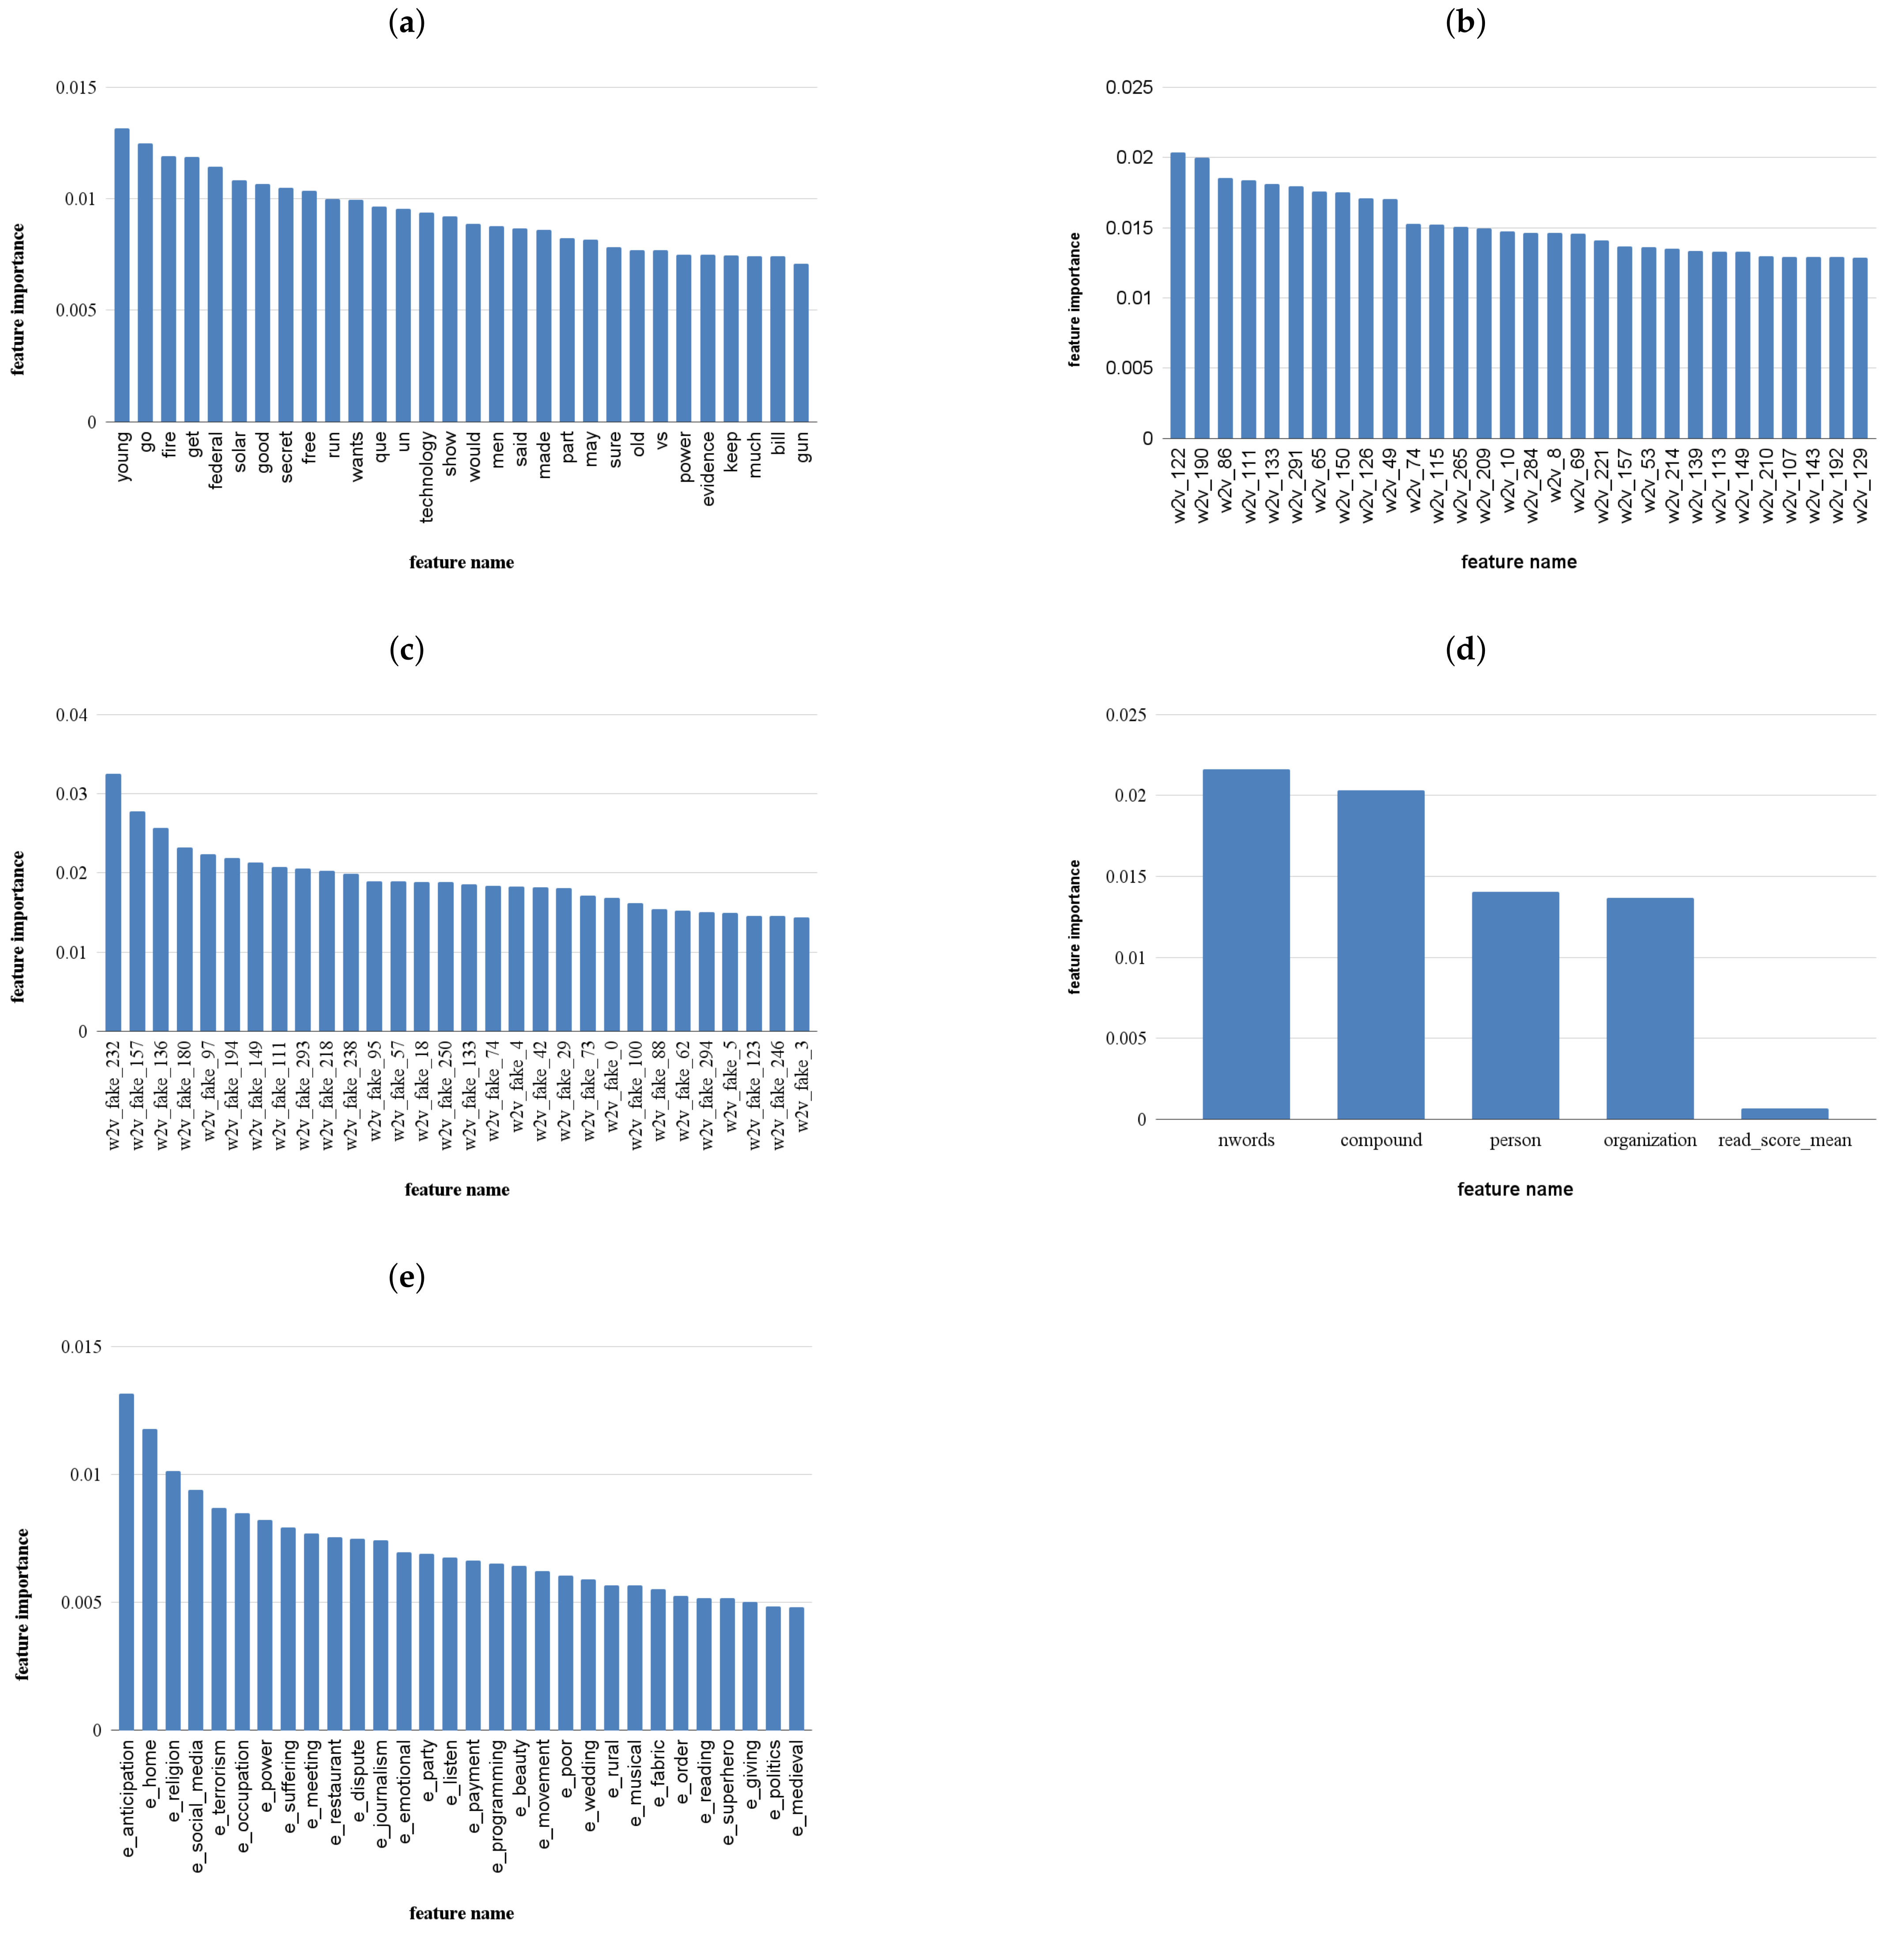
5.1. Feature Importance
Figure 3 illustrates the 30 most important features in the different features sets described in
Section 4.2, for the first scenario considered (15-day batch).
Analyzing the most important features in the lexical and context-free sets, we can observe that the presence of some features can be related to previous findings in the state of the art. More specifically, when analyzing the most important lexical categories extracted by Empath, some categories such as anticipation, emotional, and politics appear. Similarly, context-free features include the compound sentiment feature which is an aggregation of sentiment scores [
63]. The presence of emotion-related categories can be linked to how several studies associate high emotional (often negative) tone to unreliable information to affect users’ perception on the topic [
31,
48,
50].
In addition, other categories such as terrorism, power, dispute, and journalism in the Empath feature set as well as some word features in the Bag of Words set (federal, power, evidence, bill, gun) can provide some cues on the importance of certain topics/terms for the task. Nevertheless, the mutual information score obtained by the best features in these sets is between 0.005 and 0.013, which indicates that the correlation between these features and the target variable is weak. In fact, due to the analysis of the terms by unreliable and reliable accounts as well as the feature importance presented in previous work [
64], these results are not surprising. In fact, since unreliable and reliable accounts tend to discuss the same overall topics and present low feature importance using Empath, it is plausible that the results are similar in the task of detecting real and fake news posts.
Better importance scores are presented in the word-embedding (fake and Google) and context-free approaches (although with a very limited set), with the best features in these sets ranging between 0.02 and 0.03. Once again, the results are similar to previous work [
64] where Word2Vec features surpassed all the other types when assessing the reliability of an account.
To better comprehend if the low features scores are caused by insufficient data, we conducted the same analysis in the second (30-day training window) and third (60-day training window) scenarios. The complete plots for each scenario are presented in
Appendix A. In
Table 2, we represent the top 5 more important features for each feature set in each scenario for comparison purposes.
Table 2 shows how the top features from each feature change with more data. In particular, we can see that bag of words features are completely distinct in the three scenarios considered. The results are similar in the lexical categories feature set.
The Word2Vec groups show some similar top features through the 3 scenarios considered. The Google pretrained presents similar features between the 30 and 60 scenarios, namely vectors 43 and 61. The Word2Vec trained in FakeNewsCorpus titles not only maintains similar vectors in different scenarios but the top feature is the same in the 15, 30, and 60 days scenarios. In addition, the results provided by these feature sets are higher than the lexical and Bag of Words sets, which can lead to a better performance of the models trained using these input features.
Similarly to the word embedding features, the context-free features also present comparable scores. In addition, the removal of low variance and highly correlated features leads to a very reduced and similar set in the 3 scenarios considered. In addition, although the number of words is the top feature in the first scenario, compound sentiment and the number of entities are ranked higher in the third scenario. This, however, does not represent a higher overall importance score on the “compound” and “person” (i.e., the number of persons identified on the text) feature, but the loss of importance of the “nwords” (number of words in the text) feature.
To summarize, some important conclusions can be drawn from the analysis of the most prominent features for each set. Firstly, similar to the experiments conducted in previous work, word embedding features sets achieve some of the highest feature scores. In addition, the set composed of more “traditional” features and more independent of the context of the posts also present similar importance scores. Secondly, although these sets achieve the best features scores, these are still not ideal and show a low connection between them and the target variable. Nevertheless, each feature is being evaluated independently, and thus, their importance may vary when a model is trained. Thirdly, when looking at the best features’ sets (word embeddings and context-free), we can see that the top features are stable on the three scenarios considered since they maintain some features between sets and the score is not aggravated with the introduction of additional data. Similar to what was concluded in [
48], we hypothesize that this can lead to a robust performance of the models through time and that performance degradation happens slowly. In Horne et al. study [
48], performance decrease was noted after 38 weeks in a similar scenario, but applied to articles instead of social media posts.
Therefore, to answer our RQ1, considering all sets of features, we can conclude that feature importance is not constant with the addition of more data. However, the word embedding group of features achieve higher feature importance than the other feature groups and maintain some of the top features across the 15, 30, and 60 days time batches. Therefore, we hypothesize that these groups of features are more likely to be unaffected by the change of topics in fake and real news and consequently, being the ones that will guarantee a better overall models’ performance.
5.2. Models’ Evaluation
In this section, we assess the performance of different models using the features sets described previously. For models’ training, we consider the three different scenarios. For models’ evaluation, we used the remaining data (apart from the 15-day gap).
Similar to what was done in the previous section, we opted by removing features with low variance and features highly correlated. However, we did not apply the mutual information score to determine a fixed number of features. Instead, we added a new set composed of the best 15 features (according to the mutual information score) in all the different groups considered.
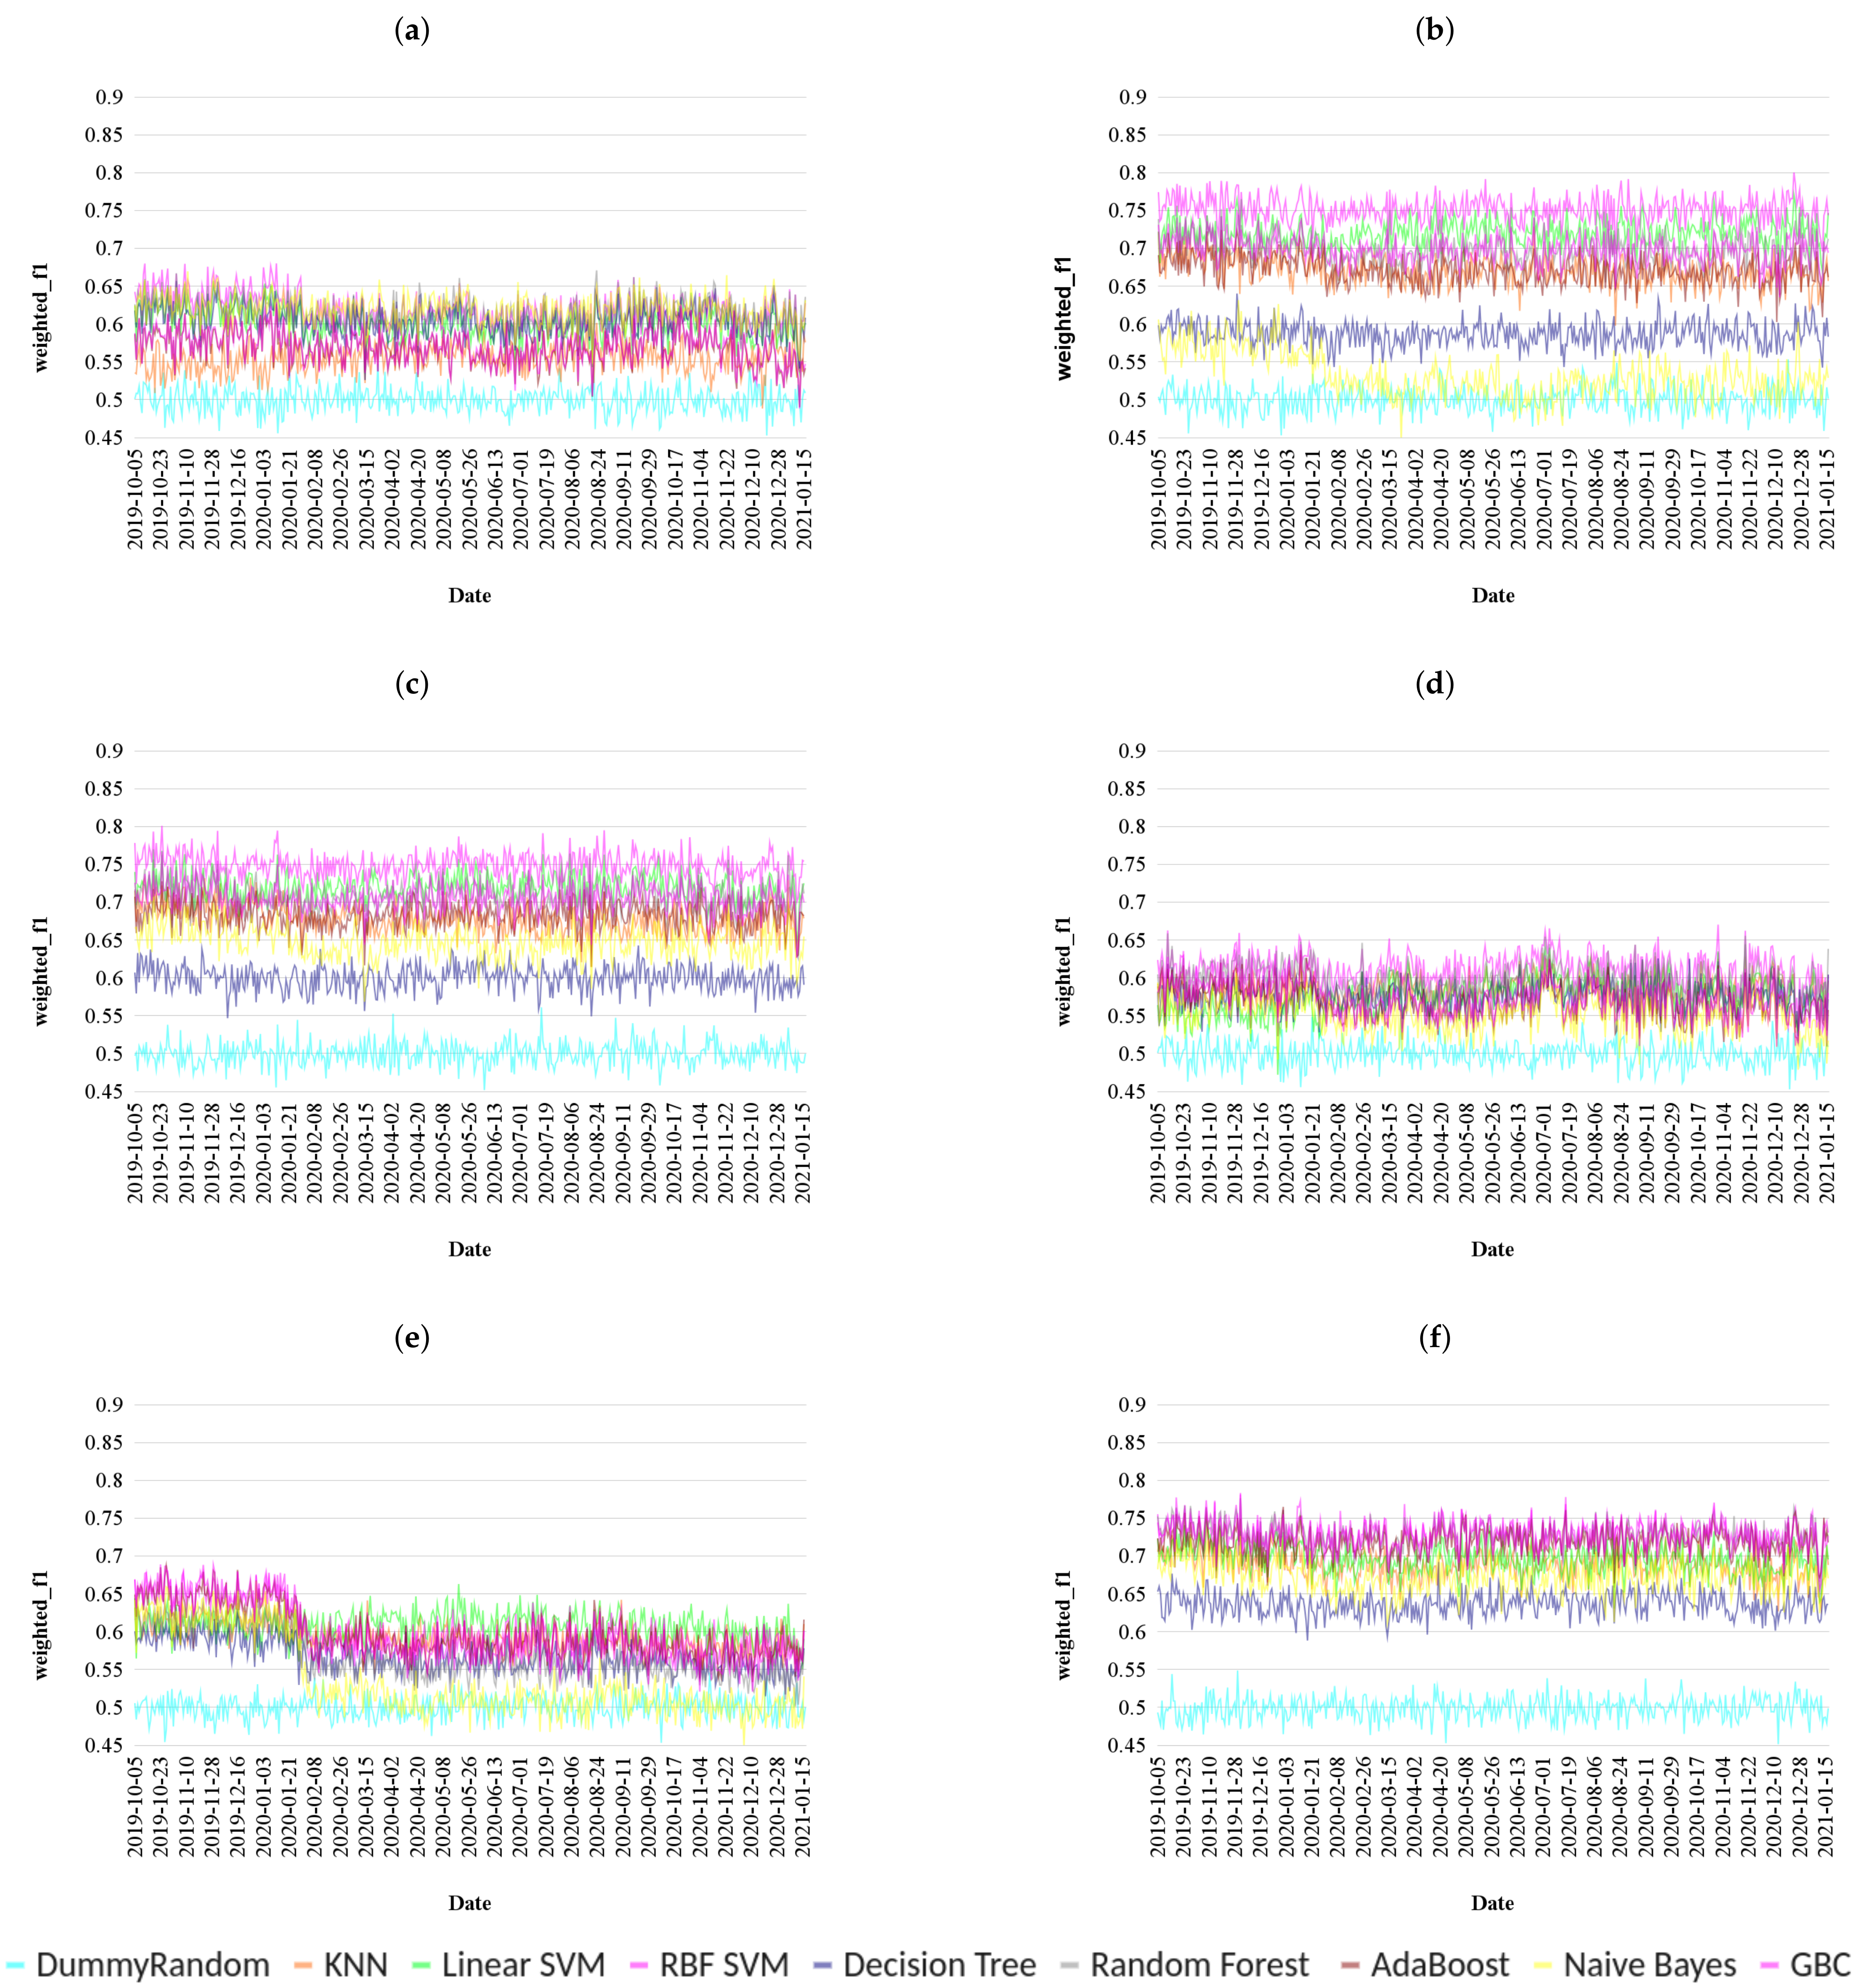
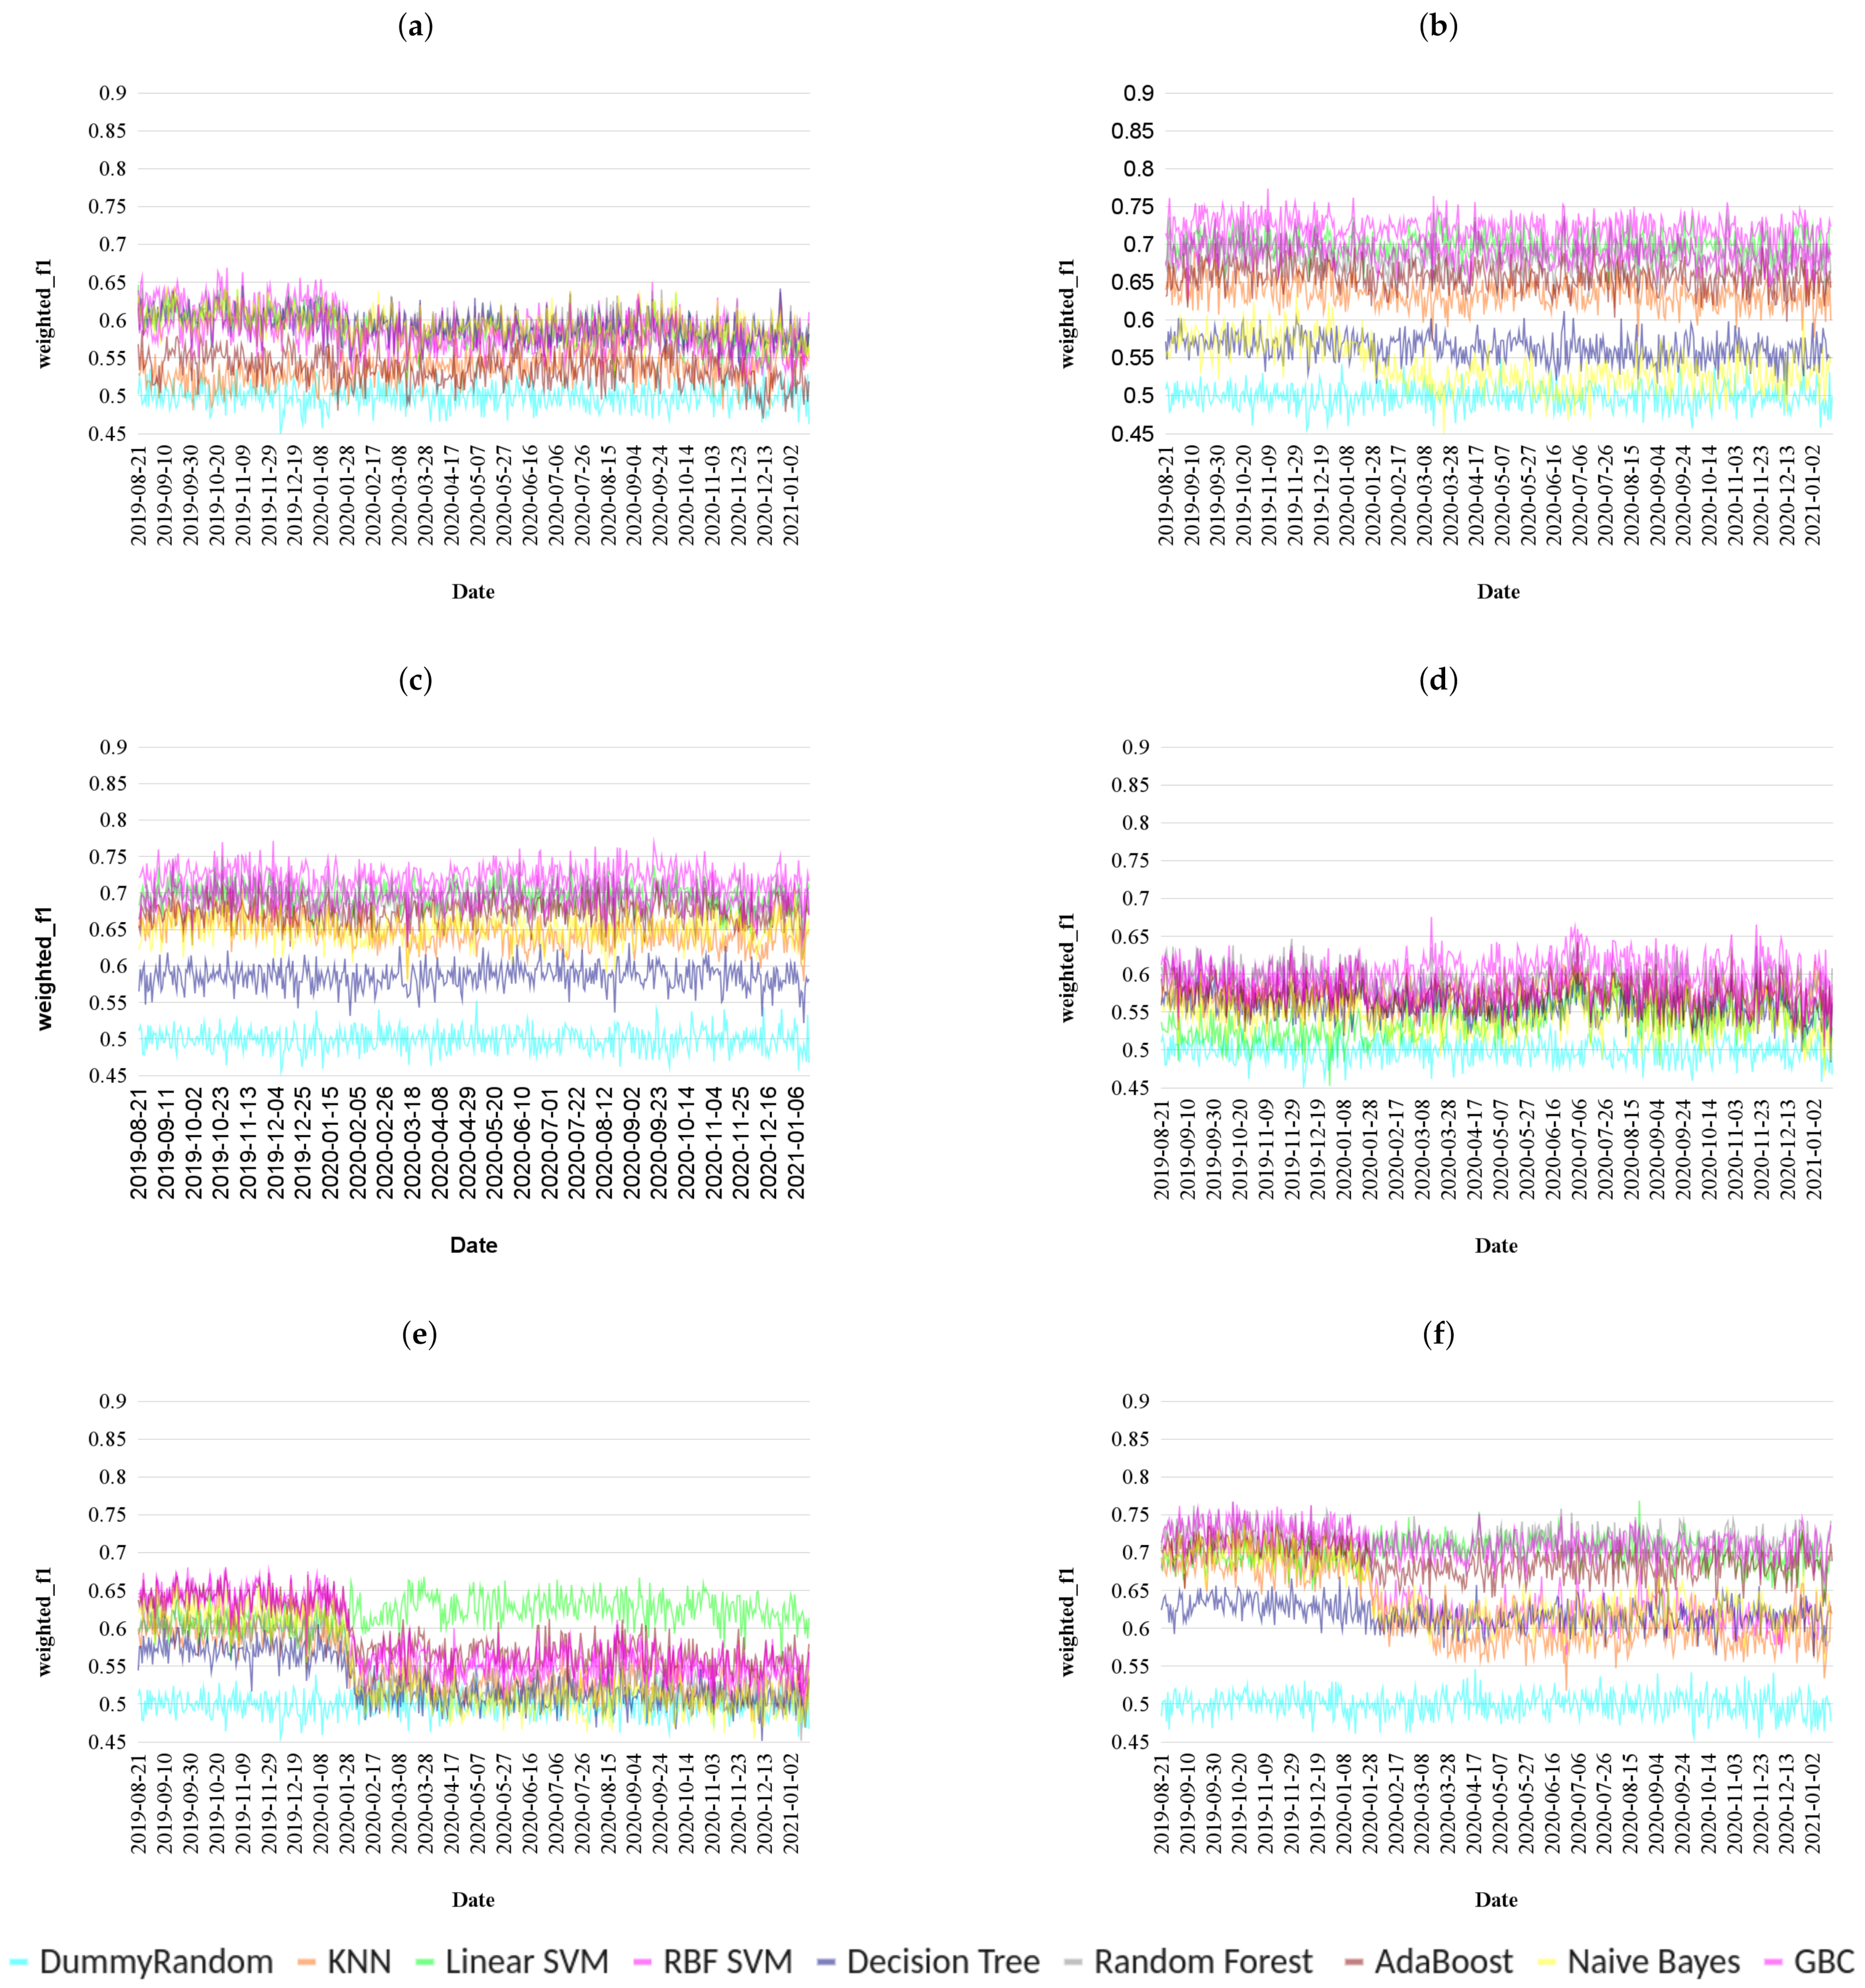
The results for the first scenario are presented in
Figure 4.
In the first scenario analyzed, it becomes clear that some sets of features achieved higher performance than others (using a training window of 15 days). The Bag of Words, context-free and lexical categories features are the ones that achieve the lowest values through time with the best models’ performance situated between a weighted f1-measure of 0.6 and 0.65 for the context-free features and 0.55 and 0.65 for the bag of words and lexical categories. The Google and Fake Word2Vec sets accomplish a superior performance with the best models scoring between 0.65 and 0.75 on average. Finally, the models trained with the best 15 features of all sets achieve similar performance. However, the best model of this set achieves slightly superior performance with performance’s lower bound around 0.7.
Concerning the best models, on average Support Vector machines (RBF and Linear) achieve the best results, except for the set with the best features where Random Forests and GBC (0.71 and 0.72, respectively) slightly surpass the performance of Linear SVM (0.70).
The feature set used highly influences the longevity of the models. For example, using the Bag of Words feature set, the best model (on average) is the RBF SVM. However, we can see that after approximately 5 months, the model’s performance begins to decline. The same can be observed in the context-free feature set where the majority of models have a steep decline in performance, with the Linear SVM being the only one to maintain its performance through time. As it was hypothesized, features sets using word embeddings seem to better retain the performance through the test set. Finally, the models with the highest performance on the best feature set show similar results to word embedding feature sets. This is likely due to the features shared between both approaches since the majority of the best feature are recycled from the word embedding sets. Nevertheless, a slight decay in performance is noticed in the best model (GBC) through time with RBF-SVM, KNN, and Naive Bayes having a large decrease in performance between January and February 2020. The decreased in performance in this interval is also noticeable in the RBF-SVM model in the Bag of Words feature set and in the majority of the models from the context-free features.
Our hypothesis to explain the sudden decay in performance in some models is thus related to the drift of topics being discussed in both real and fake content. In fact, the report on the first COVID cases in the United States (
https://www.cdc.gov/museum/timeline/covid19.html (accessed on 10 November 2021)) and Europe (
https://www.cnbc.com/2020/01/24/france-confirms-2-cases-of-virus-from-china-1st-in-europe.html (accessed on 10 November 2021))matches the time interval where some models start losing performance. Thus, we hypothesize that in some cases concept drift (more specifically virtual concept drift) can affect the performance of the models over time. Nevertheless, models that use word embedding vectors as input features seem to be more stable and suffer less with the sudden change of topic.
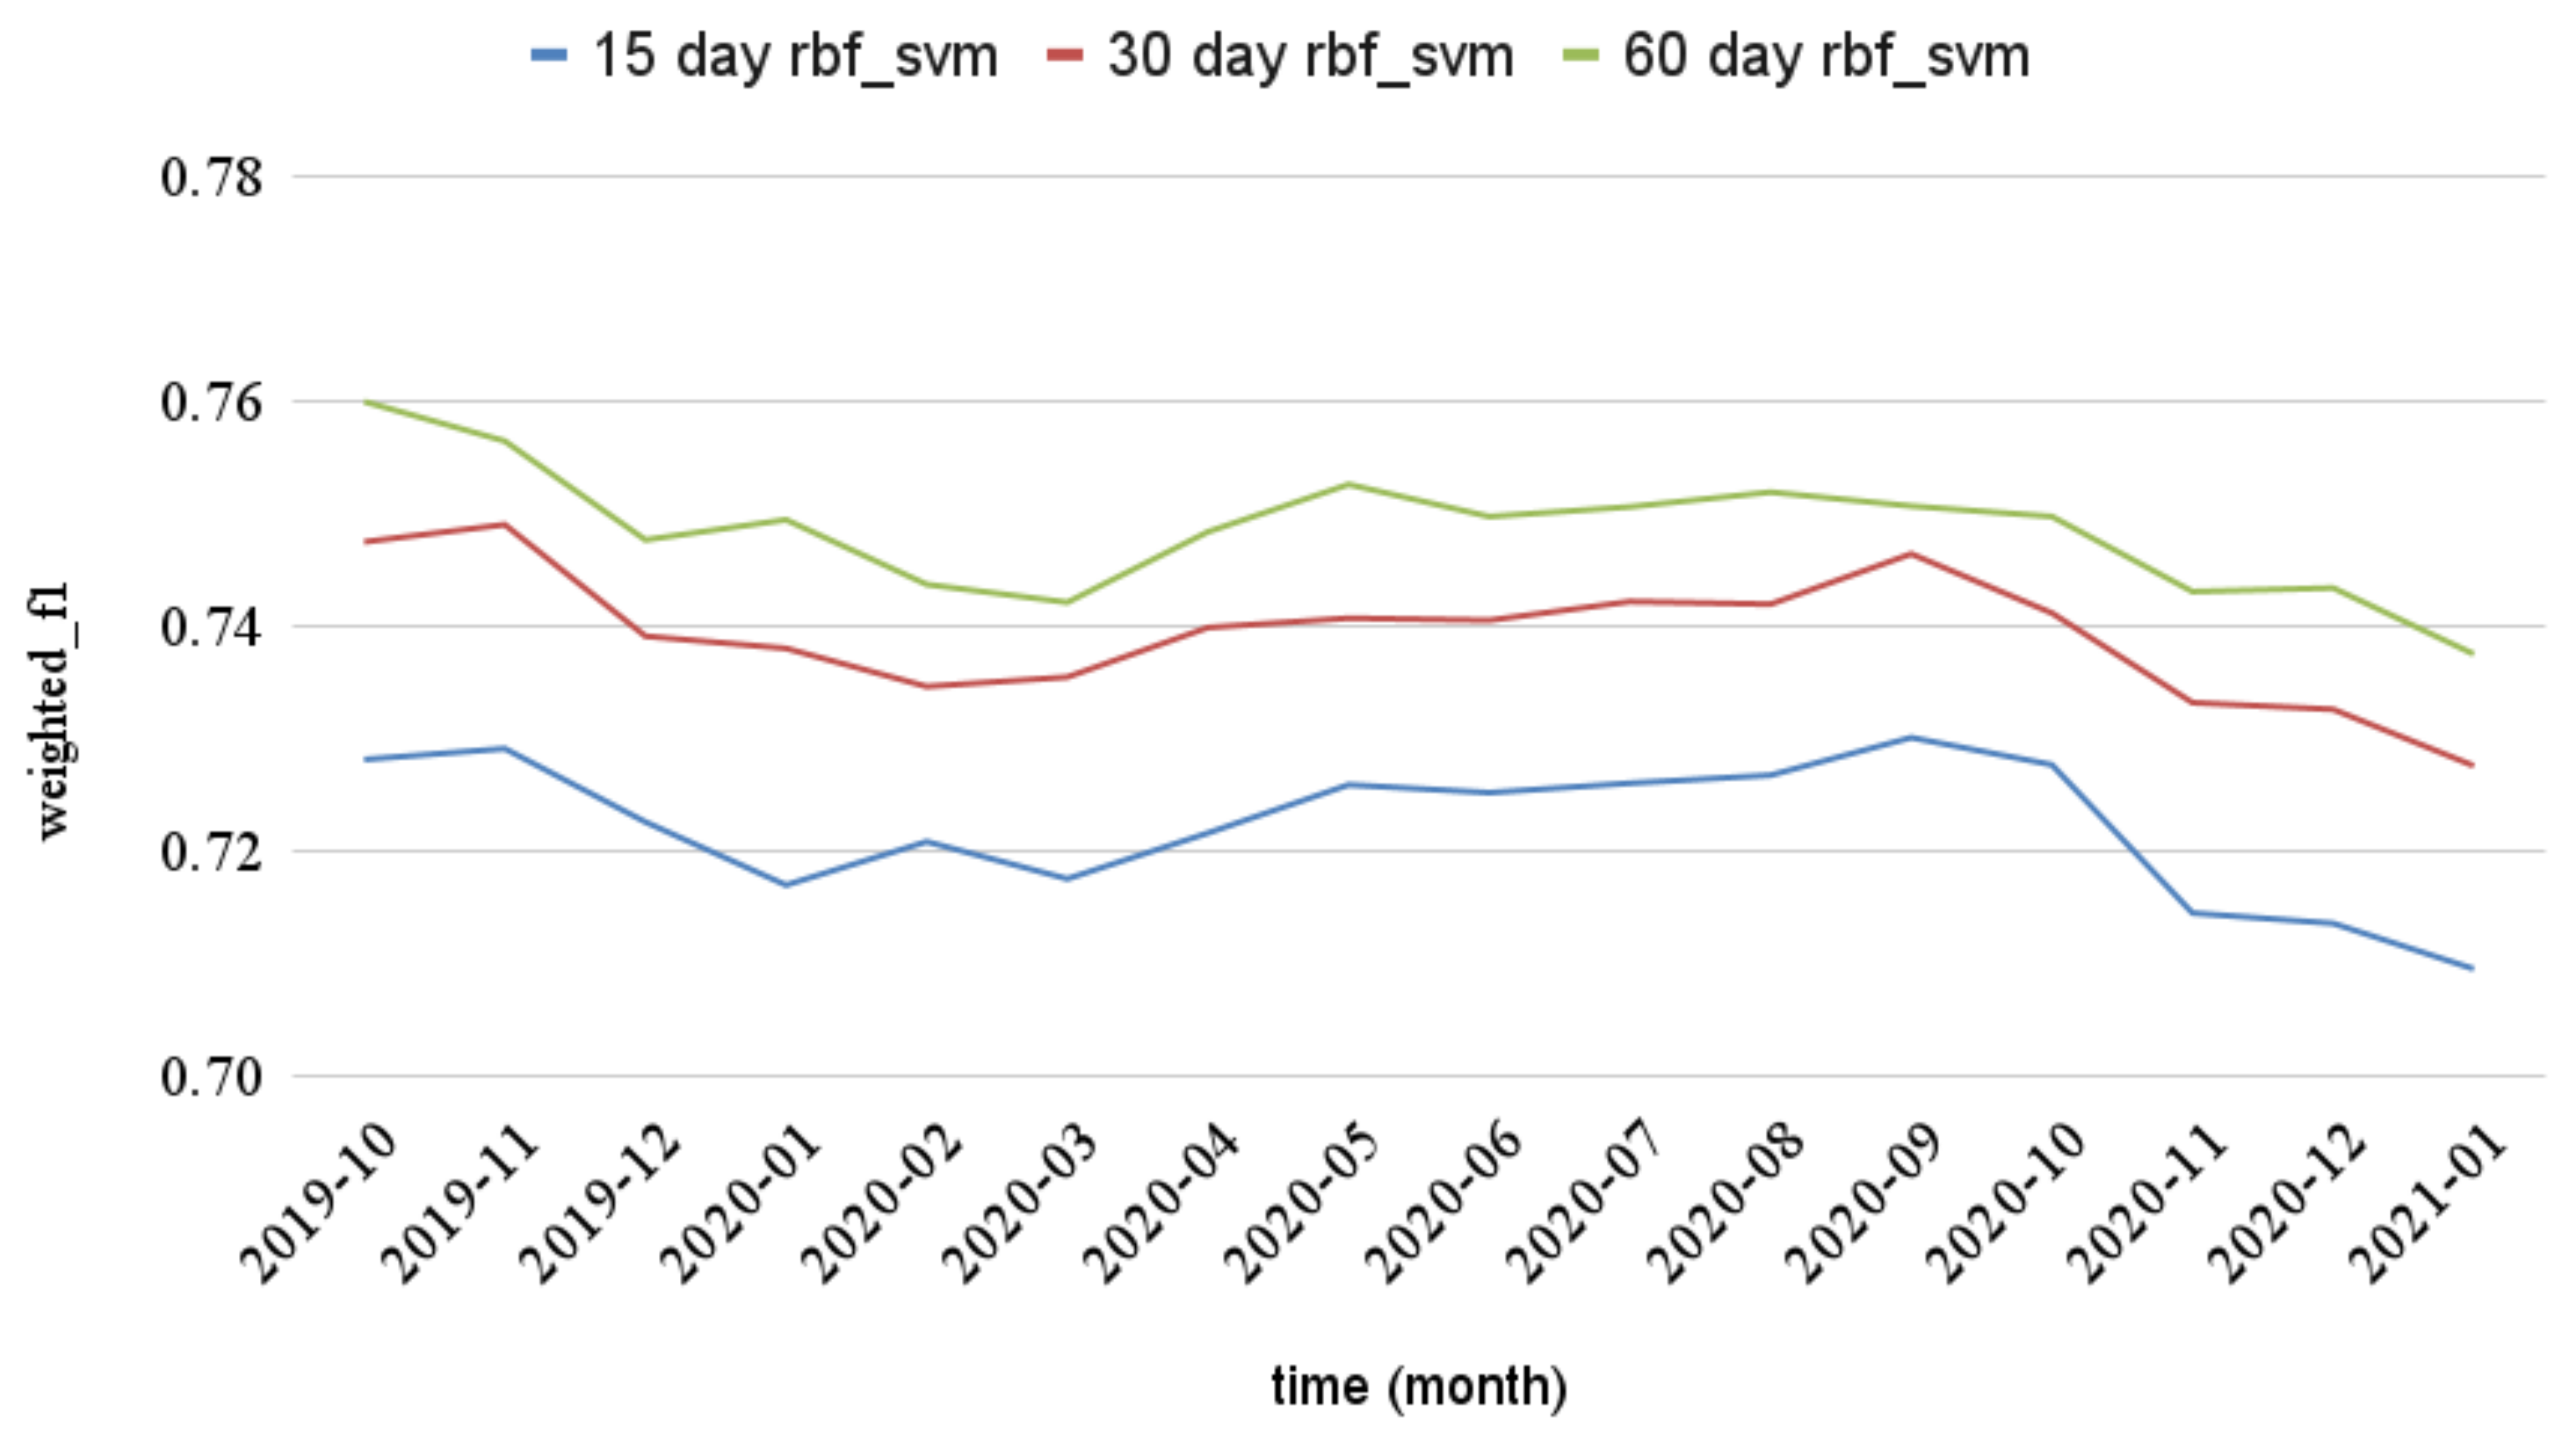
We proceed to analyze the second and third scenarios and how the models trained with different sets of features are affected by more extensive training windows (and consequently, larger volumes of data). The results with the different features/models in these scenarios are presented in
Appendix B. To synthesize the results achieved, in
Figure 5 and
Figure 6 we focus on word embedding features sets since they achieve the best overall performance. In addition, for the sake of comparison, we only present the best model for each feature set.
In both cases, we can observe that the models trained with 60-days data slightly outperform the others. In fact, as the volume of data increases, so does the performance of the model. The best average models in both features sets are SVM-RBF; therefore, the addition of data from subsequent days increases the overall performance of the best models.
In conclusion, to answer RQ2, some combination of models and features have their performance drop through time and with the change of topics. More specifically, in the cases of context-free features and bag of words. However, the combination of word embedding features and SVMs seems to have the best results. In addition, these models do not seem affected by the change of topics in the fake and real news domain specifically with the rise of COVID-19. Similar results were achieved in the case of news articles [
48], where the performance began to degrade very slowly and changes in the news concepts did not seem to impact the performance drastically. Nevertheless, our study provides a larger time interval in the test set, as well as a larger number of feature/model combinations that can guide future research on the implementation of more pragmatic fake news detection systems in social networks.
6. Discussion
The main results of this work provide some enlightenment on the performance of the different set of features/models from previous studies, in a setting where the performance is evaluated in a longer period of time. In particular, we can see how some sets of features such as the context-free and bag of words are affected by topic drifting while models trained with other sets (word embedding sets) are more robust to these changes. To the best of our knowledge, this is the first work that experiments with the longevity of fake news detection models in tweets and presents the evaluation on a dataset with tweets spanning at least 16 months, making this the most important contribution in this work.
The results achieved in this study are mixed with the expected outcome. Although we expected that the combinations using Word2Vec feature sets would work better, it is was unexpected that the models trained with the context-free features had such a large loss of performance since they are more independent of the topics being discussed (contrary to Bag of Words features for example). These results are possibly caused by the small number of features on this set made by the removal of highly correlated and low variance features which may not present any additional information in the training set. Since in the current literature, the majority of experimental settings using these features rely on cross-validation without chronological order (for example [
30,
34]), we hypothesize that feature importance and selection is often time-independent, consequently capturing important information from additional features that is not reachable when the data are chronologically ordered. In addition, as it was also observed with fake news articles [
48], the performance on the best models decreases very slow (as it is observable in
Figure 5 and
Figure 6).
It is also important to highlight that this work has some limitations. Although it allows the extraction of large quantities of tweets without human intervention, the use of a distant labelling approach does not guarantee that all labels are correctly assigned since this method makes the assumption that a tweet containing fake/real news is diffusing that particular type of content. In reality, tweets can contain a link to a fake news website to alert other users to the disinformation contained in that link. On the other hand, malicious accounts posts may contain links to real news websites to criticize and accuse such news sources of spreading false content. Ideally, each tweet extracted should be validated by a group of human annotators/experts. However, due to the large number of tweets used in this work, the costs associated with that task would be impractical. Therefore, due to the success of related works [
53,
54], we opted for this distant-labelling approach even though we recognize the limitations associated with it. Other small limitations refer to the language and sources used in the experiments conducted. In this work, we focus on the English language and the source retrieved from MBFC and OpenSources websites. It is hard to assume that the same results achieved in this experiment would generalize to other languages due to the performance of the word-embedding models necessary as well as the different syntax and grammatical rules. With respect to the sources, we realize that the introduction of new sources would not severely affect the performance of the best models and that these would be capable of generalizing as well as they did with the introduction of new topics. This is mainly because we are focusing on the content in the tweets that spread these sources instead of the articles in the sources themselves. In addition, Horne et al. [
48] conducted that experiments in articles and achieved the same results. Given these two factors, we are led to believe that the models would generalize well using different fake and real news sources in our data extraction methodology.
Given the results achieved, we recommend that fake news-related works begin to take a more time-dependent approach to the problem, with a particular focus on the unseen nature of future events. In other words, we suggest that the authors take a more chronological approach to the problem by dividing the training and testing of the models into two separate time periods. Although we do believe that a continuous longitudinal evaluation is the best way to tackle the problem, a time interval between the training and test data would result in a more accurate representation of the real world (when compared with the majority of current approaches), closing the gap between more experimental and pragmatic solutions to the problem.
7. Conclusions and Future Work
In this work, we focus on a more pragmatic approach towards the problem of identifying fake news in social networks by assessing the performance of different groups of features and models in a dataset consisting of an 18-month time period of tweets. By splitting the training and testing in chronological order, we were able to study how feature importance scores vary through time and how each combination of features/models is affected. Specifically, how major events (such as the COVID-19 pandemic) can affect the performance of these models.
Evaluating features importance in 15, 30, and 60 days batches of tweets, we conclude that sets of features composed of word-embeddings (Google pretrained Word2Vec and custom word2vec model trained using fake news articles) seem to correlate better with the target variable than other groups of features (context-free, bag of words or lexical categories). In addition, these seem to be more stable, which means that they are less affected by changes in the data.
By training the models in the previously mentioned data batches and assessing their performance in tweets spanning a time superior to a year, we can conclude that the models’ performance through time reflects the stability and higher scores of word-embedding features. In addition to being the models that achieve the overall highest performance, they also provide a more stable performance through time, with small variations through all the test data.
The results provided in this study contribute towards the development of a more pragmatic fake news detection system that is intended to be used in a real-world scenario. For example the results can aid in the implementation of an application or browser add-on able to evaluate social network posts, where a user can input a tweet and the application can classify if it contains fake news or not. Other possible applications are the use of these models as auxiliary methods to identify malicious accounts in social networks. In other words, these detection models can be applied to an account’s publication history to identify if the content diffused by that account poses a threat to the social network ecosystem due to the high volume of fake news presented.
However, these results also motivate possible research paths for future work. In fact, given the importance of word-embeddings for higher and stable performance of fake news detection models, in future work we intend to explore other language representation alternatives to Word2Vec (e.g., Glove and Fasttext). Specifically, with the rise of several language representation models such as BERT and ROBERTA, it is our goal to evaluate how these compare with the solutions presented in this paper.


