Article

A Traffic Event Detection Method Based on Random Forest and Permutation Importance

1
School of Computer Science and Engineering, Nanjing University of Science and Technology, Nanjing 210019, China
2
Automotive Engineering Research Institute, Jiangsu University, Zhenjiang 212013, China
*
Author to whom correspondence should be addressed.
Mathematics 2022, 10(6), 873; https://doi.org/10.3390/math10060873
Submission received: 8 February 2022 / Revised: 27 February 2022 / Accepted: 4 March 2022 / Published: 9 March 2022
(This article belongs to the Special Issue Mathematical Methods in Image Processing and Computer Vision)

Abstract

:
Although the video surveillance system plays an important role in intelligent transportation, the limited camera views make it difficult to observe many traffic events. In this paper, we collect and combine the traffic flow variables from the multi-source sensors, and propose a PITED method based on Random Forest (RF) and Permutation importance (PI) for traffic event detection. This model selects the suitable traffic flow variables by means of permutation arrangement of importance, and establishes the whole process of acquisition, preprocessing, quantization, modeling and evaluation. Moreover, the real traffic data are collected and tested in this paper for evaluating the experiment performance, including the miss/false rate of traffic event, and average detection time. The experimental results show that the detection rate is more than 85% and the false alarm rate is less than 3%. It means the model is effective and efficient in the practical application regardless of both workdays and holidays.

1. Introduction

Nowadays, the traffic flow video detector is used widely in practical application. It is applied in urban road traffic event monitoring and detection. However, due to the factors of the low-density distribution of video detectors and observation distance [1], a large number of traffic events occur beyond the effective detection range. This paper aims to obtain the key parameters of traffic flow, such as speed and traffic density, by analyzing the video content [2,3]. Based on the analysis of relevant parameters, the traffic events beyond the field view of cameras can be detected. The proposed method aims to improve the detection ability and break through the limitation of video detector field views.
The vehicle detector uses a video camera as a sensor, and sets a virtual coil in the field view. When the vehicle enters the detection area, the background gray value will change, so as to know the existence of the vehicle and detect the density and speed of the traffic flow [4,5,6,7]. Detector can be installed above the traffic lane or roadside. Compared with the traditional traffic information collection technology, the traffic video detector can provide images, move the detection coil according to need. Additionally, it is intuitive, reliable, convenient installation and maintenance, as well as the low-price advantage. On the other hand, the disadvantage is easily influenced by bad weather, the influence of environmental factors, such as light, shadow, observation range is limited by equipment.
The occurrence of traffic events usually results in the decrease in road capacity. When the traffic capacity of location where the event occurred cannot meet the traffic demand of the upstream, the vehicles in the upstream of the event location will slow down or even gradually congest [8]. At this time, a compression wave will be generated in the upstream of the accident location, as Area a shown in Figure 1. The wave will make the vehicles gather, the density will increase significantly, and the traffic flow speed will decrease significantly. An expansion wave will be generated in the downstream of the event location, as area b shown in Figure 1. So that the vehicles are sparse, and the traffic flow speed will be maintained or higher before the event. Although the traffic flow will be significantly lower than the normal capacity of the road, and the occupancy rate will also be greatly reduced. Under the influence of traffic events, the characteristics of traffic flow parameters is significant, which is the foundation of TED model [9].
TED algorithm is designed to separate abnormal traffic condition from normal. Normal traffic flow data are marked as 1, abnormal traffic flow mark is 0. So the traffic event detection algorithm belongs to dichotomous method. Events and events not occurring in essence can be summarized as the classification problem in machine learning category. Therefore, many classification algorithms in the field of artificial intelligence can be introduced into the application, and improve efficiency and precision [7,8].
The multi-source monitoring equipment collect traffic flow data of different attributes. We design a method which integrates traffic flow data in the same time and space dimension, and establish the importance evaluation of traffic flow variables, which is conducive to building an interpretable model and improving the generalization ability of the model [10,11]. The contribution of this paper is to capture the variation rules of abnormal traffic conditions area and improve the detection accuracy of traffic events. This paper mainly studies the detection methods of traffic events outside the visual area, and proposes: 1. Calibrate traffic event data, analyze the evolution law of traffic flow variables, and explore the importance of traffic flow variables at urban roads; 2. A traffic event detection method based on improved Random Forest was proposed and demonstrated through multi-group experiments.

2. Related Work

Lin et al. [11] proposed a traffic event strategy based on Generative Adversarial Networks. The temporal and spatial features are extracted from actual traffic data as variables. Random Forest filter is used to detect unimportant features of traffic events. In order to overcome the imbalance problem of insufficient outlier samples, they used GAN to generate data with traffic event patterns. Using SVM as traffic event detection method, the study uses datasets labeled as outliers and embedded values. However, the GAN model cannot generate outlier patterns that are not in the dataset. Davis et al. [12] constructed a traffic network by using temporal traffic data. A traffic event prediction model combining LSTM and EVT is proposed. LSTM is an improvement of recursive neural network. It discards data that would not be useful for predicting traffic events using backward propagation algorithms. EVT is applied to the loss function of the mixed model. Experimental results show that the hybrid model achieves better Fl scores than the baseline model. Due to the possibility of overshooting in deep learning training.
At the same time, the traffic condition monitoring method based on integrated learning algorithm is widely used due to its high efficiency and good generalization [13,14,15]. Chen [16] found through experiments that the Random Forest-based traffic event detection model was superior to the multi-layer feedforward neural network method in terms of detection rate, detection time, and classification accuracy. The algorithm decomposed the same problem into multiple different modules, and multiple learners participated in learning to solve the target problem, and effectively improved the generalization ability of the classifier [17,18]. According to the characteristics of traffic monitoring data, the application of this method about travel time analysis and traffic state judgment has a good prospect.
LightGBM, proposed by Microsoft, does not need to calculate information gain from all samples, and features dimensionality reduction technology built in. So it is fast and accurate at the same time. The engineering implementation is much better than Xgboost. In the training process, LightGBM adopts unilateral gradient algorithm to filter out the samples with small gradient, which reduces a lot of calculation [19,20].The histogram algorithm is used to transform the traversal sample into the traversal histogram, which greatly reduces the time complexity. The optimized feature parallel and data parallel methods are adopted to speed up the calculation [21]. When the data volume is very large, the voting parallel strategy can be adopted. The growth strategy based on leaf-wise algorithm is adopted to construct the tree, which reduces a lot of unnecessary computation. LightGBM uses GOSS (one-side sampling based on gradient) as the sampling algorithm. Because histogram does not care whether the feature value is 0. Therefore, EFB (mutually exclusive feature bundling) is used to preprocess sparse data.

3. Proposed Method

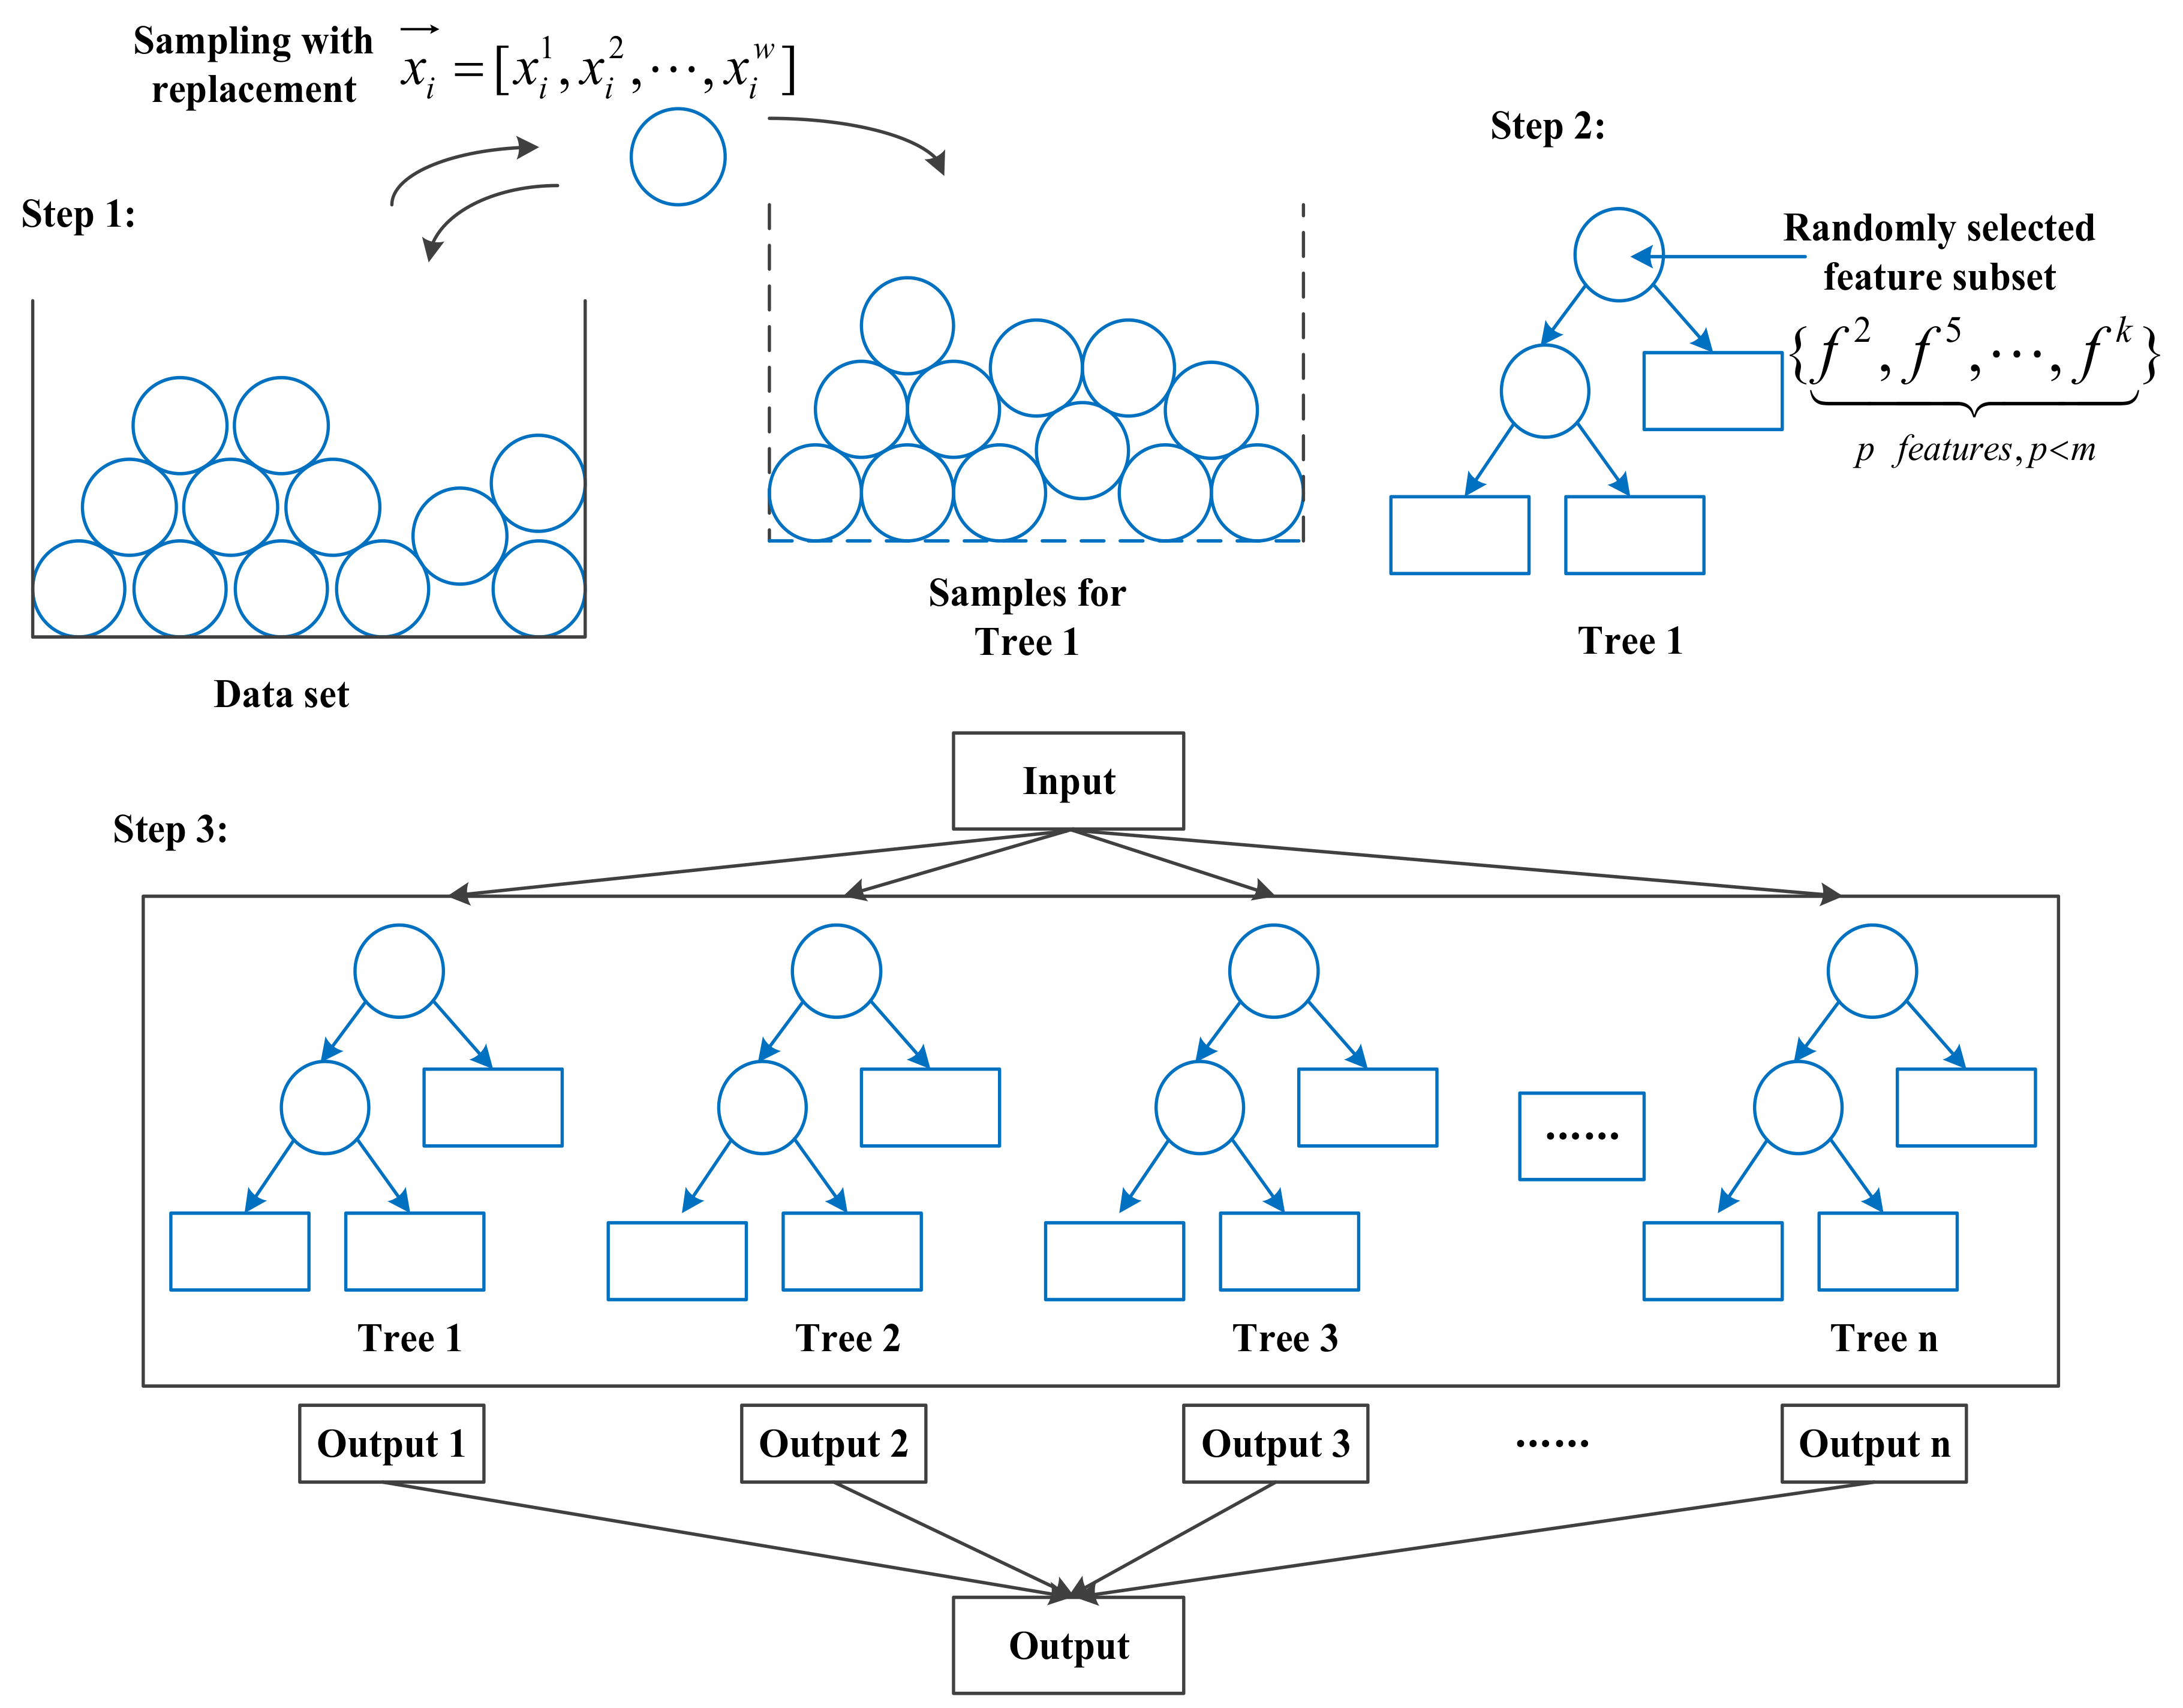
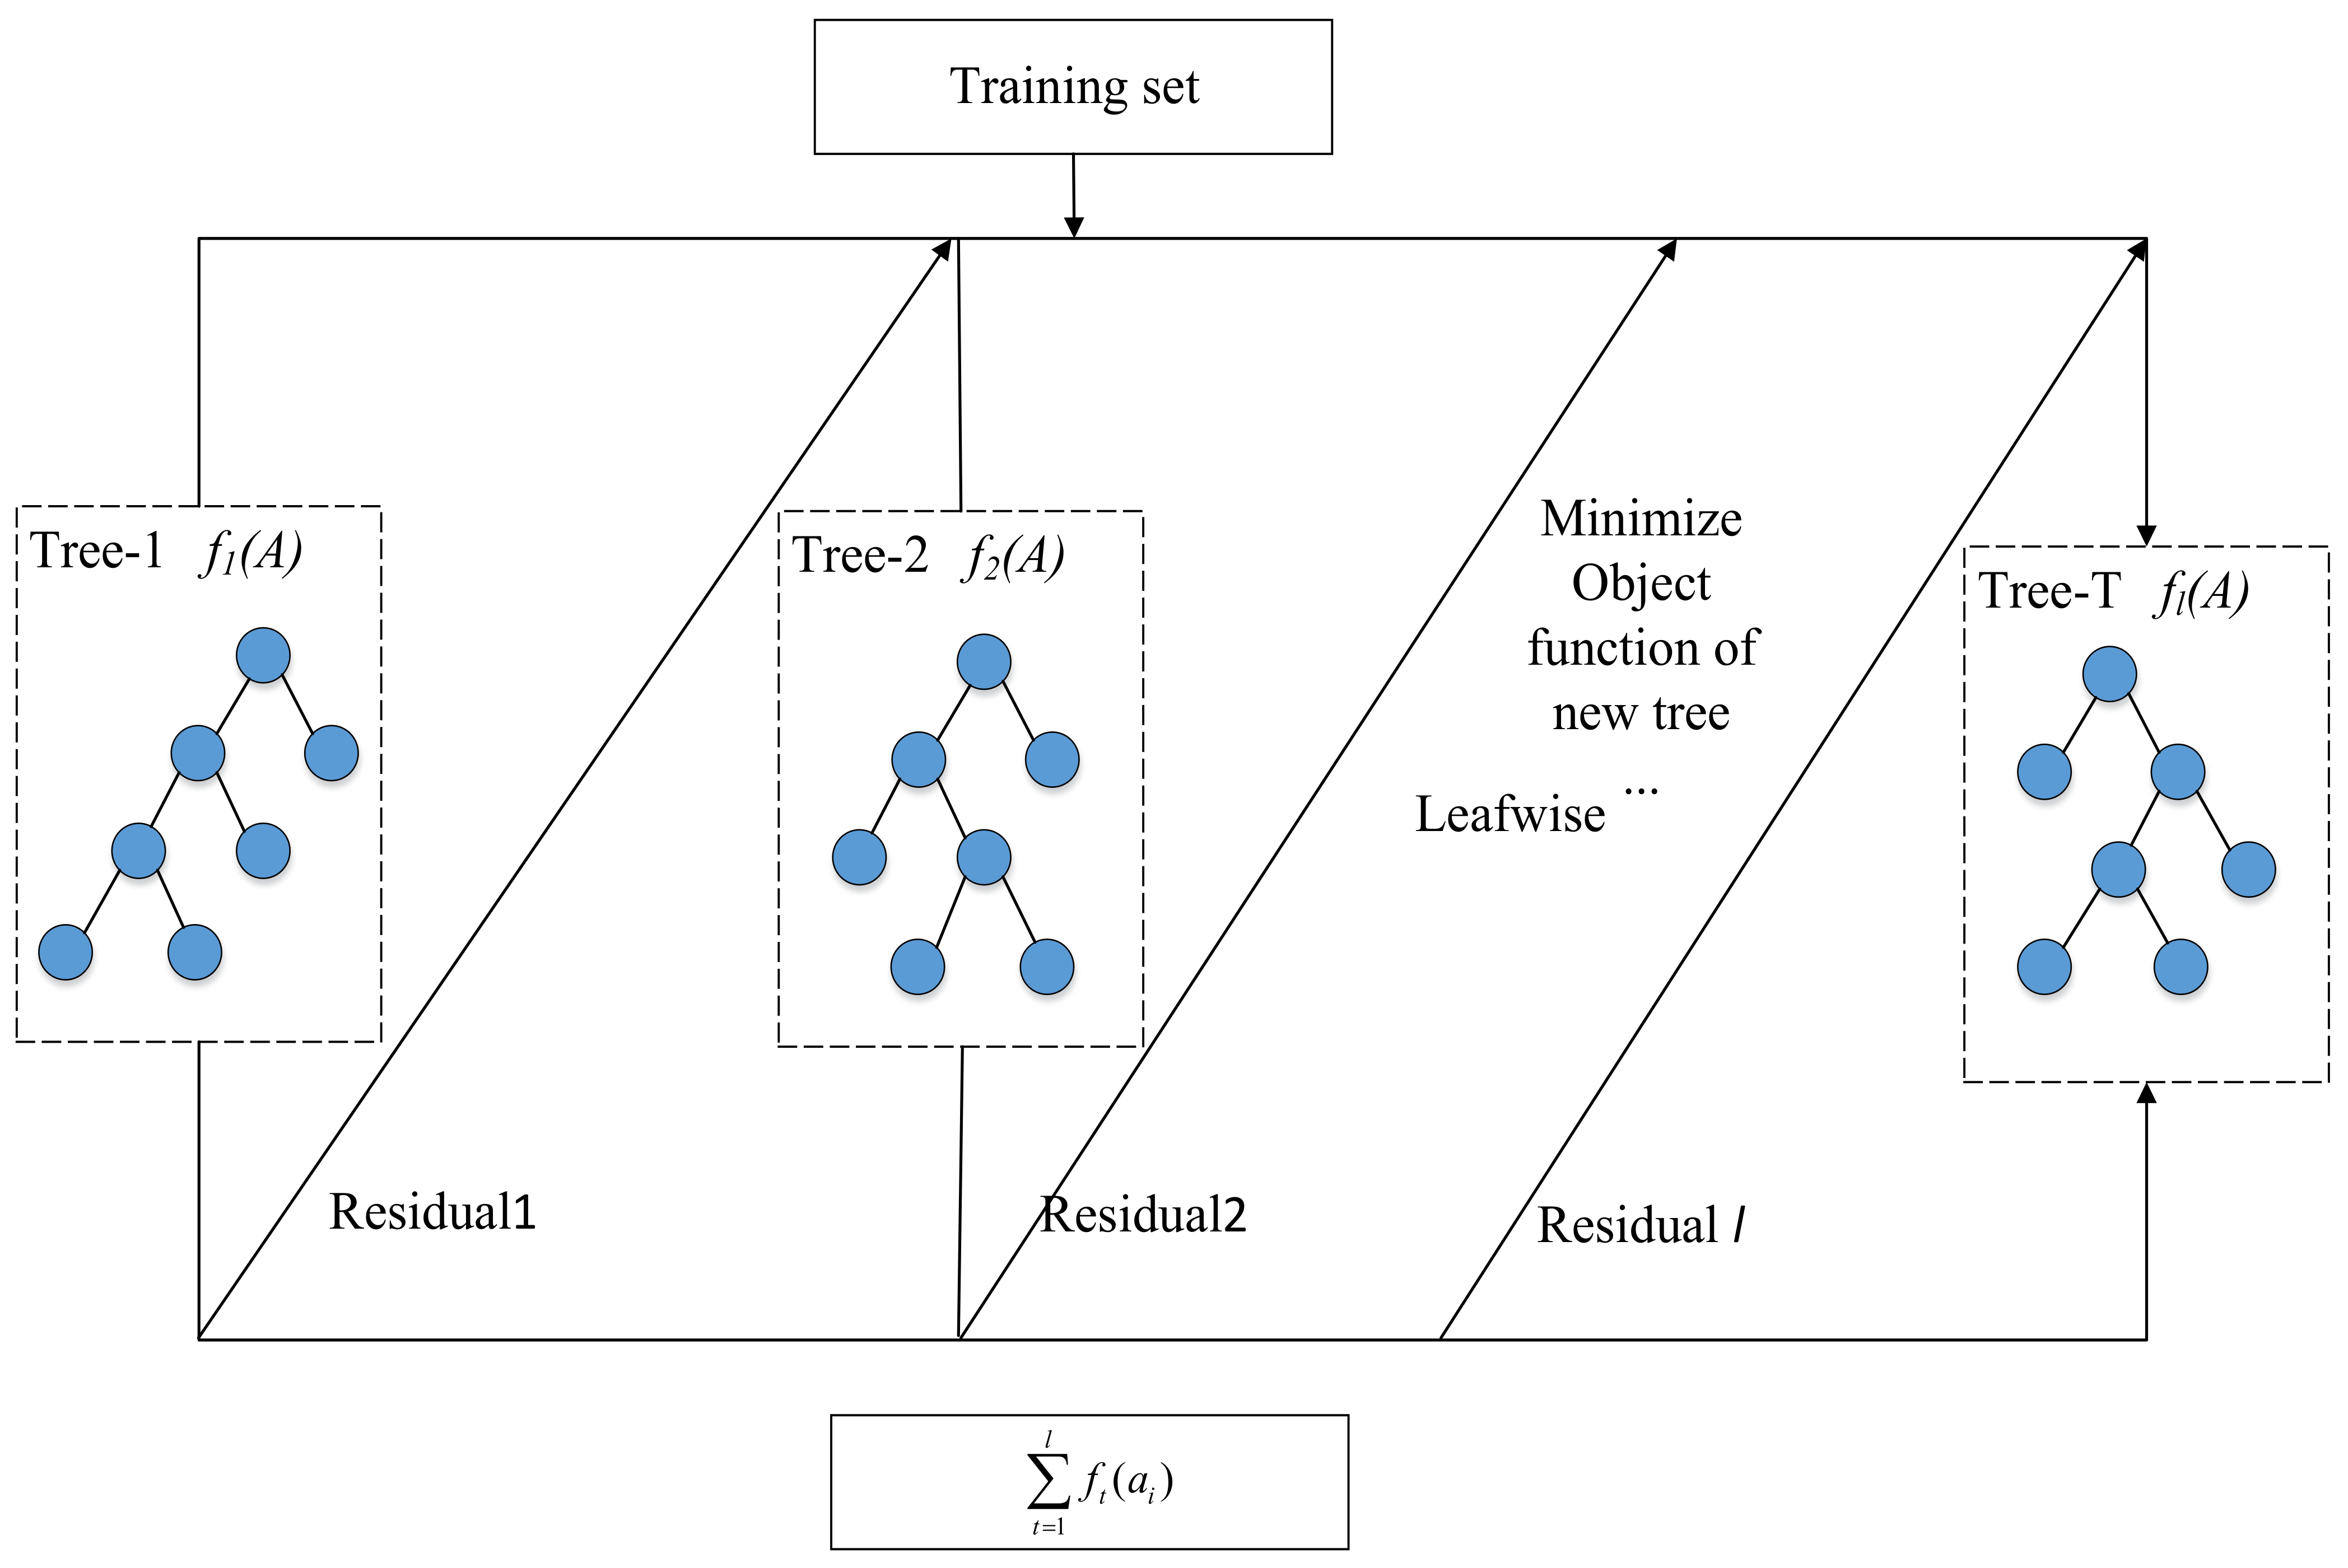
3.1. Improved Random Forest Method for Traffic Event Detection

This section adopts Random Forest (RF) for traffic event detection. Although RF has been proposed for a long time, few scholars have applied it in TED field. Through a lot of theoretical derivation and experiments, scholars have proved the Random Forest.
The algorithm has a good tolerance to abnormal data, and has a high classification accuracy. So it is not easy to appear the phenomenon of data overfitting. Random Forests is a special kind of combined transportation event study, essentially belongs to the study. However, the group has integrated more than single decision tree learning, Random Forests are integrated as a traffic event using multiple sets of decision tree as shown in Figure 2. The use of bootstrap sampling methods were extracted from the original traffic flow data, multiple subset for each subset decision tree model, each decision tree learning is the single traffic events, each output results as a vote, and then will study these single traffic events together, by voting eventually come to the traffic state.
According to the collected data of multi-source monitoring equipment available, as shown in Table 1, for the data acquisition device to obtain the traffic flow variables, including the accumulation of elements such as average speed, queue length, the cumulative number of queuing vehicles, cumulative duration, accumulated the number of cars, specific meaning, and units as shown in Table 1. These five variables to describe the dynamic characteristics of traffic flow, for the analysis of traffic flow evolution trend and law provides a strong protection.

3.2. A Traffic Event Detection Method Based on PI

This section adopts the method of Permutation importance (PI) to select variables to build the model, briefly introduces the parameter setting of LightGBM, then introduces the core framework of TED in this chapter, and systematically elaborates the process of PITED (Traffic Event Detection based on Permutation Importance) method. LightGBM, proposed by Microsoft, does not need to calculate information gain from all samples, and features dimensionality reduction technology built in. So it is fast and accurate at the same time. The engineering implementation is much better than Xgboost. In the training process, LightGBM adopts unilateral gradient algorithm to filter out the samples with small gradient, which reduces a lot of calculation [19,20]. The histogram algorithm is used to transform the traversal sample into the traversal histogram, which greatly reduces the time complexity. The optimized feature parallel and data parallel methods are adopted to speed up the calculation n [21]. When the volume of data is very large, the voting parallel strategy can be adopted. The growth strategy based on leaf-wise algorithm is adopted to construct the tree, which reduces a lot of unnecessary computation. LightGBM uses GOSS (one-side sampling based on gradient) as the sampling algorithm. Because histogram does not care whether the feature value is 0. LightGBM is an improved variant of gradient enhancement. The general idea is to combine weak basic learners into strong learners, as shown in Figure 3. It adds a tree with an optimal model by enumerating the structures of different trees, and each new tree generated is a fitting of the residual of the current model. Every training set D i {( α i , y i ), i = 1,2, …, N’} is abstracted by bagging method, and N’ is 63.2% of N. The Formula (1) is object function of step t. and the score function of step t as follows:
O b j ( t ) = i = 1 N ( y i y ^ i ) 2 + Ω ( f t )
The first item of object function is square loss function, and the t is the predicted value of current tree.
y i t = k = 1 t f k ( a i ) = y i t 1 + f t ( a i )
By optimizing the objective function, a new tree of step t  f t ( a i ) is obtained, second order Taylor expansion of loss function is as follows:
i = 1 N [ ( y i y ^ i t 1 ) 2 + g i f t ( a i ) + 1 2 h i f t 2 ( a i ) ] + Ω ( f t )
g i , h i is first and second derivative, and the second item is regularization with L2 penalty term. It can be expanded as:
Ω ( f t ) = γ T r + 1 2 λ j = 1 T r w j 2
T r is leaf number of a tree, γ is the complex rate, wj is the score of leaf j, λ is penalty coefficient, improving regularization is benefit to deals with the overfitting problem in the generation stage of decision tree. The above objection function can be simplified as:
O b j ( t ) 1 2 j = 1 T r G j 2 H j + λ + γ T r
G j , H j are statistical value of first and second derivative.
Find the minimum value of object function, and add to the model, repeat this step until the number of trees reaches the predetermined value l. Each step generates an optimal structure tree, and obtains the optimum segmentation point.
G a i n = 1 2 [ G L 2 H L + λ + G R 2 H R + λ ( G L + G R ) 2 H L + H R + λ γ ]
GL, HL, GR, HR are the left node first, second derivative, and the right node first, second derivative. If the gain is negative, the segmentation is stopped. According to the training set D i ,   {( α i , y i ), i = 1, 2, …, N′} generate indicator models for evaluation.
y i = t = 1 l f t ( a i )
In general, LightGBM model is based on training dataset. Finally, we evaluate traffic flow parameters by combining the average value of these learners.
This section may be divided by subheadings. It should provide a concise and precise description of the experimental results, their interpretation, as well as the experimental conclusions that can be drawn.

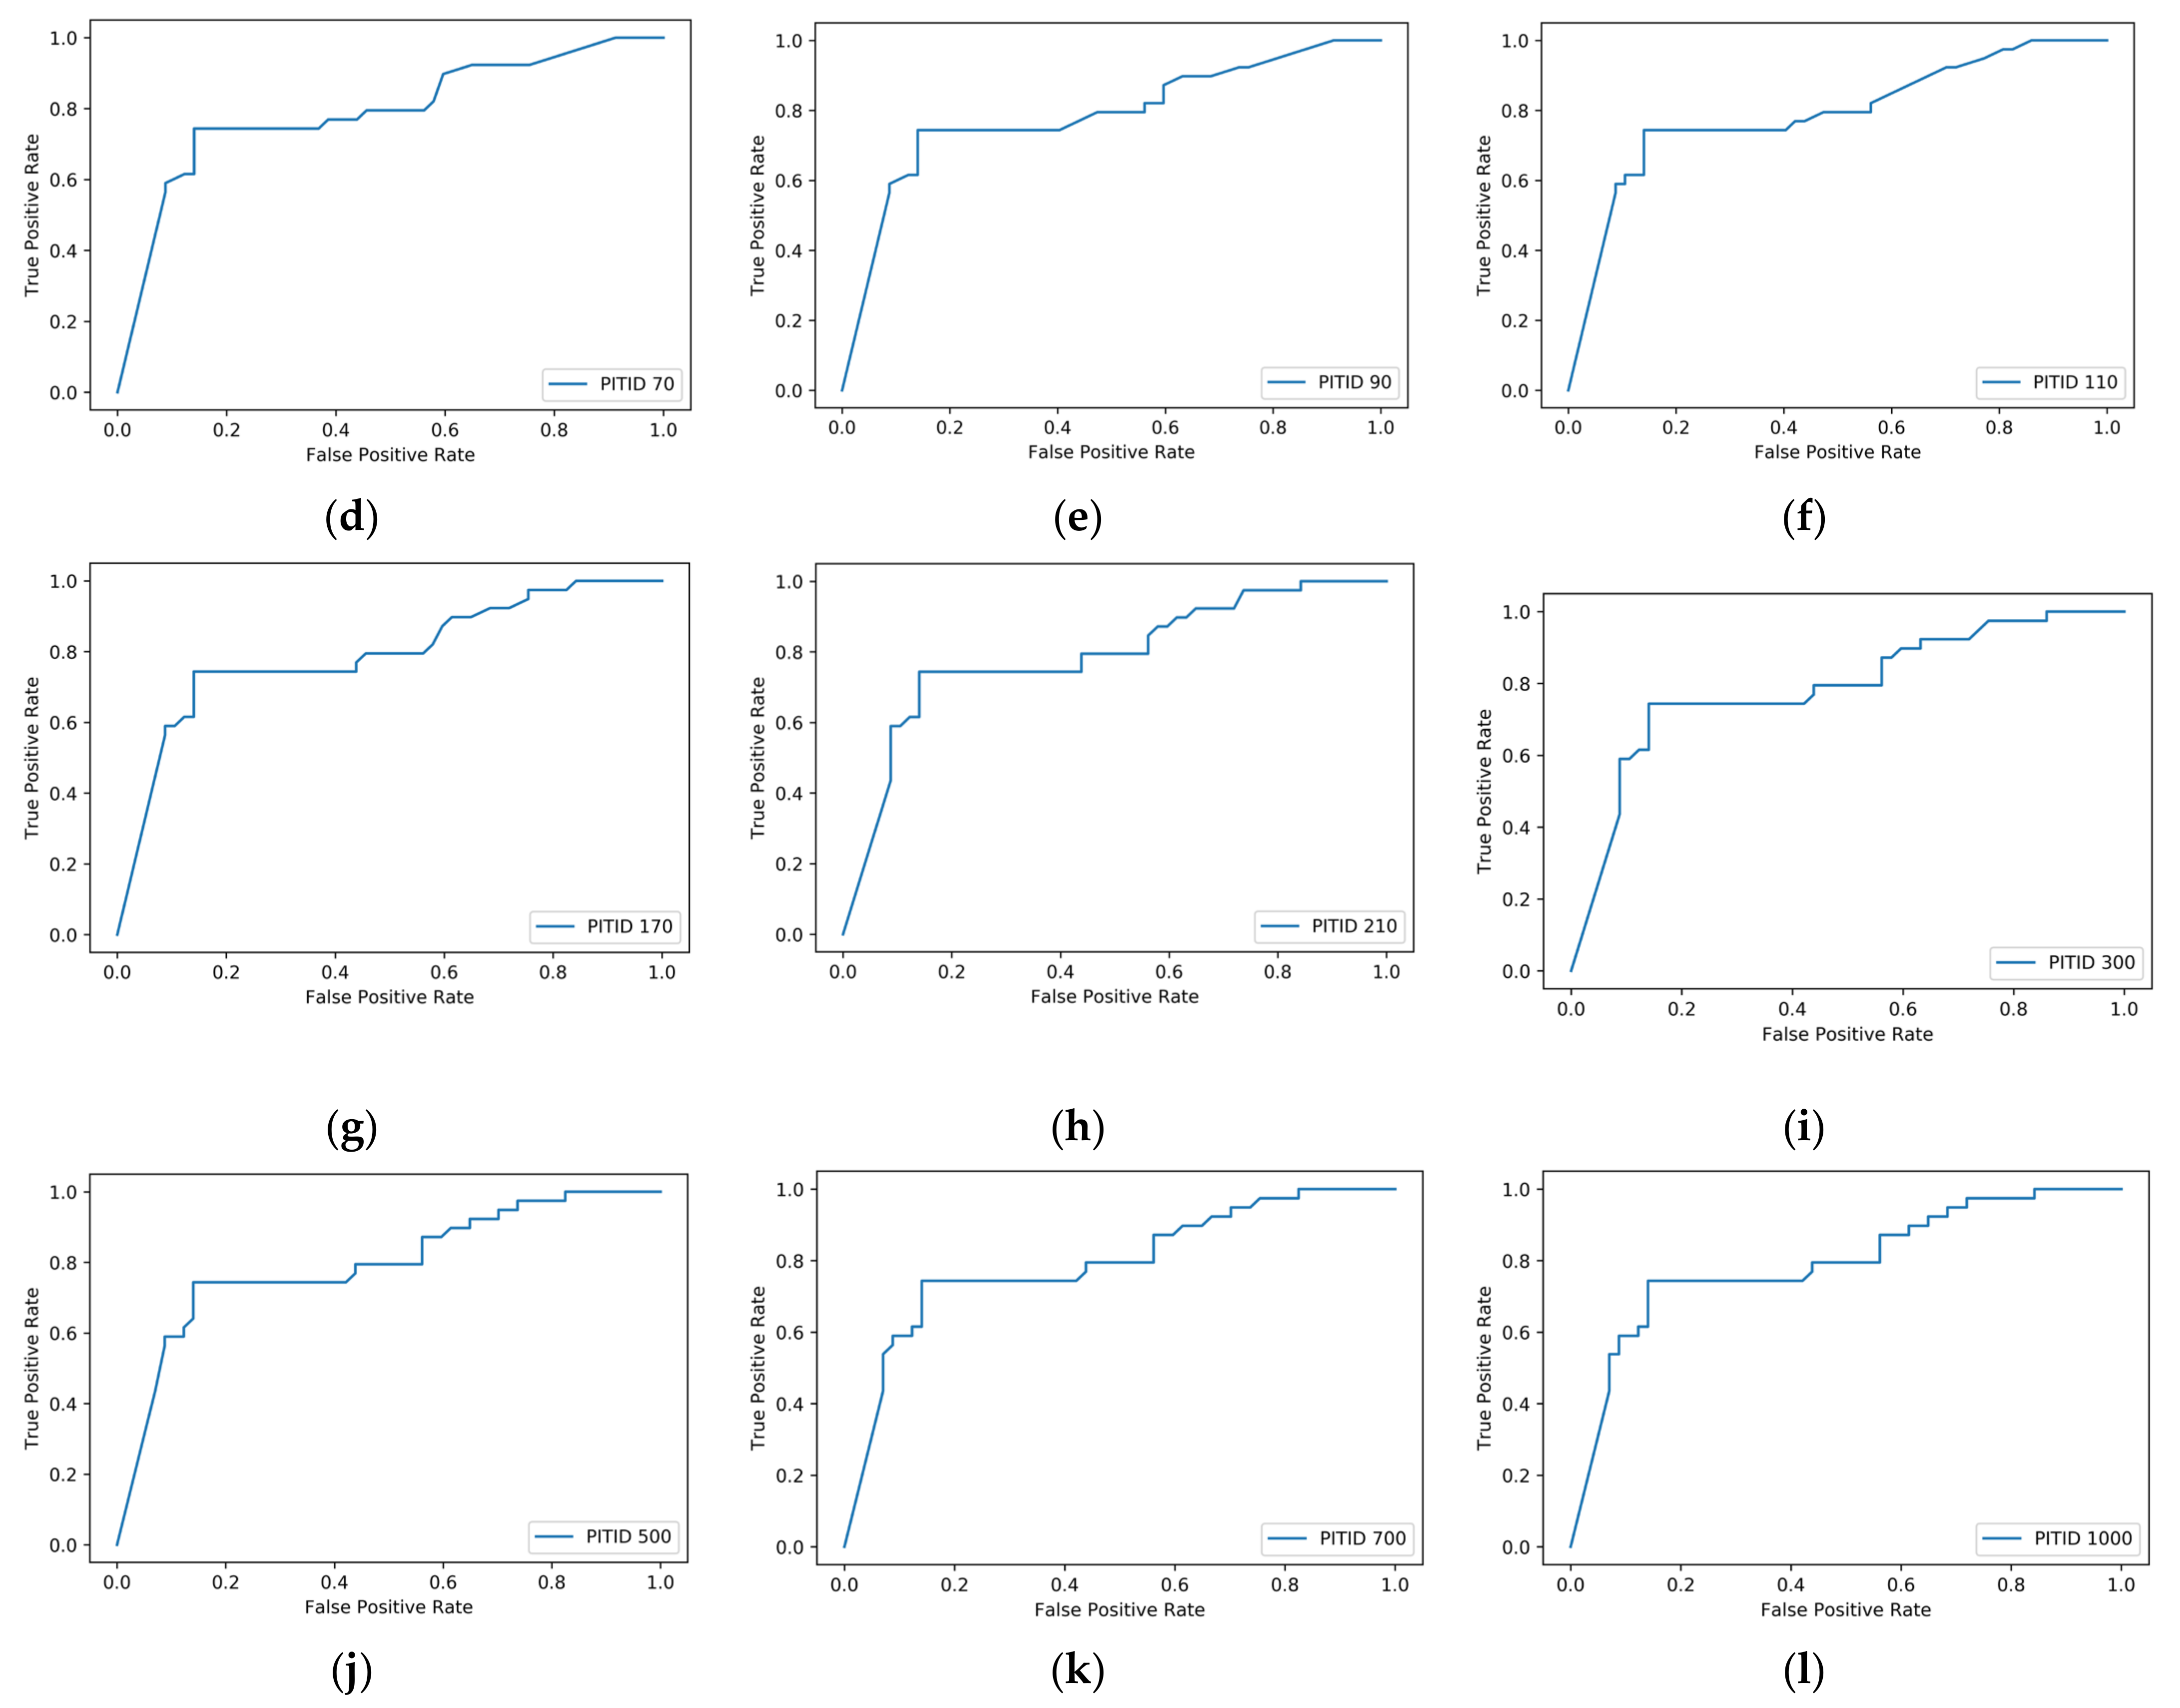
3.3. Choose PI Parameters

While discussing lane level variable importance, we found the important degree of choice variables based on Random Forest as the basis of traffic flow detection. Traffic event has certain limitations, exaggerate some variables of importance. So this excerpt LightGBM calculation of variable importance, and adopt the method of substitution variable cross choice, reduce the impact. PI variable selection is based on a variable under different evaluation criteria are more important, then the characteristics of traffic events and to have good ability. When selecting variables for LightGBM, different parameters have a greater impact on the results. The parameters are set according to the debugging analysis of multiple groups of experiments to avoid overfitting, so as to achieve better training results as shown in Table 2.
From the working day, the most important intersection traffic flow variable is vehicle flow, Lane 2, 3, 4, 5, 6 are the largest contribution, especially Lane 3, 4, 5, that is through lane. The contribution of traffic flow to the identification of traffic events in the intersection area is significantly greater than Lane 2, 6, which is about 0.4; the speed of Lane 2 and Lane 4, the number of vehicles queuing and the duration of Lane 2 and Lane 4 are compared. However, the effect of queue length variable is opposite to that of type 1, but it cannot be reflected in the calculation of the importance of Random Forest. For example, Lane 6, which is the left turn lane, has a negative effect.
From the rest day, because people’s travel changes, there is no need to reduce the traffic flow, which further reduces the impact on the model. For example, Lane 3 and Lane 4 have a negative effect on the traffic flow, while the contribution of other traffic flow variables is greater than this variable, while the traffic flow of other lanes has a greater impact. The reason is directly related to the decrease in travel on rest days. In the flow, especially in through lanes, the traffic flow decreases significantly. Therefore, In the subsequent modeling analysis, this study carried out model comparison and verification for two traffic patterns, working days, and holidays.
Due to the great difference of people’s travel on weekdays and rest days, this study analyzes the traffic flow variable selection from the intersection data of working days and rest days. As shown in Figure 4, the results of variable selection based on PI of urban intersections are shown. The box diagram can be used to reflect the characteristics of traffic flow data distribution, and can be used to compare the distribution characteristics of multiple groups of data. The horizontal lines of the box chart are the maximum, minimum, median, and upper and lower quartiles, and the circle represents the abnormal data points.

3.4. Algorithm Evaluation

Receiver Operation Characteristic (ROC) curve is a two-dimensional coordinate system with false alarm rate as the horizontal axis and detection rate as the vertical axis. It is used to describe the trade-off between TP and FP. ROC curve can evaluate the detection performance of traffic event detector well. The binary output of traffic event detector corresponds to a point in the ROC curve. Although the position coordinates (FAR, DR) were close to the top left corner of learning, traffic events detection performance is superior to the lower right corner point of detector. It can obtain a series of discrete output by the selection of threshold of learning, which corresponds to a ROC curve in ROC space.
AUC (Area under ROC Curve) is the Area under the ROC curve, which can realize the performance comparison between traffic event detector. The higher value of AUC means the better detection performance. When the value of AUC is less than or equal to 0.5, the detection performance is close to random guess. When AUC = 1, the optimal detection performance is obtained. At the same time, the AUC value still maintains many advantages of ROC curve: (1) it can describe the overall performance of the traffic event detector, independent of the prior distribution of traffic state, the misclassification cost of traffic state, and the learning threshold; (2) it can describe the probability of the traffic event detectors, and rank the event detectors according to their abilities.
At present, there are three commonly used performance evaluation indexes of TID method: detection rate (DR), false alarm rate FAR), and mean time to detection (MTTD). Among them, DR refers to the percentage of the number of traffic events detected by TID method and the actual number of traffic events in a certain period of time; far refers to the percentage of the number of non-traffic events detected by TID method and all discrimination times in a period of time; MTTD refers to the arithmetic mean value of the difference between the actual occurrence time of traffic events and the occurrence time of detected traffic events. The calculation formulas of the three evaluation indexes are as follows:
D R = N d e t e c t e d N a l l × 100 %
F A R = N f a l s e   a l a r m e d N d e c i d e d × 100 %
M T T D = t 1 + t 2 + + t i + + t m m

4. Experiments

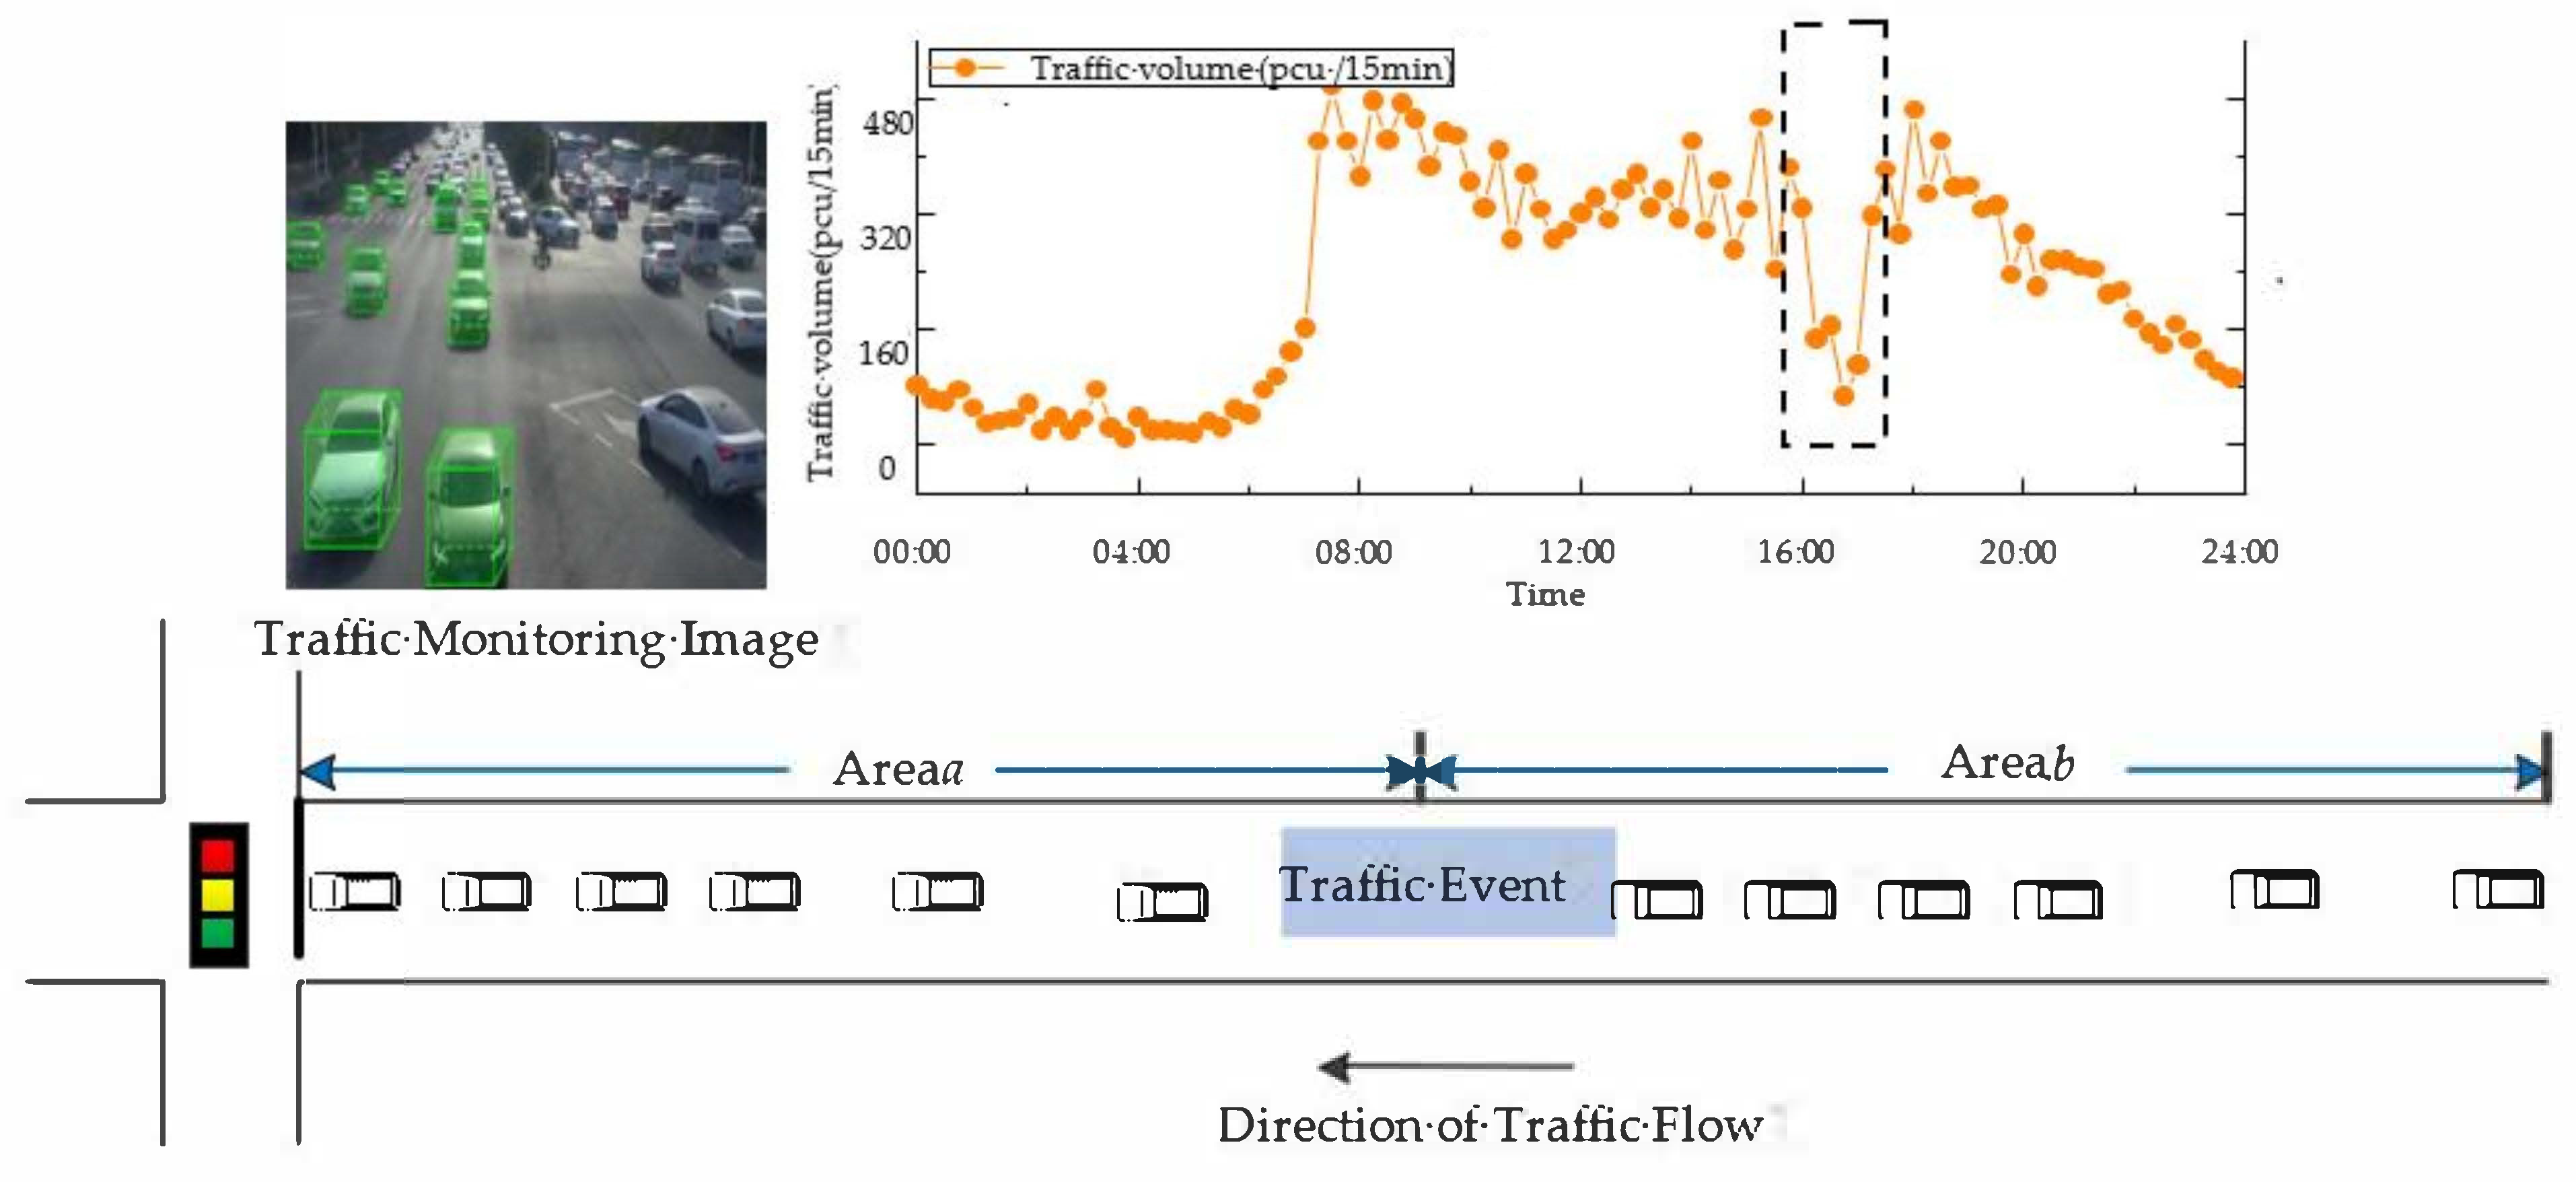
4.1. Video Monitoring at Intersections

Based on the actual urban road intersection algorithm validation, and data are from monitoring and control system of Nanjing, which is located at the junction of HeXi road and HengShan road. HeXi avenue for the main road, the import way of lane number is 5, 1 left turn lane, lane 3 straight, and 1 right turn lanes (bus lane). Hengshan road is the secondary road, and the number of lanes of the entrance road is 2, among which 1 lane goes straight to the right, and 1 lane goes straight to the right as shown in Figure 5. The data collection period in this paper is from 1 November 2019 to 30 November 2019, and from 00:00 to 24:00 throughout the day, including the average vehicle speed, cumulative vehicle flow, cumulative queue length, cumulative queue number, vehicle duration, etc. Subsequent paragraphs, however, are indented.
Based on the analysis of the number of decision trees (DT), k-fold cross validation, and the comparison of different algorithms, this section carries out multi-group validation and discusses the effectiveness of PITED method.

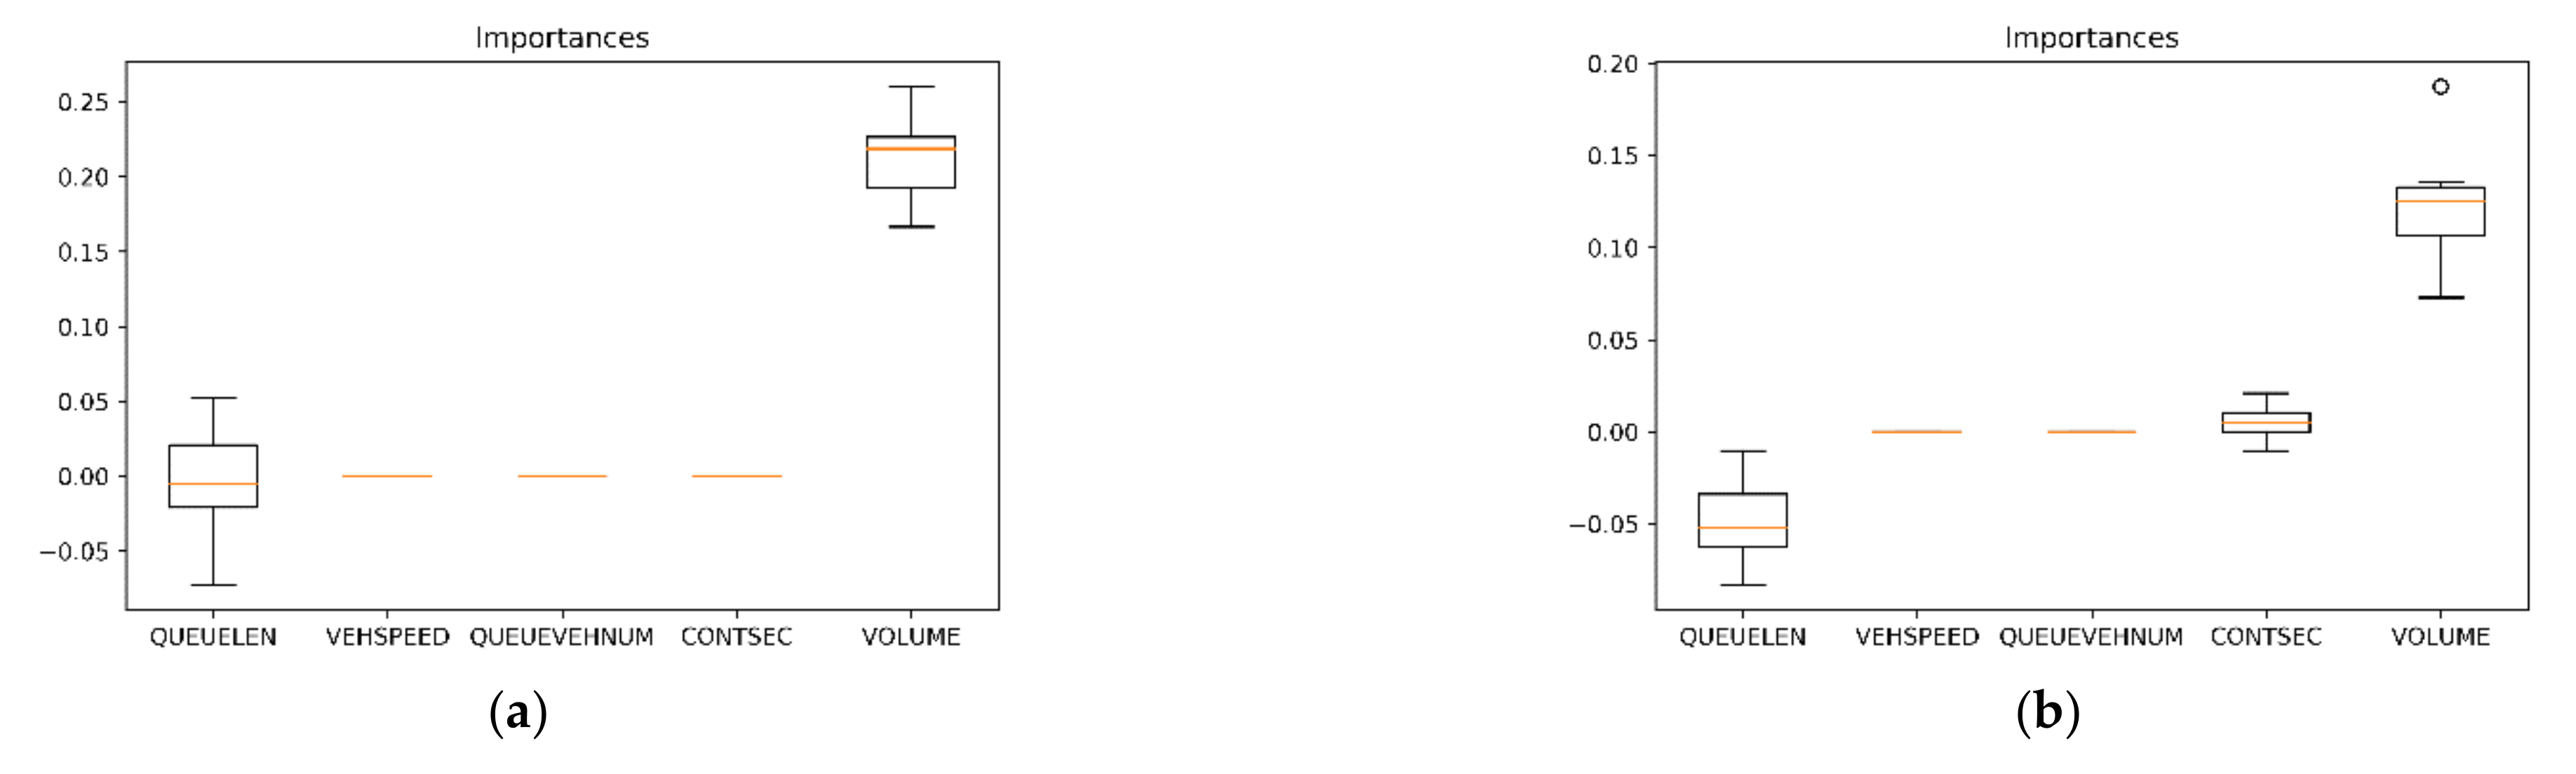
4.2. DT Quantitative Impact Analysis

PITED consists of a number of decision tree Random Forest, belongs to the integrated method of study, but this test set the number of decision tree RF from 10 to 1000. Though increasing the number of decision tree for differences between classifier, Figure 6 Random Forest ROC curves for different number of DT (DR = TP, FAR = FP). The number of DT on PITED has remarkable effect on the detection efficiency of the RF-10 false alarm rate is 0.1, but its detection rate is only 40% or so. It is hard to meet the actual road traffic event detection, the RF-50,The detection rate of 70, 90 is relatively close, and can reach more than 70% when the false alarm rate is less than 0.2. At the beginning of RF-110, when the detection rate is above 80%, the false alarm rate is reduced to about 0.4, indicating that the number of decision trees is in the hundreds place level. It can be said that when the number of decision trees increases, the classification rate of Random Forest is improved. When the number of DT is between 700 and 1000, the detection rate and false alarm rate tend to be stable, and the value of AUC remains almost unchanged. Therefore, the number of DT in the subsequent study was set to 800.

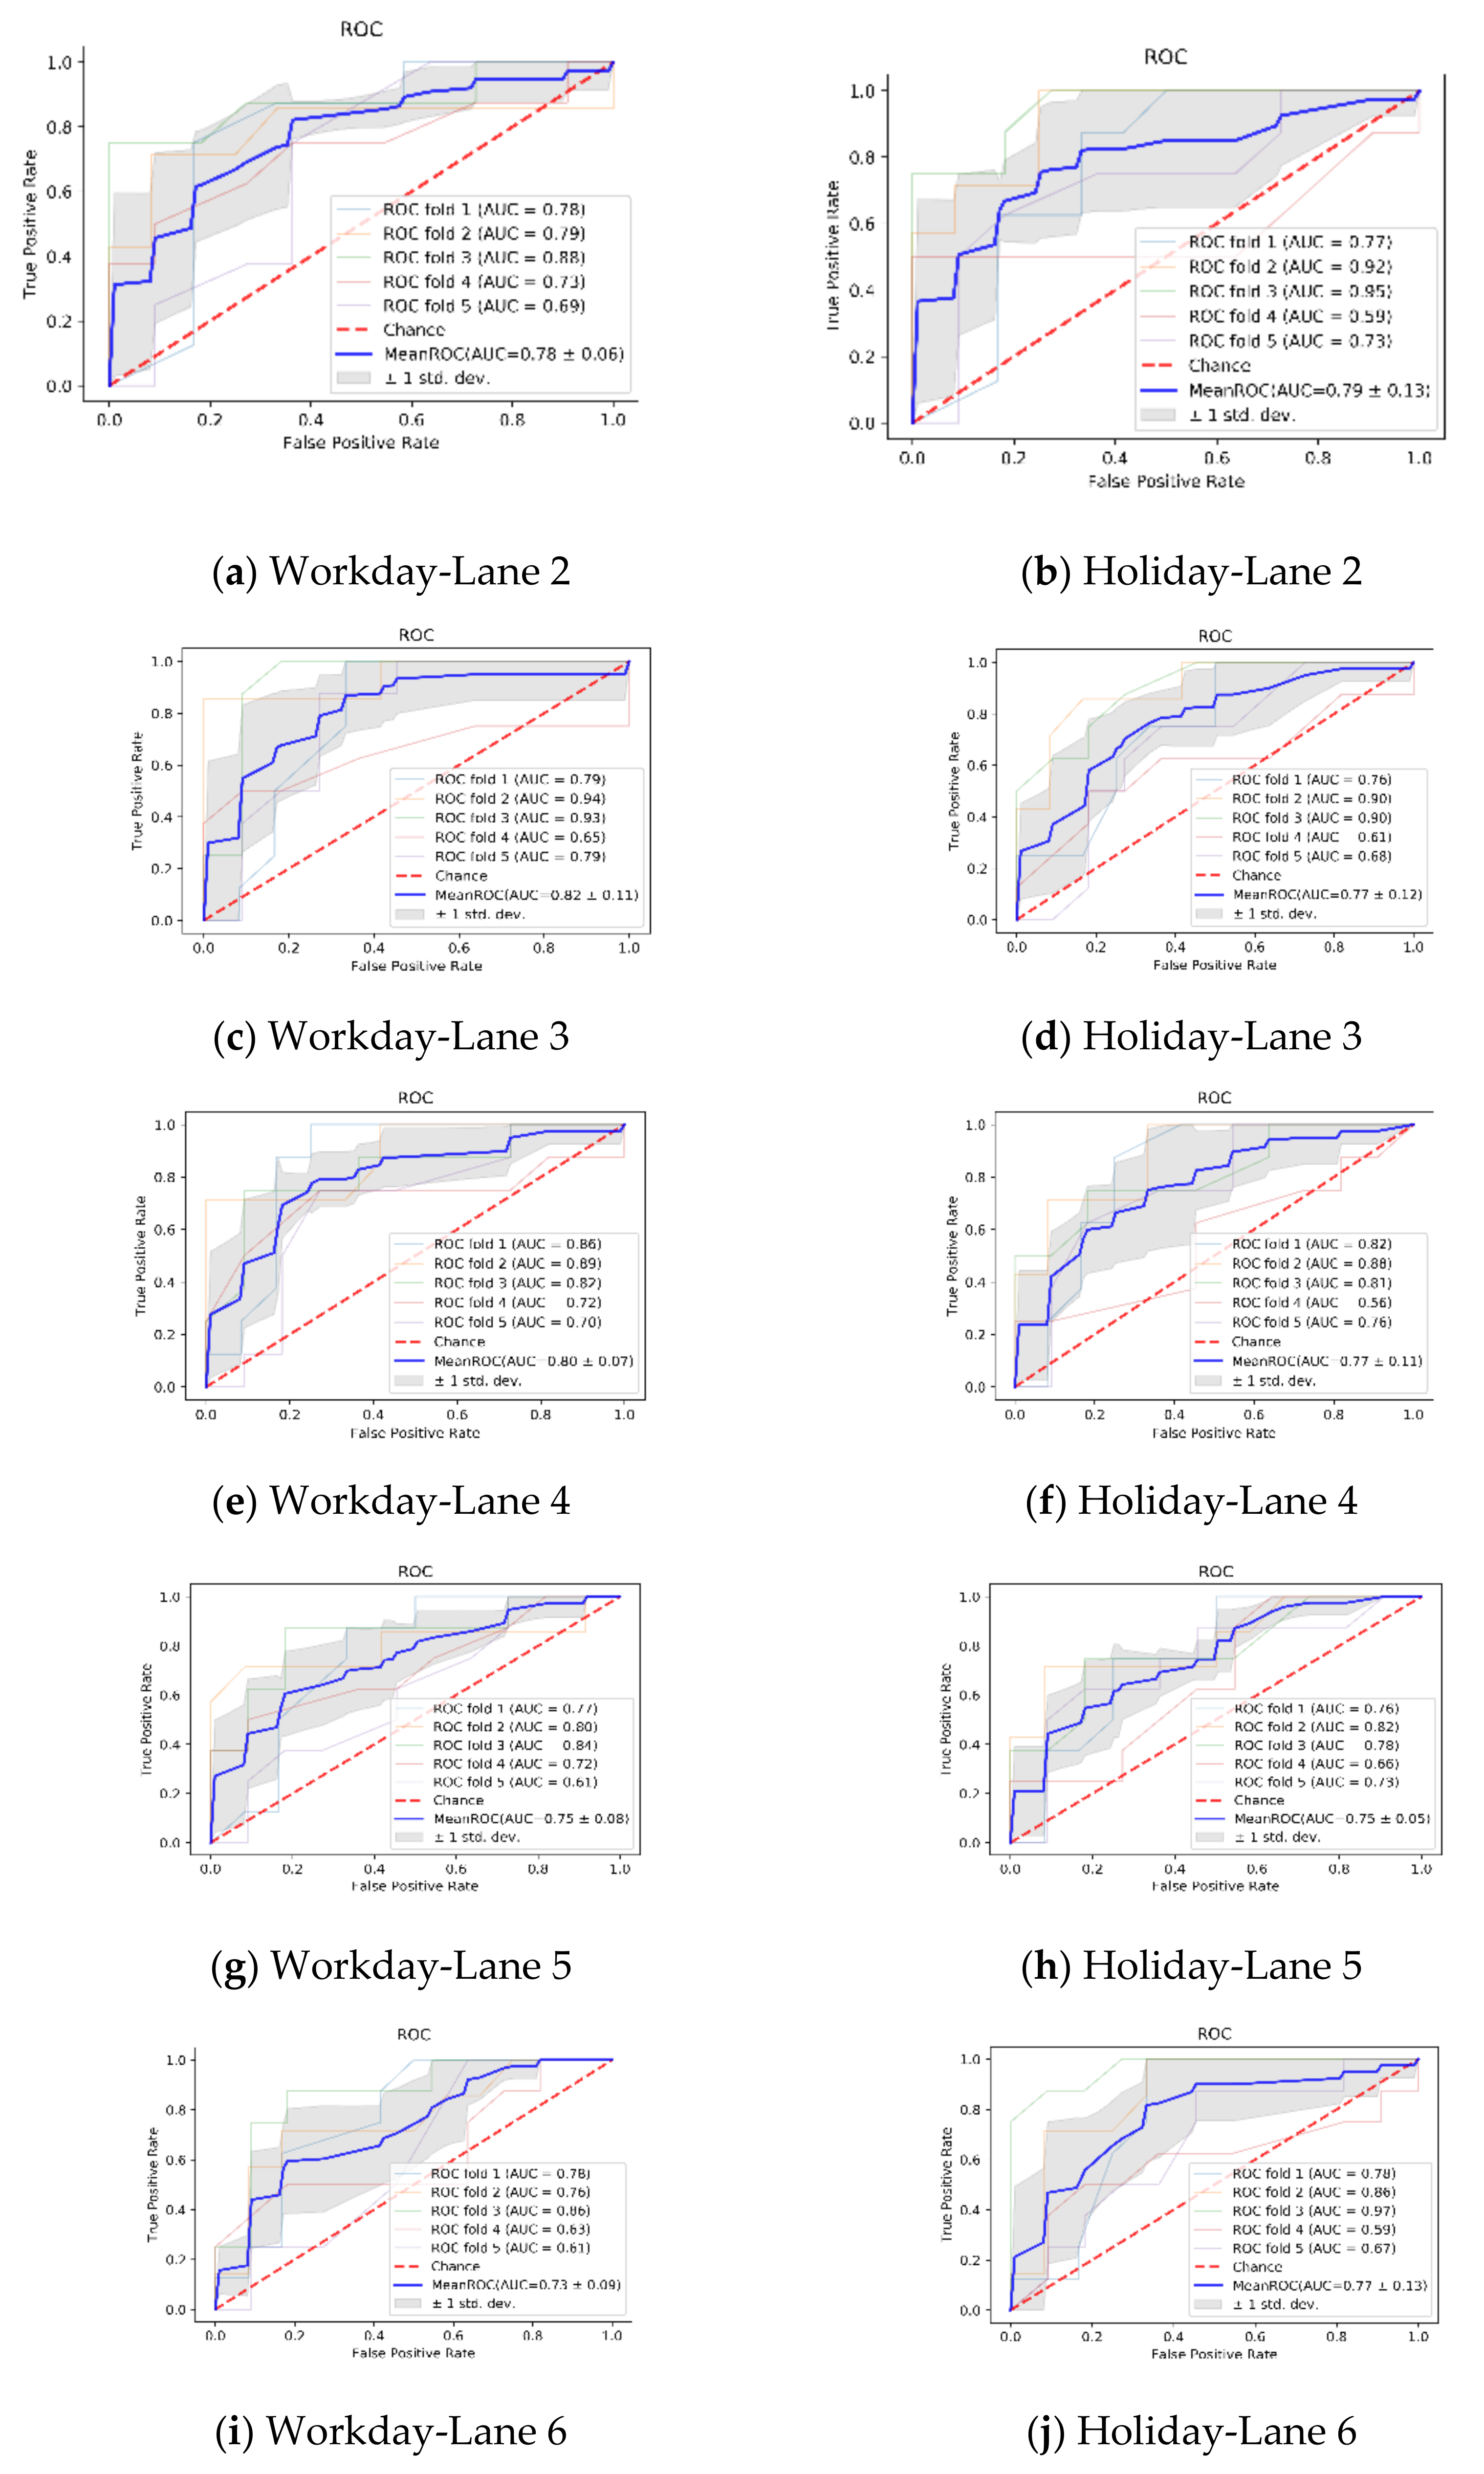
4.3. K-Fold Cross Validation Analysis

In this section, k-fold cross validation is used to evaluate the performance of PITED detection. ROC curves are characterized by true positive rates on the Y-axis and false positive rates on the X-axis, Figure 7 showing how the PITED output is affected by training data.
Firstly, from the longitudinal comparison, the detection effect of all lanes is above the chance line, that is to say, the detection performance of PITED is above 50%, and the average AUC value is around 0.8. The MeanROC curve of lane 2, 3, 4, and 5 is steeper than lane 6, which is due to a large number of lane changing behaviors before vehicles enter the left-turn lane, which brings great difficulty to model training of PITED compared with other lanes. In addition, when the false alarm rate of lane 3 and lane 4 is 0.4, the detection rate can reach more than 82%, and the detection performance of PITED is better than that of other lanes. When the folding number of each lane is 3, the maximum number of cross-verified AUC reaches the maximum number of times, up to 3 times, and the AUC stays above 0.85, up to 0.93. Lane 3, 4, and 5 with less grey area indicate that the stability of traffic flow in the straight lane is higher than that in the left-right lane. Lane changing behavior of vehicles before entering the intersection is less, and the probability of traffic events is low. The detection performance of PITED is not easily misled by the change of traffic flow caused by normal lane change.
Secondly, from the horizontal comparison, holiday only have lane 2 and 6 of the AUC value is higher than the working days. The rest of the lanes, 3, 4, 5, are below the working days, which means the holidays because of the transportation of regularity is not obviously like a working day, traffic capacity of straight lanes reduce. Although total lanes changing frequency increases, the detection performance of PITED is slightly below the state of working days. However, the amount of 3, 4, 5 workdays lanes grey interval area is significantly higher than those of the holidays. It shows that the lane detection standard deviation is greater than the holiday. In the case of different K discount ratio, the performance of traffic event detection is affected by the distribution of traffic event samples. From the steepness rate, lane 2 and lane 6 holidays are the same as working days, lane 3 days are larger than working days, and lane 4 and lane 5 days are lower than working days. All lanes during holidays and working days except lane 6, MeanROC of other lanes is far from chance line, which indicates that PITED has a good learning ability and can capture the vehicle behavior to some extent. When detecting lane-level traffic flow data, and has a certain adaptability in the face of nonlinear and chaotic data.

4.4. Comparative Analysis of Different Algorithms

In order to verify the effectiveness of PITED, this group of experiments compared it with the classical classification algorithm. As shown in Table 3, the results of five evaluation indexes are Neural Network (NN), Support Vector Machine (SVM), DT, RF-OOB, and PITED. The number of decision trees of RF-OOB and PITED remains the same, set to 1000. NN, SVM and DT parameters are set using Python open-source framework for machine learning, and Scikit-learn default parameters.
As shown in Table 3, the highest detection rate is PITED, which is 89.23%, much higher than the average value, followed by RF-OOB, indicating that Random Forest can mitigate the impact of data imbalance to a certain extent compared with NN, SVM, and DT; PITED also has the best false alarm rate, which means that PITED further enhances the robustness of the model by selecting the importance variables through permutation arrangement. Although it obtains a high detection rate, it also reduces the false alarm rate and meets the needs of practical application; Looking at the MTTD index, DT is the best, and the average detection time is only 0.26 min, which is much lower than RF-OOB and PITED. The reason is that DT is a single decision tree, while PITED is the integration of multiple decision trees, and the running time is bound to be more than DT, reaching 0.92 min; CR and AUC indexes are better than other classification algorithms. Four of the five evaluation indexes and PITED obtain the optimal value. In other words, to a certain extent, the PITED method proposed in this paper has strong competitiveness in the application of traffic event detection.

5. Discussion and Conclusions

Intersection traffic event detection is designed to capture the abnormal state of traffic flow. In this study, a TED problem is transformed into a two-classification problem, so as to introduce an artificial intelligence method. When traffic events occur in the intersection area, we take the abnormal evolution of traffic flow as a breakthrough to carry out in-depth TED research, so as to create a foundation for the construction and application of intersection traffic-state prediction and traffic-control model.
First, study and judge the importance of traffic flow variables. Using the method of multi-source data fusion, the traffic control events in the intersection area are manually demarcated and constructed into a traffic flow database. Based on the analysis of lane level traffic rheology based on Random Forest, it is found that there are limitations in the evaluation of importance of Random Forest. Based on this analysis, it lays the groundwork for the evaluation of importance of replacement arrangement;
Secondly, a traffic event detection algorithm based on PI is proposed. The theoretical basis of this method is the importance of permutation arrangement. Based on PI, the core framework of TID in this chapter is proposed, and the process of the PITED method is systematically described. Finally, according to a variety of evaluation indicators, three groups of different tests are established to compare and verify the effectiveness of the proposed method. The results show that the detection rate is more than 85% and the false alarm rate is less than 3%, which can meet the requirements of practical intersection application. Based on improved Random Forest method, this paper aims to analyze the key parameters of the traffic flow data which are obtained by the monitoring sensors. By means of evaluating the importance of parameters, we improve the traditional Random Forest method by proposing an algorithm based on Permutation Importance (PI). Finally, three groups of different experiments are established according to various evaluation indexes which are compared with proposed method. The results show that the detection rate is more than 85% and the false alarm rate is less than 3%, which could meet application requirements of the actual traffic event detection.

Author Contributions

Conceptualization, Z.S. and C.Z.; methodology, Z.S.; software, Z.S.; validation, Z.S., C.Z. and Q.L.; formal analysis, Z.S.; investigation, Z.S.; resources, Q.L.; data curation, Z.S. and F.S.; writing—original draft preparation, Z.S.; writing—review and editing, C.Z.; visualization, Q.L.; supervision, C.Z.; project administration, C.Z.; funding acquisition, C.Z. All authors have read and agreed to the published version of the manuscript.

Funding

This work is supported by the National Natural Science Foundation of China under Grants 61773210.

Institutional Review Board Statement

Not applicable.

Informed Consent Statement

Not applicable.

Data Availability Statement

The data presented in this study are available upon reasonable requestfrom the corresponding author.

Conflicts of Interest

The authors declare no conflict of interest.

References

  1. Buch, N.; Velastin, S.A. A Review of Computer Vision Techniques for the Analysis of Urban Traffic. IEEE Trans. Intell. Transp. Syst. 2011, 12, 920–939. [Google Scholar] [CrossRef]
  2. Hu, X.W.; Xu, X.M.; Xiao, Y.J.; Chen, H.; He, S.F.; Qin, J.; Heng, P.A. SINet: A Scale-Insensitive Convolutional Neural Network for Fast Vehicle Detection. IEEE Trans. Intell. Transp. Syst. 2019, 20, 1010–1019. [Google Scholar] [CrossRef] [Green Version]
  3. Jalali, A.; Nejad, H.T. Event Detection in Freeway Based on Autocorrelation Factor of GPS Data. Int. J. Intell. Transp. Syst. Res. 2020, 18, 174–182. [Google Scholar]
  4. Sindagi, V.A.; Patel, V.M. A survey of recent advances in CNN-based single image crowd counting and density estimation. Pattern Recognit. Lett. 2018, 107, 3–16. [Google Scholar] [CrossRef] [Green Version]
  5. Zhang, J.P.; Wang, F.Y.; Wang, K.F.; Lin, W.H.; Xu, X.; Chen, C. Data-Driven Intelligent Transportation Systems: A Survey. IEEE Trans. Intell. Transp. Syst. 2011, 12, 1624–1639. [Google Scholar] [CrossRef]
  6. McCall, J.C.; Trivedi, M.M. Video-based lane estimation and tracking for driver assistance: Survey, system, and evaluation. IEEE Trans. Intell. Transp. Syst. 2006, 7, 20–37. [Google Scholar] [CrossRef] [Green Version]
  7. Meng, Q.; Song, H.S.; Zhang, Y.; Zhang, X.Q.; Li, G.; Yang, Y.N. Video-Based Vehicle Counting for Expressway: A Novel Approach Based on Vehicle Detection and Correlation-Matched Tracking Using Image Data from PTZ Cameras. Math. Probl. Eng. 2020, 2020, 1969408. [Google Scholar] [CrossRef] [Green Version]
  8. Rettore, P.H.L.; Santos, B.P.; Lopes, R.R.F.; Maia, G.; Villas, L.A.; Loureiro, A.A.F. Road Data Enrichment Framework Based on Heterogeneous Data Fusion for ITS. IEEE Trans. Intell. Transp. Syst. 2020, 21, 1751–1766. [Google Scholar] [CrossRef]
  9. Huang, T.T.; Wang, S.; Sharma, A. Highway crash detection and risk estimation using deep learning. Accid. Anal. Prev. 2020, 135, 105392. [Google Scholar] [CrossRef] [PubMed]
  10. Sheikh, M.S.; Liang, J.; Wang, W.S. An Improved Automatic Traffic Event Detection Technique Using a Vehicle to Infrastructure Communication. J. Adv. Transp. 2020, 2020, 9139074. [Google Scholar] [CrossRef] [Green Version]
  11. Lin, Y.; Li, L.; Jing, H.; Ran, B.; Sun, D. Automated traffic incident detection with a smaller dataset based on generative adversarial networks. Accid. Anal. Prev. 2020, 144, 105628. [Google Scholar] [CrossRef] [PubMed]
  12. Davis, N.; Raina, G.; Jagannathan, K. A framework for end-to-end deep learning-based anomaly detection in transportation networks. Transp. Res. Interdiscip. Perspect. 2020, 5, 100112. [Google Scholar] [CrossRef]
  13. Evans, J.; Waterson, B.; Hamilton, A. A Random Forest Event Detection Algorithm that Incorporates Contexts. Int. J. Intell. Transp. Syst. Res. 2020, 18, 230–242. [Google Scholar]
  14. Han, X.; Shi, Y. Online Traffic Congestion Prediction Based on Random Forest; Atlantis Press: Paris, France, 2018. [Google Scholar]
  15. Duan, Y.J.; Lv, Y.S.; Liu, Y.L.; Wang, F.Y. An efficient realization of deep learning for traffic data imputation. Transp. Res. Part C-Emerg. Technol. 2016, 72, 168–181. [Google Scholar] [CrossRef]
  16. Chen, Z.H.; Ling, X.Y.; Feng, X.X.; Zheng, H.F.; Xu, Y.W. Short-term Traffic State Prediction Approach Based on FCM and Random Forest. J. Electron. Inf. Technol. 2018, 40, 1879–1886. [Google Scholar] [CrossRef]
  17. Liu, X.Z.; Cai, H.X.; Zhong, R.X.; Sun, W.L.; Chen, J.Z. Learning Traffic as Images for Event Detection Using Convolutional Neural Networks. IEEE Access 2020, 8, 7916–7924. [Google Scholar] [CrossRef]
  18. Kee, C.Y.; Wong, L.; Khader, A.T.; Hassan, F.H. Multi-label classification of estimated time of arrival with ensemble neural networks in bus transportation network. In Proceedings of the 2017 2nd IEEE International Conference on Intelligent Transportation Engineering (ICITE), Singapore, 1–3 September 2017; pp. 150–154. [Google Scholar]
  19. Ke, G.; Meng, Q.; Finley, T.; Wang, T.; Chen, W.; Ma, W.; Ye, Q.; Liu, T.-Y. LightGBM: A Highly Efficient Gradient Boosting Decision Tree. In Proceedings of the Neural Information Processing Systems, Long Beach, CA, USA, 4 December 2017; Volume 30. [Google Scholar]
  20. Sun, L.B.; Lin, Z.T.; Li, W.N.; Xiang, Y.Q. Freeway event detection based on set theory and short-range communication. Transp. Lett.-Int. J. Transp. Res. 2019, 11, 558–569. [Google Scholar] [CrossRef]
  21. Ou, J.; Xia, J.; Wu, Y.-J.; Rao, W. Short-Term Traffic Flow Forecasting for Urban Roads Using Data-Driven Feature Selection Strategy and Bias-Corrected Random Forests. Transp. Res. Rec. 2017, 2645, 157–167. [Google Scholar] [CrossRef] [Green Version]
Figure 1. Traffic events cause compression waves and expansion waves; the variation curve of traffic flow parameters under the influence of traffic events.
Mathematics 10 00873 g001
Figure 2. Random Forest algorithm schematic.
Mathematics 10 00873 g002
Figure 3. LightGBM model computing process.
Mathematics 10 00873 g003
Figure 4. Comparison of traffic flow variable selection between working day and rest day: (a) shows characteristics of traffic flow data distribution about Lane 2 on workday, (b) shows characteristics of traffic flow data distribution about Lane 2 on holiday, (c) shows characteristics of traffic flow data distribution about Lane 3 on workday, (d) shows characteristics of traffic flow data distribution about Lane 3 on holiday, (e) shows characteristics of traffic flow data distribution about Lane 4 on workday, (f) shows characteristics of traffic flow data distribution about Lane 4 on holiday, (g) shows characteristics of traffic flow data distribution about Lane 5 on workday, (h) shows characteristics of traffic flow data distribution about Lane 5 on holiday, (i) shows characteristics of traffic flow data distribution about Lane 6 on workday, (j) shows characteristics of traffic flow data distribution about Lane 6 on holiday.
Mathematics 10 00873 g004aMathematics 10 00873 g004b
Figure 5. The junction of HeXi road and HengShan road.
Mathematics 10 00873 g005
Figure 6. Comparison of the number of decision trees of Random Forest: (a) shows ROC curves for DT = 10, (b) shows ROC curves for DT = 30, (c) shows ROC curves for DT = 50, (d) shows ROC curves for DT = 70, (e) shows ROC curves for DT = 90, (f) shows ROC curves for DT = 110, (g) shows ROC curves for DT = 170, (h) shows ROC curves for DT = 210, (i) shows ROC curves for DT = 300, (j) shows ROC curves for DT = 500, (k) shows ROC curves for DT = 700, (l) shows ROC curves for DT = 1000.
Mathematics 10 00873 g006aMathematics 10 00873 g006b
Figure 7. Cross validation and comparative analysis: (a) ROC curves of k-fold cross validation about lane 2 on workday, (b) ROC curves of k-fold cross validation about lane 2 on holiday, (c) ROC curves of k-fold cross validation about lane 3 on workday, (d) ROC curves of k-fold cross validation about lane 3 on holiday, (e) ROC curves of k-fold cross validation about lane 4 on workday, (f) ROC curves of k-fold cross validation about lane 4 on holiday, (g) ROC curves of k-fold cross validation about lane 5 on workday, (h) ROC curves of k-fold cross validation about lane 5 on holiday, (i) ROC curves of k-fold cross validation about lane 6 on workday, (j) ROC curves of k-fold cross validation about lane 6 on holiday.
Mathematics 10 00873 g007
Table 1. The traffic flow variables contained in the data.
Serial
Number
VariableSpecific MeaningUnit
1VEHSPEED15 min average vehicle speedkm/h
2QUEUELEN15 min Cumulative queue length of vehiclesm
3QUEUEVEHNUM15 min Cumulated queue number of vehiclesveh
4CONTSEC15 min Cumulative duration of vehicles
5VOLUME15 min Cumulative traffic flowveh/15 min
Table 2. Parameter setting.
ParametersDescriptionDefaultOur
Num_leavesNumber of leaf nodes per tree3131
Learning_rateLearning rate0.10.05
Max_depthMaximum depth of tree−18
Min_data_in_leafMinimum records of leaves2020
Feature_fractionScale of feature selection1.00.5
Bagging_fractionSelect the scale of the data1.00.5
min_split_gainMinimum segmentation gain0.10.1
bagging_freqThe number of bagging times.
0 means disabled
00
Num_classNumber of categories/2
Table 3. Comparison of evaluation indicators by different methods (* bold is the optimal value).
MethodDR (%)FAR (%)MTTD (min)CR (%)AUC (%)
NN79.533.630.5684.3569.43
SVM80.213.960.4782.7670.29
DT78.623.570.26 *83.2571.54
RF-OOB83.653.790.8391.7276.23
PITED89.23 *2.81 *0.9293.48 *87.95 *
Average82.253.550.6187.1175.09
Publisher’s Note: MDPI stays neutral with regard to jurisdictional claims in published maps and institutional affiliations.

