Abstract
The aviation industry is a prominent contributor to economic development. The existence of an airport hub that provides a worldwide transportation network generates economic growth, creates jobs, and facilitates international trade and tourism. This industry also helps in connecting different continents, countries, and cultures. This study utilizes the Data Envelopment Analysis models Charnes, Cooper, and Rhodes (CCR), Banker, Charnes, and Cooper (BCC), Slacks-Based Measure (SBM), and Epsilon Based Measure (EBM) in analyzing and evaluating the operational performance of the 21 major airports runway design during the years of 2016–2019 using the data of the International Civil Aviation Organization (ICAO) air transport statistics. The objective of this paper is to assess the efficiency of various airport runway configurations based on input factors such as number of runways, dimension of runways, airport area, and output factors such as annual number of flights and annual number of passengers. In the four applied models, the results indicated London Heathrow Airport (LHR) and Munich International Airport (MUC) are efficient in utilizing the runway during the considered periods. Surprisingly, airports in the Asian continent with a parallel runway design are more efficient than in North America and Europe. This study can be a valuable reference for operation managers in evaluating and benchmarking the performance of an airport with different types of runway configurations. Moreover, it can be used by decision-makers, investors, stakeholders, policymakers, private companies, and government agencies as a guideline suitable for an airport.
1. Introduction
Airports are critical to a country’s economic growth. The expansion of airports has coincided with the political and social environment in which airport organizations interact with each other [1]. Airports establish the foundation of the civil aviation industry which has developed immensely in terms of number, size, and complexity. Companies such as Airbus and Boeing continue to design or improve new aircraft that corresponds to the need for longer runways and bigger terminal buildings in the airport. The advancement of technology on aircraft will have a huge significance on the growth of the airports in terms of the length of runways, the configuration of the runways, landing aids, taxiways, size of terminal buildings, size of ground transportation, and airport hubs. The common goal of all airports is to be compliant with international standards in air navigation and aviation operating services that rely on high-quality services, the safety of the passengers, environment-friendly with high-tech infrastructure and system, as well as a skilled workforce. Assessing the airport efficiency and generating the performance while improving the policies for the inefficient airports would have a significant impact on national economies [2]. The aviation industry is currently an important part of all modern, industrialized economies and it is the fastest and quickest way of transporting people and goods/cargo. Airports are usually affected by economic development. Such increased economic development in a region often results in the expansion of existing airports as well as the construction of new ones. The airports’ connections to the economy are often inextricably linked to political structures. The fact that airports are often operated by the government, suggests that airports and political structures are interdependent. When Chicago Convention was signed in 1944, a specialized organization was formed by the United Nations called the International Civil Aviation Organization (ICAO) which sets the international standards for the functioning airports of 193 countries around the world. Those 193 countries are required to align the international standards to their respective local regulations giving emphasis and importance to safety, security, and sustainable air operations. For example, Federal Aviation Administration (FAA) is a transportation agency that regulates all aspects of civil aviation in the United States while in Europe, the European Union Aviation Safety Agency (EASA) is responsible for the civil aviation safety, certification, regulation, standardization and also carrying out investigation and monitoring [3].
Every airport around the world has its uniqueness in terms of the structure of the building, the number of runways, and its size. For example, in Asia, Singapore Changi Airport (SIN) is one of the largest transportation hubs in both global passenger and freight traffic which makes it one of the busiest airports in the world. Singapore Airport was the first airport in the world rated as the World’s Best Airport by Skytrax [4]. London-Heathrow Airport (LHR) and Munich International Airport (MUC) were among the busiest airport hubs in the European continent and were consistent with high-density passengers and cargo. Meanwhile, in the continent of America, Hartsfield Jackson Atlanta International Airport (ATL) was the busiest airport in 2019 according to the Air Transport Statistics of 2019 by the ICAO which recorded 110,531,000 passengers embarked and disembarked and 904,000 Aircraft movements. The similarities and differences of these airports are the runway configurations according to Bertsimas et al. [5]. There were two important factors in selecting the optimal airport runway configuration: to minimize the delay of in-flight aircraft and on-the-ground aircraft along with their associated costs. Likewise, Ramanujam et al. [6] stated the factors in the selection of runway configurations such as weather (wind and visibility), expected arrival and departure demand, environmental considerations, noise abatement procedures, and flows are coordinated with nearby airports. Commonly, airports are either designed with parallel runways or intersecting runways. London-Heathrow Airport was designed with parallel runways, Zurich Airport possesses two intersecting runways and a single runway. Runways can also be a combination of both configurations. The best example is San Francisco International Airport which consists of two pairs of parallel runways intersecting each other. Li et al. [7] used a simulation tool in measuring the operational efficiency in closely spaced parallel runways which yielded a result of 5% efficiency using the parallel runway configuration. On the other hand, one of the advantages of the airport with intersecting runway configuration is aircraft are allowed to take-off and land effectively on most of the weather conditions such as strong winds or depending on the direction of the wind. However, intersecting runways are more prone to airborne collision risk. Henry et al. [8] applied the Monte Carlo simulation and developed a strategy to mitigate the unacceptable risk by ensuring that aircraft can avoid certain situations like a mid-air collision.
The Data Envelopment Analysis (DEA) paradigm is effective for studying multiple Decision-Making Units (DMUs), multiple inputs, and numerous outputs. The model does not presuppose a functional form in advance, and each factor’s weight can be determined independently because the DEA model’s reference set may be utilized for benchmarking, it is particularly well-suited to assess operational performance. Schaar and Sherry [9] compared the DEA models such as CCR, BCC, and SBM models in benchmarking airport performance efficiency that resulted in CCR analysis of the efficiencies being degraded in small to medium to large airports while BCC displayed no significant difference in the efficiencies of the three classes of airports. Lastly, the SBM analysis from large to medium to small airports reveals a decline in productivity. Baltazar et al. [10] compared the DEA approaches and Multi-Criteria Decision Analysis (MCDA) in determining the performance and efficiency of an airport and resulted in the MCDA approach as more suitable for evaluation rather than the DEA approach. In selecting the optimal airport runway configurations, Bertsimas et al. [5] determined the selection of the optimal runway configuration and optimal balance of arrivals and departures to minimize the delay of the in-flight and on-the-ground aircraft. Currently, the most commonly used runway configurations of airports are parallel and intersecting runways. Li et al. [7] showed that closely spaced parallel runways are capable to support 765–815 aircraft movements on a peak day and 55 aircraft movements in each hour promoting operational efficiency by about 5%. On the other hand, intersecting runways are prone to airborne collision risk that can cause delays in operations, Henry et al. [8] simulated the intersecting runway using the Monte Carlo simulation to mitigate the unacceptable risk that ensures that aircraft will avoid a midair collision.
The concerns that must be determined as a foundation for this research investigation were discovered in this study. It provides an overview of the operational performance of the aviation industry of the 21 major airports with their runway configuration during the years of 2016–2019. It also provides significant contributions in the aviation industry on the airport services and how they cater to the embarking and disembarking passengers in the airport. Further, it will also present the efficiency of an airport with different runway configurations. In analyzing the DMUs, the DEA models (CCR, BCC, SBM, EBM) that are utilized for industry analysis are also given and compare with each other based on input factors (number of runways, dimension of runways, and airport area) and output factors (annual number of flights and annual number of passengers). Acquiring the necessary data to pursue the purpose of the research pinpoints the primary objects that will be led to the DMUs.
Airports, also called air terminals, exist in all countries across the globe and serve as a terminal for passengers, cargo and generally have paved runways and maintenance facilities for aircraft. This paper utilized the DEA models to measures the technical efficiency of airports in terms of the runway configuration to attend the targeted output (annual number of flights and passengers). Therefore, the main contributions of this paper are presented as follows:
- This study aims to present an overview comparative analysis for measuring the runway utilization of airports using data envelopment analysis with CCR, BCC, SBM, EBM models.
- A case study of the top 21 major international airports with different runway configurations is used to illustrate the applicability and effectiveness of the proposed DEA models.
- The findings also indicate the general overview of the aviation industry from a worldwide perspective based on the performance, existence of the airport hub, location of the airport, and the runway configuration design of the 21 major airports. Surprisingly, airports from the Asian continent are more efficient than North America and Europe.
- For practical contributions, the current study provides holistic insights for operation managers in evaluating and benchmarking the airports utilizing the runway layout or design performance. Further, it can be used by decision-makers, investors, stakeholders, policymakers, private companies, and government agencies as a guideline for efficiency evaluation in this field or any related industry.
The following is the structure of the article. A brief review of the literature related is presented in Section 2. The mathematical of DEA models are shown in Section 3. A description of the data and considered factors are provided in Section 4. The results are reported and discussed in Section 5. Section 6 and Section 7 present the conclusion of this work, limitations, and directions for future research.
2. Literature Review
Charnes et al. [11] proposed the Data Envelopment Analysis (DEA) in 1978 as a data-oriented tool for analyzing Decision-Making Units (DMUs). DEA is a non-parametric approach that uses mathematical formulation to analyze DMUs’ efficiency and productivity in terms of proportionate changes in input and output factors. DMUs are a group of matched individuals that can be used to quantify their technical performance. A slew of DEA models was developed and commonly used to determine the performance behaviors and industrial efficiencies in emerging industries such as supply chain and logistics, mining, tourism, banking, transportation, manufacturing, energy firms, and many more. DEA was one of the tools in evaluating the efficiency of a certain industry. The input and output-oriented DEA models may be separated into two types. It evaluates the technical efficiency rate in input-oriented models by providing the minimal decrease in input indicators required for DMUs to become technically efficient. The output-oriented models, on the other hand, calculate the technical efficiency rate, which is the maximum rise in output indicators required for DMUs to become technically efficient. The CCR (Charnes, Cooper, and Rhodes) model was first introduced in measuring efficiencies in the industry and was also called constant return to scale.
The BCC (Banker, Charnes, and Cooper) model was created after the CCR model however this model can only identify between technical and scale inefficiencies by estimating by pure technical efficiency. The Variable Return to Scale (VRS) was implemented in this model by identifying the numerous increase, decrease, and constant return scales present during the model evaluation. The BCC model is also known as pure technical efficiency [12]. On the other hand, the CCR model was adjusted to become Slack-Based Measure (SBM) model with the purpose of the model while observing calculation of efficiency score in DEA-CCR and DEA-BCC model. Neither of the two models did take into consideration the amount of slack for the inputs and outputs of the SBM model which considered the slacks of the input and output [13]. Lastly, Tone [14] developed the Epsilon-Based Measure (EBM) model, which assesses technical efficiency using radial and non-radial properties. The affinity index between input and output was calculated using two parameters, as well as principal component analysis on the affinity matrix. In this model, the diversity/affinity index was introduced to replace the Pearson Correlation test to validate the data.
There are several studies in evaluating efficiency in other industries that can be considered for DEA as it is widely used in assessing the performance of the industry. The SBM model and Malmquist productivity index were used by Wang et al. [15] to evaluate the efficiency of Vietnam’s seaport terminal operators. This recent study showed most of the global trade is seaborne and plays an important role in the national economy of a country. Using the EBM and LTS models, Vietnam was identified as one of the fastest-growing industries, Wang et al. [16] integrated these models in evaluating the supply chain of the packaging industry that showed a result that one company in Vietnam achieved a strong efficiency score and high productivity. The DEA method can be used as well in senior care facilities. Lin et al. [17] investigated the efficiency and quality of care provided in elder care facilities. In the banking sector, the DEA method is also used in evaluating the performance of a bank. Ulas and Keskin [18] divided the banks into three categories—state-owned banks, privately owned banks, and all banks—and then assessed and ranked the banking sector in Turkey using DEA-CCR and DEA-BCC. It resulted that the state-owned banks are the most efficient, and pure technical efficiency or BCC model contributes more to analyzing compared to the technical efficiency. A recent study by Wang et al. [19] involving the automobile industry while using the Malmquist productivity index analysis in evaluating the automobile manufacturers using financial indicators as the input and output factors reveals that the study contributed to the organizational performance and offered a resource for auto executives, politicians, and investors to use in making management, investment, and improvement decisions.
There are similar studies in evaluating the operational performance of an airport using the DEA method. Keskin and Köksal [20] used a hybrid of AHP and DEA-CCR and DEA-BCC in evaluating the publicly or privately operated airports in Turkey which resulted that there were two airports from the private sector that are efficient and none of the public sectors were found as efficient. Sarkis [21] applied the DEA method in analyzing the operational efficiency of the 44 major airports in the United States using the inputs such as airport operational cost, number of airport employees, number of gates, and number of runways and outputs such as operational revenue, passenger flow, commercial/general aviation movement, and total cargo transportation. Meanwhile, before privatizing the Spanish airports, Martín and Roman [22] measured the efficiency which resulted in the extraction of some policy considerations before processing the privatization of the Spanish airport system. Stichhauerova and Pelloneova [23] used DEA to analyze the performance efficiency of 27 German airports and found that 13 out of 27 were efficient because they used best practices and followed the proper method in their management. Five airports were described in achieving the optimal and most productive size. Song et al. [24] implemented the three-stage DEA in evaluating the air transport sector in China with the consideration of various regional environmental factors and statistical noise that shows that the results pose an influence on the operational efficiency in the provincial air transport sector. Örkcü et al. [25] also evaluated the Turkish airports using the Malmquist productivity index and DEA with the inputs of a number of runways, dimension of runways, terminal area, and output of the annual number of flights, annual passengers, and annual cargo which resulted that most of the airports in Turkey experienced losses in efficiency but progressed in terms of technology. The factors that were identified were operating hours and percentage of international traffic using the Simar-Wilson double bootstrapping regression analysis as it had explained in the variation of the airport efficiency. As previously mentioned, the DEA-BCC model was used to analyze the pure technical efficiency. Nwaogbe et al. [26] applied the BCC model to the Nigerian airports with the results of the airport hub, large city airport, and the private airport being the productive and efficient airports. In recent years, the airport sector in New Zealand has undergone significant expansion. Tsui et al. [27] used DEA-SBM and Malmquist productivity index in estimating the airport efficiency in New Zealand where most of the airports experienced gains in efficiency however, they regressed in terms of technology.
Airports from Asia-Pacific began to emerge and service international airlines and passengers. Tsui et al. [28] also evaluated the operational efficiency of the 21 Asia-Pacific airports using DEA first followed by regression analysis in identifying the determinants of the airport efficiency. During the first stage of evaluation of the Asia-Pacific airports, the results indicate that airports from Australia (Adelaide, Brisbane, and Melbourne) and China (Beijing, Hong Kong, Shenzhen) are efficient. The second stage where the determinants are with variations of airport efficiency were identified such as percentage of international passengers handled by an airport, airport hinterland population size, dominant airline, and increase of GDP per capita. A detailed examination of performance efficiency by Barros and Dieke [29] showed that airports in Italy that imply managerial ramifications are then taken to confirm previous observations of similar relationships in other geographical contexts. To be able to determine the international airport’s operational efficiency drivers, Pacagnella et al. [30] were using the DEA method to assess 60 of the busiest international airports and discovered Beijing International Airport (Beijing, China), Heathrow International Airport (London, UK), Dubai International Airport (Dubai, United Arab Emirates), and Hartsfield-Jackson Atlanta International Airport (Atlanta, GA, USA) as the most efficient airports, with Heathrow International serving as the base reference of an efficient airport. A recent study by Huynh et al. [31] comparing the efficiency analysis using DEA-SBM and Tobit regression to the Southeast Asia major airports such as Changi International Airport (Singapore, Singapore), Suvarnabhumi International Airport (Samut Prakan, Thailand), KL International Airport (Sepang, Malaysia), Soekarno Hatta International Airport (Banten, Indonesia), Ninoy Aquino International Airport (Metro Manila, Philippines), Noi Bai Airport (Hanoi, Vietnam), Tan Son Nhat Airport (Ho Chi Minh City, Vietnam), Guangzhou Baiyun International Airport (Guangzhou, China) and Hong Kong International Airport (Hong Kong, China) provided a surprising result that Hong Kong International Airport achieved the highest efficiency score and maintained the leading position in Southeast Asia airports. The factors that were also considered to have a positive impact on airport efficiency in Southeast Asia are passenger throughput, cargo, and corporatization. A summary of inputs, outputs, DMU, and applied area in relevant studies is presented in Table 1.

Table 1.
Summary of methodologies and problem characteristics in relevant studies.
These studies presented thus far provide evidence that the DEA method is commonly used in evaluating the operational efficiency of the airport industry and the usual input factors were the number of runways, number of employees, and other financial indicators. While on the other hand the output factors commonly used were the number of passengers, number of aircraft movements, and air cargo movements. It is also evident that the DEA method can be widely used in any type of industry in measuring efficiency scores and comparing the scores with other DMUs to identify which DMUs are efficient and inefficient.
Using the DEA approach, the current study assesses the operational performance of major international airports with different runway configurations/designs. The research develops and examines many theories on the link between airport operational performance and runway design. In this paper, the three airport input factors (number of runways, dimension of runways, and airport area) and two airport output factors (annual number of flights and annual number of passengers) were selected for the CCR, BCC, SBM, and EBM models in determining the efficiency of each DMU despite the different weights of each model in assessing the efficiency score of the 21 major airports during the years of 2016–2019. The research data is derived or compiled data of the ICAO which provided the top airports based on traffic at major airports in the world and ranked by the total passengers in each airport. A variety of methods are used to assess the operational efficiency of each major international airport in the world. Each has its advantages and drawbacks that will be discussed.
Different from the Stochastic Frontier Approach (SFA) [32], DEA (non-parametric approach) does not require an assumption of a functional form relating inputs to outputs. As a nonparametric method based on mathematical programming, DEA is a data-oriented approach for benchmarking a set of peer units called decision-making units (DMUs) in terms of their efficiency indices converting multiple inputs into multiple outputs. There are three primary reasons why this study is meaningful: (1) The runway utilization of the major international airports seems to be less researched compared to operational performance in previous studies using operating variables such as number of employees, number of terminals, punctuality, terminal area, capacity, gates, distance from the city center, transport to the airport, cargo, aprons, and climate, etc. (2) This study utilized the DEA models (CCR, BCC, SBM, EBM) to uncover the pattern of technical efficiency of airports with comparative analysis during the 2016–2019 periods. (3) This study contributes to the existing literature by analyzing the efficiency of a large group of major international airports (21 airports); the size of sampled airports in this study is a good reflection and representation of the airport industry.
3. Materials and Methods
This section presents the methodology including four DEA models (CCR, BCC, SBM, EBM) used for evaluating the efficiency of the top major international airports. The procedure of research is illustrated in five steps, as can be seen in Figure 1.
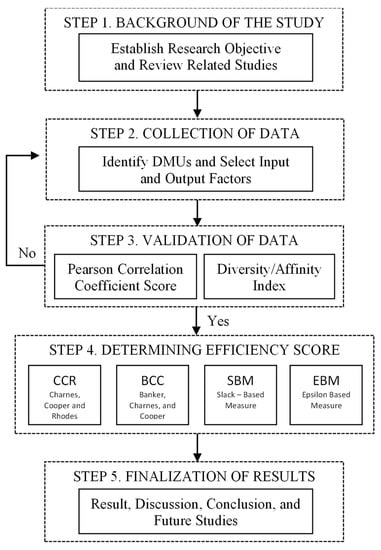
Figure 1.
Procedure of the research.
3.1. Validation of Data
Various statistical tools were used to validate and correlate the gathered data—among which is the Pearson correlation coefficient. The correlation of input and output data will be tested before the calculation of the efficiencies. The Pearson’s coefficient of correlation test is a known method globally and has been used in previous studies. Scores consist of values ranging from −1 to +1 in respect to each score that represents being dependent in linear scale between two determinants or data sets, as in model (1) [15].
where denotes the sample size, , are the individual points indexed , lastly the is the sample mean and analogous for .
The homogeneity and isotonicity will prove that tests of correlation are significant, and it will proceed in using any DEA methods. To have an isotonic relationship between input and output factors, it must show a positive correlation, and if the input factor’s values increase, the output factors’ values must not drop. In short, achieving correlation scores that are close to +1 means having a better positive linear relationship.
3.2. Data Envelopment Analysis
Data Envelopment Analysis is a data-oriented method that is used to evaluate the DMUs which indicates the set of matching entities in a way the individual technical efficiency can be computed. It uses linear programming as an optimization method in assessing the productivity of the DMUs and computing the efficiency scores with relation to the input and output proportional change. At the same time, DEA can assess the total efficiency, production efficiency, and scale economies, as well as identify the inefficient units in the dataset and provide target enhancement numbers [15].
3.2.1. Charnes, Cooper, Rhodes Model (CCR)
According to Charnes et al. [11], under the CCR model as in model (2), decision-making units correlates to specified input and output () when measuring technical efficiency . As shown in the equation below, represents the intensity vector of the weight of inputs and the non-radial slacks represents .
3.2.2. Banker, Charnes, and Cooper Model (BCC)
In the BCC model, as can be seen in model (3), Banker et al. [12] added a restriction that generalizes the model to variable return to scale (VRS) where is a non-Archimedean element and and account, respectively, for the input and output slack variables.
The BCC model can be recognized between technical and scale inefficiencies by estimating it as pure technical efficiency at the likely scale of operation. It also identifies numerous increase, decrease, and constant return scales present during the model evaluation. The measure of efficiency provided by the BCC model is also known as pure technical efficiency.
3.2.3. Slacks-Based Measure Model (SBM)
The SBM model was formulated by Cooper et al. [33] as shown in Equation (4). For the given input and output factors, Cooper et al. [33] defined as the decision-making unit’s technical efficiency. Tone [13] demonstrated that in model (2), in the CCR model in terms of technical efficiency is equal or significantly greater to , for example, .
3.2.4. Epsilon Based Measure Model (EBM)
In evaluating the DMUs efficiency, DEA works with a variety of input and output factors. The CCR model is a basic model in which the focus is on proportional changes in input and output while ignoring the presentation of slacks, as in the radial method. Meanwhile, the SBM model explicitly displays the slacks but ignores the proportionality change of input and output, as does the non-radial method. The EBM model is a scalar that calculates the epsilon, which represents the variety or dispersion of the observed data set. The set of symbols and notations is used during the EBM model development. The input and output matrices serve the model that considers DMUs () along with inputs () and outputs (). and . The and matrices are non-negative. The input-oriented EBM model with a constant return to scale is shown in model (5) as follows [34].
It implies that is the DMU’s intense vector, the DMU under evaluation is represented by the subscript “”, and the amount of slack and weight is represented by the and in the ith input. Finally, a parameter specifies the radial qualities and is dependent on the degree of input dispersion.
The affinity index is used in determining the correlation between the input and output factors. According to Tone and Tsutsui [34], and between two factors, represent diversity index and affinity index, respectively. The prerequisites for the EBM model to work are as follows: , and .
4. A Case Study
4.1. Selection of Input and Output Factors
In order to measure efficiencies using DEA, it is critical to choose appropriate input and output factors, determine the total number of airport observations, and ensure that the number of airports observed is at least twice the sum of the number of input and output factors. In this paper, the three airport input factors (number of runways, dimension of runways, and airport area) and two airport output factors (annual number of flights and annual number of passengers) were selected for the CCR, BCC, SBM, and EBM model in determining the efficiency of each DMUs despite the different weights of each model in assessing the efficiency score. There was no change in the number of runways since large investments and long-term planning are required. Obtaining the factor input/output as the weighted sum of the original values with weights and displaying the values of the first eigenvalue of the input/output, according to Örkcü et al. [25]. He went on to say that computing the inertia of the two factors with a value near 1 implies an accurate presentation of the input and output factors and that it was appropriate, to sum up, the information of the whole data matrix by the two factors.
In the process of assessment of the airport’s performance, the chosen five factors are very important since these represent the aspects of operations of each airport. Since this study focuses on the efficiency of the major international airport that is related to the ranking of total passengers that each airport caters to, it shows also the comparison of each model used in this study in which each model has different factors in evaluating efficiencies. As a result, the input and output parameters were meticulously chosen to meet the condition of factor isotonicity. The parameters will be re-evaluated or discarded if this does not happen. The explanation of input and output factors is shown as follows (Figure 2).
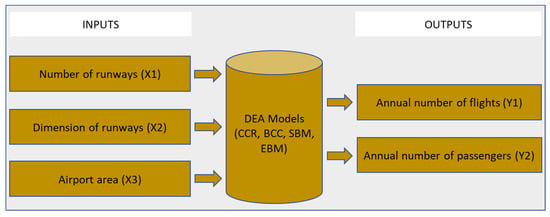
Figure 2.
Inputs and outputs used in the DEA models.
Input factors:
- Number of runways (X1): Total number of runways in each airport.
- Dimension of runways (X2): Length and width of the runway (m2)
- Airport area (X3): Total area of the airport (m2)
Output factors:
- Annual number of flights (Y1): The number of airplanes/aircraft that takeoff and land (planes)
- Annual number of passengers (Y2): The total number of passengers embarked and disembarked each year (Persons).
4.2. Collection of Data
The International Civil Aviation Organization (ICAO) provided the top 25 ranks of airports based on traffic at major airports in the world and ranked by the total passengers in each airport [35]. After establishing the DMUs, suitable input and output factors must also be classified which will further be used for the DEA calculations. The factors that will be considered for this research will be based on the previous studies, in which operations factors are normally used but, in this study, operational efficiency performance will be more emphasized. The data that was collected will go through a correlation test using Pearson’s correlation coefficient and the EBM model to be checked with the diversity and affinity indexes. Since the function of this test is to consider if it is homogenous and the relationship is isotonic between input and output factors, the condition must be satisfied in DEA to be able to provide a decisive calculation of efficiency scores. If a single instance of negative coefficient appears in the test, the part of the data that causes the negative result must be identified and some adjustments are made. Once all of the coefficient scores turn out to be positive, it will proceed to the next step.
The main scope of the research is to evaluate the performance of major international airports on the scale of passenger output using a four-year date, from 2016 to 2019 being studied. Out of over a hundred major international airports, the data was based on the International Civil Aviation Organization-Air Transport Statistics in the top 25 traffic at the world’s major airports but due to the insufficient data of the other 4 airports they were excluded in this study. The chosen major airports represent different continents wherein seven in North America, six in Europe, and eight in Asia as shown in Table 2. The descriptive statistics of the collected data during 2016–2019 are presented in Table 3. From the data in Table 4, it is apparent that North America and Europe have the highest input and output value compared to Asia though most of the airports in North America and Europe have a sizable airport than Asia.
Table 2.
The top 21 major airports in 2019 listed by ICAO.
Table 3.
The descriptive statistics of the collected data during 2016–2019.
Table 4.
The descriptive statistics of the collected by group of continents.
5. Results Analysis
5.1. Correlation Results
The outcome of the research is notably influenced by the input and output factors. To be able to determine that the input and output factors have an isotonic relationship, they must undergo a Pearson correlation test to determine if the factor is positively correlated. This will certify if the inputs and outputs are related isotonically. The adequate coefficient amount must be 0 to 1 to ratify the positive correlation. A perfect negative linear relationship is represented by a coefficient of −1, whereas a perfect positive linear relationship is represented by a coefficient of + 1. The coefficient of 0 indicates that there is no linear relationship between the two factors [15]. The correlation matrix of factors during 2016–2019 is shown in Table 5. The results show that all correlations are positive (all more than 0.110), and significant at the 0.01 or 0.05 level.
Table 5.
The correlation matrix of input and output factors during 2016–2019.
On the other hand, the EBM model does not display the original translation but introduces an affinity index between the input vector, unlike in Pearson’s correlation test, and the result converts the full original data [15]. The vectors of the EBM model should exhibit a positive affinity index of vectors where the values would be appeased with the condition from 0 to 1. The diversity index as shown in Table 6 shows the diversity is from 0 to 0.264 along with the affinity index also shows the affinity from 0.472 to 1. In addition, the affinity and diversity approach the maximum eigenvector and eigenvalue, which validates the affinity index. The input factor was then estimated using the input-oriented model with constant returns-to-scale. This replaces Pearson’s correlation test in affirming the data and ensures the rational affinity index is to be determined. As previously mentioned, the radial and non-radial methods have been implemented via epsilon throughout the years of 2016–2019 with positive results under 0.452, therefore they are significant. The epsilon for the EBM model in 2016, 2017, 2018, and 2019 are listed respectively.
Table 6.
The diversity and affinity matrixes of input factors during 2016–2019.
- Epsilon for EBM of 2016 = 0.460
- Epsilon for EBM of 2017 = 0.469
- Epsilon for EBM of 2018 = 0.460
- Epsilon for EBM of 2019 = 0.452
5.2. Efficiency Score Calculation of DEA Models
In this paper, four DEA models (CCR, BCC, SBM, EBM) were used to analyze and calculate the efficiency scores for the 21 major airports. We may assume that inputs have a greater impact than outputs because both of these are heavily impacted by worldwide macroeconomic indicators and airline planning arrangements that are beyond their control [36]. Likewise, airport management tries to implement various approaches to cater to the various airline aircraft’s takeoffs and landings.
The efficiency scores of the CCR, BCC, SBM, EBM models are shown in Table 7. The results reveal that during the research period, the BCC efficiency scores of the international airport mostly achieved strong efficiency. It is apparent results of efficiency scores that Munich International Airport (MUC) and London Heathrow Airport (LHR) achieved a strong efficiency during both years and the four models used.
Table 7.
The efficiency score of DEA models during 2016–2019.
Most of the runway configurations of each airport in this study are designed to have a parallel runway. Having a parallel runway catering to the flights coming in and out is the most efficient configuration. Although airports such as Amsterdam Airport Schiphol (AMS) and Zurich Airport (ZRH) possess intersecting runways it was found that it can increase flight efficiency. However, it is linked to intersecting runways that can cause serious inherent risk with simultaneous operation [37]. In contrast to other airports, they designed their airport runway to parallel runway for the reason that it increases aerodrome flexibility and runway capacity with concurrent operations [38].
As can be seen from the CCR, BCC, and SBM models, DMU’s ATL, DBX, MUC, and LHR shows excellent managing operational efficiency. The commonality that they possess is the parallel runway configuration. Meanwhile, for the lowest operational efficiency Amsterdam Airport Schiphol (AMS) and Dallas/Fort Worth International Airport (DFW) with the four models used were the two airports found with the lowest efficiency score. The differences they have from the other airports are that AMS consists of six runways with a mix of a configuration of intersecting and single runway while DFW consists of seven runways with also a mix configuration of parallel and a single runway. Although DFW scored with an average of 0.361 of the four models and has the configuration of the parallel runway, as mentioned before this configuration has been found more efficient than an intersecting runway. In the comparison of AMS and DFW with LHR and MUC, despite being the most efficient in this study they have only two runways with parallel runway configurations in which they can operate simultaneously. One of the downsides of having the intersecting runway is dealing with the wind because it has a great impact on the direction of the wind.
For example, DMU AMS (Amsterdam Airport Schiphol) is located near the sea so the strongest wind comes from the North Sea which means the strong wind may come from the western/southwestern direction, so only one runway can be used for takeoffs and one for landings and having one runway could lessen the operation, causing long delays for the aircraft to land or takeoff, especially during peak hours. To improve the operation an additional runway from the northeast to the northwest has been created, because crosswinds that surpass the safety point on runways cannot be used for takeoff and landing. DMU ZRH (Zurich International Airport) also shares the same case, but they only have three runways which is a combination of two runways that are intersecting and one single runway with an average result of 0.432 efficiency score. The most intriguing correlation is with San Francisco International Airport (SFO) possessing two pairs of parallel runways but intersecting each other and it is located near the sea. SFO airport utilizes the runway configuration efficiently as one pair of the parallel runway is used for landings/arrival of the aircraft, while the other pair is primarily for departure/take-off of the aircraft. This way the aircraft can land side by side with sufficient space as well as for take-off. SFO scored with an average of 0.443 on four models. Aside from airports from each continent, it is evident that most of the airports in Asia show an increase in operational efficiency each year.
Interestingly, there were also differences in the coefficient scores—regarding the CCR, BCC, and SBM that DMU ATL (Hartsfield Jackson Atlanta International Airport) and DBX (Dubai International Airport), for the three models they were efficient but when it comes to the EBM model it shows the result for ATL slightly increased both years while DBX decreased from 0.919 to 0.890 in 2018–2019.
If we now turn to Figure 3, Figure 4, Figure 5 and Figure 6 we see differences between the different DEA models. As shown in Figure 3 (CCR model) and 5 (SBM model), Hartsfield Jackson Atlanta International Airport (ATL), Dubai International Airport (DBX), Munich International Airport (MUC), and London Heathrow Airport (LHR) achieved strong efficiency but the least efficient airports were Dallas/Fort Worth International Airport (DFW) and Zurich Airport (ZRH), unlike in SBM where the least efficient airports were Amsterdam Airport Schiphol (AMS) and Dallas/Fort Worth International Airport (DFW). Moreover, some airports in the study period show an increase of efficiencies such as Suvarnabhumi International Airport (BKK), Singapore Changi Airport (SIN), Incheon International Airport (ICN), Narita International Airport (NRT), and Kansai International Airport (KIX).
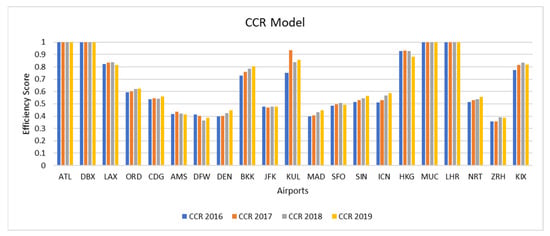
Figure 3.
Efficiency score of the CCR model.
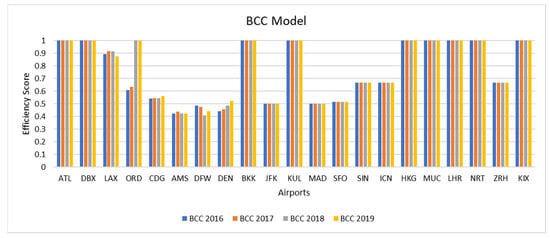
Figure 4.
Efficiency score of the BCC model.
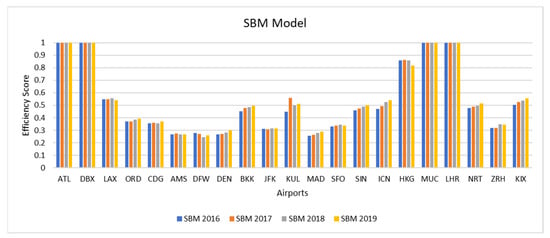
Figure 5.
Efficiency score of the SBM model.
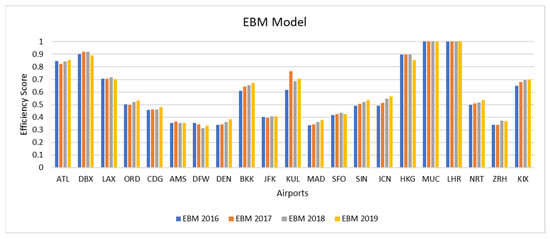
Figure 6.
Efficiency score of the EBM model.
As mentioned before, the SBM model is an adjusted CCR model so we can see the similarity of the result of both models. On the other hand, the BBC model is known for determining the pure technical efficiency of DMUs—in Figure 4 airports Hartsfield Jackson Atlanta International Airport (ATL), Dubai International Airport (DBX), Suvarnabhumi International Airport (BKK), KL International Airport (KUL), Hong Kong International Airport (HKG), Munich International Airport (MUC), London Heathrow Airport (LHR), Narita International Airport (NRT), and Kansai International Airport (KIX) achieved the strongest efficiency, and O’Hare International Airport (ORD) achieved the strongest efficiency during 2018 and 2019 only, while the least efficient airports were Amsterdam Airport Schiphol (AMS) and Dallas/Fort Worth International Airport (DFW).
Lastly, in Figure 6 the Epsilon Based Measure model considers the slacks and the weight of the input, where only airports Munich International Airport (MUC) and London Heathrow Airport (LHR) achieved the strong efficiency. The results showed that airports Suvarnabhumi International Airport (BKK), Aeropuerto de Adolfo Suárez Madrid-Barajas (MAD), Singapore Changi Airport (SIN), Incheon International Airport (ICN), Narita International Airport (NRT), and Kansai International Airport (KIX) continuously improved their efficiency every year. Overall, these results indicate that London Heathrow Airport (LHR) and Munich International Airport (MUC) can be benchmarked airports in terms of the runway configuration, the number of runways, and ability to withstand the volume of air traffic.
Together these results provide important insights into the differences between airports with single, parallel, and intersecting runway configurations. For most airports in this study parallel runway is the common configuration and it also shows that the airport operations are efficient. Meanwhile, for the airports with an intersecting runway, there are downsides in regards to operation—the weather condition is one of the factors that can cause poor visibility, strong winds, or crosswinds that affect the operation of the runway and can cause delays. Sometimes only one runway can also be used, which will lead to a decrease of operation efficiency—however this also serves as a safety measure for aircraft landing and takeoff.
6. Discussions
Overall, these results indicate that using different DEA models showed shortcomings of each model. Every model considers different weights to measure the efficiency of each DMU, as mentioned above the CCR model measures total effectiveness while the BBC model determines the technical effectiveness. On the other hand, the SBM model considers the slacks that CCR and BCC do not take into consideration in determining the data. The EBM model takes into consideration the input and output data with corresponding relevance in computing the technical efficiency. Moreover, the study reveals that applying various DEA models provides a varying impact assessment of the efficiency. Utilizing the different DEA models, there was a difference that each model has its impact in assessing the efficiency. Figure 7 illustrates the average efficiency of all major international airports from 2016 to 2019 using DEA models.
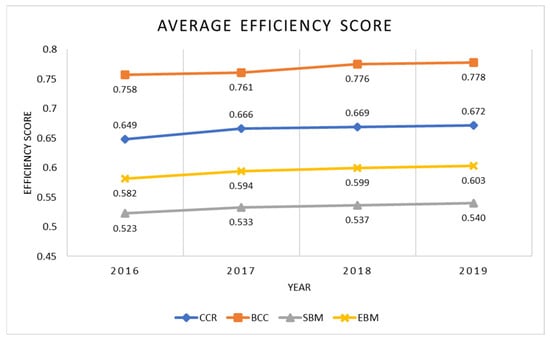
Figure 7.
Comparative chart of methods.
In 2017, ICAO air transport statistics recorded the highest increase of annual passengers by 7.1. As shown in Figure 8, in comparison with the three continents. Asia has the higher efficiency score in the four DEA models. In the CCR Model, Asia appears with the highest average efficiency with 0.746, then North America with 0.603, and Europe with 0.627. It also can be compared in the BCC model, where Asia showed a higher efficiency score of 0.917 greater than the two continents. We can conclude that Asian international airports with parallel runway configurations display a greater efficiency compared to the size of the airports, different runway configurations, and the number of runways in North America and Europe. The findings also indicate the general overview of the aviation industry from a worldwide perspective based on the performance, existence of the airport hub, location of the airport, and the design of the 21 major airports.
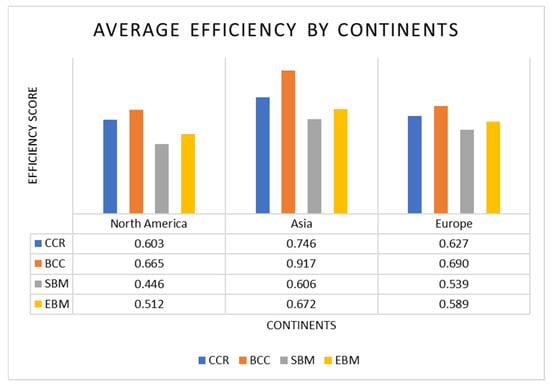
Figure 8.
The average efficiency by group of continents.
The average efficiency score of DEA models is presented in Table 8. The International Civil Aviation Organization (ICAO) annually released their report of air transport statistics which contains the world’s major airport traffic ranking of the top 25 airports by total passengers. The ranking is based on millions of passengers going through each airport. It shows that DMU ATL (Hartsfield Jackson Atlanta International Airport) ranks 1st with the highest total passengers embarked and disembarked and also ranked 2nd in aircraft movements in ICAO air transport statistics from 2016 to 2019. That corresponds also to ATL airport as one of the most efficient airports in 4th place in this study.
Table 8.
The average efficiency score of DEA models.
For the most efficient airports in this study, LHR (London Heathrow Airport) airport ranked 7th while MUC (Munich International Airport) airport ranked 16th in the top 25 airports in ICAO statistics [39]. Although both airports did not reach the highest-ranked in ICAO statistics they still managed to maintain and continue to improve their services to be efficient airports, which can be seen from the DEA results in being consistent in having strong efficiency. Even though Singapore Changi Airport was voted for the Skytrax World’s Best Airport 2019 by international air travelers for the seventh consecutive year [4], ICAO ranked SIN (Singapore Changi Airport) airport 18th place and for the efficiency score with an average of four DEA models of 0.550, ranked 13th place in this study.
Unexpectedly, the airports DFW (Dallas/Fort Worth International Airport) and AMS (Amsterdam Airport Schiphol) were ranked 10th and 12th place in the ICAO annual report but conversely, they were the least efficient airports in this study. While observing the efficiency score of both airports there were slight increases and decreases in their efficiency score. Meanwhile, SFO (San Francisco International Airport) airport has a similar intersecting runway configuration with AMS in comparison and four DEA models scored and ranked higher than AMS and DFW. Besides, LAX had an average score of 0.745 and ranked 8th, and ICAO ranked SFO 23rd out of 25 for traffic at the world’s major airports in 2019.
For DMU HKG (Hong Kong International Airport), the comparison of the four model’s results, reveals that the BCC model is an indicator of efficient airports. During 2016–2018 it shows slight increments and reduction in their score then in 2019 there was a significant drop in their efficiency score. As HKG is ranked 13th with the ICAO annual statistics and 5th in Skytrax in 2019 it corresponds as well with the result of the efficiency where it ranked 5th with the mean average of 0.913 among other airports in this study but also shows strong operational efficiency compared to other airports. As mentioned before, in comparison of each airport in this study, for most of the airports with a parallel runway design in the continent of Asia surprisingly the efficiency score is higher than 0.480, which also correlates with Asian airports having the highest percentage of world traffic by an average of 34.87% while Europe has only 25.23% and North America has only 23.63% based on ICAO air transport statistics [39].
7. Conclusions
7.1. Concluding Remarks
This study aims to determine the operational efficiency of airports with the runway configuration of parallel and intersecting. In the aviation industry, ensuring efficiency is a very important factor in evaluating the operational efficiency of each airport runway design. Each airport is designed suitable to one’s country and location. The study used various DEA models where each has different weights in assessing efficiency. The CCR, BCC, SBM, and EBM models were applied in this study. With these methods, there were two airports with strong efficient scores which were MUC (Munich International Airport) and LHR (London-Heathrow Airport) which exhibit strong efficiency in all four DEA models and achieved the score of 1, which is the highest score among other DMUs that are based in Europe. These two airports are designed with parallel runway configuration similar to most airports, which increases the aerodrome flexibility and runway capacity with concurrent operations.
With these results as well, they also showed that Amsterdam Airport Schiphol (AMS) and Dallas/Fort Worth International Airport (DFW) scored lowest with an average under 0.370. Due to the location and the runway configuration of AMS, it is recommended to have an additional runway to increase capacity, mitigate the delays during the peak hours, and improve the direction of the runway. Moreover, the Air Traffic Control System should be improved to lessen the air traffic. In addition, from 2018 to 2019 at the airport DFW, it attains 8.6% in annual passengers and 7.9% in-flight movement despite scoring the average lowest efficiency score of 0.361. On the other hand, airport AMS during the period 2016 to 2017 attains the highest 7.7% in annual passengers and 3.6% in-flight movement but during the years of 2018 to 2019, it reaches the lowest increase of annual passengers by 0.9% and −0.4% in annual flights that affected the efficiency which resulted with 0.361. Further, airports that have intersecting runway configuration were found to have increased flight efficiency but this may cause major risks in simultaneous operations. The airports with the lowest efficiency scores were AMS (Amsterdam Airport Schiphol) with intersecting runway configuration and DFW (Dallas/Fort Worth International Airport) with a mix of parallel and single runway configurations. Although SFO (San Francisco International Airport) possesses a mixed configuration of parallel and intersecting runway configuration, it maximizes the runway by utilizing one pair for landing and the other pair for takeoff [5,40].
Finally, the study is based on DEA models that allow multiple inputs and outputs when calculating relative efficiencies. The results also show that most of the airports in Asia are above average in the efficiency of 0.500 than North America. The period of the study also reveals that 2017 has the highest annual increase of passengers by 7.1% but unfortunately 2019 has the lowest increase of 3.6% based on ICAO air transport statistics [41].
The study contributes to research by providing initial findings on airport service operations and identifies the attributes that may reveal the differences in airport operational efficiency. The results indicate that airports with similar characteristics must be evaluated and benchmarked for performance by operation managers. This study is useful in determining how well airports are maintained and how they can improve their operational efficiencies. Operational performance can be also determined by the existence of the hub airport and the location of the airport. It demonstrates that the number of passengers has a greater impact on operational success than the yearly number of flights. The primary goal for inefficient airports should be to improve the quality of service. Furthermore, these airports should implement best practices that have been proven to work in the operation of high-efficiency airports. This paper also makes an analytical contribution by using a wide range of DEA methods to provide additional data for industry analysis. To conclude, the main contributions of this paper can be summarized (1) This study aims to present an overview comparative analysis for measuring the runway utilization of airports using the CCR, BCC, SBM, EBM models. (2) A case study of the top 21 major international airports is used to illustrate the applicability of the proposed models. (3) The findings also indicate the general overview of the aviation industry from a worldwide perspective. (4) The current study provides holistic insights for operation managers in evaluating and benchmarking the airport’s performance with different runway configurations.
7.2. Limitations and Future Studies
However, the current study has some limitations. First, the existence of the outliers has a significant impact on the DEA approach which can be resolved for future studies by evaluating using the DEA Super-SBM, which would consider the undesirable outputs to assess and rank the DMUs effectively [42]. Secondly, DEA is widely known for evaluating the efficiency of airports, in some previous cases, the bootstrapping approach is also used to take into account the measurement errors in estimates. By repeatedly sampling the original data, bootstrapping allows sensitivity assessments on efficiency scores and scaling indicators to be done [43]. Thirdly, for the data, we only calculated the general data based on the ICAO airport transport statistics in which the data only specified the ranking on number of many passengers (embarked and disembarked) and airplane movements (takeoff and landing). Therefore, for future studies, the DMUs should be separated by continents to enhance the accuracy of the results.
Further research in this field would be of great help in improving the operational efficiency toward sustainability development. Decision-makers, investors, stakeholders, politicians, and governments or private organizations all over the world may find this to be a valuable tool. Researchers should assess more input and output elements such as the number of employees, operational income, operational expenditures, air freight movements, distance from the city center, transport to the airport, terminal capacity, cargo, or environmental factors (i.e., climate) in future studies to provide more precise and better findings. According to the study of Inamete [1], several elements can also affect operations including privatization causing changes in the public ownership system; contracting out various functions of airports to private companies; combining government and private control of airports; increasing the autonomy of airports that are operated by the government; establishing government holding companies; commercializing airport organizations’ operations, and having two or more public airport agencies which creates competitive dynamics. Moreover, the possibility of using other methods in assessing operational efficiencies such as MCDM models in assessing efficiency may also be considered.
Author Contributions
Conceptualization, K.N.C.I.; Data curation, K.N.C.I.; Formal analysis, K.N.C.I.; Funding acquisition, C.-C.H.; Investigation, T.-T.D.; Methodology, K.N.C.I.; Project administration, C.-C.H.; Software, K.N.C.I.; Validation, C.-N.W.; Writing-original draft, K.N.C.I.; Writing-review and editing, T.-T.D. and C.-N.W. All authors have read and agreed to the published version of the manuscript.
Funding
This research received no external funding.
Institutional Review Board Statement
Not applicable.
Informed Consent Statement
Not applicable.
Data Availability Statement
Not applicable.
Acknowledgments
The authors appreciate the support from the National Kaohsiung University of Science and Technology, Taiwan.
Conflicts of Interest
The authors declare no conflict of interest.
References
- Inamete, U.B. Key Elements in Managing Airports: The Policy Environment and Increasing Efficiency. Int. J. Public Sect. Manag. 1993, 6. [Google Scholar] [CrossRef]
- Oum, T.H.; Yu, C.; Fu, X. A Comparative Analysis of Productivity Performance of the World’s Major Airports: Summary Report of the ATRS Global Airport Benchmarking Research Report—2002. J. Air Transp. Manag. 2003, 9, 285–297. [Google Scholar] [CrossRef]
- The History of ICAO and the Chicago Convention. Available online: https://www.icao.int/about-icao/History/Pages/default.aspx (accessed on 18 January 2022).
- Skytrax Ratings. Available online: https://skytraxratings.com/about (accessed on 10 March 2021).
- Bertsimas, D.; Frankovich, M.; Odoni, A. Optimal Selection of Airport Runway Configurations. Oper. Res. 2011, 59, 1407–1419. [Google Scholar] [CrossRef]
- Ramanujam, V.; Balakrishnan, H. Estimation of Maximum-Likelihood Discrete-Choice Models of the Runway Configuration Selection Process. In Proceedings of the 2011 American Control Conference, San Francisco, CA, USA, 29 June–1 July 2011; pp. 2160–2167. [Google Scholar]
- Li, X.; Wei, D.; Li, D.; Chen, X. Utilization Pattern of Closely Spaced Parallel Runways and Simulation of Operational Efficiency. In Proceedings of the 2015 IEEE International Conference on Progress in Informatics and Computing (PIC), Nanjing, China, 18–20 December 2015; pp. 158–162. [Google Scholar]
- Henry, M.; Schmitz, S.; Revenko, N.; Kelbaugh, K. A Monte Carlo Simulation for Evaluating Airborne Collision Risk in Intersecting Runways. In Proceedings of the AIAA Modeling and Simulation Technologies (MST) Conference, American Institute of Aeronautics and Astronautics, Reston, VA, USA, 19 August 2013. [Google Scholar]
- Schaar, D.; Herry, L. Comparison of Data Envelopment Analysis Methods Used in Airport Benchmarking. In Proceedings of the 3rd International Conference on Research in Air Transportation, ICRAT, Fairfax, VA, USA, 1–4 June 2008. [Google Scholar]
- Baltazar, M.E.; Jardim, J.; Alves, P.; Silva, J. Air Transport Performance and Efficiency: MCDA vs. DEA Approaches. Procedia Soc. Behav. Sci. 2014, 111, 790–799. [Google Scholar] [CrossRef] [Green Version]
- Charnes, A.; Cooper, W.W.; Rhodes, E. Measuring the Efficiency of Decision Making Units. Eur. J. Oper. Res. 1978, 2, 429–444. [Google Scholar] [CrossRef]
- Banker, R.D.; Charnes, A.; Cooper, W.W. Some Models for Estimating Technical and Scale Inefficiencies in Data Envelopment Analysis. Manag. Sci. 1984, 30, 1078–1092. [Google Scholar] [CrossRef] [Green Version]
- Tone, K. A Slacks-Based Measure of Efficiency in Data Envelopment Analysis. Eur. J. Oper. Res. 2001, 130, 498–509. [Google Scholar] [CrossRef] [Green Version]
- Tone, K.; Tsutsui, M. An Epsilon-Based Measure of Efficiency in DEA-A Third Pole of Technical Efficiency. Eur. J. Oper. Res. 2010, 207, 1554–1563. [Google Scholar] [CrossRef]
- Wang, C.-N.; Nguyen, N.-A.-T.; Fu, H.-P.; Hsu, H.-P.; Dang, T.-T. Efficiency Assessment of Seaport Terminal Operators Using DEA Malmquist and Epsilon-Based Measure Models. Axioms 2021, 10, 48. [Google Scholar] [CrossRef]
- Wang, C.-N.; Hoang, Q.-N.; Nguyen, T.-K.-L. Integrating the EBM Model and LTS(A, A, A) Model to Evaluate the Efficiency in the Supply Chain of Packaging Industry in Vietnam. Axioms 2021, 10, 33. [Google Scholar] [CrossRef]
- Lin, J.-R.; Chen, C.-Y.; Peng, T.-K. Study of the Relevance of the Quality of Care, Operating Efficiency and Inefficient Quality Competition of Senior Care Facilities. Int. J. Environ. Res. Public Health 2017, 14, 1047. [Google Scholar] [CrossRef] [PubMed] [Green Version]
- Ulas, E.; Keskin, B. Performance Evaluation and Ranking of Turkish Banking Sector. Procedia Econ. Financ. 2015, 25, 297–307. [Google Scholar] [CrossRef] [Green Version]
- Wang, C.-N.; Tibo, H.; Nguyen, H.A. Malmquist Productivity Analysis of Top Global Automobile Manufacturers. Mathematics 2020, 8, 580. [Google Scholar] [CrossRef] [Green Version]
- Keskin, B.; Köksal, C.D. A Hybrid AHP/DEA-AR Model for Measuring and Comparing the Efficiency of Airports. Int. J. Product. Perform. Manag. 2019, 68, 524–541. [Google Scholar] [CrossRef]
- Sarkis, J. An Analysis of the Operational Efficiency of Major Airports in the United States. J. Oper. Manag. 2000, 18, 335–351. [Google Scholar] [CrossRef]
- Martín, J.C.; Román, C. An Application of DEA to Measure the Efficiency of Spanish Airports Prior to Privatization. J. Air Transp. Manag. 2001, 7, 149–157. [Google Scholar] [CrossRef]
- Stichhauerova, E.; Pelloneova, N. An Efficiency Assessment of Selected German Airports Using the DEA Model. J. Compet. 2019, 11, 135–151. [Google Scholar] [CrossRef] [Green Version]
- Song, M.; Jia, G.; Zhang, P. An Evaluation of Air Transport Sector Operational Efficiency in China Based on a Three-Stage DEA Analysis. Sustainability 2020, 12, 4220. [Google Scholar] [CrossRef]
- Örkcü, H.H.; Balikçi, C.; Dogan, M.I.; Genç, A. An Evaluation of the Operational Efficiency of Turkish Airports Using Data Envelopment Analysis and the Malmquist Productivity Index: 2009–2014 Case. Transp. Policy 2016, 48, 92–104. [Google Scholar] [CrossRef]
- Nwaogbe, O.R.; Ogwude, I.C.; Ibe, C.C. Efficiency Analysis of the Nigeria Airports: An Application of DEA-BCC Model. Int. Sci. J. Air Transp. Ind. AERO-J. 2017, 2, 28–39. [Google Scholar]
- Tsui, W.H.K.; Gilbey, A.; Balli, H.O. Estimating Airport Efficiency of New Zealand Airports. J. Air Transp. Manag. 2014, 35, 78–86. [Google Scholar] [CrossRef]
- Kan Tsui, W.H.; Balli, H.O.; Gilbey, A.; Gow, H. Operational Efficiency of Asia-Pacific Airports. J. Air Transp. Manag. 2014, 40, 16–24. [Google Scholar] [CrossRef] [PubMed]
- Carlos, P.B.; Dieke, P.U.C. Performance Evaluation of Italian Airports: A Data Envelopment Analysis. J. Air Transp. Manag. 2007, 13, 184–191. [Google Scholar] [CrossRef]
- Pacagnella, A.C.; Hollaender, P.S.; Mazzanati, G.V.; Bortolotto, W.W. Efficiency Drivers of International Airports: A Worldwide Benchmarking Study. J. Air Transp. Manag. 2021, 90, 101960. [Google Scholar] [CrossRef]
- Huynh, T.M.; Kim, G.; Ha, H.K. Comparative Analysis of Efficiency for Major Southeast Asia Airports: A Two-Stage Approach. J. Air Transport Manag. 2020, 89, 101898. [Google Scholar] [CrossRef]
- Varabyova, Y.; Schreyögg, J. International Comparisons of the Technical Efficiency of the Hospital Sector: Panel Data Analysis of OECD Countries Using Parametric and Non-Parametric Approaches. Health Policy 2013, 112, 70–79. [Google Scholar] [CrossRef] [Green Version]
- Cooper, W.W.; Seiford, L.M.; Tone, K. Comprehensive Text with Models, Applications, References and DEA-Solver Software. In A Data Envelopment Analysis; Kluwer Academic Publishers: Boston, MA, USA, 2000; ISBN 978-0-387-45283-8. [Google Scholar]
- Wu, P.; Wang, Y.; Chiu, Y.H.; Li, Y.; Lin, T.Y. Production efficiency and geographical location of Chinese coal enterprises-undesirable EBM DEA. Resour. Policy 2019, 64, 101527. [Google Scholar] [CrossRef]
- International Civil Aviation Organization. Available online: https://www.icao.int/publications/pages/annual-reports.aspx (accessed on 10 March 2021).
- Merkert, R.; Odeck, J.; Brathen, S.; Pagliari, R. A Review of Different Benchmarking Methods in the Context of Regional Airports. Transp. Rev. 2012, 32, 379–395. [Google Scholar] [CrossRef]
- Intersecting Runway Operations. FAA JO7110.65 Air Traffic Control. Available online: https://skybrary.aero/articles/intersecting-runways-operations (accessed on 20 January 2022).
- FAA Order JO 7110.65y-Air Traffic Control. Available online: https://www.faa.gov/air_traffic/publications/atpubs/atc_html/ (accessed on 20 January 2022).
- International Civil Aviation Organization. Presentation of 2019 Air Transport Statistical Result. Available online: https://www.icao.int/annual-report-2019/Pages/the-world-of-air-transport-in-2019-statistical-results.aspx (accessed on 20 January 2022).
- Janic, M. Modelling the Capacity of Closely-Spaced Parallel Runways Using Innovative Approach Procedures. Transp. Res. Part C Emerg. Technol. 2008, 16, 704–730. [Google Scholar] [CrossRef]
- Bazargan, M.; Vasigh, B. Size versus Efficiency: A Case Study of US Commercial Airports. J. Air Transp. Manag. 2003, 9, 187–193. [Google Scholar] [CrossRef]
- Tian, N.; Tang, S.; Che, A.; Wu, P. Measuring Regional Transport Sustainability Using Super-Efficiency SBM-DEA with Weighting Preference. J. Clean. Prod. 2020, 242, 118474. [Google Scholar] [CrossRef]
- Chaabouni, S. China’s Regional Tourism Efficiency: A Two-Stage Double Bootstrap Data Envelopment Analysis. J. Destin. Mark. Manag. 2019, 11, 183–191. [Google Scholar] [CrossRef]
Publisher’s Note: MDPI stays neutral with regard to jurisdictional claims in published maps and institutional affiliations. |
© 2022 by the authors. Licensee MDPI, Basel, Switzerland. This article is an open access article distributed under the terms and conditions of the Creative Commons Attribution (CC BY) license (https://creativecommons.org/licenses/by/4.0/).