Abstract
As the global economy develops and the complexity of supply chains increases, the effective mitigation of sustainable supply chain risks in electronics manufacturing has become important. While quality function deployment (QFD) has been successfully applied to many fields of multicriteria decision-making (MCDM), there is a lack of research on constructing a house-of-quality model that can be combined with MCDM for connecting supply chain agility with sustainable supply chain risks, especially in the field of electronics manufacturing. The objective of this study was to develop an integrated framework of QFD and MCDM and to devise an effective method to mitigate sustainable supply chain risks by improving supply chain agility. Such a method can help the multinational electronics manufacturing industry to develop stable and sustainable supply chains. In a multinational electronic manufacturing enterprise as an example, the results showed that the case enterprise work should focus on improving agility ‘production and sales capability’, ‘quick decision-making/strategic flexibility’, ‘electronic shiapment of finished products to control shipment operations’, ‘supplier on-time delivery rates’ and ‘cost minimization’. Improving agility would help enhance the ‘credibility and competence of operators and leaders’ and ‘product safety and quality’ and reduce ‘goods disruption or delay due to inadequate supply mobility and poor financial performance’, ‘information system instability’, the ‘long product lead time’ and other key sustainable supply chain risks. The proposed framework can not only be effectively used by other electronics manufacturers to develop agile strategies to mitigate sustainable supply chain risks, but also provides a reference for risk management for manufacturers in other fields.
1. Introduction
With increasingly fierce market competition and increasingly stringent environmental regulations, electronic enterprises need to effectively integrate environmental protection and social responsibility into their daily operations and supply chain operation management. Meanwhile, the importance of sustainable development of high-tech enterprises is particularly prominent [1]. Establishing an efficient and effective electronics manufacturing supply chain is important for both emerging and developed economies [2]. In the recent past, electronic manufacturing supply chains (EMSCs) have been challenged by many factors, including price fluctuations, climate change, information security and customer needs [3]. In particular, with the development of globalization, supply chain systems have become longer and more complex. Vulnerabilities and related supply chain risks increase with the complexity of the supply network [4], resulting in enterprises facing higher levels of risk [5].
As strategic and transparent systems for coordinating key business processes to achieve social, environmental and economic goals [6], sustainable supply chain systems help individual companies and their supply chains improve their long-term economic performance [7]. Therefore, scholars and business managers combine the concept of sustainable supply chain with supply chain risk management [8,9], arguing that sustainable practices can help reduce supply chain risks by continually focussing on mitigating sustainable supply chain risks (SSCRs) [9,10,11,12].
Recent studies have found that different resilience capabilities can improve supply chain resilience and reduce supply chain risk [13,14,15]. Resilience mainly includes agility, visibility, flexibility, collaboration, and information sharing. These studies mainly focus on the relationship between supply chain elasticity and supply chain risk, so some scholars regard a flexibility strategy as a valuable method when addressing risks [16]. Meanwhile, scholars regard improving supply chain agility (SCA) as a powerful and effective method that overcomes SSCRs [17,18,19,20,21]. However, as an important part of resilience, the empirical research on reducing the supply chain risk of agility is not extensive. The enhancement of agility is a risk management measure that can enable companies to respond quickly to market changes and disruptions in the supply chain [17]. SCA can help enterprises increase their performance and competitive advantage [22], improve supply chain elasticity and reduce supply chain risks. In the manufacturing sector [17,23,24], risk management and SCA have a direct impact, which plays an important role in determining an enterprise’s performance. Therefore, the relationship between SSCRs and SCA is an important topic in both academia and industry [25,26,27].
While there are many studies on risks and agility, studies on supply chain risks and agility are few [25,28], and in-depth studies on the interdependence of SSCRs and SCA and on the internal dependence of SSCRs are almost absent [27,29]. In particular, in the field of electronics manufacturing supply chain, there are no studies on SSCRs and SCA, and studies using quality function deployment (QFD) are scarce. Accordingly, this study used QFD to improve SCA to mitigate SSCRs, and to analyse the mutual relationship and internal dependence between them. QFD was first used to support incremental, disruptive, and radical product innovations [30]. In recent years, it has been successfully applied in many fields to solve multicriteria decision-making (MCDM) problems, such as management system selection [31], supplier selection [32], determination priority of technical attributes [33], product quality design [34] and green supply chain management standard selection [35]. However, at present, research on EMSC which integrates QFD and MCDM methods to build a house of quality (HoQ) model to connect SSCR and SCA is not sufficient. Therefore, we herein discuss the following issues.
- What are the key SSCRs and agility criterion for the EMSC?
- How can the QFD-MCDM framework be used to construct a HoQ model to relate SSCRs and agility criteria and how can the model be applied to the multinational electronics manufacturing industry.
- How does the relationship between SSCRs and agility criteria affect the search for feasible agile solutions to mitigate SSCRs in the EMSC?
- For multinational electronics manufacturers, what are the most important SSCRs that should be mitigated, and which agility criteria should be applied to mitigate the most critical SSCRs in order to achieve a sustainable EMSC?
This study developed a QFD-MCDM framework to evaluate SSCRs and agility criteria in an EMSC to investigate effective agility decisions. The framework was used to identify and select a key rule of SSCRs and agility criteria, investigate the interdependence of SSCRs and the relationship between SSCRs and agility criteria, and, finally, determine the priority of SSCRs and agility criteria in the EMSC. Furthermore, a multinational electronic assembly manufacturing enterprise run by the United States in China was considered for a case study and the QFD-MCDM framework was used to provide useful agile decisions for the managers of the enterprise to mitigate SSCRs.
The contribution of this study involves four aspects: (1) So far, several qualitative and quantitative studies on SSCR have been carried out. However, empirical research on mitigating SSCRs from the perspective of improving SCA is not sufficient. Therefore, based on QFD, this study constructs a high-quality model of the relationship between SCA and SSCR. (2) Although some researchers have conceptually discussed the potential application of agility in risk control, the research linking SCA to SSCR in a decision framework based on survey data is not complete. We then combined QFD with MCDM to identify the most important criteria for SSCRs and agility. (3) This study uses a multinational enterprise as an example and employs the QFD-MCDM assessment framework to provide the case company with an agile solution that mitigates SSCRs. This framework can also be applied to other manufacturing enterprises. (4) This study enriches the theoretical research on SCA and SSCR, and it provides an empirical reference for the agility of supply chain risk management.
The rest of the paper is organized as follows: Section 2 identifies SSCRs and agility criteria from a literature review and outlines research gaps and highlights. Section 3 describes the QFD-MCDM integrated framework and its corresponding algorithm. Section 4 illustrates the empirical analysis and discussion with multinational electronic enterprises as an example. Finally, Section 5 summarizes the main contributions of this study and provides suggestions for future research.
2. Literature Review
For an organization and its supply chain to rapidly respond to unforeseen changes in the business in the face of competition and uncertainties pertaining to the environment, it is important to improve the agility of the supply chain. Furthermore, improved SCA can help decision makers identify SSCRs and formulate strategies for the sustainable growth of the organization [25]. A literature survey showed that few studies have investigated the relationship between SCA and SSCRs. Therefore, the focus of this study was to improve SCA to reduce SSCRs and thereby enhance the sustainability of EMSCs.
2.1. Sustainable Supply Chain Risk
A supply chain is a network comprising organizations, people, activities, technologies and information associated with the conversion of raw materials into finished products and the delivers of the products to consumers [36]. In supply chain management, network configuration is crucial for enterprises to pursue competitive advantages and meet market demands. The flexibility and agility of a supply chain can be improved by designing and optimizing its network [37]. Particularly for manufacturing systems, a common and accepted method of achieving agility is to manufacture products in geographically distinct locations that are connected by communication networks [38]. Dotoli et al. (2006) proposed different structures using directed graph knowledge and solution methods for objective optimization problems, and the resulting network set demonstrated improvements in terms of flexibility and agility [39].
Sustainability improves the efficient use of system resources, sustainable supply chain management is becoming a key strategy for enterprises [40]. By implementing sustainable operations, enterprises can pursue higher sustainable financial, social and environmental performance [41]. Ehtesham Rasi and Sohanian (2021) combined sustainable supplier selection with the optimization of sustainability performance indicators in the design of supply chain networks to design and optimize economic and environmental dimensions in sustainable supply chain networks [42]. Chowdhury and Quaddus (2020) proposed a theoretical proof and empirical verification of the direct and indirect conditional effect of supply chain sustainability on performance, and believed that the conditional indirect effect of supply chain sustainability on market performance through sustainable risk was significant [43]. In the supply chain, management of risks, such as credit risk [44,45,46], environmental risk [47,48,49], social risk [50] and energy risk [51,52], has always been of key importance. SSCR management can help to maintain or enhance the sustainability of a supply chain, thereby contributing to the success and improvement of supply chain management. For example, Rostamzadeh et al. (2018) viewed supply chain sustainability as a risk management process and argued that a coordinated response to sustainability and supply chain risks would be appropriate [53]. Gouda and Saranga (2018) observed that sustainability helps reduce supply chain risks, especially in the environment of emerging markets [8]. Boiral et al. (2020) used grounded theory to conduct semi-structured interviews and qualitative analysis of practitioners participating in the activity, and investigated the rigor and reliability of sustainability rating agencies’ assessment of corporate sustainability risk [54]. Hallikas et al. (2020) believe that sustainable procurement practices can improve the procurement performance of enterprises, and are of great significance for reputation improvement and business risk management [55]. Abdel-Basset and Mohamed (2020) stated that risk management should focus on identifying and analysing the impact of losses on enterprises, society and the environment and formulating strategies to maintain the sustainability of supply chains [11]. Victor et al. (2021) outline possible systemic risks in sectors with high impact potential for sustainable development such as agriculture, forestry and Marine resource extraction, and discuss the limitations of current governance mechanisms in addressing ai sustainability risks in these areas [56]. Moktadir et al. (2021) identified and analysed the key risk factors that should be considered to successfully implement sustainable supply chain management practices for achieving a sustainable supply chain [12]. Therefore, in order to realize sustainable supply chain, this study focuses on the risk of sustainable supply chain.
In order to achieve the sustainability supply chain and better understand the concept of SSCR management, this paper explains the risk classification of different scholars. Sakli et al. (2014) proposed five categories: chain internal risk (process risk and control risk), chain internal to external risk (demand risk and supply risk), and chain external risk (environmental risk) [57]. In an evaluation system for supplier selection, Rao et al. (2016) divided supply chain risks into seven categories: technical risk, information risk, management risk, economic risk, environmental risk, social risk and moral risk [58]. In an evaluation of suppliers, Mavi et al. (2016) considered the risk categories supply risk, demand risk, manufacturing risk, logistics risk, information risk and environmental risk [59]. From the perspective of SCA, Ganguly et al. (2017) divided risks into seven categories and defined organizational risk, intellectual property and regulatory risk, technical risk, supplier risk, information risk, quality risk, transportation risk and environmental risk [25]. Liu et al. (2018) divided supply chain risks into three categories: environmental risk, quality risk and operational risk [60]. Rostamzadeh et al. (2018) developed 7 major criteria and 44 sub-criteria for analysing supply chain risks using MCDM, including environmental risk, organizational risk, sustainable supply risk, sustainable production/manufacturing risk, sustainable distribution risk, sustainable recovery risk and information technology-related risk [53]. Liu et al. (2019) identified six risk categories, namely, market, sociopolitical and environmental, capacity, cooperation and coordination, alliance formation and risk commitment, and profit distribution [52]. Deng et al. (2019) classified the key risk factors of a perishable product supply chain: demand and raw material risk, employee risk, equipment risk, inventory risk, logistics risk, method risk, organizational risk, information risk and environmental risk [61]. In their risk analysis of a sustainable supply chain, Abdel-Basset and Mohamed (2020) divided risks into six categories: financial risk, supply risk factors, environmental risk, operational risk, control and planning risk, and information technology risk [11]. Jiang et al. (2020) divided risks into three categories in their evaluation of a sustainable supply chain of liquor: economic risk, environmental risk and social risk [62]. Badenhorst-Weiss and Naudé (2020) divided supply chain risks into five categories: financial risk, operational risk, external risk, market risk, and reputational risk [63]. Mzougui et al. (2020) divided supply chain risks into product characteristics, suppliers, transportation, financial risks, processing equipment and process realization [64]. Auer and Rauch (2021) classified supply chain risks into two categories: external risks and internal risks [65]. Zou et al. (2021) divided green supply chain risks into external risks, internal risks and other risks, with ‘other risks’ including information factors, contract factors, default factors, environmental awareness and green design capabilities [66].
This study considered the risk classification of different scholars. Depending on the type of the risk of enterprise departments, SSCRs can be divided into five categories: external environment, enterprise product supply, suppliers’ material supply, human resource dimensions, and enterprise interior and equipment aspect. These SSCR categories cover the social, economic and environmental aspects of sustainability. Aspects of sustainability of the basis of the above discussion and a comprehensive review of the literature [9,10,53,61,67,68,69,70,71,72,73,74,75,76,77,78,79,80,81,82,83,84,85,86,87,88,89,90,91,92,93,94,95,96,97,98,99]. In this study, 80 SSCRs belonging to the aforementioned five categories were reviewed, as shown in Table A1 (Appendix A). These SSCRs are assessed in Section 4.
2.2. Supply Chain Agility
SCA refers to the ability of a supply chain to quickly adjust its strategy and operation [100]. This ability can help improve the operation of a company; for example, it can enable the company to formulate a coordinated and connected response to fluctuating market changes [18]. SCA also refers to the ability to overcome unexpected challenges in logistics and distribution systems when providing customer-driven products and services [101], and to survive and sustain when faced with unexpected threats in a dynamic and unstable business environment [102].
SCA enablers are used to define the overall agility capabilities, which are responsiveness, competency, flexibility, and quickness, required to be sustainable [103]. The assessment of SCA is very important because it is a strategic indicator of the sustainability status [104]. Many scholars have conducted research on the evaluation of SCA. For example, Dehgani and Navimipour (2019) used a structural equation modelling technique to verify that information technology has a significant impact on agility [105]. Mandal and Saravanan (2019) used a partial least squares method to analyse the impact of entrepreneurship orientation, environment orientation, supply chain orientation, technology orientation, market orientation and learning orientation on the development of agility and elasticity of a tourism supply chain [106]. Roscoe et al. (2020) applied the life cycle theory to a supply chain and established a hypothetical model of the independent and combined effects of internal and external process connection on SCA and the moderating effects of product and supply complexity to achieve an agile response to a continuous change [107].
In our attempt to comprehensively understand the concept of SCA through literature integration, we found that many scholars have performed different studies. Bargshady et al. (2016) noted that the main influencing factors of SCA are customer satisfaction, information technology, personnel, change and uncertainty, and advertising [108]. Mirghafoori et al. (2017) found that the impact of SCA on green performance is mainly through organizational strategy, customer satisfaction and financial performance [109]. In the evaluation of SCA, Wu et al. (2017) divided the evaluation criteria into five levels: collaboration, process integration, information integration, customer measures and strategic alliance [110]. Tooranloo et al. (2018) divided the indicators of green SCA into seven levels, namely customer relationship, supplier relationship, green performance, green marketing, green process integrity, intellectual capital and green IT [111]. Irfan et al. (2019) found that supply elasticity, process integration and product complexity have a positive effect on the improvement of SCA and hence influence the business performance of enterprises [112]. Rasyidi and Kusumasstuti (2020) evaluated the agility of a supply chain from four aspects: flexibility, responsiveness, effectiveness and maturity [113]. Shuko et al. (2020) observed that there is an interactive relationship between SCA and organizational flexibility, and that supply chain integration has a positive impact on enterprise SCA and organizational flexibility [114]. Rehman et al. (2020) and Al-Zabidi et al. (2021) argued that the drivers of SCA could be classified into six levels: organizational management, strategic management, information management, strategic commitment, customer sensitivity and interpersonal skills [115,116]. According to Jindal et al. (2021), the key determinants of agility mainly could be classified into seven levels, namely infrastructure, supplier and customer information, analytical capabilities, human resources, management decision power, operational flexibility, and time change [117]. Aprilia et al. (2021) verified through examples that supplier innovation, information sharing and strategic resources have a significant impact on SCA [118].
In the light of the above discussion, this study divided SCA into six levels: cooperation and competition, information technology, market supply, customer relationship, manufacturing technology capability, organization and team management. Furthermore, according to the literature survey [108,119,120,121,122,123,124,125,126,127,128,129,130,131,132,133,134,135,136,137], 59 agility criteria were identified and classified into these 6 levels, as shown in Table A2 (Appendix A). These SCA criteria will be evaluated in Section 4.
2.3. Integrating Sustainable Risk and Agility for Supply Chain
In the study of SSCR, scholars analyze risks from multiple angles and dimensions. Some scholars believe that SCA and SSCR mutually influence each other. For example, Swafford et al. (2006) argued that organizations that consciously develop agility can manage interruption risks to ensure uninterrupted customer service [119]. Khan et al. (2008) and Braunscheidel et al. (2009) regarded the improvement of SCA as an outage risk management strategy, and they emphasized quick, proactive action in the face of potential outages [17]. From a theoretical perspective acquired from a literature survey, Aziz et al. (2015) proposed that agile practices have an impact on supply chain risks, and provided theoretical support for future research model building and empirical analysis [28]. Ganguly et al. (2017) assessed a set of key risks associated with SCA to help decision makers develop risk management strategies related to SCA to ensure growth and sustainability in the market [25]. Using structural equation models, Jajja et al. (2018) tested the hypothesis that supply chain risk improves agility performance [24]. Arifin (2018) claimed that supply chain risk management plays a significant regulating role for SCA, supply chain cost, supply chain responsiveness and global manufacturing activities [23]. Mandal and Dubey (2020) used a structural equation model to analyse the relationship between SSCR and agility [26]. Bhatti and Nawaz (2020) explored the impact of agility on sustainable tourism supply chain performance and hence on risk management in the Maldives tourism industry [27]. However, in the existing literature, empirical discussion on how SCA alleviates SSCRs is relatively lacking. Determining the impact of SCA on SSCR can help enterprises to formulate agile management strategies to prevent SSCR.
2.4. Research Gaps and Highlights
The EMSC is an important contributor to any national economy. With economic globalization and the increasingly fierce business environment, the sustainability of a supply chain is important for improving organizational performance and increasing competitive advantage [138]. Recent research has focused on the sustainability of the EMSC. For instance, Orji and Liu (2020) used fuzzy TOPSIS to discuss the impact of key drivers of innovation-led lean production on long-term sustainable performance in China’s EMSC [139]. Rajesh (2018) considered the Indian EMSC as an example, studied the positioning of the supply network by combining sustainability with resilience [140]. In order to explain the objective contradiction between sustainability and resilience in practice, Rajesh (2021) proposed a grey objective decision making and tradeoff implementation model to analyze the strategic preference of electronic manufacturing enterprises for achieving sustainability and resilience [141]. However, past studies neither considered the impact of SSCRs and SCA on an EMSC nor not used SCA to eliminate or mitigate SSCRs. Therefore, this study investigated the impact of SSCRs and SCA on an EMSC and attempted to use SCA to mitigate SCCRs.
The main highlights of this study are as follows:
- A HoQ model was used to link SSCRs and agility criteria and apply them to the multinational electronics manufacturing industry.
- A HoQ model based on QFD was used to investigate the interdependence of SSCRs and agility criteria, and to determine important agility criteria to eliminate or mitigate major SSCRs.
3. Methodology
This section introduces a fuzzy Delphi method (FDM), the analytic hierarchy process (AHP), the decision-making trial and evaluation laboratory (DEMATEL) and grey relational analysis (GRA). Furthermore, a hybrid QFD-MCDM framework based on QFD and a combination of these MCDM methods is proposed to discuss how to mitigate SSCRs by improving SCA, and it is applied to the multinational electronics manufacturing industry.
3.1. The Proposed QFD-MCDM Framework
QFD is a new-product development process that emphasizes cross-functional integration. It provides a means of translating customer requirements into final products (or services) through all stages of product planning, engineering, and manufacturing, and it is an effective way to ensure adequate quality at each stage of the product development and production process [142]. The customer requirement planning matrix, known as ‘HoQ’, is the central structure for QFD [143]. Customer requirements are usually obtained through market surveys or customer interviews, and they are converted into a set of measurable engineering characteristics to determine the relationship between customer requirements and engineering characteristics, obtain the correlation between engineering characteristics, and calculate the importance of the engineering characteristics [144].
The main limitation of traditional QFD is that the process is overly subjective and, in some cases, may lack flexibility [145]. To overcome this limitation, scholars have extensively studied the integration of MCDM into QFD [32,146,147,148,149]. MCDM is a method that can simultaneously consider multiple criteria and process evaluation information provided by decision makers; it can describe, evaluate and rank evaluation objects [150]. For example, Erol et al. (2022) proposed an integrated decision framework that includes a QFD approach based on MCDM and a set of hesitant fuzzy language terms to investigate the true potential of blockchain to address the circular economy [151]. He et al. (2021) developed a hybrid approach to Kano-DEMATEL-QFD that achieved optimal resilient solutions for maximum customer satisfaction and SSCR mitigation at a minimum investment cost [152]. Guo et al. (2021) proposed a new risk assessment method by combining QFD with the fuzzy G1 method, dual tuple language representation model and dynamic intuitionistic fuzzy MCDM to judge the impact of risk factors on network operation [153]. Hsu et al. (2021) discussed the risk mitigation methods that can maximize the resilience of sustainable supply chains for garment companies based on QFD combined with MCDM [15]. Hsu et al. (2021) integrated the MCDM approach with QFD sustainable supply chain disruption risk, resilience capability and resilience enhancement characteristics, and they ultimately improved supply chain resilience by mitigating sustainable risk [154]. Therefore, an integrated framework involving QFD, FDM, AHP, DEMATEL and GRA is proposed in this paper. The combination of QFD and MCDM can help improve SCA, alleviate SSCRs and provide decision support for multinational electronic manufacturing enterprises. The HoQ model and method flowchart of the QFD-MCDM framework used in this study are shown in Figure 1 and Figure 2. The main analysis steps are as follows.
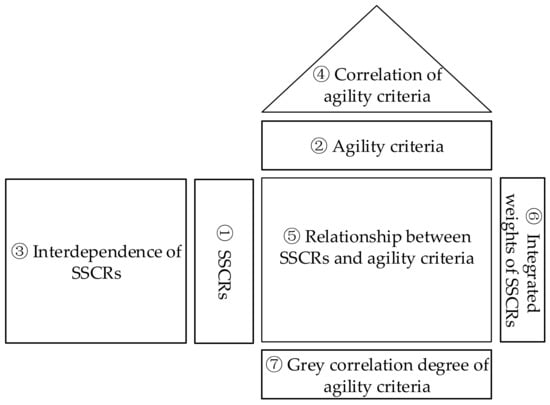
Figure 1.
Structure of the HoQ.
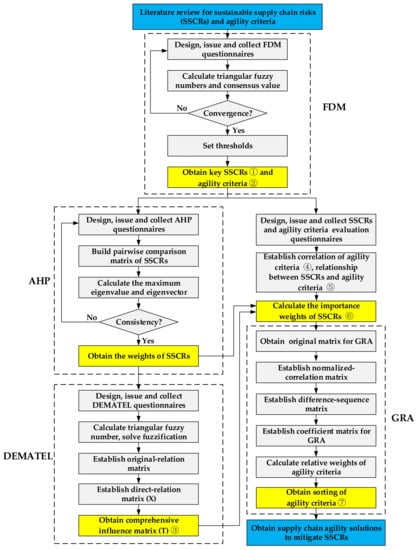
Figure 2.
Proposed QFD-MCDM framework.
3.1.1. Step 1: Screening out Key SSCRs and Agility Criteria Using FDM
Factors obtained from a literature survey included 80 SSCRs and 59 agility criteria. With the help of eight experts, the factors were evaluated and assigned a number from 0 to 10. The larger the number, the more important was the factor. In this study, an FDM was used to collate expert opinions, and the threshold value was used to calculate the SSCRs and agility criteria. The key SSCRs and agility criteria were screened out. They correspond to ① and ② in Figure 1, respectively.
3.1.2. Step 2: Calculating the Weights of Key SSCRs Using AHP
In terms of the AHP evaluation scale, SSCRs within the same level were compared pairwise by means of an expert questionnaire, a comparison matrix was constructed, and the weight of each SSCR was calculated, so as to prepare for the next calculation of the integrated weights of the SSCRs.
3.1.3. Step 3: Obtaining the Correlation Matrix between Key SSCRs Using DEMATEL
The evaluation results of each expert were sorted into an direct relation matrix to assess the inherent dependencies between SSCRs. The original correlation matrix and comprehensive impact matrix T for the SSCRs were obtained by using DEMATEL (i.e., the direct relation matrix ③ of the SSCRs, which is located in the leftmost part of the HoQ model in Figure 1).
3.1.4. Step 4: Obtaining the Correlation of Agility Criteria and the Matrix of the Relationship between SSCRs and Agility Criteria
The questionnaire results for the agility criteria were defuzzified to obtain their direct relation matrix (④), which is located on the roof of the HoQ in Figure 1. “Defuzzification” is an important step in fuzzy inference machines, and it refers to transforming the fuzzy quantity obtained by expert decision into an accurate quantity, that is, to deduce the mapping from a fuzzy set to a general set. In order to determine the correlation between SSCRs and agility criteria, we used a numerical representation: 1, 3 and 9 represented low, moderate and high correlation, respectively. The relational matrix (⑤) of SSCRs and agility criteria obtained by deconfuzzing the questionnaire data is located in the middle of the HoQ in Figure 1.
3.1.5. Step 5: Sorting the Agility Criteria Using GRA
The direct relation matrix of agility criteria obtained in step 4 was multiplied by the mutual relation matrix of SSCRs and agility criteria in step 4 to obtain the original matrix of GRA. Using GRA, the integrated weight (⑥) of SSCRs and the grey correlation (⑦) of agility criteria were obtained; they are located to the right and below the HoQ in Figure 1, respectively. Finally, the agility criteria were ranked according to the grey correlation degree.
3.2. Fuzzy Delphi Method
An FDM was proposed by Ishikawa et al. (1993) on the basis of the traditional Delphi technique and fuzzy reasoning [155]. Unlike the traditional Delphi method, it had shortcomings, such as low consistency of expert opinions and high cost of execution and modification of individual expert opinions in order to achieve an overall consensus. Chang et al. (2000) pointed out that FDM used for group decision-making could solve the problem of ambiguity of expert consensus [156]. FDM can reduce the number of investigations, time and cost and consider expert opinions [157]. Rathore et al. (2021) identified 15 associated safety risk factors using FDM to achieve a safe working environment in the healthcare system [158]. In sustainable supply chain management, Chen et al. (2021) identified nine key risk factors using FDM as determinants of the case firm’s improvement measures [159]. This study adopted an FDM to screen key SSCRs and agility criteria. The specific processes are as follows:
Step 1: Identify all the evaluation factors, design a fuzzy Delphi expert questionnaire, and ask each expert to evaluate the importance of the factor, that is, to provide an interval value. The ‘minimum value’ of the interval value represents the ‘most conservative value’ of the expert’s quantification score for this factor. Conversely, the ‘maximum value’ represents the ‘most optimistic value’ of the expert’s quantified score for the factor.
Step 2: The questionnaires of experts were collected and integrated, the ‘most conservative value’ and ‘most optimistic value’ provided by all experts were considered and the extreme value falling beyond twice the standard deviation was eliminated. Fuzzy theory was then used to calculate the minimum value , geometric mean value and maximum value of the remaining ‘most conservative value’, and the minimum value , geometric mean value and maximum value of the ‘most optimistic value’. The triangular fuzzy number is shown in Figure 3.
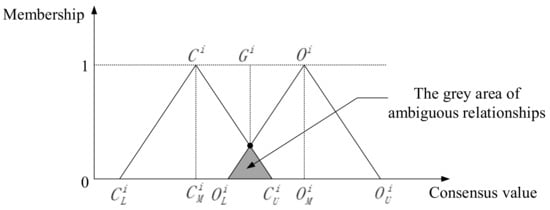
Figure 3.
Schematic of FDM triangular fuzzy number.
Step 3: Calculate the degree of consensus of expert opinions and test whether the opinions of experts reached a consensus. The higher the value, the higher the consensus of experts on this factor. can be computed in the following three ways.
- (1)
- If the two triangular fuzzy numbers do not overlap, that is, (), it indicates that there is no consensus on the value of the expert opinion range. Then, of this evaluation factor is the arithmetic mean of and , and it is expressed as .
- (2)
- If the two triangular fuzzy numbers overlap, that is, (), and , is the interval range of optimistic and conservative cognition, and it is given by . is the grey area of fuzzy relationship, and it can be expressed as . Although there is no consensus between the opinions of the experts, in the case of the experts who give the extreme opinions, their opinions do not differ significantly from the opinions of the other experts to cause differences of opinions. of this factor is calculated by the formula.
- (3)
- If the two triangular fuzzy numbers overlap, that is, (), and , it indicates that the expert who gave the opinion corresponding to the extreme value differs too much from the other experts, resulting in divergence of opinion.
Step 4: The evaluation factors that do not converge are provided to experts for reference, and steps 1–4 are repeated until all the evaluation factors converge and is solved.
Step 5: Set reasonable thresholds and screen out key factors and criteria.
3.3. Analytic Hierarchy Process
The AHP was proposed by Saaty (1977) to deal with the MCDM problem, and it is also one of the most widely used methods [160,161]. It has the capability to solve multi-person, multi-attribute and multi-cycle problems with a layered complex structure [162]. The AHP can also deal with both tangible and intangible factors and is believed to improve the accuracy of the evaluation, selection and resource allocation stages of decision-making, helping decision makers to independently judge the contribution of each criterion to the goal [163]. For instance, Bathrinath et al. (2021) determined the most influential risks and preventive measures using a hybrid multi-criteria decision method such as AHP and adding a similar ranking technique to the ideal scheme [164]. Tavana et al. (2021) proposed a comprehensive method for supply chain risk-benefit assessment and supplier selection by combining fuzzy AHP with fuzzy multiplication multi-objective optimization based on ratio analysis [165]. Therefore, this study used the AHP to evaluate the importance of SSCRs.
Table 1 presents the assessment scale of the AHP; as shown, it divides the importance into nine levels.

Table 1.
AHP assessment scale.
The various steps involved in the AHP are as follows:
Step 1: Make a pairwise comparison of factors within the same level and establish a pairwise comparison matrix according to the results of the questionnaire survey, as shown below:
Step 2: Calculate the weight of the elements at each level by comparing the matrices in pairs, and then calculate the eigenvector W and the maximum eigenvalue to check whether the matrices are consistent. The formula is as follows:
Step 3: The pairwise comparison matrix is constructed by using (Consistency Index) and (Consistency Ratio) to calculate When , it means that the matrix passes the consistency test; otherwise, the questionnaire should be filled out again to ensure the accuracy of the data.
Here, is the stochastic index. Table 2 lists the stochastic index for factors.
Table 2.
Stochastic index.
3.4. DEMATEL
The DEMATEL method is a comprehensive method to establish and analyse a structural model of the causal relationship between complex factors [166,167]. It can be used to solve the problem of dependency and complexity between standards [168]. DEMATEL is based on a directed graph, which can divide the factors involved into cause groups and effect groups [166]. For example, He et al. (2021) used DEMATEL to determine the interrelationships of risk factors in their search for optimal resilient solutions that mitigate SSCR [152]. Li and Xu (2021) applied fuzzy DEMATEL analysis to determine and evaluate the relationship between accident risk factors and to calculate their weights; this strategy can help prevent accidents and improve system reliability [169]. Therefore, this study used DEMATEL to investigate the inherent dependence of SSCRs. The steps are detailed below.
Step 1: Five rating scales are used to evaluate the relationship between the factors. The five rating scales can be interpreted as follows: 0, no impact; 1, very low impact; 2, low impact; 3, high impact; and 4, very high impact. The relationship between the factors is converted into corresponding values, and the weight value of the influence degree of each factor is obtained after solving for the fuzzy average value.
The way to solve fuzziness is as follows: the maximum and minimum values of the evaluation values obtained from an expert questionnaire are considered as the two end points of the triangular fuzzy number . The formulas are as follows:
Here, is the number of experts, is the evaluation value of a paired comparison of experts, is the minimum evaluation value, is the maximum evaluation value and is the geometric mean of all the evaluation values. Finally, the arithmetic mean of the three values is obtained using the following formula to achieve the final solution fuzziness.
Step 2: The influence degree obtained from the questionnaire is used to construct the original relational matrix of factors, and the diagonal of the matrix is 0.
Step 3: The original relational matrix is normalized, and each row/column is summed, and the maximum value of the sums of the rows/columns is selected for the normalization of the matrix. The normalized direct relational matrix can be obtained by using Formula (6).
Step 4: On the basis of the substitution of the normalized direct relation matrix into Formula (7), it can be concluded that the total relation affects the matrix , where is the identity matrix.
Step 5: Each row and each column in the total influence relation matrix are summed up to obtain the sum of all rows (D) and the sum of all columns (R). A causality diagram is drawn with as the abscissa coordinate and as the ordinate.
3.5. Grey Relational Analysis
GRA was proposed by Julong (1982) on the basis of the grey relational space theory. It is used to solve uncertainty problems in the case of discrete data and incomplete information [170,171]. Because it is suitable for solving multi-factor and multi-variable problems with complex interrelations and since it uses relatively few data or factors with large variables to provide satisfactory results [172,173], it is a useful method for dealing with little, incomplete and uncertain information [172]. For instance, Zou et al. (2021) used GRA to clarify the degree of connection between supply chain risk factors and the selection of key risk factors to determine the risk factors involved in green supply chain management [64]. Huang et al. (2021) used the GRA model to evaluate the financial supply chain risks of 15 small and medium-sized enterprises in China’s home appliance industry [174]. Therefore, GRA was used in this study to evaluate the relationship between SSCRs and agility criteria, the internal dependence of agility criteria, and the grey correlation degree of agility criteria. The GRA steps are described below.
Step 1: Construct the original matrix. The normalized direct relation matrix is set as the GRA original matrix, and grey correlation analysis is conducted on it.
Step 2: Perform normalization processing of the large feature to transform the original matrices of different definitions or units into comparable sequences.
Step 3: Calculate the gap between each normalized value and the reference data value by using the grey correlation distance formula
Step 4: Calculate the grey correlation coefficient:
Here, ζ is the distinguished coefficient, with ζ ∈ [0.1], it means to control the size of the grey correlation coefficient for convenience of judgment. It is generally recommended to set it at 0.5, but decision makers can choose different ζ values for calculations, depending on their personal preferences.
Step 5: Obtain the grey correlation degree of the criteria:
Step 6: Evaluate and sort according to the grey correlation degree of each criterion.
4. Results and Discussions
Currently, EMSCs are facing unprecedented risks because of internationalization, the development of globalization, the increasing consumer demand, and the unpredictability of various natural and man-made disasters. In the fierce market, to maintain competitiveness, increase profits and reduce losses are the main objectives of current electronic manufacturing enterprises to manage risks. In this context, this study examined whether reducing SSCRs by improving SCA improved the sustainability of an EMSC.
In this study, a multinational electronic assembly manufacturing enterprise run by the United States in China was considered as the research object. Case Company’s main business is the design and manufacture of electrical, electronic and fibre-optic connectors and cables, and its products are widely used in 3C, aerospace, military, automotive and railway applications. At present, the company faces SSCRs that are troubling business managers. In order to mitigate SSCRs and improve the company’s SCA, this study collected different opinions from enterprises through expert interviews and questionnaires and performed a comprehensive analysis and judgment. The questionnaire information was mainly obtained from eight experts from different departments, with a recovery rate of 100%. The analysis results will be presented in the form of a HoQ.
4.1. Results of Implementing the QFD-MCDM Approach
This study’s calculation process is a relatively simple mathematical operation, which can be realized in Excel. Therefore, all the analysis in this study was completed in Excel. The following are the main steps of the QFD-MCDM approach:
4.1.1. Step 1: Screening out Key SSCRs and Agility Criteria Using FDM
On the basis of 80 SSCRs and 59 agility criteria, a questionnaire pertaining to the FDM was designed and distributed in this study.
In this process, Formula (1) was used to calculate the value of G and set an appropriate threshold value of S to achieve the purpose of screening. After the experts’ joint discussion, the threshold value was determined to be risk 5.1 and agility 5.0, and the screening conditions were as follows: If , the SSCRs are accepted. Otherwise, delete. If , the agility criteria are accepted. Otherwise, delete.
After screening by the FDM, the original 80 SSCRs were reduced to 19, and the original 59 agility criteria were reduced to 20. After screening, the important SSCRs and agility criteria were integrated, as shown in Table 3 and Table 4.
Table 3.
Key SSCRs after screening.
Table 4.
Key agility criteria after screening.
4.1.2. Step 2: Calculating the Weights of Key SSCRs Using AHP
The analysis hierarchy is shown in Table 5 according to the 19 key SSCRs, which were screened out based on FDM during step 1 and involved 4 risk levels. The risk levels were compared in pairs, and the SSCRs of each level were compared in pairs. Five AHP questionnaire forms were designed and sent to eight experts. Each expert made only 121 comparisons, and the calculation process used by each expert was the same. Only the input variables were changed, and the analysis process was repeated 8 times. The analytic process and AHP results are shown below.
Table 5.
Key SSCRs analysis hierarchy.
- The questionnaire data provided by experts were sorted and substituted into Equations (5) and (6) to check whether the answers on each aspect of the questionnaire met the consistency requirement, namely . If the requirement was not met, the answers were discussed with the experts again, and the answers were entered in the questionnaire again. The calculation results of the dimension weight of the AHP expert questionnaire are presented in Table 6.
Table 6. Consistency and weight values of the surface.
- The weight of key SSCRs could be integrated by multiplying the weight of each factor by the weight of the corresponding dimension. This is shown in Table 7, Table 8, Table 9 and Table 10.
Table 7. The consistency and weight value of human resource (RA1) factors.
Table 8. The consistency and weight value of supplier material supply (RA2) factors.
Table 9. The consistency and weight value of enterprise product supply (RA3) factors.
Table 10. The consistency and weight value of enterprise interiors and equipment (RA4) factors.
- According to the calculation steps of the expert questionnaire (1), the data of eight experts can be calculated and sorted to obtain the integrated weight of each expert’s score. The integrated weight value of the eight expert questionnaires can be calculated and averaged to obtain the final AHP weight, as shown in Table 11.
Table 11. The final weight of each SSCR.
4.1.3. Step 3: Obtaining the Correlation Matrix between Key SSCRs Using DEMATEL
In this process, DEMATEL was used to consider the interaction between SSCRs and serve as the impact matrix on the left side of the HoQ.
- The defuzzification calculation was performed by substituting the questionnaire data of eight experts into Equations (7)–(10) for data defuzzification and obtaining the influence degree of R1 on the remaining 18 factors as an example. Similarly, the mutual influence degree values among the 19 factors were calculated to obtain the original relational matrix (shown in Table 12). The sum of each row/column of the original relational matrix was obtained, and the maximum value of the sums of the rows/columns was selected for the normalization of the matrix. The maximum value obtained was 41.875.
Table 12. Raw relational matrix of SSCRs.
- Substituting the original relational matrix into Equation (11) yielded . The value of λ was multiplied by the original relational matrix; in other words, the normalized direct relational matrix could be obtained by normalizing the original relational matrix. Equation (12) was used to obtain the comprehensive influence matrix T, which is shown in Table 13.
Table 13. The comprehensive influence matrix T.
- The data in Table 14 were obtained by summing each row/column of the comprehensive influence matrix T and adding and subtracting the influence degree of the factors and the influence degree .
Table 14. Prominence vector () and relation vector () of SSCRs.
is the centrality, indicating the total degree of influence and the degree of influence of this factor. The larger the centrality value, the stronger is the relationship between this factor and other factors, and the greater is this factor’s importance. Similarly, is the degree of cause. If it is positive, it indicates that this factor is the influencing factor. The greater the value, the greater the influence on other factors. If is negative, it indicates that the factor is the affected factor. The smaller the value, the more easily it is affected. A more detailed explanation and discussion of SSCRs are presented in Section 4.2.
4.1.4. Step 4: Obtaining the Correlation of Agility Criteria and the Matrix of the Relationship between SSCRs and Agility Criteria
This process was performed to select 20 agility criteria and 19 SSCRs after step 1 and conduct the GRA expert questionnaire survey. In view of the interdependent nature of agile capabilities and risks, it will cause the value of the element of the correlation matrix to change, so as to further calculate the grey correlation degree.
- Construct the incidence matrix between SSCRs and agility criteria. The aim is to determine the correlation between agility and SSCRs; the numerical values 1, 3 and 9 indicate low correlation, moderate correlation, and high correlation, respectively. Table 15 shows the correlation matrix of defuzzification after the eight questionnaires were collected; the arithmetic mean method was used for defuzzification. The correlation matrix is in the middle of the HoQ.
Table 15. The incidence matrix between SSCRs and agility criteria.
- Construct the correlation matrix of agility criteria. The aim is to determine interrelationships between agility criteriaon and to express them in numerical terms; 1, 3 and 9 indicate slight correlation, moderate correlation, and absolute correlation, respectively. This matrix is used as the roof of the HoQ. Table 16 shows the correlation matrix of defuzzification of the eight questionnaires after they were collected; the arithmetic mean method was used for defuzzification.
Table 16. The correlation matrix of agility criteria.
4.1.5. Step 5: Sorting the Agility Criteria Using GRA
- Calculate the integratied weight of key SSCRs. The integrated weight can be obtained by matrix multiplication of the AHP weight in Table 11 (obtained in Step 2) and the total influence matrix T in Table 13 (obtained in Step 3). The results are shown in Table 17, and it is on the far-right side of the HoQ.
Table 17. Integrated weights of key SSCRs.
As evident in Table 17, among the SSCRs faced by small and medium-sized enterprises, The results showed that the best SSCRs were R9 (‘disruption or delay in the delivery of goods because of inadequate liquidity and poor financial conditions’), R5 (‘the information system was compromised’), R10 (‘credibility and competence of operators and leaders’), R19 (‘long product lead time’) and R1 (‘product safety and quality’).
- 2.
- Calculate the grey correlation degree. The normalized correlation matrix can be obtained by multiplying the matrices in Table 15 with those in Table 16, and it can be used as the original matrix for grey correlation analysis. Equations (13)–(16) are used to obtain the grey correlation degree of key agility criteria, as shown in Table 18. Table 18 is below the HoQ.
Table 18. Grey correlation degree and sorting of agility criteria.
Finally, draw the HoQ, which is shown in Figure 4. The results showed that the best agility criterion were A1 (‘production and sales capability’), A11 (‘quick decision/strategic flexibility’), A15 (‘electronic shipment of finished products to control shipment operations’), A10 (‘supplier on-time delivery rates’) and A16 (‘cost minimization’), in this order.

Figure 4.
The HoQ results.
4.2. Implications and Recommendations
In this study, the integrated framework based on QFD-MCDM transformed the SSCRs in the EMSC into agility criteria and provided a risk mitigation tool for establishing a sustainable supply chain. This decision-making framework can provide the multinational manufacturing industry with agile solutions to reduce SSCRs. In particular, it can help manufacturers plan strategies in advance to improve enterprise agility and reduce risks.
The results of the analysis of the internal dependence/causality of the risks of a sustainable supply chain are discussed here. According to the data set in Table 14, the SSCR with the largest value is “credibility and competence of operators and leaders (R10)”, indicating that this factor has the highest centrality, the highest relationship strength and the highest importance among all factors. Managers and leaders are not only the organizers and commanders of enterprises’ production and operation activities, but also specialized talents engaged in enterprise economic work. Their reputation and ability directly affect the reputation and production and operation of enterprises, and play an important role in the future development of enterprises. Therefore, managers and leaders should pay attention to improving their own capabilities.
According to the data set , SSCRs can be divided into two groups: when is positive, it is called the causal group, and when is negative, it is called the affected group. The 12 SSCRs in the causal group are important for business managers, for the development of risk mitigation strategies, because they tend to influence other factors and thereby influence the overall performance of the system. According to , the largest value is information system instability (R5), which needs special attention of enterprise managers. If an enterprise’s information system is unstable (R5), a large amount of production management information will be leaked, deleted or modified, seriously affecting the enterprise’s production activities and managers’ strategic decisions. Therefore, the enterprise should strengthen the security of the information system.
In the results of the importance of SSCRs, Table 17 shows that the first five types of SSCRs are ‘disruption or delay in the delivery of goods because of inadequate liquidity and poor financial conditions’ (R9), ‘information system instability’ (R5), “credibility and competence of operators and leaders’ (R10), ‘long product lead time’ (R19) and ‘product safety and quality’ (R1). Ranked second and third in the sorting of the importance of SSCRs were the main reason (R5) and the centre of the highest factor (R10), and the DEMATEL analysis results are consistent with these results. This situation shows that ‘information systems instability’ and ‘credibility and competence of operators and leaders’ are major challenges for the enterprise. Managers should strengthen these two aspects for risk prevention.
An important task of business managers is to solve the problem of goods being interrupted or delayed due to lack of supply liquidity and poor financial conditions. Lack of liquidity or disruption in supply and the poor financial condition of the enterprise can lead to lower revenue and sales, which can impact labor utilization and cause long delivery delays [175]. Delivery disruptions or delays can expose a company to default risk and stock shortage risk as well as huge economic losses, affect a company’s competitive positioning in the market, and even lead to the suspension of other activities in the supply chain [176,177]. Hence, companies should pay attention to the risk of cargo disruptions and delays.
Second, ‘product safety and quality’ (R1) is the cornerstone and fundamental of an enterprise’s development and plays an important role in the sustainable development of electronics manufacturing [178]. If the quality of products is not up to standard, the delivery of goods will be interrupted or delayed, which will prolong the delivery time of products and affect the stable operation of the supply chain. With the development of electronic technology, environmental sustainability and green have become the main theme of product manufacturing, and an increasing number of enterprises are focusing on product safety to promote the development of circular economy [178].
Finally, long product lead times (R19) increase production and operating costs, while short product lead times help companies avoid disruptions or delays and improve their market share and competitiveness. Product delivery time control requires enterprises to manage product design, manufacturing, inventory, delivery and other aspects. It can shorten the response cycle of the supply chain and help achieve the agile operation of the supply chain.
SCA is a mitigation tool for SSCRs, and Table 18 shows specific agile measures to prevent risks. The top five agility criteria are ‘production and sales capability’ (A1), ‘quick decision/strategic flexibility’ (A11), ‘electronic shipment of finished products to control shipment operations’ (A15), ‘supplier on-time delivery rates’ (A10) and ‘cost minimization’ (A16). To address the above five SSCRs, the case company should first improve its production and sales capabilities (A1). This can help the case company to complete product delivery on time, ensure product safety and quality, generate huge profits for the enterprise, maintain the financial status of the enterprise, and prevent interruption or delay of goods.
Case companies can improve their capability for quick decision/strategic flexibility (A11) to help managers to make reasonable and effective decisions quickly and to avoid information system instability (R5) or reduce the loss caused by system invasion. They can also drive their managers, to improve credibility and ability (R10). As the environment continues to change and as various factors that influence decisions change, strategic flexibility becomes particularly important as a means of managing and controlling risks and achieving business sustainability, as it enables organizations to be more innovative in their processes, products and services [179].
The improved ability to ship finished products electronically in order to control the shipment operation (A15) played an important role in helping the case company overcome R9 and R19. Electronic delivery of finished products ensures the smooth delivery of finished products out of storage, saves transportation time, delivers goods to customers on time, and improves the overall customer satisfaction.
When purchasing raw materials, the case company should pay attention to the supplier’s on-time delivery rates (A10). If the supplier’s on-time delivery rate is too low, the lack of raw material procurement will seriously affect product production and subsequently affect the normal operation and performance of the whole company. Therefore, a high supply rate can maintain the fluency of the supply chain and the financial status of the enterprise.
Finally, cost minimization (A16) can help the case company save money and avoid unnecessary wastage. The implementation of a cost minimization strategy can help optimize product design, obtain a price advantage on the product and better meet the needs of consumers. The case company can also improve the customer service level (A9), quality (A13), rapid customer response ability (A7), data accuracy (A8) and other criteria to prevent SSCRs and to promote the sustainability of the EMSC.
The Pareto effect, also known as the 80/20 rule, states that about 80% of the effects come from 20% of the causes, that is, a small number of causes have a big impact. This means that larger outcomes can be achieved by addressing the few causes or risks that are critical [180]. In the case of limited resources, the Pareto effect can be applied to the results of the QFD-MCDM framework, as shown in Figure 5. Multinational electronics manufacturers can reduce the most important SSCRs by reinforcing the most important agility guidelines. Once the first five agility criteria are adjusted, other SSCRs will also be alleviated to a certain extent, thereby improving the entire supply chain level. On this basis, as electronics manufacturers continue to invest time and money to improve the SCA, the SSCRs will be gradually reduced and finally, the expected goal of manufacturing system will be achieved.
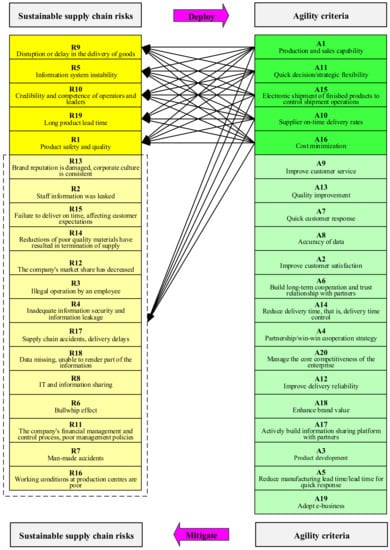
Figure 5.
Agility-enhancing solutions to mitigate SSCRs in the EMSC.
Recent mitigation measures on SSCRs mainly focus on supply chain elasticity. As an important capability of supply chain elasticity, agility plays an important role in mitigating SSCRs. As mentioned in Section 2.3, agility has been identified as an important risk mitigation tool. However, empirical studies on the mitigation of SSCRs using SCA are still scarce, especially in the multinational electronic manufacturing industry. This study enriches the related concepts in the field of supply chain risk management, and it also provides some reference value through which other scholars can discuss the relationship between agility and risk.
In recent years, scholars have combined different MCDM methods with QFD to explore different fields such as the circular economy [151], sustainable product design [181], risk mitigation in the power sector [150], the quality characteristics of manufacturing enterprises [182], and fashion supply chain risk mitigation [15]. Although different MCDM methods have been combined with QFD in these studies, no mode has been found to combine FDM, AHP, DEMATEL and GRA with QFD. Secondly, this study innovatively uses QFD-MCDM to explore the relationship between SSCR and SCA. In addition, this study also applies QFD-MCDM to multinational electronic manufacturing enterprises, providing empirical research that finds agile solutions that reduce the risk of sustainable supply chains. Therefore, the method proposed in this study, as well as the content and application of the method, are unique.
When using the QFD-MCDM framework, it should be noted that there is no need to use too much software when processing the data. At the same time, it should be noted that each method’s analysis steps should be clear so that a large number of data operations can be carried out. For example, the weight calculated by AHP is combined with the SSCR autocorrelation matrix to obtain the integration weight. The correlation matrix of the SSCRs and agility criteria as well as the autocorrelation matrices of the agility criteria are combined as the initial matrix for GRA analysis. Attention should be paid to remind the experts to fill in the questionnaire scientifically and truthfully to avoid repeating the questionnaire. For example, consistency requirements should be met during AHP analysis.
In this study, AHP was used to solve multi-person, multi-attribute and multi-cycle problems with hierarchical complex structures. SSCR has two levels of indicators, and AHP can be used to clearly obtain the priority scale of each level of indicators. The results are improved. DEMATEL was used in this study to explore the binary relationship of key SSCRs. Therefore, this study first used AHP to calculate the priority of the first and second level SSCR indicators and then used DEMATEL to calculate the internal dependence. In this way, this study can better understand the importance ranking of agility criteria and SSCRs and provide managers with risk mitigation programs. Therefore, this study asserts that the framework cannot be simplified.
5. Conclusions
In this study, a QFD-MCDM integrated framework was used to determine the relationship between the identified SSCRs and between SSCRs and agility criteria, apart from being used to ascertain the importance of SSCRs and agility criteria. This study makes an important contribution towards the improvement of the agile capability of EMSCs, which can reduce SSCRs. The following results were obtained through examples.
- The top five SSCRs affecting the EMSC were ‘disruption or delay in the delivery of goods because of inadequate liquidity and poor financial conditions’, ‘information system instability’, ‘credibility and competence of operators and leaders’, ‘long product lead time’ and ‘product safety and quality’.
- The top five agility criteria affecting the EMSC were ‘production and sales capability’, ‘quick decision making/strategic flexibility’, ‘electronic shipment of finished products to control shipment operations’, ‘supplier on-time delivery rates’ and ‘cost minimization’.
The results of this study have certain reference value for managers of the multinational electronics manufacturing industry to improve their agile ability and identify and mitigate SSCRs.
In addition, this study has made a significant contribution to research in multinational electronics manufacturing field.
Firstly, the FDM-AHP-DEMATEL-GRA integration method based on the QFD framework is proposed. The HoQ model is constructed by the QFD-MCDM method to relate the SSCRs and the agility criteria, and the model is used to support decision-making of the multinational electronics manufacturing industry.
Secondly, through the integrated framework, the relationship between the SSCRs and the agility criteria and their respective internal dependence were investigated to provide agility solutions for SSCRs to multinational EMSCs.
Finally, the framework can guide managers of multinational electronic manufacturing enterprises on how to enhance or strengthen the SCA ability to eliminate or mitigate SSCRs so as to make the supply chain more resilient and efficient.
The QFD-MCDM framework can be implemented not only in EMSCs, but also in other industrial areas in other regions. However, the application of the framework in different contexts produces different results, as each supply chain is characterized by the economic, social, political, natural, and geographical factors in which it operates [183]. Although the proposed framework can be applied to other industries, different industries have their own unique SSCRs and agility criteria, and evaluation indicators should be redefined. The framework can also be connected with other tools, such as the IT, IT of Things and big data to help monitor, plan and optimize supply chains in real time. This study only evaluated SSCRs and agility criteria. Other variables can be added in the future to establish a more comprehensive and deeper sustainable supply chain.
Author Contributions
Conceptualization, C.-H.H. and R.-Y.Y.; methodology, C.-H.H. and A.-Y.C.; software, R.-Y.Y. and A.-C.S.; validation, C.-H.H., R.-Y.Y. and A.-Y.C.; formal analysis, C.-H.H. and A.-C.S.; investigation, R.-Y.Y. and A.-C.S.; resources, C.-H.H. and W.-L.L.; data curation, R.-Y.Y. and A.-C.S.; writing—original draft preparation, R.-Y.Y. and A.-C.S.; writing—review and editing, C.-H.H. and R.-Y.Y.; visualization, C.-H.H. and W.-L.L.; supervision, C.-H.H. and A.-Y.C.; project administration, C.-H.H. and A.-Y.C.; funding acquisition, C.-H.H. All authors have read and agreed to the published version of the manuscript.
Funding
This paper was supported by Natural Science Foundation of Fujian Province of China (Grant No. 2019J01790) and the Education and Scientific Research Foundation of Fujian Province Finance Department of China (Grant No. GY-Z21001).
Institutional Review Board Statement
Not applicable.
Informed Consent Statement
Not applicable.
Data Availability Statement
Not applicable.
Acknowledgments
The authors are very much indebted to the Editor-in-Chief and anonymous referees who greatly helped to improve this paper with their valuable comments and suggestions.
Conflicts of Interest
The authors declare no conflict of interest.
Abbreviations
| Electronic manufacturing supply chain | EMSC |
| Sustainable supply chain risk | SSCR |
| Supply chain agility | SCA |
| Multicriteria decision-making | MCDM |
| Quality function deployment | QFD |
| Houses of quality | HoQ |
| Fuzzy Delphi method | FDM |
| Analytic hierarchy process | AHP |
| Decision making trial and evaluation laboratory | DEMATEL |
| Grey relational analysis | GRA |
Appendix A
Table A1.
Proposed SSCRs by scholars.
Table A1.
Proposed SSCRs by scholars.
| Sustainable Supply Chain Risks (SSCRs) | 1 | 2 | 3 | 4 | 5 | 6 | 7 | 8 | 9 | 10 | 11 | 12 | 13 | 14 | 15 | 16 | 17 | 18 | 19 | 20 | 21 | 22 | 23 | 24 | 25 | 26 | 27 | 28 | 29 | 30 | 31 | 32 | 33 | 34 | 35 | 36 | 37 | |
|---|---|---|---|---|---|---|---|---|---|---|---|---|---|---|---|---|---|---|---|---|---|---|---|---|---|---|---|---|---|---|---|---|---|---|---|---|---|---|
| External environment | Risk of supply and demand changes | ● | ● | ● | ● | ● | ● | ● | ● | ● | ● | |||||||||||||||||||||||||||
| Industrial climate index | ● | ● | ● | ● | ● | ● | ● | ● | ● | ● | ● | ● | ● | ● | ● | ● | ||||||||||||||||||||||
| Exchange rate fluctuations/tax changes | ● | ● | ● | ● | ● | ● | ● | ● | ● | ● | ● | ● | ● | |||||||||||||||||||||||||
| Seasonal adjustment and tidal current fluctuation | ● | ● | ● | ● | ● | ● | ● | ● | ||||||||||||||||||||||||||||||
| Floods, earthquakes, typhoons | ● | ● | ● | ● | ● | ● | ● | ● | ● | ● | ● | ● | ● | ● | ● | ● | ● | ● | ● | |||||||||||||||||||
| Disease | ● | ● | ● | |||||||||||||||||||||||||||||||||||
| Political instability | ● | ● | ● | ● | ● | ● | ● | ● | ● | ● | ● | ● | ● | |||||||||||||||||||||||||
| Government regulations, policy supervision and other risks | ● | ● | ● | ● | ● | ● | ● | ● | ● | ● | ● | ● | ● | ● | ● | ● | ● | ● | ● | ● | ● | ● | ||||||||||||||||
| Environmental degradation and environmental awareness | ● | ● | ● | |||||||||||||||||||||||||||||||||||
| Enterprise product supply | Product safety and quality | ● | ● | ● | ● | ● | ● | ● | ● | ● | ● | ● | ● | ● | ● | ● | ● | ● | ● | |||||||||||||||||||
| Production capacity is insufficient | ● | ● | ● | ● | ● | ● | ● | |||||||||||||||||||||||||||||||
| Risk of waste discharge | ● | ● | ● | |||||||||||||||||||||||||||||||||||
| Customized design concepts | ● | ● | ● | ● | ● | ● | ● | ● | ● | ● | ● | ● | ||||||||||||||||||||||||||
| Delivery process is damaged or delayed | ● | ● | ● | ● | ● | ● | ● | ● | ● | ● | ● | ● | ||||||||||||||||||||||||||
| Poor traffic regulations | ● | ● | ● | ● | ● | ● | ● | ● | ● | ● | ● | ● | ||||||||||||||||||||||||||
| Impact of natural disasters and accidents on logistic | ● | ● | ● | ● | ● | |||||||||||||||||||||||||||||||||
| The delivery was misdelivered and delayed | ● | ● | ● | ● | ● | ● | ● | ● | ||||||||||||||||||||||||||||||
| Commodity price fluctuation | ● | ● | ● | |||||||||||||||||||||||||||||||||||
| Inventories are too low or too high | ● | ● | ● | ● | ● | ● | ● | ● | ● | ● | ● | ● | ● | ● | ● | ● | ||||||||||||||||||||||
| Lack of warehouse space | ● | ● | ● | ● | ● | ● | ● | ● | ● | ● | ● | |||||||||||||||||||||||||||
| The workshop and other production working environment is poor | ● | ● | ● | |||||||||||||||||||||||||||||||||||
| Lack of planning and organization | ● | ● | ● | ● | ||||||||||||||||||||||||||||||||||
| Long product lead time | ● | ● | ● | ● | ● | ● | ● | ● | ● | ● | ● | |||||||||||||||||||||||||||
| Failure to deliver on time, affecting customer expectations | ● | ● | ● | ● | ||||||||||||||||||||||||||||||||||
| Suppliers material supply | Cooperation risk, breach of commitment | ● | ● | ● | ● | ● | ● | ● | ● | ● | ||||||||||||||||||||||||||||
| Failure of key suppliers | ● | ● | ● | ● | ● | |||||||||||||||||||||||||||||||||
| Limited green suppliers | ● | ● | ● | ● | ● | ● | ● | ● | ● | ● | ● | ● | ||||||||||||||||||||||||||
| Supplier capability and reliability | ● | ● | ● | ● | ● | ● | ● | ● | ● | ● | ● | ● | ● | ● | ● | |||||||||||||||||||||||
| Supplier dependence and production delays | ● | ● | ● | ● | ● | ● | ● | ● | ||||||||||||||||||||||||||||||
| The supplier reassigned the goods for delay | ● | ● | ● | ● | ● | ● | ● | ● | ● | ● | ||||||||||||||||||||||||||||
| Disruption or delay of goods due to inadequate supply liquidity and poor financial conditions | ● | ● | ● | ● | ● | ● | ● | ● | ● | ● | ● | ● | ● | ● | ||||||||||||||||||||||||
| The company’s market share has decreased | ● | |||||||||||||||||||||||||||||||||||||
| Reductions in poor-quality materials have resulted in termination of supply | ● | ● | ● | ● | ● | ● | ● | ● | ● | ● | ● | ● | ● | |||||||||||||||||||||||||
| Risk of material orders in delivery | ● | ● | ● | ● | ● | ● | ● | ● | ● | ● | ● | ● | ||||||||||||||||||||||||||
| Supplier product quality supervision | ● | ● | ● | ● | ● | ● | ● | |||||||||||||||||||||||||||||||
| Single procurement policy | ● | ● | ● | ● | ● | ● | ● | ● | ● | ● | ||||||||||||||||||||||||||||
| Fluctuation of purchase price | ● | ● | ● | ● | ● | ● | ● | ● | ● | ● | ● | ● | ● | ● | ● | ● | ● | ● | ● | ● | ● | ● | ||||||||||||||||
| Meet demand and reduce inventory | ● | ● | ||||||||||||||||||||||||||||||||||||
| Raw material shortage, availability | ● | ● | ● | ● | ● | |||||||||||||||||||||||||||||||||
| Supplies are out of stock due to interruption of source | ● | ● | ● | ● | ● | ● | ● | ● | ● | ● | ● | ● | ||||||||||||||||||||||||||
| Human resource dimensions | External human attack, error | ● | ● | ● | ● | ● | ● | ● | ● | ● | ● | ● | ● | |||||||||||||||||||||||||
| Insurrection, war terrorism | ● | ● | ● | ● | ● | |||||||||||||||||||||||||||||||||
| Man-made accidents | ● | ● | ● | ● | ||||||||||||||||||||||||||||||||||
| The labor dispute led to a strike | ● | ● | ● | |||||||||||||||||||||||||||||||||||
| Child labor, forced labor | ● | |||||||||||||||||||||||||||||||||||||
| Omit supervision during homework | ● | ● | ● | ● | ● | ● | ● | ● | ● | ● | ● | ● | ||||||||||||||||||||||||||
| Employee’s illegal operation | ● | ● | ● | ● | ● | ● | ||||||||||||||||||||||||||||||||
| The staff information was leaked | ● | ● | ||||||||||||||||||||||||||||||||||||
| People are not skilled, the operation is wrong | ● | ● | ● | ● | ● | ● | ● | ● | ● | ● | ● | ● | ● | ● | ● | |||||||||||||||||||||||
| Labour is not being used efficiently | ● | ● | ● | ● | ● | ● | ||||||||||||||||||||||||||||||||
| Credibility and competence of operators and leaders | ● | ● | ● | ● | ● | |||||||||||||||||||||||||||||||||
| High level management involvement is low | ● | |||||||||||||||||||||||||||||||||||||
| Improper organizational and management skills | ● | ● | ● | ● | ● | ● | ● | |||||||||||||||||||||||||||||||
| Misstaffing | ● | ● | ● | |||||||||||||||||||||||||||||||||||
| Inadequate personnel training and guidance | ● | ● | ● | ● | ● | ● | ● | |||||||||||||||||||||||||||||||
| Enterprise interior and equipment aspect | Information equipment failure | ● | ● | ● | ||||||||||||||||||||||||||||||||||
| Inadequate information security and leakage | ● | ● | ● | |||||||||||||||||||||||||||||||||||
| Information system instability | ● | ● | ● | ● | ● | ● | ● | ● | ● | ● | ● | ● | ||||||||||||||||||||||||||
| Insufficient information method concepts and tools | ● | ● | ● | ● | ● | ● | ● | ● | ● | ● | ● | ● | ||||||||||||||||||||||||||
| Availability and accuracy of information | ● | ● | ● | ● | ● | |||||||||||||||||||||||||||||||||
| Risk factors for information transmission | ● | ● | ||||||||||||||||||||||||||||||||||||
| IT and information sharing risks | ● | ● | ● | ● | ● | ● | ● | |||||||||||||||||||||||||||||||
| Risk awareness of the enterprise | ● | |||||||||||||||||||||||||||||||||||||
| Reasons for delay in delivery due to difficulties in changing equipment to production mode | ● | ● | ● | ● | ||||||||||||||||||||||||||||||||||
| Technical change or malfunction of equipment | ● | ● | ● | ● | ● | ● | ● | ● | ● | ● | ● | ● | ● | ● | ● | ● | ● | ● | ● | ● | ● | |||||||||||||||||
| Improper equipment selection and management | ● | |||||||||||||||||||||||||||||||||||||
| Degree of process informatization | ● | |||||||||||||||||||||||||||||||||||||
| Production process, technology standard degree | ● | ● | ● | ● | ||||||||||||||||||||||||||||||||||
| Inappropriate/unavailable test method | ● | ● | ||||||||||||||||||||||||||||||||||||
| Change the IT system and failure | ● | ● | ● | ● | ● | ● | ● | ● | ● | ● | ● | ● | ● | ● | ● | ● | ||||||||||||||||||||||
| Supply chain accidents, delivery delays and a drop in the company’s reputation | ● | |||||||||||||||||||||||||||||||||||||
| Data missing, unable to render part of the information | ● | ● | ● | ● | ● | ● | ||||||||||||||||||||||||||||||||
| The company’s financial processing and control process, management policy errors | ● | ● | ● | ● | ● | ● | ● | |||||||||||||||||||||||||||||||
| Inadequate ability to predict risks | ● | ● | ● | ● | ● | ● | ● | ● | ● | ● | ● | ● | ● | ● | ● | |||||||||||||||||||||||
| Changes in Shareholder Structure | ● | ● | ● | ● | ● | ● | ● | ● | ● | ● | ● | ● | ● | ● | ● | |||||||||||||||||||||||
| Brand reputation is damaged, corporate culture is consistent | ● | ● | ● | ● | ● | ● | ● | ● | ||||||||||||||||||||||||||||||
| Ineffective strategic public relations performance | ● | ● | ● | |||||||||||||||||||||||||||||||||||
| Customer relations are not good | ● | ● | ● | ● | ● | ● | ● | ● | ||||||||||||||||||||||||||||||
| Failure to respond to preferences | ● | |||||||||||||||||||||||||||||||||||||
| The bullwhip effect | ● | ● | ||||||||||||||||||||||||||||||||||||
| Scholars | 1: Cai et al. (2020) [67]; 2: Syed et al. (2019) [9]; 3: Deng et al. (2019) [61]; 4: Rostamzadeh et al. (2018) [53]; 5: Valanarasu et al. (2018) [68]; 6: Gautam et al. (2018) [69]; 7: Qazi et al. (2018) [70]; 8: Helmi et al. (2017) [71]; 9: Song et al. (2016) [10]; 10: Giannakis et al. (2016) [72]; 11: Dong et al. (2016) [73]; 12: Mangla et al. (2015) [74]; 13: Guertler (2015) [75]; 14: Aqlan et al. (2015) [76]; 15: Lavastre et al. (2014) [77]; 16: Badea et al. (2014) [78]; 17: Zhang and Cheng (2014) [79]; 18: Sentia et al. (2013) [80]; 19: Wang et al. (2012) [81]; 20: Sofyalıoğlu et al. (2012) [82]; 21: Tang et al. (2011) [83]; 22: Isaksson and Seifert (2016) [84]; 23: Dominguez-Bello et al. (2016) [85]; 24: Koblen and Škůrková (2015) [86]; 25: Mohammaddust et al. (2015) [87]; 26: Song et al. (2015) [88]; 27: Ouyang et al. (2015) [89]; 28: Mackelprang and Malhotra. (2015) [90]; 29: Cheng et al. (2015) [91]; 30: Cao et al. (2014) [92]; 31: Alhawari et al. (2012) [93]; 32: Jereb et al. (2012) [94]; 33: Thun and Hoenig (2009) [95]; 34: Wagner and Bode (2008) [96]; 35: Jüttner et al. (2003) [97]; 36: Van Landeghem and Vanmaele (2002) [98]; 37: Christopher and Lee (2001) [99] | |||||||||||||||||||||||||||||||||||||
Table A2.
Proposed agility criteria for supply chain by scholars.
Table A2.
Proposed agility criteria for supply chain by scholars.
| Agility Criteria for Supply Chain | 1 | 2 | 3 | 4 | 5 | 6 | 7 | 8 | 9 | 10 | 11 | 12 | 13 | 14 | 15 | 16 | 17 | 18 | 19 | 20 | |
|---|---|---|---|---|---|---|---|---|---|---|---|---|---|---|---|---|---|---|---|---|---|
| Cooperative competition | Integration of supply chain partners | ● | ● | ● | ● | ||||||||||||||||
| Work with suppliers to plan purchasing, manufacturing and logistics operations | ● | ● | |||||||||||||||||||
| Long-term cooperation and strengthening of trust relationship with partners | ● | ● | ● | ● | ● | ● | ● | ● | ● | ● | ● | ● | |||||||||
| Work with partners to develop core competitiveness | ● | ● | |||||||||||||||||||
| Leverage the capabilities of your partners | ● | ● | ● | ||||||||||||||||||
| Work with partners to improve product quality, social benefits and environmental health and safety | ● | ● | |||||||||||||||||||
| Select partners with better performance and basic capabilities/work with agile vendors | ● | ● | ● | ||||||||||||||||||
| Actively set up information sharing platform with partners | ● | ● | ● | ● | ● | ● | ● | ● | |||||||||||||
| To jointly promote modular production, can quickly respond to market demand | ● | ● | ● | ||||||||||||||||||
| Set up a team joint operation mode of cross-departmental cooperation | ● | ● | ● | ● | ● | ● | ● | ||||||||||||||
| Information technology | Information data integration | ● | ● | ● | ● | ● | ● | ● | ● | ||||||||||||
| Data accuracy | ● | ● | |||||||||||||||||||
| Using information technology | ● | ● | ● | ● | ● | ● | |||||||||||||||
| Electronic shipment of finished products to facilitate control of shipment operations | ● | ● | ● | ||||||||||||||||||
| Adopt e-business | ● | ||||||||||||||||||||
| Transparent visualization of information in the upper, middle and lower reaches of the supply chain, which can quickly respond to customer needs | ● | ● | |||||||||||||||||||
| Enhance the speed and accuracy of order processing | ● | ||||||||||||||||||||
| Market supply | Improving market sensitivity/avoiding the game behavior in the case of shortage | ● | ● | ● | ● | ● | |||||||||||||||
| Meet changing needs/respond to changing corporate environment and market needs | ● | ● | ● | ● | ● | ● | ● | ● | ● | ● | ● | ● | |||||||||
| Forecasting/responding to market demand/forward-looking | ● | ● | ● | ● | ● | ● | ● | ● | |||||||||||||
| Identify threats in the environment | |||||||||||||||||||||
| Continuously improve/enhance the competitiveness of the enterprise against the market and environment | ● | ● | ● | ● | |||||||||||||||||
| Collect customer and competitor market information to determine relevant strategies | ● | ● | |||||||||||||||||||
| Develop future potential customers as new market opportunities | ● | ||||||||||||||||||||
| Customer relationship | Reduce delivery time/delivery time control | ● | ● | ● | ● | ● | ● | ● | ● | ● | ● | ● | ● | ||||||||
| Rapid new product launch/increase the frequency of new product introduction to market | ● | ● | ● | ● | ● | ● | |||||||||||||||
| Improve customer service | ● | ● | ● | ● | ● | ||||||||||||||||
| Use order-driven rather than forecast-driven | ● | ● | |||||||||||||||||||
| Provide customized products | ● | ● | ● | ● | ● | ● | ● | ● | |||||||||||||
| Quick customer response | ● | ● | ● | ● | ● | ● | ● | ● | ● | ● | ● | ||||||||||
| Improve delivery reliability | ● | ● | ● | ● | ● | ● | ● | ||||||||||||||
| Provide customer satisfaction | ● | ● | ● | ● | ● | ● | ● | ||||||||||||||
| Provide customers with high value added products | ● | ||||||||||||||||||||
| Design user-friendly/socially compliant products | ● | ● | |||||||||||||||||||
| Manufacturing technology capability | Develop flexible production technology | ● | ● | ||||||||||||||||||
| Make flexible products/reduce the complexity of the product design process | ● | ● | ● | ● | ● | ● | |||||||||||||||
| Set up a virtual enterprise | ● | ● | ● | ● | ● | ● | ● | ● | |||||||||||||
| Reduce facility setup and switching time and increase the production quantity of products | ● | ● | ● | ● | |||||||||||||||||
| Raise awareness of technology and information technology | ● | ● | ● | ||||||||||||||||||
| Introduce appropriate information technology and incorporate new hardware, software and new products | ● | ● | ● | ● | ● | ● | |||||||||||||||
| Shorten manufacturing lead time/shorten lead time quick response/implement synchronous engineering | ● | ● | ● | ● | ● | ● | ● | ||||||||||||||
| Shorten the development cycle time/enhance the research and development ability of innovative products/launch frequency of new products | ● | ● | ● | ● | ● | ● | ● | ● | ● | ● | ● | ||||||||||
| Reduce production time for new products | ● | ● | |||||||||||||||||||
| Manufacturing flexibility/manufacturing flexibility/agile manufacturing | ● | ● | ● | ● | |||||||||||||||||
| Product greenness/product life cycle | ● | ● | |||||||||||||||||||
| Improve logistics capability/purchasing capability/build agile logistics | ● | ● | |||||||||||||||||||
| Quality improvement | ● | ● | ● | ● | ● | ● | ● | ● | ● | ● | ● | ● | |||||||||
| Organization and team management | Distributed Decision Models | ● | ● | ● | ● | ● | ● | ||||||||||||||
| Manage the core competitiveness of the enterprise | ● | ● | ● | ||||||||||||||||||
| Continuously cultivate multi-skilled and flexible employees and improve their working ability | ● | ● | ● | ● | ● | ● | |||||||||||||||
| Build a culture that can change with The Times | ● | ● | ● | ● | ● | ||||||||||||||||
| Developing a knowledge-driven enterprise | ● | ● | ● | ||||||||||||||||||
| Process integration | ● | ● | ● | ● | ● | ● | ● | ● | ● | ● | ● | ||||||||||
| Cost minimization | ● | ||||||||||||||||||||
| Establish a reward system | ● | ● | ● | ● | |||||||||||||||||
| Reducing uncertainty | ● | ● | |||||||||||||||||||
| Enhance brand value | ● | ● | |||||||||||||||||||
| Production and sales capability | ● | ● | |||||||||||||||||||
| Quick decision/strategic flexibility | ● | ● | |||||||||||||||||||
| Scholars | 1: Haq et al. (2020) [120]; 2:Rasi et al. (2019) [121]; 3: Jermsittiparsert et al. (2019) [122]; 4: Mohammadi (2019) [123]; 5: Sˆderberg et al. (2018) [124]; 6: Chan et al. (2017) [125]; 7: Bargshady et al. (2016) [108]; 8: Yoon et al. (2014) [126]; 9: Mishra et al. (2014) [127]; 10: Chakraborty and Mandal (2011) [128]; 11:Wu (2019) [129]; 12: Dastyar et al. (2018) [130]; 13: Shahin et al. (2017) [131]; 14: Sangari et al. (2016) [132]; 15:Yang (2014) [133]; 16: Jakhar et al. (2013) [134]; 17: Saleeshya et al. (2012) [135]; 18: Pandey et al. (2009) [136]; 19: Faisal et al. (2007) [137]; 20: Swafford et al. (2006) [119] | ||||||||||||||||||||
References
- Wang, M.; Luan, J.; Li, X.; Zhu, X. Sustainable Decisions in a high-tech electronic product supply chain considering environmental effort and social responsibility: A hierarchical bi-level intelligent approach. IAENG Int. J. Appl. Math. 2021, 51, 1–16. [Google Scholar]
- Esfahbodi, A.; Zhang, Y. Sustainable supply chain management in developed vs. emerging economies: Evidence from the UK and China’s manufacturing industry. In Encyclopedia of Renewable and Sustainable Materials; Hashmi, S., Choudhury, I.A., Eds.; Elsevier: Amsterdam, The Netherlands, 2020; pp. 537–549. [Google Scholar]
- Rajesh, R.; Ravi, V. Modeling enablers of supply chain risk mitigation in electronic supply chains: A Grey–DEMATEL approach. Comput. Ind. Eng. 2015, 87, 126–139. [Google Scholar] [CrossRef]
- Rajesh, R. A grey-layered ANP based decision support model for analyzing strategies of resilience in electronic supply chains. Eng. Appl. Artif. Intell. 2020, 87, 103338. [Google Scholar] [CrossRef]
- Trkman, P.; McCormack, K. Supply chain risk in turbulent environments—A conceptual model for managing supply chain network risk. Int. J. Prod. Econ. 2009, 119, 247–258. [Google Scholar] [CrossRef]
- Svensson, G.; Wagner, B. Implementing and managing economic, social and environmental efforts of business sustainability: Propositions for measurement and structural models. Manag. Environ. Qual. Int. J. 2015, 26, 195–213. [Google Scholar] [CrossRef]
- Carter, C.R.; Liane Easton, P. Sustainable supply chain management: Evolution and future directions. Int. J. Phys. Distrib. Logist. Manag. 2011, 41, 46–62. [Google Scholar] [CrossRef]
- Gouda, S.K.; Saranga, H. Sustainable supply chains for supply chain sustainability: Impact of sustainability efforts on supply chain risk. Int. J. Prod. Res. 2018, 56, 5820–5835. [Google Scholar] [CrossRef]
- Syed, M.W.; Li, J.Z.; Junaid, M.; Ye, X.; Ziaullah, M. An empirical examination of sustainable supply chain risk and integration practices: A performance-based evidence from Pakistan. Sustainability 2019, 11, 5334. [Google Scholar] [CrossRef]
- Song, W.; Ming, X.; Liu, H.C. Identifying critical risk factors of sustainable supply chain management: A rough strength-relation analysis method. J. Clean. Prod. 2016, 143, 100–115. [Google Scholar] [CrossRef]
- Abdel-Basset, M.; Mohamed, R. A novel plithogenic TOPSIS-CRITIC model for sustainable supply chain risk management. J. Clean. Prod. 2020, 247, 119586. [Google Scholar] [CrossRef]
- Moktadir, M.A.; Dwivedi, A.; Khan, N.S.; Paul, S.K.; Khan, S.A.; Sultana, R. Analysis of risk factors in sustainable supply chain management in an emerging economy of leather industry. J. Clean. Prod. 2021, 283, 124641. [Google Scholar] [CrossRef]
- Hosseini, S.; Ivanov, D.; Dolgui, A. Review of quantitative methods for supply chain resilience analysis. Transp. Res. Part E: Logist. Transp. Rev. 2019, 125, 285–307. [Google Scholar] [CrossRef]
- Um, J.; Han, N. Understanding the relationships between global supply chain risk and supply chain resilience: The role of mitigating strategies. Supply Chain. Manag. Int. J. 2020, 26, 240–255. [Google Scholar] [CrossRef]
- Hsu, C.H.; Chang, A.Y.; Zhang, T.Y.; Lin, W.D.; Liu, W.L. Deploying resilience enablers to mitigate risks in sustainable fashion supply chains. Sustainability 2021, 13, 2943. [Google Scholar] [CrossRef]
- Pellegrino, R.; Costantino, N.; Tauro, D. The value of flexibility in mitigating supply chain transportation risks. Int. J. Prod. Res. 2020, 59, 6252–6269. [Google Scholar] [CrossRef]
- Khan, O.; Greaves, Y.C. Mitigating supply chain risk through improved agility: Lessons from a UK retailer. Int. J. Agil. Syst. Manag. 2008, 3, 263–281. [Google Scholar] [CrossRef]
- Braunscheidel, M.J.; Suresh, N.C. The organizational antecedents of a firm’s supply chain agility for risk mitigation and response. J. Oper. Manag. 2009, 27, 119–140. [Google Scholar] [CrossRef]
- Mishra, S.; Mahapatra, S.S.; Datta, S. Agility evaluation in fuzzy context: Influence of decision-makers’ risk bearing attitude. Benchmarking: Int. J. 2014, 21, 1084–1119. [Google Scholar] [CrossRef]
- Zanjirchi, S.M.; Jalilian, N.; Mirhoseini, A. Risk-agility interactive model: A new look at agility drivers. J. Model. Manag. 2017, 12, 690–711. [Google Scholar] [CrossRef]
- Rasi, R.E.; Hatami, D. Environmental risk and innovation in supply chain: Analysis of influence of supply chain agility. J. Syst. Manag. Sci. 2019, 9, 1–25. [Google Scholar]
- Abeysekara, M.N.P.; Wang, H.; Kuruppuarachchi, D. Antecedent role of risk management culture to drive firm performance and competitive advantage with the mediation effect of agility in resilient supply chains. Int. J. Inf. Bus. Manag. 2019, 11, 10–29. [Google Scholar]
- Arifin, A.Z.; Yanuar; Nuryasman. Exploring the link between supply chain agility, supply chain cost, supply chain responsiveness, global supply chain risk management, and contribution in global manufacturing: An indonesian perspective. Int. J. Supply Chain. Manag. 2018, 7, 353–366. [Google Scholar]
- Jajja, M.S.S.; Chatha, K.A.; Farooq, S. Impact of supply chain risk on agility performance: Mediating role of supply chain integration. Int. J. Prod. Econ. 2018, 205, 118–138. [Google Scholar] [CrossRef]
- Ganguly, A.; Chatterjee, D.; Rao, H.V. Evaluating the risks associated with supply chain agility of an enterprise. Int. J. Bus. Anal. 2017, 4, 15–34. [Google Scholar] [CrossRef]
- Mandal, S.; Dubey, R.K. Role of tourism IT adoption and risk management orientation on tourism agility and resilience: Impact on sustainable tourism supply chain performance. Int. J. Tour. Res. 2020, 22, 1–14. [Google Scholar] [CrossRef]
- Bhatti, M.A.; Nawaz, M.A. The impacts of tourism risk management, IT adoption, agility and resilience on the sustainable tourism supply chain performance of Maldives’ tourism industry. Irasd J. Manag. 2020, 2, 100–108. [Google Scholar] [CrossRef]
- Aziz, K.; Rahman, A.A.; Kamarulzaman, N.H.; Sambasivan, M. The impact of supply chain risk on agility practices: A theoretical review and a critique. Asian J. Bus. Manag. 2015, 3, 1. [Google Scholar]
- Ali, S.M.; Moktadir, M.A.; Kabir, G.; Chakma, J.; Rumi, M.J.U.; Islam, M.T. Framework for evaluating risks in food supply chain: Implications in food wastage reduction. J. Clean. Prod. 2019, 228, 786–800. [Google Scholar]
- Romli, A.; Prickett, P.; Setchi, R.; Soe, S. Integrated eco-design decision-making for sustainable product development. Int. J. Prod. Res. 2015, 53, 549–571. [Google Scholar] [CrossRef]
- Li, M.; Jin, L.; Wang, J. A new MCDM method combining QFD with TOPSIS for knowledge management system selection from the user’s perspective in intuitionistic fuzzy environment. Appl. Soft Comput. 2014, 21, 28–37. [Google Scholar] [CrossRef]
- Yazdani, M.; Chatterjee, P.; Zavadskas, E.K.; Zolfani, S.H. Integrated QFD-MCDM framework for green supplier selection. J. Clean. Prod. 2017, 142, 3728–3740. [Google Scholar] [CrossRef]
- Wang, X.; Fang, H.; Song, W. Technical attribute prioritisation in QFD based on cloud model and grey relational analysis. Int. J. Prod. Res. 2020, 58, 5751–5768. [Google Scholar] [CrossRef]
- Wang, H.; Fang, Z.; Wang, D.; Liu, S. An integrated fuzzy QFD and grey decision-making approach for supply chain collaborative quality design of large complex products. Comput. Ind. Eng. 2020, 140, 106212. [Google Scholar] [CrossRef]
- Mahmood, W.H.W.; Azlan, U.A.A. QFD approach in determining the best practices for green supply chain management in composite technology manufacturing industries. Malays. J. Compos. Sci. Manuf. 2020, 1, 45–56. [Google Scholar] [CrossRef]
- Miranbeigi, M.; Moshiri, B.; Rahimi-Kian, A.; Razmi, J. Demand satisfaction in supply chain management system using a full online optimal control method. Int. J. Adv. Manuf. Technol. 2015, 77, 1401–1417. [Google Scholar] [CrossRef]
- Dotoli, M.; Fanti, M.P.; Meloni, C.; Zhou, M.C. A multi-level approach for network design of integrated supply chains. Int. J. Prod. Res. 2005, 43, 4267–4287. [Google Scholar] [CrossRef]
- Wu, N.; Mao, N.; Qian, Y. An approach to partner selection in agile manufacturing. J. Intell. Manuf. 1999, 10, 519–529. [Google Scholar] [CrossRef]
- Dotoli, M.; Fanti, M.P.; Meloni, C.; Zhou, M. Design and optimization of integrated e-supply chain for agile and environmentally conscious manufacturing. IEEE Trans. Syst. Man Cybern. -Part A Syst. Hum. 2006, 36, 62–75. [Google Scholar] [CrossRef]
- Liu, H.C.; Quan, M.Y.; Li, Z.; Wang, Z.L. A new integrated MCDM model for sustainable supplier selection under interval-valued intuitionistic uncertain linguistic environment. Inf. Sci. 2019, 486, 254–270. [Google Scholar] [CrossRef]
- Beske, P.; Land, A.; Seuring, S. Sustainable supply chain management practices and dynamic capabilities in the food industry: A critical analysis of the literature. Int. J. Prod. Econ. 2014, 152, 131–143. [Google Scholar] [CrossRef]
- Ehtesham Rasi, R.; Sohanian, M. A multi-objective optimization model for sustainable supply chain network with using genetic algorithm. J. Model. Manag. 2021, 16, 714–727. [Google Scholar] [CrossRef]
- Chowdhury, H.M.M.; Quaddus, M.A. Supply chain sustainability practices and governance for mitigating sustainability risk and improving market performance: A dynamic capability perspective. J. Clean. Prod. 2020, 278, 123521. [Google Scholar] [CrossRef]
- Zhang, L.; Hu, H.; Zhang, D. A credit risk assessment model based on SVM for small and medium enterprises in supply chain finance. Financ. Innov. 2015, 1, 1–21. [Google Scholar] [CrossRef]
- Weng, X.; Lü, X.; Wu, Y. Research on the credit risk management of small and medium-sized enterprises based on supply chain finance. J. Financ. Account. 2016, 4, 245–253. [Google Scholar] [CrossRef]
- Xie, X.; Yang, Y.; Gu, J.; Zhou, Z. Research on the contagion effect of associated credit risk in supply chain based on dual-channel financing mechanism. Environ. Res. 2020, 184, 109356. [Google Scholar] [CrossRef]
- Oliva, F.L. A maturity model for enterprise risk management. Int. J. Prod. Econ. 2016, 173, 66–79. [Google Scholar] [CrossRef]
- Levner, E.; Ptuskin, A. Entropy-based model for the ripple effect: Managing environmental risks in supply chains. Int. J. Prod. Res. 2018, 56, 2539–2551. [Google Scholar] [CrossRef]
- De Oliveira, F.N.; Leiras, A.; Ceryno, P. Environmental risk management in supply chains: A taxonomy, a framework and future research avenues. J. Clean. Prod. 2019, 232, 1257–1271. [Google Scholar] [CrossRef]
- Cunha, L.; Ceryno, P.; Leiras, A. Social supply chain risk management: A taxonomy, a framework and a research agenda. J. Clean. Prod. 2019, 220, 1101–1110. [Google Scholar] [CrossRef]
- Langholtz, M.; Webb, E.; Preston, B.L.; Turhollow, A.; Breuer, N.; Eaton, L.; King, A.W.; Sokhansanj, S.; Nair, S.S.; Downing, M. Climate risk management for the US cellulosic biofuels supply chain. Clim. Risk Manag. 2014, 3, 96–115. [Google Scholar] [CrossRef]
- Liu, J.; Yin, Y.; Yan, S. Research on clean energy power generation-energy storage-energy using virtual enterprise risk assessment based on fuzzy analytic hierarchy process in China. J. Clean. Prod. 2019, 236, 117471. [Google Scholar] [CrossRef]
- Rostamzadeh, R.; Ghorabaee, M.K.; Govindan, K.; Esmaeili, A.; Nobar, H.B.K. Evaluation of sustainable supply chain risk management using an integrated fuzzy TOPSIS-CRITIC approach. J. Clean. Prod. 2018, 175, 651–669. [Google Scholar] [CrossRef]
- Boiral, O.; Talbot, D.; Brotherton, M.C. Measuring sustainability risks: A rational myth? Bus. Strategy Environ. 2020, 29, 2557–2571. [Google Scholar] [CrossRef]
- Hallikas, J.; Lintukangas, K.; Kähkönen, A.K. The effects of sustainability practices on the performance of risk management and purchasing. J. Clean. Prod. 2020, 263, 121579. [Google Scholar] [CrossRef]
- Galaz, V.; Centeno, M.A.; Callahan, P.W.; Causevic, A.; Patterson, T.; Brass, I.; Baum, S.; Farber, D.; Fischer, J.; Garcia, D.; et al. Artificial intelligence, systemic risks, and sustainability. Technol. Soc. 2021, 67, 121579. [Google Scholar] [CrossRef]
- Sakli, L.; Hennet, J.C.; Mercantini, J.M. An analysis of risks and vulnerabilities in supply networks. IFAC Proc. Vol. 2014, 47, 8933–8938. [Google Scholar] [CrossRef]
- Rao, C.; Xiao, X.; Goh, M.; Zheng, J.; Wen, J. Compound mechanism design of supplier selection based on multi-attribute auction and risk management of supply chain. Comput. Ind. Eng. 2017, 105, 63–75. [Google Scholar] [CrossRef]
- Mavi, R.K.; Goh, M.; Mavi, N.K. Supplier selection with Shannon entropy and fuzzy TOPSIS in the context of supply chain risk management. Procedia-Soc. Behav. Sci. 2016, 235, 216–225. [Google Scholar] [CrossRef]
- Liu, L.; Liu, X.; Liu, G. The risk management of perishable supply chain based on coloured Petri Net modeling. Inf. Processing Agric. 2018, 5, 47–59. [Google Scholar] [CrossRef]
- Deng, X.; Yang, X.; Zhang, Y.; Li, Y.; Lu, Z. Risk propagation mechanisms and risk management strategies for a sustainable perishable products supply chain. Comput. Ind. Eng. 2019, 135, 1175–1187. [Google Scholar] [CrossRef]
- Jiang, X.; Qing, P.; Yang, Y. Risk management of Baijiu sustainable supply chain in China. Financ. Eng. Risk Manag. 2020, 3, 31–44. [Google Scholar]
- Badenhorst-Weiss, J.A.; Naudé, R.T. The challenges behind producing a bottle of wine: Supply chain risks. J. Transp. Supply Chain. Manag. 2020, 14, 1–15. [Google Scholar]
- Mzougui, I.; Carpitella, S.; Certa, A.; El Felsoufi, Z.; Izquierdo, J. Assessing supply chain risks in the automotive industry through a modified MCDM-based FMECA. Processes 2020, 8, 579. [Google Scholar] [CrossRef]
- Auer, V.; Rauch, P. Wood supply chain risks and risk mitigation strategies: A systematic review focusing on the Northern hemisphere. Biomass Bioenergy 2021, 148, 106001. [Google Scholar] [CrossRef]
- Zou, Z.; Farnoosh, A.; Mcnamara, T. Risk analysis in the management of a green supply chain. Strateg. Change 2021, 30, 5–17. [Google Scholar] [CrossRef]
- Cai, X.; Qian, Y.; Bai, Q.; Liu, W. Exploration on the financing risks of enterprise supply chain using Back Propagation neural network. J. Comput. Appl. Math. 2020, 367, 112457. [Google Scholar] [CrossRef]
- Valanarasu, R.; Christy, A. Risk assessment and management in enterprise resource planning by advanced system engineering theory. Int. J. Bus. Intell. Data Min. 2018, 13, 3–14. [Google Scholar] [CrossRef]
- Gautam, A.; Prakash, S.; Soni, U. Supply chain risk management and quality: A case study and analysis of Indian automotive industry. Int. J. Intell. Enterp. 2018, 5, 194–212. [Google Scholar] [CrossRef]
- Qazi, A.; Dickson, A.; Quigley, J.; Gaudenzi, B. Supply chain risk network management: A Bayesian belief network and expected utility based approach for managing supply chain risks. Int. J. Prod. Econ. 2018, 196, 24–42. [Google Scholar] [CrossRef]
- Helmi, M.N.; Masri, M.N. Risk mapping and mitigation design of small and medium enterprises clothing products using supply chain risk management. IOP Conf. Ser. Mater. Sci. Eng. 2017, 277, 012061. [Google Scholar] [CrossRef]
- Giannakis, M.; Papadopoulos, T. Supply chain sustainability: A risk management approach. Int. J. Prod. Econ. 2016, 171, 455–470. [Google Scholar] [CrossRef]
- Dong, Q.; Cooper, O. An orders-of-magnitude AHP supply chain risk assessment framework. Int. J. Prod. Econ. 2016, 182, 144–156. [Google Scholar] [CrossRef]
- Mangla, S.K.; Kumar, P.; Barua, M.K. Prioritizing the responses to manage risks in green supply chain: An Indian plastic manufacturer perspective. Sustain. Prod. Consum. 2015, 1, 67–86. [Google Scholar] [CrossRef]
- Guertler, B.; Spinler, S. When does operational risk cause supply chain enterprises to tip? A simulation of intra-organizational dynamics. Omega 2015, 57, 54–69. [Google Scholar] [CrossRef]
- Aqlan, F.; Lam, S.S. A fuzzy-based integrated framework for supply chain risk assessment. Int. J. Prod. Econ. 2015, 161, 54–63. [Google Scholar] [CrossRef]
- Lavastre, O.; Gunasekaran, A.; Spalanzani, A. Effect of firm characteristics, supplier relationships and techniques used on supply chain risk management (SCRM): An empirical investigation on French industrial firms. Int. J. Prod. Res. 2014, 52, 3381–3403. [Google Scholar] [CrossRef]
- Badea, A.; Prostean, G.; Goncalves, G.; Allaoui, H. Assessing risk factors in collaborative supply chain with the analytic hierarchy process (AHP). Procedia Soc. Behav. Sci. 2014, 124, 114–123. [Google Scholar] [CrossRef]
- Zhang, H.; Cheng, N. Risk modelling of retail supply chain based on fuzzy petri nets. Inf. Technol. J. 2014, 13, 1813. [Google Scholar] [CrossRef]
- Sentia, P.D.; Mukhtar, M.; Shukor, S.A. Supply chain information risk management model in Make-to-Order (MTO). Procedia Technol. 2013, 11, 403–410. [Google Scholar] [CrossRef]
- Wang, X.; Chan, H.K.; Yee, R.W.; Diaz-Rainey, I. A two-stage fuzzy-AHP model for risk assessment of implementing green initiatives in the fashion supply chain. Int. J. Prod. Econ. 2012, 135, 595–606. [Google Scholar] [CrossRef]
- Sofyalıoğlu, Ç.; Kartal, B. The selection of global supply chain risk management strategies by using fuzzy analytical hierarchy process—A case from Turkey. Procedia-Soc. Behav. Sci. 2012, 58, 1448–1457. [Google Scholar] [CrossRef]
- Tang, O.; Musa, S.N. Identifying risk issues and research advancements in supply chain risk management. Int. J. Prod. Econ. 2011, 133, 25–34. [Google Scholar] [CrossRef]
- Isaksson, O.H.; Seifert, R.W. Quantifying the bullwhip effect using two-echelon data: A cross-industry empirical investigation. Int. J. Prod. Econ. 2016, 171, 311–320. [Google Scholar] [CrossRef]
- Dominguez-Bello, M.G.; De Jesus-Laboy, K.M.; Shen, N.; Cox, L.M.; Amir, A.; Gonzalez, A.; Bokulich, N.A.; Song, S.J.; Hoashi, M.; Rivera-Vinas, J.I.; et al. Partial restoration of the microbiota of cesarean-born infants via vaginal microbial transfer. Nat. Med. 2016, 22, 250–253. [Google Scholar] [CrossRef] [PubMed]
- Koblen, I.; Škůrková, K.L. Selected aspects of the risk in the supply chain in context of the supplier quality management. Res. Pap. Fac. Mater. Sci. Technol. Slovak Univ. Technol. 2015, 23, 167–178. [Google Scholar] [CrossRef][Green Version]
- Mohammaddust, F.; Rezapour, S.; Farahani, R.Z.; Mofidfar, M.; Hill, A. Developing lean and responsive supply chains: A robust model for alternative risk mitigation strategies in supply chain designs. Int. J. Prod. Econ. 2017, 183, 632–653. [Google Scholar] [CrossRef]
- Song, S.; Zuo, Z.; Cao, Y.; Wang, L. Analysis of social risk causes of rail transit construction projects based on DEMATEL-ISM. In ICTE 2015, Proceedings of the Fifth International Conference on Transportation Engineering, Dalian, China, 26–27 September 2015; American Society of Civil Engineers: Reston, VA, USA, 2015; pp. 1868–1875. [Google Scholar]
- Ouyang, A.J.; Lv, Y.N.; Zhong, H.L.; Wen, J.H.; Wei, X.H.; Peng, H.W.; Zhou, J.; Liu, L.L. Meta-analysis of digoxin use and risk of mortality in patients with atrial fibrillation. Am. J. Cardiol. 2015, 115, 901–906. [Google Scholar] [CrossRef] [PubMed]
- Mackelprang, A.W.; Malhotra, M.K. The impact of bullwhip on supply chains: Performance pathways, control mechanisms, and managerial levers. J. Oper. Manag. 2015, 36, 15–32. [Google Scholar] [CrossRef]
- Cheng, Y.J.; Nie, X.Y.; Chen, X.M.; Lin, X.X.; Tang, K.; Zeng, W.T.; Mei, W.Y.; Liu, L.J.; Long, M.; Yao, F.J.; et al. The role of macrolide antibiotics in increasing cardiovascular risk. J. Am. Coll. Cardiol. 2015, 66, 2173–2184. [Google Scholar] [CrossRef] [PubMed]
- Cao, J.; Peng, L.; Li, R.; Chen, Y.; Li, X.; Mo, B.; Li, X. Nutritional risk screening and its clinical significance in hospitalized children. Clin. Nutr. 2014, 33, 432–436. [Google Scholar] [CrossRef]
- Alhawari, S.; Karadsheh, L.; Talet, A.N.; Mansour, E. Knowledge-based risk management framework for information technology project. Int. J. Inf. Manag. 2012, 32, 50–65. [Google Scholar] [CrossRef]
- Jereb, B.; Cvahte, T.; Rosi, B. Mastering supply chain risks. Serb. J. Manag. 2012, 7, 271–285. [Google Scholar] [CrossRef]
- Thun, J.H.; Hoenig, D. An empirical analysis of supply chain risk management in the German automotive industry. Int. J. Prod. Econ. 2011, 131, 242–249. [Google Scholar] [CrossRef]
- Wagner, S.M.; Bode, C. An empirical examination of supply chain performance along several dimensions of risk. J. Bus. Logist. 2008, 29, 307–325. [Google Scholar] [CrossRef]
- Jüttner, U.; Peck, H.; Christopher, M. Supply chain risk management: Outlining an agenda for future research. Int. J. Logist. Res. Appl. 2003, 6, 197–210. [Google Scholar] [CrossRef]
- Van Landeghem, H.; Vanmaele, H. Robust planning: A new paradigm for demand chain planning. J. Oper. Manag. 2002, 20, 769–783. [Google Scholar] [CrossRef]
- Christopher, M.; Lee, H. Supply Chain Confidence. Working Paper, Cranfield School of Management, UK. 2001. Available online: https://husdal.com/2009/12/07/supply-chain-confidence/ (accessed on 6 November 2021).
- Aslam, H.; Khan, A.Q.; Rashid, K.; Rehman, S.U. Achieving supply chain resilience: The role of supply chain ambidexterity and supply chain agility. J. Manuf. Technol. Manag. 2020, 31, 1185–1204. [Google Scholar] [CrossRef]
- Christopher, M.; Lowson, R.; Peck, H. Creating agile supply chains in the fashion industry. Int. J. Retail. Distrib. Manag. 2004, 32, 367–376. [Google Scholar] [CrossRef]
- Zhang, Z.; Sharifi, H. A methodology for achieving agility in manufacturing organisations. Int. J. Oper. Prod. Manag. 2000, 20, 496–513. [Google Scholar] [CrossRef]
- Gunasekaran, A.; Patel, C.; Tirtiroglu, E. Performance measures and metrics in a supply chain environment. Int. J. Oper. Prod. Manag. 2001, 21, 71–87. [Google Scholar] [CrossRef]
- Vinodh, S.; Prasanna, M. Evaluation of agility in supply chains using multi-grade fuzzy approach. Int. J. Prod. Res. 2011, 49, 5263–5276. [Google Scholar] [CrossRef]
- Dehgani, R.; Navimipour, N.J. The impact of information technology and communication systems on the agility of supply chain management systems. Kybernetes 2019, 48, 2217–2236. [Google Scholar] [CrossRef]
- Mandal, S.; Saravanan, D. Exploring the influence of strategic orientations on tourism supply chain agility and resilience: An empirical investigation. Tour. Plan. Dev. 2019, 16, 612–636. [Google Scholar] [CrossRef]
- Roscoe, S.; Eckstein, D.; Blome, C.; Goellner, M. Determining how internal and external process connectivity affect supply chain agility: A life-cycle theory perspective. Prod. Plan. Control. 2020, 31, 78–91. [Google Scholar] [CrossRef]
- Bargshady, G.; Chegeni, A.; Kamranvand, S.; Zahraee, S.M. A relational study of supply chain agility and firms’ performance in the services providers. Int. Rev. Manag. Mark. 2016, 6, 38–42. [Google Scholar]
- Mirghafoori, S.H.; Andalib, D.; Keshavarz, P. Developing green performance through supply chain agility in manufacturing industry: A case study approach. Corp. Soc. Responsib. Environ. Manag. 2017, 24, 368–381. [Google Scholar] [CrossRef]
- Wu, K.J.; Tseng, M.L.; Chiu, A.S.; Lim, M.K. Achieving competitive advantage through supply chain agility under uncertainty: A novel multi-criteria decision-making structure. Int. J. Prod. Econ. 2017, 190, 96–107. [Google Scholar] [CrossRef]
- Tooranloo, H.S.; Alavi, M.; Saghafi, S. Evaluating indicators of the agility of the green supply chain. Compet. Rev. Int. Bus. J. 2018, 28, 541–563. [Google Scholar]
- Irfan, M.; Wang, M.; Akhtar, N. Enabling supply chain agility through process integration and supply flexibility: Evidence from the fashion industry. Asia Pac. J. Mark. Logist. 2019, 32, 519–547. [Google Scholar] [CrossRef]
- Rasyidi, R.A.; Kusumastuti, R.D. Supply chain agility assessment of an Indonesian humanitarian organization. J. Humanit. Logist. Supply Chain. Manag. 2020, 10, 629–652. [Google Scholar] [CrossRef]
- Shukor, A.A.A.; Newaz, M.S.; Rahman, M.K.; Taha, A.Z. Supply chain integration and its impact on supply chain agility and organizational flexibility in manufacturing firms. Int. J. Emerg. Mark. 2020, 16, 1721–1744. [Google Scholar] [CrossRef]
- Rehman, A.U.; Al-Zabidi, A.; AlKahtani, M.; Umer, U.; Usmani, Y.S. Assessment of supply chain agility to foster sustainability: Fuzzy-DSS for a Saudi manufacturing organization. Processes 2020, 8, 577. [Google Scholar] [CrossRef]
- Al-Zabidi, A.; Rehman, A.U.; Alkahtani, M. An approach to assess sustainable supply chain agility for a manufacturing organization. Sustainability 2021, 13, 1752. [Google Scholar] [CrossRef]
- Jindal, A.; Sharma, S.K.; Sangwan, K.S.; Gupta, G. Modelling supply chain agility antecedents using fuzzy DEMATEL. Procedia CIRP 2021, 98, 436–441. [Google Scholar] [CrossRef]
- Aprilia, A.; Laili, F.; Setyowati, P.B.; Waringga, K.F. The effect of supplier innovation on supply chain agility: Evidence from coffee shops in Malang area. IOP Conf. Ser. Earth Environ. Sci. 2021, 733, 012059. [Google Scholar] [CrossRef]
- Swafford, P.M.; Ghosh, S.; Murthy, N. The antecedents of supply chain agility of a firm: Scale development and model testing. J. Oper. Manag. 2006, 24, 170–188. [Google Scholar] [CrossRef]
- Haq, M.A.; Hameed, I.; Raheem, A. An empirical analysis of behavioral flexibility, relationship integration and strategic flexibility in supply chain agility: Insights from SMEs Sector of Pakistan. South Asian J. Manag. 2020, 14, 104–121. [Google Scholar] [CrossRef][Green Version]
- Rasi, R.E.; Abbasi, R.; Hatami, D. The effect of supply chain agility based on supplier innovation and environmental uncertainty. Int. J. Supply Oper. Manag. 2019, 6, 94–109. [Google Scholar]
- Jermsittiparsert, K.; Srisawat, S. The role of supply chain visibility in enhancing supply chain agility. Int. J. Innov. Creat. Change 2019, 5, 485–501. [Google Scholar]
- Mohammadi, V., Jr. Identifying Pharmaceutical Supply Chain Agility Factors. Master’s Thesis, Tampere University, Tampere, Finland, 2020. [Google Scholar]
- Söderberg, E.; Järlid, S. Designing a Performance Measurement System for Supply Chain Agility; Lund University: Lund, Sweden, 2018. [Google Scholar]
- Chan, A.T.; Ngai, E.W.; Moon, K.K. The effects of strategic and manufacturing flexibilities and supply chain agility on firm performance in the fashion industry. Eur. J. Oper. Res. 2017, 259, 486–499. [Google Scholar] [CrossRef]
- Yoon, T.; Koh, A.R.; Jin, B. The role of market orientation and organizational innovativeness in enhancing the supply chain agility of Korean apparel firms. J. Korean Soc. Cloth. Text. 2014, 38, 718–732. [Google Scholar] [CrossRef][Green Version]
- Mishra, S.; Datta, S.; Mahapatra, S.S.; Debata, B.R. Alignment of dimensions towards modelling organisational supply chain agility. Int. J. Serv. Oper. Manag. 2014, 17, 88–106. [Google Scholar] [CrossRef]
- Chakraborty, S.; Mandal, S. Revisiting supply chain agility from an IT perspective: An empirical study. IUP J. Supply Chain. Manag. 2011, 8, 21–33. [Google Scholar]
- Wu, Y. IS-enabled supply chain agility. In Achieving Supply Chain Agility; Palgrave Macmillan: Cham, Switzerland, 2019; pp. 11–66. [Google Scholar]
- Dastyar, H.; Mohammadi, A.; Mohamadlou, M.A. Designing a model for supply chain agility (SCA) indexes using interpretive structural modeling (ISM). In Proceedings of the International Conference on Dynamics in Logistics, Bremen, Germany, 20–22 February 2018; Springer: Cham, Switzerland, 2018; pp. 58–66. [Google Scholar]
- Shahin, A.; Khalili, A.; Pourhamidi, M. Proposing a new approach for evaluating supply chain agility by data envelopment analysis with a case study in Pashmineh Kavir factory. Int. J. Serv. Oper. Manag. 2017, 26, 277–293. [Google Scholar] [CrossRef]
- Sangari, M.S.; Razmi, J.; Gunasekaran, A. Critical factors for achieving supply chain agility: Towards a comprehensive taxonomy. Int. J. Ind. Syst. Eng. 2016, 23, 290–310. [Google Scholar] [CrossRef]
- Yang, J. Supply chain agility: Securing performance for Chinese manufacturers. Int. J. Prod. Econ. 2014, 150, 104–113. [Google Scholar] [CrossRef]
- Jakhar, S.K.; Barua, M.K. Supply chain agility for firm’s performance: A study of textile-apparel-retail supply chain network. Int. J. Agil. Syst. Manag. 2013, 6, 215–231. [Google Scholar] [CrossRef]
- Saleeshya, P.G.; Thampi, K.S.; Raghuram, P. A combined AHP and ISM-based model to assess the agility of supply chain—A case study. Int. J. Integr. Supply Manag. 2012, 7, 167–191. [Google Scholar] [CrossRef]
- Pandey, V.; Garg, S. Analysis of interaction among the enablers of agility in supply chain. J. Adv. Manag. Res. 2009, 6, 99–114. [Google Scholar] [CrossRef]
- Faisal, M.N.; Banwet, D.K.; Shankar, R. Supply chain agility: Analysing the enablers. Int. J. Agil. Syst. Manag. 2007, 2, 76–91. [Google Scholar] [CrossRef]
- Katiyar, R.; Meena, P.L.; Barua, M.K.; Tibrewala, R.; Kumar, G. Impact of sustainability and manufacturing practices on supply chain performance: Findings from an emerging economy. Int. J. Prod. Econ. 2018, 197, 303–316. [Google Scholar] [CrossRef]
- Orji, I.J.; Liu, S. A dynamic perspective on the key drivers of innovation-led lean approaches to achieve sustainability in manufacturing supply chain. Int. J. Prod. Econ. 2020, 219, 480–496. [Google Scholar] [CrossRef]
- Rajesh, R. On sustainability, resilience, and the sustainable–resilient supply networks. Sustain. Prod. Consum. 2018, 15, 74–88. [Google Scholar] [CrossRef]
- Rajesh, R. Optimal trade-offs in decision-making for sustainability and resilience in manufacturing supply chains. J. Clean. Prod. 2021, 313, 127596. [Google Scholar] [CrossRef]
- Shin, J.S.; Kim, K.J. Complexity reduction of a design problem in QFD using decomposition. J. Intell. Manuf. 2000, 11, 339–354. [Google Scholar] [CrossRef]
- Younesi, M.; Roghanian, E. A framework for sustainable product design: A hybrid fuzzy approach based on quality function deployment for environment. J. Clean. Prod. 2015, 108, 385–394. [Google Scholar] [CrossRef]
- Liu, H.T. Product design and selection using fuzzy QFD and fuzzy MCDM approaches. Appl. Math. Model. 2011, 35, 482–496. [Google Scholar] [CrossRef]
- Wolniak, R. The use of QFD method advantages and limitation. Prod. Eng. Arch. 2018, 18, 14–17. [Google Scholar] [CrossRef]
- Dolgun, L.E.; Köksal, G. Effective use of quality function deployment and Kansei engineering for product planning with sensory customer requirements: A plain yogurt case. Qual. Eng. 2018, 30, 569–582. [Google Scholar] [CrossRef]
- Mahfod, J. QFD-MCDM Integrated for supplier selection in outsourcing of transport. Int. Conf. Manag. Econ. Financ. 2019, 3, 15–17. [Google Scholar] [CrossRef]
- Ozgormus, E.; Senocak, A.; Goren, H.G. An integrated fuzzy QFD-MCDM framework for personnel selection problem. Sci. Iran. 2021, 28, 2972–2986. [Google Scholar] [CrossRef]
- Neira-Rodado, D.; Ortiz-Barrios, M.; la Hoz-Escorcia, D.; Paggetti, C.; Noffrini, L.; Fratea, N. Smart product design process through the implementation of a fuzzy Kano-AHP-DEMATEL-QFD approach. Appl. Sci. 2020, 10, 1792. [Google Scholar] [CrossRef]
- Chen, Y.; Ran, Y.; Huang, G.; Xiao, L.; Zhang, G. A new integrated MCDM approach for improving QFD based on DEMATEL and extended MULTIMOORA under uncertainty environment. Appl. Soft Comput. 2021, 105, 107222. [Google Scholar] [CrossRef]
- Erol, I.; Ar, I.M.; Peker, I.; Searcy, C. Alleviating the impact of the Barriers to circular economy adoption through blockchain: An investigation using an integrated MCDM-based QFD with hesitant fuzzy linguistic term sets. Comput. Ind. Eng. 2022, 165, 107962. [Google Scholar] [CrossRef]
- He, L.; Wu, Z.; Xiang, W.; Goh, M.; Xu, Z.; Song, W.; Ming, X.; Wu, X. A novel Kano-QFD-DEMATEL approach to optimise the risk resilience solution for sustainable supply chain. Int. J. Prod. Res. 2021, 59, 1714–1735. [Google Scholar] [CrossRef]
- Guo, J.; Xu, J.; Du, Q.; He, Z. Risk assessment on multimodal transport network based on quality function deployment. Int. J. Intell. Syst. 2021, 36, 1408–1440. [Google Scholar] [CrossRef]
- Hsu, C.H.; Yu, R.Y.; Chang, A.Y.; Chung, W.H.; Liu, W.L. Resilience-Enhancing Solution to Mitigate Risk for Sustainable Supply Chain–An Empirical Study of Elevator Manufacturing. Processes 2021, 9, 596. [Google Scholar] [CrossRef]
- Ishikawa, A.; Amagasa, T.; Tamizawa, G.; Totsuta, R.; Mieno, H. The max–min Delphi method and fuzzy Delphi method via fuzzy integration. Fuzzy Sets Syst. 1993, 55, 241–253. [Google Scholar] [CrossRef]
- Chang, P.T.; Huang, L.C.; Lin, H.J. The fuzzy Delphi method via fuzzy statistics and membership function fitting and an application to the human resources. Fuzzy Sets Syst. 2000, 112, 511–520. [Google Scholar] [CrossRef]
- Kuo, Y.F.; Chen, P.C. Constructing performance appraisal indicators for mobility of the service industries using Fuzzy Delphi Method. Expert Syst. Appl. 2008, 35, 1930–1939. [Google Scholar] [CrossRef]
- Rathore, B.; Gupta, R. A fuzzy based hybrid decision-making framework to ex-amine the safety risk factors of healthcare workers during COVID-19 outbreak. J. Decis. Syst. 2021, 1–34. [Google Scholar] [CrossRef]
- Chen, W.K.; Nalluri, V.; Ma, S.; Lin, M.M.; Lin, C.T. An exploration of the critical risk factors in sustainable telecom services: An analysis of Indian telecom industries. Sustainability 2021, 13, 445. [Google Scholar] [CrossRef]
- Saaty, T.L. A scaling method for priorities in hierarchical structures. J. Math. Psychol. 1977, 15, 234–281. [Google Scholar] [CrossRef]
- Saaty, T.L. Decision making with the analytic hierarchy process. Int. J. Serv. Sci. 2008, 1, 83–98. [Google Scholar] [CrossRef]
- Yusuff, R.M.; Yee, K.P.; Hashmi, M.S.J. A preliminary study on the potential use of the analytical hierarchical process (AHP) to predict advanced manufacturing technology (AMT) implementation. Robot. Comput.-Integr. Manuf. 2001, 17, 421–427. [Google Scholar] [CrossRef]
- Lee, Y.; Kozar, K.A. Investigating the effect of website quality on e-business success: An analytic hierarchy process (AHP) approach. Decis. Support Syst. 2007, 42, 1383–1401. [Google Scholar] [CrossRef]
- Bathrinath, S.; Bhalaji, R.K.A.; Saravanasankar, S. Risk analysis in textile industries using AHP-TOPSIS. Mater. Today Proc. 2021, 45, 1257–1263. [Google Scholar] [CrossRef]
- Tavana, M.; Shaabani, A.; Mansouri Mohammadabadi, S.; Varzgani, N. An integrated fuzzy AHP-fuzzy MULTIMOORA model for supply chain risk-benefit assessment and supplier selection. Int. J. Syst. Sci. Oper. Logist. 2021, 8, 238–261. [Google Scholar] [CrossRef]
- Wu, W.W. Choosing knowledge management strategies by using a combined ANP and DEMATEL approach—ScienceDirect. Expert Syst. Appl. 2008, 35, 828–835. [Google Scholar] [CrossRef]
- Chang, B.; Chang, C.W.; Wu, C.H. Fuzzy DEMATEL method for developing supplier selection criteria. Expert Syst. Appl. 2011, 38, 1850–1858. [Google Scholar] [CrossRef]
- Hsu, C.W.; Kuo, T.C.; Chen, S.H.; Hu, A.H. Using DEMATEL to develop a carbon management model of supplier selection in green supply chain management. J. Clean. Prod. 2013, 56, 164–172. [Google Scholar] [CrossRef]
- Li, J.; Xu, K. A combined fuzzy DEMATEL and cloud model approach for risk assessment in process industries to improve system reliability. Qual. Reliab. Eng. Int. 2021, 37, 2110–2133. [Google Scholar] [CrossRef]
- Julong, D. Control problems of grey system. Syst. Control. Lett. 1982, 1, 288–294. [Google Scholar] [CrossRef]
- Julong, D. Introduction to grey system theory. J. Grey Syst. 1989, 1, 1–24. [Google Scholar]
- Yang, C.; Chen, B. Supplier selection using combined analytical hierarchy process and grey relational analysis. J. Manuf. Technol. Manag. 2006, 17, 926–941. [Google Scholar] [CrossRef]
- Kuo, Y.; Yang, T.; Huang, G.W. The use of grey relational analysis in solving multiple attribute decision-making problems. Comput. Ind. Eng. 2008, 55, 80–93. [Google Scholar] [CrossRef]
- Huang, X.; Sun, J.; Zhao, X. Credit risk assessment of supply chain financing with a grey correlation model: An empirical study on China’s home appliance Industry. Complexity 2021, 2021, 9981019. [Google Scholar] [CrossRef]
- Ivanov, D.; Dolgui, A. A digital supply chain twin for managing the disruption risks and resilience in the era of Industry 4.0. Prod. Plan. Control. 2020, 32, 1–14. [Google Scholar] [CrossRef]
- Elluru, S.; Gupta, H.; Kaur, H.; Singh, S.P. Proactive and reactive models for disaster resilient supply chain. Ann. Oper. Res. 2019, 283, 199–224. [Google Scholar] [CrossRef]
- Ankit, A.; Rajesh, R. An empiricalstudy of supply chain frangibility and risk management in Indian automobile industry. Res. Sq. 2021. [Google Scholar] [CrossRef]
- Bhatnagar, M.; Gupta, R.; Rao, M.; Sharma, T.; Yadav, A.S.; Bhaskaran, R. Research issue on green product design and manufacturing of electronic manufacturing industry. Res. Sq. 2021. [Google Scholar] [CrossRef]
- Nwachukwu, C.; Vu, H.M. Strategic flexibility, strategic leadership and business sustainability nexus. Int. J. Bus. Environ. 2020, 11, 125–143. [Google Scholar] [CrossRef]
- Tembo Silungwe, C.K.; Khatleli, N. An analysis of the allocation of pertinent risks in the Zambian building sector using Pareto analysis. Int. J. Constr. Manag. 2020, 20, 321–334. [Google Scholar] [CrossRef]
- Ocampo, L.; Jumao-as, A.M.; Labrador, J.J.; Rama, A.M. Transforming the means-end chain model of the QFD into interconnected hierarchical network structures for sustainable product design. Int. J. Sustain. Eng. 2021, 14, 552–573. [Google Scholar] [CrossRef]
- Rehman, O.U.; Ali, Y.; Sabir, M. Risk assessment and mitigation for electric power sectors: A developing country’s perspective. Int. J. Crit. Infrastruct. Prot. 2021, 36, 100507. [Google Scholar] [CrossRef]
- Christopher, M.; Peck, H. Building the resilient supply chain. Int. J. Logist. Manag. 2004, 15, 1–13. [Google Scholar] [CrossRef]
Publisher’s Note: MDPI stays neutral with regard to jurisdictional claims in published maps and institutional affiliations. |
© 2022 by the authors. Licensee MDPI, Basel, Switzerland. This article is an open access article distributed under the terms and conditions of the Creative Commons Attribution (CC BY) license (https://creativecommons.org/licenses/by/4.0/).