Article

Mathematical Properties of a Novel Graph-Theoretic Irregularity Index with Potential Applicability in QSPR Modeling

1
School of Mathematics and Information Sciences, Guangzhou University, Guangzhou 510006, China
2
Department of Mathematics, COMSATS University Islamabad, Sahiwal Campus, Sahiwal 57000, Pakistan
3
Faculty of Engineering Sciences, GIK Institute of Engineering Sciences and Technology, Topi, Swabi 23460, Pakistan
4
School of Computer Science and Cyber Engineering, Guangzhou University, Guangzhou 510006, China
*
Authors to whom correspondence should be addressed.
These authors contributed equally to this work.
Mathematics 2022, 10(22), 4377; https://doi.org/10.3390/math10224377
Submission received: 1 November 2022 / Revised: 15 November 2022 / Accepted: 16 November 2022 / Published: 21 November 2022

Abstract

:
Irregularity indices are graph-theoretic parameters designed to quantify the irregularity in a graph. In this paper, we study the practical applicability of irregularity indices in QSPR modeling of the physicochemical and quantum-theoretic properties of compounds. Our comparative testing shows that the recently introduced I R A index has significant priority in applicability over other irregularity indices. In particular, we show that the correlation potential of the I R A index with certain physicochemical and quantum-theoretic properties such as the enthalpy of formation, boiling point, and π -electron energies is significant. Our QSPR modeling suggests that the regression models with the aforementioned characteristics such as strong curve fitting are, in fact, linear. Considering this the motivation, the I R A index was studied further, and we provide analytically explicit expressions of the I R A index for certain graph operations and compositions. We conclude the paper by reporting the conclusions, implications, limitations, and future scope of the current study.

1. Introduction

1.1. Background

The retrieval of the biological, quantum-theoretic, and physicochemical characteristics of a compound from its structure (chemical) is a contemporary technique in reticular chemistry. Though the idea seems self-explanatory, understanding this connection, of retrieving the information of a physicochemical property from its structure, up to its full potential, is rather challenging [1]. One of the frequent challenges is the unavailability of experimental data, which are normally required in order to unveil the aforementioned connection. Thus, in order to elucidate this relationship of the structural dependence of a physicochemical feature, diverse research has been performed to estimate the missing data (e.g., normal boiling point, heat of formation); see, for instance, [2,3,4,5,6]. This research direction aiming at the investigation of predictive potentials frequently employs diverse methods such as machine learning [7], among others. More modern approaches such as graph signal processing (GSP) [8] are being formulated to address this old problem.
One of the contemporary tools that is frequently employed in order to predict the diverse physicochemical features of a chemical compound is provided by molecular descriptors. Their strength lies in developing QSPR/QSAR models, which are regression models describing the so-called relationship between a chemical property and its molecular structure. These molecular descriptors have been proposed at an accelerating rate; see, for instance, [9,10,11]. Recently, Vladimirova et al. [12] employed QSPR modeling in correlating the sensitivity (potentiometric) of sensorial membranes. Topological descriptors are an important family of descriptors lying in the bigger class of molecular descriptors. They are numerical quantities transforming a chemical structure into a mathematical real number. Chemical graph theory, in this aspect, converts a chemical compound into a chemical graph by constructing a correspondence between non-hydrogen atoms (respectively bonds) and vertices (respectively edges). Diverse algorithms are then employed to transform such mathematical point–line objects to graph numerical invariants, also known as topological descriptors. Much of the available research [13,14,15,16,17] shows that these graph-based invariants, which are easily computable, efficiently encrypt a significantly higher level of the structural information of chemical compounds. Recently, Azadifar et al. [18] applied the graph-theoretic relevancy–redundancy gene selection method to cancer diagnosis.

1.2. Related Work

Based on their mathematical definitions, these graph-based topological descriptors/indices are classified into diverse groups, of which degree-based topological indices (DIs) have significantly more accuracy; see [19]. For the set of simple connected graphs ∑, an irregularity index I R ( Γ ) is a map I R : R + { 0 } such that I R ( Γ ) = 0 Γ is regular. The motivation for defining an irregularity index was purely mathematical, and it was the quantification of the irregularity in a graph. Therefore, most of the studies conducted on irregularity indices are pure mathematical. For instance, in 2005, Gutman et al. [20] conducted a comparison between different irregularity indices for chemical trees. In the same year, Hansen and Mélot [21] found sharp upper and lower bounds on Albertson’s irregularity index. Zhou and Luo [22], in 2008, further improved the extremal results on Albertson’s irregularity index, which were previously published by Hansen and Mélot [21]. Luo and Zhou [23] found sharp bounds on Albertson’s irregularity index of trees and unicyclic graphs with the given matching number. Mukwembi, in 2013 [24], studied maximally irregular graphs with respect to Albertson’s irregularity index. Réti and Dimitrov [25] studied Albertson’s irregularity index in bidegreed graphs. Dimitrov and Réti [26] studied graphs whose Albertson’s irregularity indices are the same. Abdo et al. [27] studied the structural sensitivity of some well-known irregularity indices. Réti [28], in 2019, studied a relation between irregularity indices such as the σ index and the main eigenvalues of a graph. Other mathematical results on the irregularity indices can be found in [29,30,31,32,33,34,35,36]. Importantly, all of these results have primarily contributed to graph theory, but are not applicable to graph theory.
Irregularity indices for different graph operations have been studied since their conception. Abdo and Dimitrov [37] derived sharp bounds on Albertson’s irregularity index of product graphs such as the strong graph, the Cartesian graph, corona graph, and join graph, among others. For the same product graphs, Abdo and Dimitrov [38] derived sharp bounds on the total irregularity index. Abdo and Dimitrov [39] derived exact expressions of the total irregularity index of certain derived graphs. De et al. [40] conducted the study of Abdo and Dimitrov [39] for Albertson’s irregularity index. It is worth mentioning that all of these results on composite and product graphs have been published with no motivation from the application perspective.
Since the motivation of defining irregularity indices was purely mathematical, researcher have investigated their practical applicability to other scientific disciplines Réti et al. [41] studied the relation between various degree-based irregularity indices for isomeric octanes and showed that the correlation between irregularity indices and the physicochemical properties of alkanes is, in general, weak. Recently, in 2022, Emadi Kouchak et al. [42] presented an application of irregularity indices in computer science by employing graph irregularity indices in quantifying network structural similarities and dissimilarities. Table 1 presents an overview of current methods employing irregulaity indices.
It is noteworthy to mention that none of the literature on irregularity indices presents methods for their calculation on large-sized graphs. In Section 3, we present a two-step procedure and the MatLab code to calculate the commonly occurring irregularity indices for large-sized graphs.

1.3. Motivation

Based on related work, in this subsection, we outline the limitations of existing methods, which, in turn, motivated this study:
  • Almost all of the results published on irregularity indices are purely mathematical without discussing their applicability.
  • Calculating an irregularity index for graphs on a large number of vertices is rather difficult. No computational technique has been proposed so far to tackle this issue.
  • The correlation ability of irregularity indices for predicting physicochemical properties of isomeric octanes, i.e., alkanes, is rather poor.
  • No criteria have been published to address the proliferation of newly introduced irregularity indices.
  • Mathematical results on composition and product graphs have only been studied for Albertson’s irregularity and the total irregularity indices, which have no practical applicability, except the quantification of the irregularity in a graph.
  • There has not been any study published that reflects on how to employ mathematical results on composition and product graphs for practical applications.

1.4. Contributions

Based on the limitations mentioned in the previous subsection, we outline the scientific contributions made in this work:
  • A computational technique is proposed to compute irregularity indices, which efficiently works for large-sized graphs.
  • We conduct a comparative testing of commonly occurring irregularity indices for the predicting physicochemical and quantum-theoretic properties of benzenoid hydrocarbons.
  • The I R A index outperforms all the irregularity indices by correlating significantly well with the quantum-theoretic and fairly well with the physicochemical properties.
  • Having potential applications in QSPR modeling, the I R A index is further studied for various transformation and derived graphs.
  • We devise a method of employing mathematical results on transformation and derived graphs in correlating the physicochemical and quantum-theoretic properties of derivative hydrocarbons.

1.5. Organization of the Paper

This paper is organized as follows: Section 2 presents the definitions and preliminary results required in later sections. Section 3 conducts a comparative testing of commonly occurring irregularity indices for predicting the physicochemical and quantum-theoretic properties of benzenoid hydrocarbons. Section 4 and Section 5 present the results on the I R A index of transformation graphs and derived graphs, respectively. In Section 6, we put forward a method of employing mathematical results on transformation and derived graphs in correlating the physicochemical and quantum-theoretic properties of derivative hydrocarbons. Section 7 concludes the paper by presenting the conclusions, implications, limitations, and future scope.

2. Mathematical Preliminaries

A simple graph Γ is a mathematical tuple comprising a set of nodes V and a set E V 2 of links connecting some or all nodes. The multiplicity ε = E (respectively υ = V ) is known as the size (respectively order). Two vertices y , z V ( Γ ) (respectively edges e , f E ( Γ ) ) are said to be adjacent if y z E ( Γ ) (respectively e and f share a common end-vertex). In that case, we denote adjacency with y z or e f . A vertex y V ( Γ ) and an edge e E ( Γ ) are called incident and written as y e if y is one of the end-vertices of e. The degree/valency d ( y ) of y V is the cardinality of the neighborhood N ( y ) : = { z V : y z } of y. Let μ y be the average of the degrees of the neighbors of vertex y V ( Γ ) . A graph for which every cycle is of an even length is known as bipartite. A graph is called bipartite if it contains no cycle of an oddlength. A graph embeddable in the Euclidean space R 2 is called planar; otherwise, it is called non-planar.
A topological invariant I R ( Γ ) of graph Γ is said to be an irregularity index if I R ( Γ ) 0 and I R ( Γ ) = 0 if and only if Γ is regular. Based on its defined structure, an irregularity index could either be eigenvalue-based or degree-based.
The first-ever proposed irregularity index is eigenvalue-based and known as the Collatz–Sinogowitz irregularity index [43], which determines the irregularity of a graph. For a υ -vertex ε -edge graph Γ ( υ , ε ) , it is defined as follows:
C S ( Γ ) = λ ( Γ ) 2 ε υ ,
where λ is the spectral radius of the adjacency matrix of Γ . Because of the lesser computational complexity, irregularity indices are mostly degree-based. In 1992, Bell [44] introduced a degree-based irregularity index known as the variance of degree V a r ( Γ ) , which has significant application in chemistry. For a ( υ , ε ) graph Γ , it is defined as
V a r ( Γ ) = 1 υ y V ( Γ ) ( d ( y ) ) 2 1 υ 2 y V ( Γ ) d ( y ) 2 = 1 υ y V ( Γ ) ( d ( y ) ) 2 2 ε υ 2 .
Using the variance, Réti [28] introduced the I R V irregularity index defined as I R V ( Γ ) = υ 2 V a r ( Γ ) . In 1997, Albertson introduced another degree-based irregularity index known as Albertson’s irregularity index. It is defined as
A L ( Γ ) = y z E ( Γ ) d ( y ) d ( z ) .
By extending Albertson’s irregularity index, Gutman et al. [34] introduced the sigma index.
σ ( Γ ) = y z E ( Γ ) ( d ( y ) d ( z ) ) 2 .
A topological index T is simply a map T : R . Topological indices have important applications in chemistry. The Randić connectivity index belongs to the oldest class of descriptors. Randić [45] introduced this topological descriptor in 1975. For a graph Γ , it is defined as
R ( Γ ) = y z E ( Γ ) 1 d ( y ) d ( z ) .
Another Randić-type invariant [46] is the reciprocal Randić index, defined as:
R R ( Γ ) = y z E ( Γ ) d ( y ) d ( z ) .
Besides the Randić index, some of the other degree-based topological indices include the first and second Zagreb indices [47,48] and the forgotten topological index [49]. For a graph Γ , they are defined as follows:
M 1 ( Γ ) = y z E ( Γ ) ( d ( y ) + d ( z ) ) = y V ( Γ ) d ( y ) 2 , M 1 ( Γ ) = y z E ( Γ ) ( d ( y ) d ( z ) ) , F ( Γ ) = y z E ( Γ ) ( d ( y ) ) 2 + ( d ( z ) ) 2 = y V ( Γ ) d ( y ) 3 .
Using the Randić index of a graph Γ i.e., R ( Γ ) , Li and Gutman in their book [46] introduced a novel irregularity index called the I R A index. For an υ -vertex graph Γ , it is defined as
I R A ( Γ ) = υ 2 y z E ( Γ ) 1 d ( y ) d ( z ) = υ 2 R ( Γ ) .
Note that the definition of the I R A index suggests that any result on the Randić connectivity index gives a directed result on I R A . The Randić index has been studied so extensively that there is a whole book written on this graphical parameter. We refer the reader to the book [46] and the survey [50] on the Randić index. Estrada [51] reintroduced the I R A index from the Randić index and presented their applications to complex biomolecular networks. Later on, Estrada [52] also presented applications of the I R A index in quantifying network heterogeneity. Gutman [53] showed that, just like the transformation of the Randić index into the I R A index, other degree-based indices can also be transformed into their corresponding irregularities. Some computational results on the I R A index of chemical and neural networks are reported by Kang et al. [54] and Chu et al. [55].
Other irregularity indices for a ( υ , ε ) -graph, which we use in the comparative testing, are listed below:
I R 1 ( Γ ) = F ( Γ ) 2 ε υ M 1 ( Γ ) , I R 2 ( Γ ) = M 2 ( Γ ) ε 2 ε υ , I R F ( Γ ) = F ( Γ ) 2 M 2 ( Γ ) , I R F W ( Γ ) = I R F ( Γ ) M 2 ( Γ ) , I R B ( Γ ) = M 1 ( Γ ) 2 R R ( Γ ) , I R C ( Γ ) = R R ( Γ ) ε 2 ε υ , I R D I F ( Γ ) = y z E ( Γ ) d ( y ) d ( z ) d ( z ) d ( y ) , I R G ( Γ ) = y z E ( Γ ) ln d ( y ) ln d ( z ) , I R L U ( Γ ) = y z E ( Γ ) d ( y ) d ( z ) min d ( y ) , d ( z ) , I R L F ( Γ ) = y z E ( Γ ) d ( y ) d ( z ) d ( y ) , d ( z ) ,
I R L A ( Γ ) = y z E ( Γ ) 2 d ( y ) d ( z ) d ( y ) + d ( z ) , I R D ( Γ ) = y z E ( Γ ) ln [ 1 + | d ( y ) d ( z ) | ] , I R G A ( Γ ) = y z E ( Γ ) ln d ( y ) + d ( z ) 2 d ( y ) d ( z ) , I R M 1 ( Γ ) = 1 υ y V ( Γ ) μ y 2 ε υ , I R M 2 ( Γ ) = y V ( Γ ) d ( y ) μ y .
For details on these irregularity indices, we refer to the work by Réti et al. [41].
This paper focuses on this new irregularity index, i.e., the I R A index, and presents its potential applicability in modeling the physicochemical and quantum-theoretic properties of benzenoid hydrocarbons. Then, further mathematical properties of the I R A index are investigated.
Now, we introduce some derived graphs based on different graph operations. The total graph T ( Γ ) of a graph Γ was introduced by Behzad [56] in 1967, and it has the vertex set V T ( Γ ) = V ( Γ ) E ( Γ ) such that y z , y e , e f E T ( Γ ) if and only if y z , z e , or e f is adjacent/incident in Γ .
Sampathkumar and Chikkodimath [57] extended the concept of the total graph and put forward two semi-total point and line graphs. The semi-total point graph T 1 ( Γ ) has the vertex set V T 1 ( Γ ) = V ( Γ ) E ( Γ ) , and any two vertices y , z V T 1 ( Γ ) are adjacent if and only if:
(i)
y , z V ( Γ ) such that y z in Γ or;
(ii)
y V ( Γ ) , z E ( Γ ) , or vice versa, such that y z in Γ .
Similarly, the semi-total line graph T 2 ( Γ ) has the vertex set V T 2 ( Γ ) = V ( Γ ) E ( Γ ) , and any two vertices y , z V T 2 ( Γ ) are adjacent if and only if:
(i)
y , z E ( Γ ) such that y z in Γ or;
(ii)
y V ( Γ ) , z E ( Γ ) , or vice versa, such that y z in Γ .
Independently, similar concepts were studied by Akiyama et al. [58], where they called these operations “middle graphs”.
The subdivision S ( Γ ) of a graph Γ has the vertex set V S ( Γ ) = V ( Γ ) E ( Γ ) such that x y E S ( Γ ) if and only if y V ( Γ ) and z E ( Γ ) , and vice versa. Informally, S ( Γ ) is built by adding a degree-two vertex on each edge of Γ .
The line graph L ( Γ ) has V L ( Γ ) = E ( Γ ) such that g , h V L ( Γ ) are adjacent in L ( Γ ) iff g h in Γ .
The double-graph D ( Γ ) of Γ , having two copies Γ 1 and Γ 2 , has its vertex set V D ( Γ ) = V ( Γ 1 ) V ( Γ 1 ) preserving E ( Γ i ) ( 1 i 2 ) and for any y z E ( Γ ) ; we add two additional edges y 1 z 2 and z 1 y 2 in D ( Γ ) . Similarly, the strong double- S D ( Γ ) of Γ is obtained from D ( Γ ) by additionally adding y i z i for every y z E ( Γ ) .
The extended double-cover Γ * of Γ was introduced by Alon [59]. If V ( Γ ) = { x 1 , , x υ } , then Γ * is a bipartite graph with partition ( Y , Z ) , where Y = { y 1 , y υ } and Z = { z 1 , , z υ } in which y i z j iff either i = j or y i z i E ( Γ ) .
The definitions of some of the aforementioned derived graphs suggest the following lemma.
Lemma 1.
Let Γ be an ( υ , ε )-graph. Let x V ( Γ ) and f = y z E ( Γ ) . Then, the following relations hold:
(i)
d S ( Γ ) ( x ) = d Γ ( x ) and d S ( Γ ) ( f ) = 2 .
(ii)
d L ( Γ ) ( f ) = d Γ ( y ) + d Γ ( z ) 2 .
(iii)
d T 1 ( Γ ) ( x ) = 2 d Γ ( x ) and d T 1 ( Γ ) ( f ) = 2 .
(iv)
d T 2 ( Γ ) ( x ) = d Γ ( x ) and d T 2 ( Γ ) ( f ) = d L ( Γ ) ( f ) + 2 = d Γ ( y ) + d Γ ( z ) + 2 .
(v)
d T ( Γ ) ( x ) = 2 d Γ ( x ) and d T ( Γ ) ( f ) = d L ( Γ ) ( f ) + 2 = d Γ ( y ) + d Γ ( z ) + 2 .
Here, we define some auxiliary terminologies required later in this section. For an ( υ , ε )-graph Γ , we define
E R R ( Γ ) = y V ( Γ ) y , R A ( Γ ) = x y , y z E ( Γ ) 1 ( d ( x ) + d ( y ) 2 ) × ( d ( y ) + d ( z ) 2 ) .
L R ( Γ ) = x y , y z E ( Γ ) 1 ( d ( x ) + d ( y ) ) × ( d ( y ) + d ( z ) ) , M R ( Γ ) = y z E ( Γ ) 1 d ( y ) × ( d ( y ) + d ( z ) ) .
A R ( Γ ) = y z E ( Γ ) 1 ( 2 d ( y ) + 1 ) × ( 2 d ( z ) + 1 ) , B R ( Γ ) = y z E ( Γ ) 1 ( d ( y ) + 1 ) × ( d ( z ) + 1 ) .
E R a ( Γ ) = y z E ( Γ ) 1 ( ε + υ 1 2 d ( y ) ) × ( ε + υ 1 2 d ( z ) ) .
E R R a ( Γ ) = x V ( Γ ) , y E ( Γ ) , x y 1 ( ε + υ 1 2 d ( x ) ) × ( υ 2 ) .
Next, we introduce some transformation operations on graphs put forward by Wu and Meng [60] in 2002. For a graph Γ and variables a , b { + , } , the transformation graph Γ a b has the vertex set V ( Γ a b ) partitioned into V a and V b , i.e., V ( Γ a b ) = V a V b , where
V a = { y y V ( Γ ) } and V b = { y y E ( Γ ) } .
Moreover, the edge set of Γ a b can be partitioned in E a , E b , and E c , i.e., E ( Γ a b ) = E a E b E c , where
E a = { y z y , z V ( Γ ) } , E b = { e f e , f E ( Γ ) } , and E c = { y e y V ( Γ ) , e E ( Γ ) } .
Alternatively, the vertex set of Γ a b is V ( Γ a b ) = V ( Γ ) E ( Γ ) , and for any y , z V ( Γ a b ) , we have y z in Γ a b iff:
(i)
y , z V ( Γ ) , y z E ( Γ ) if a = + and y z E ( Γ ) if a = .
(ii)
x V ( Γ ) , y E ( Γ ) , x y in Γ if b = + and x y in Γ if b = .
Figure 1 presents a graph T and its four transformation graphs.
Based on the definitions of the transformation graphs, the following properties can be deduced.
Lemma 2.
Let Γ be an ( υ , ε )-graph. Let x V ( Γ ) and f = y z E ( Γ ) . Then, the following relations hold:
(i)
d Γ + + ( x ) = 2 d Γ ( x ) and d Γ + + ( f ) = 2 .
(ii)
d Γ + ( x ) = ε and d Γ + ( f ) = υ 2 .
(iii)
d Γ + ( x ) = υ 1 and d Γ + ( f ) = 2 .
(iv)
d Γ ( x ) = υ + ε 1 2 d Γ ( x ) and d Γ ( f ) = υ 2 .
Further mathematical properties of transformation graphs were studied by Xu and Wu [61] and Yi and Wu [62].

3. Application of the IRA Index in QSPR Modeling

In order to investigate the potential applicability of irregularity indices in QSPR modeling, we would require computing them for the lower benzenoid hydrocarbons, as they represent both cyclic and acyclic chemical structures. The next subsection explains the computational details that will be carried out in subsequent subsections.

3.1. Computational Details

Although the defining structure of any degree-based irregularity index is simple enough to compute it on paper, using a computer saves much time.
Here, we devised a simple way of calculating any irregularity index for an arbitrary graph. Note that, although we used this method only for computing the I R A index of the lower benzenoid hydrocarbons, the method can be employed for any degree-based irregularity index and for any arbitrary graph.
Our simple two-step process employs newGraph [63] and MatLab [64] to compute a degree-based irregularity index I R of a graph Γ :
  • Step 1: Draw Γ in newGraph, and compute its adjacency matrix A.
  • Step 2: Input A into our program in MatLab to compute I R .
Although our MatLab program only computes the I R A index, it is easily modifiable for any arbitrary degree-based irregularity index.
Our MatLab program with a README file is publicly available on GitHub. Access the web page https://github.com/Sakander/Irregulaity-Indices.git (accessed on 18 November 2022) in order to access the code.

3.2. QSPR Modeling of Physicochemical Properties

In order to address the proliferation of molecular descriptors, Gutman et al. [65] laid down the foundation to investigate the quality of degree-based topological indices for the prediction of the physicochemical characteristics of compounds. They selected the enthalpy of formation Δ H f o (respectively the boiling point Δ T b p ) to be the monitors of thermal characteristics (respectively van der Waals-type relations) for their comparative testings. On the other hand, Gutman and Trinajstić [66] studied the dependence of degree-based descriptors on the energy of the π -electron E π = E π ( β ) (i.e., measured in β units) for benzenoid hydrocarbons. Lučić et al. [67] and Chen [68] studied the prediction strength of the sum-connectivity and product-connectivity indices for the π -electronic energy of benzenoid hydrocarbons. Following the work in [67], we also determined the predictive potential of the I R A index for determining the E π of benzenoid hydrocarbons. The criterion to determine the performance of an irregularity index is simply the determination of the statistical correlation coefficient. The higher the value (i.e., the closer to one) of the correlation coefficient is, the better the efficiency of an irregularity index.
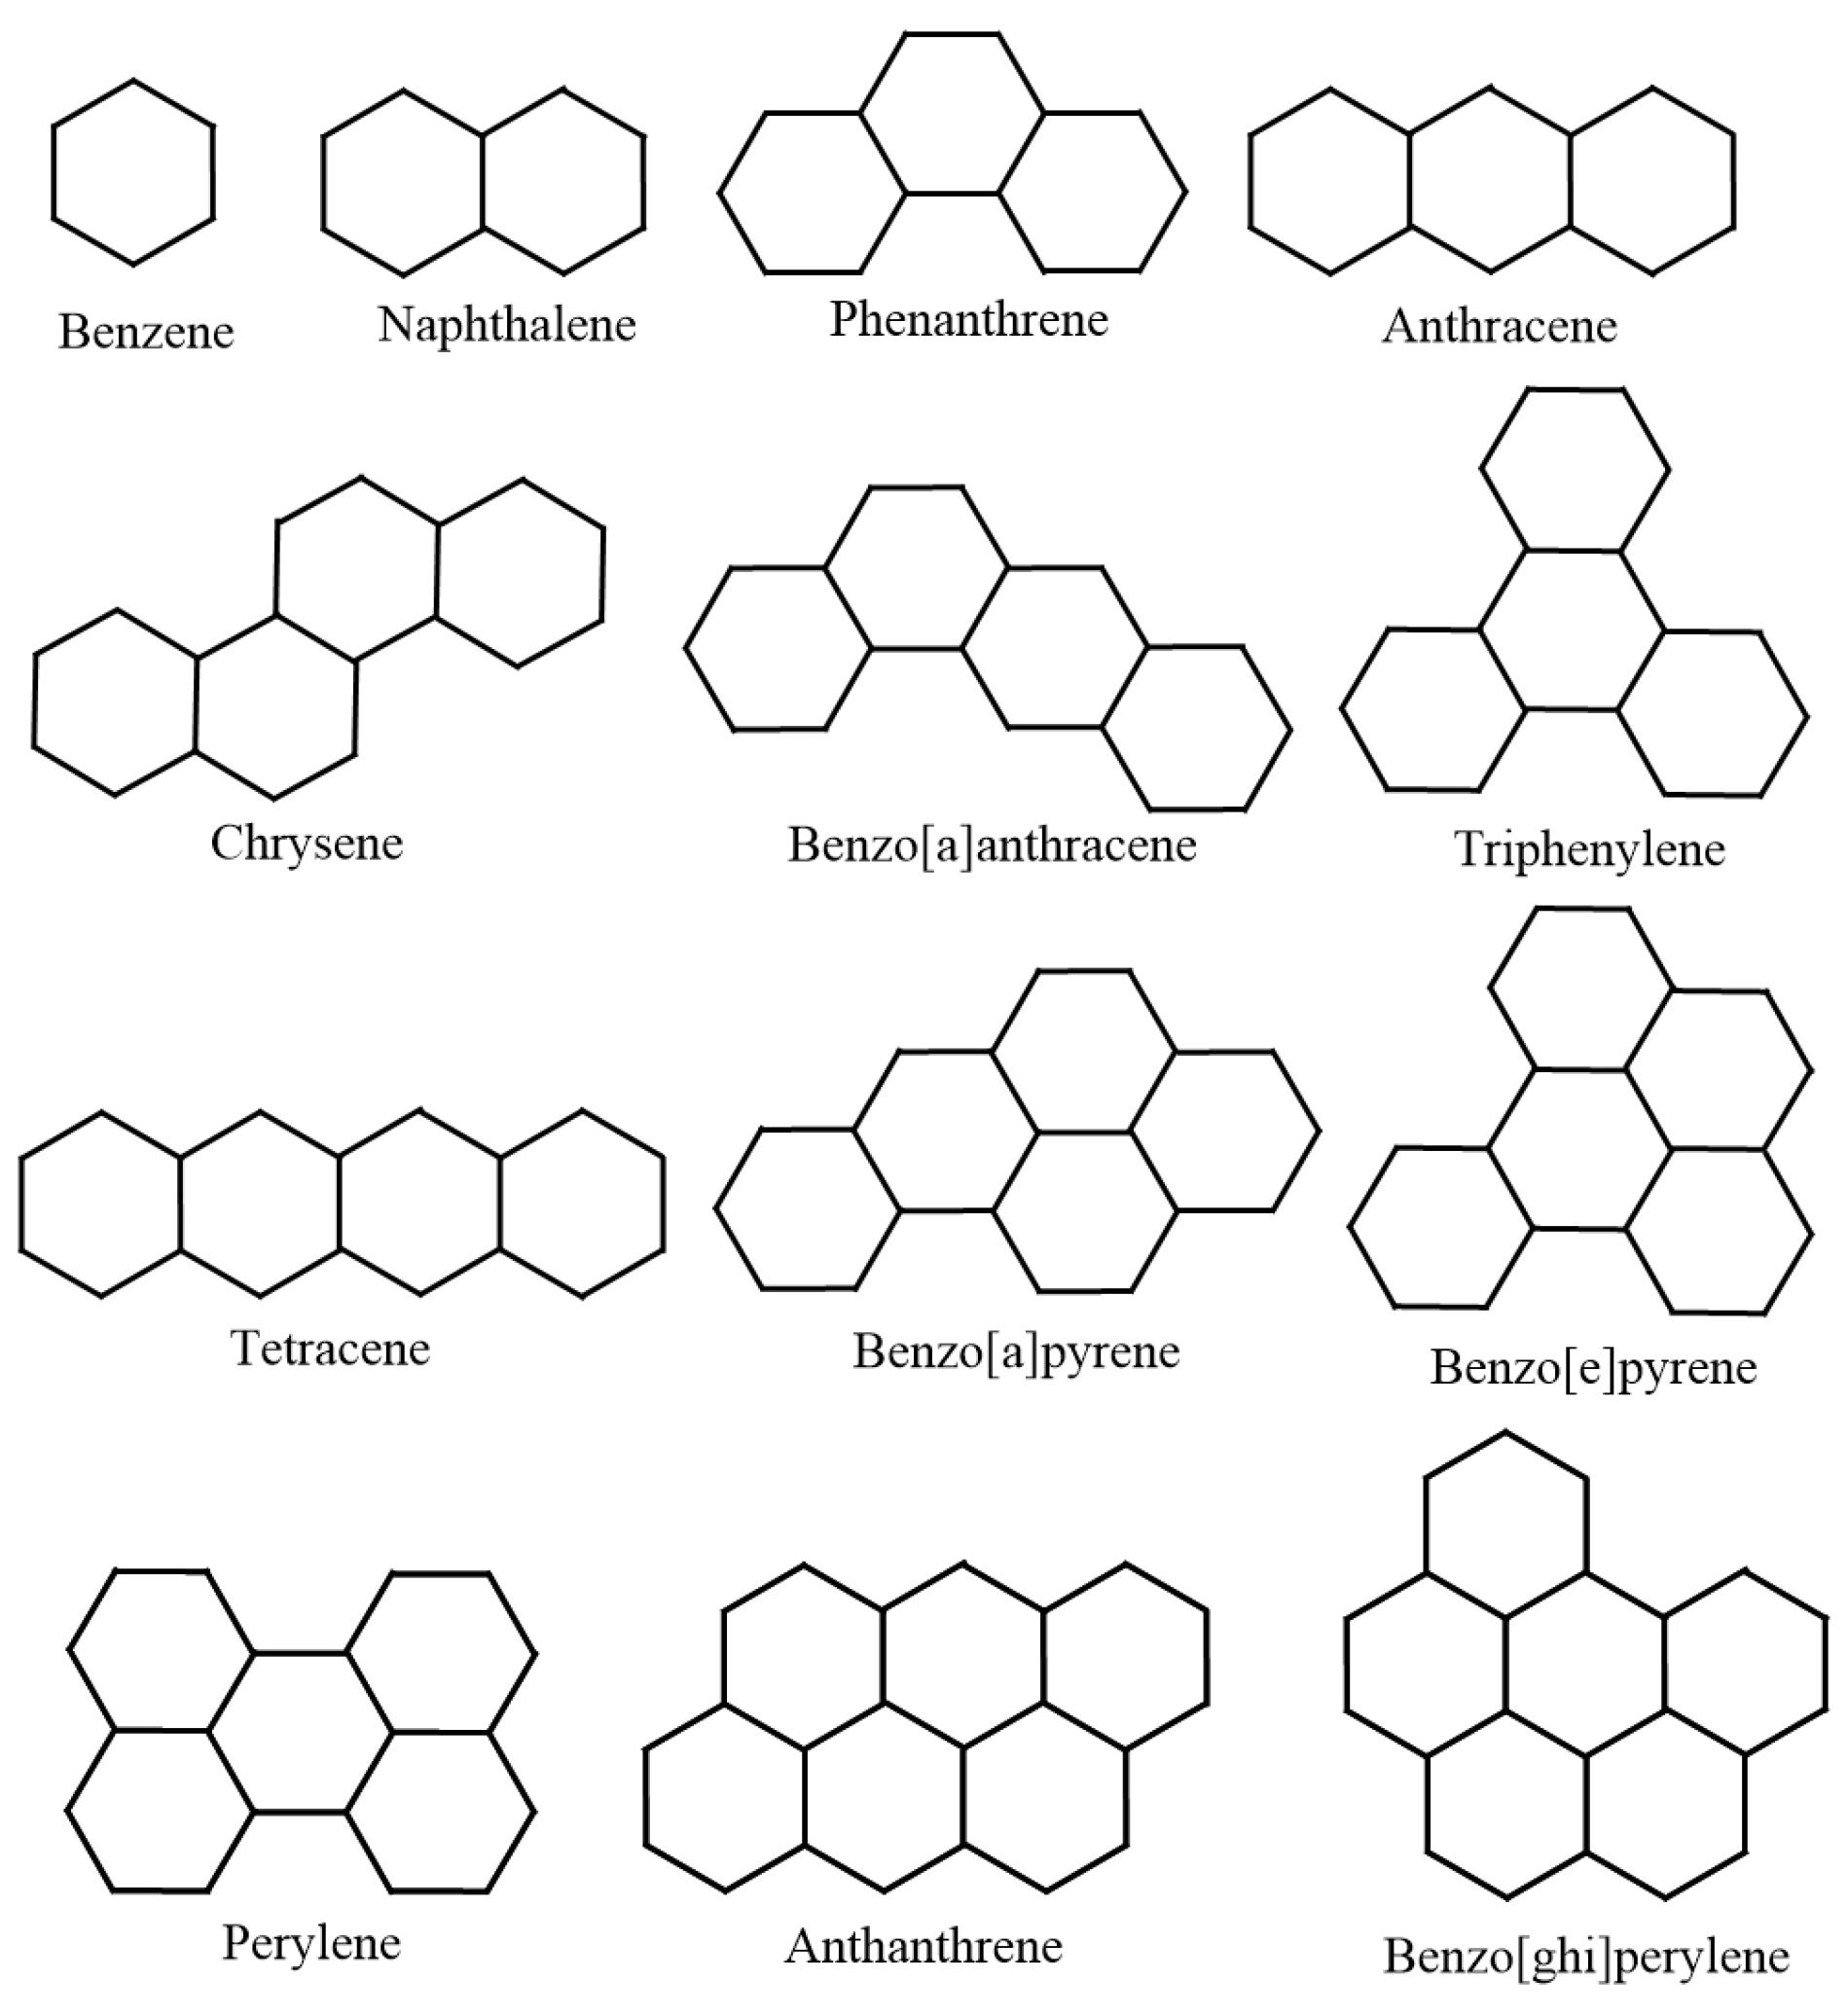
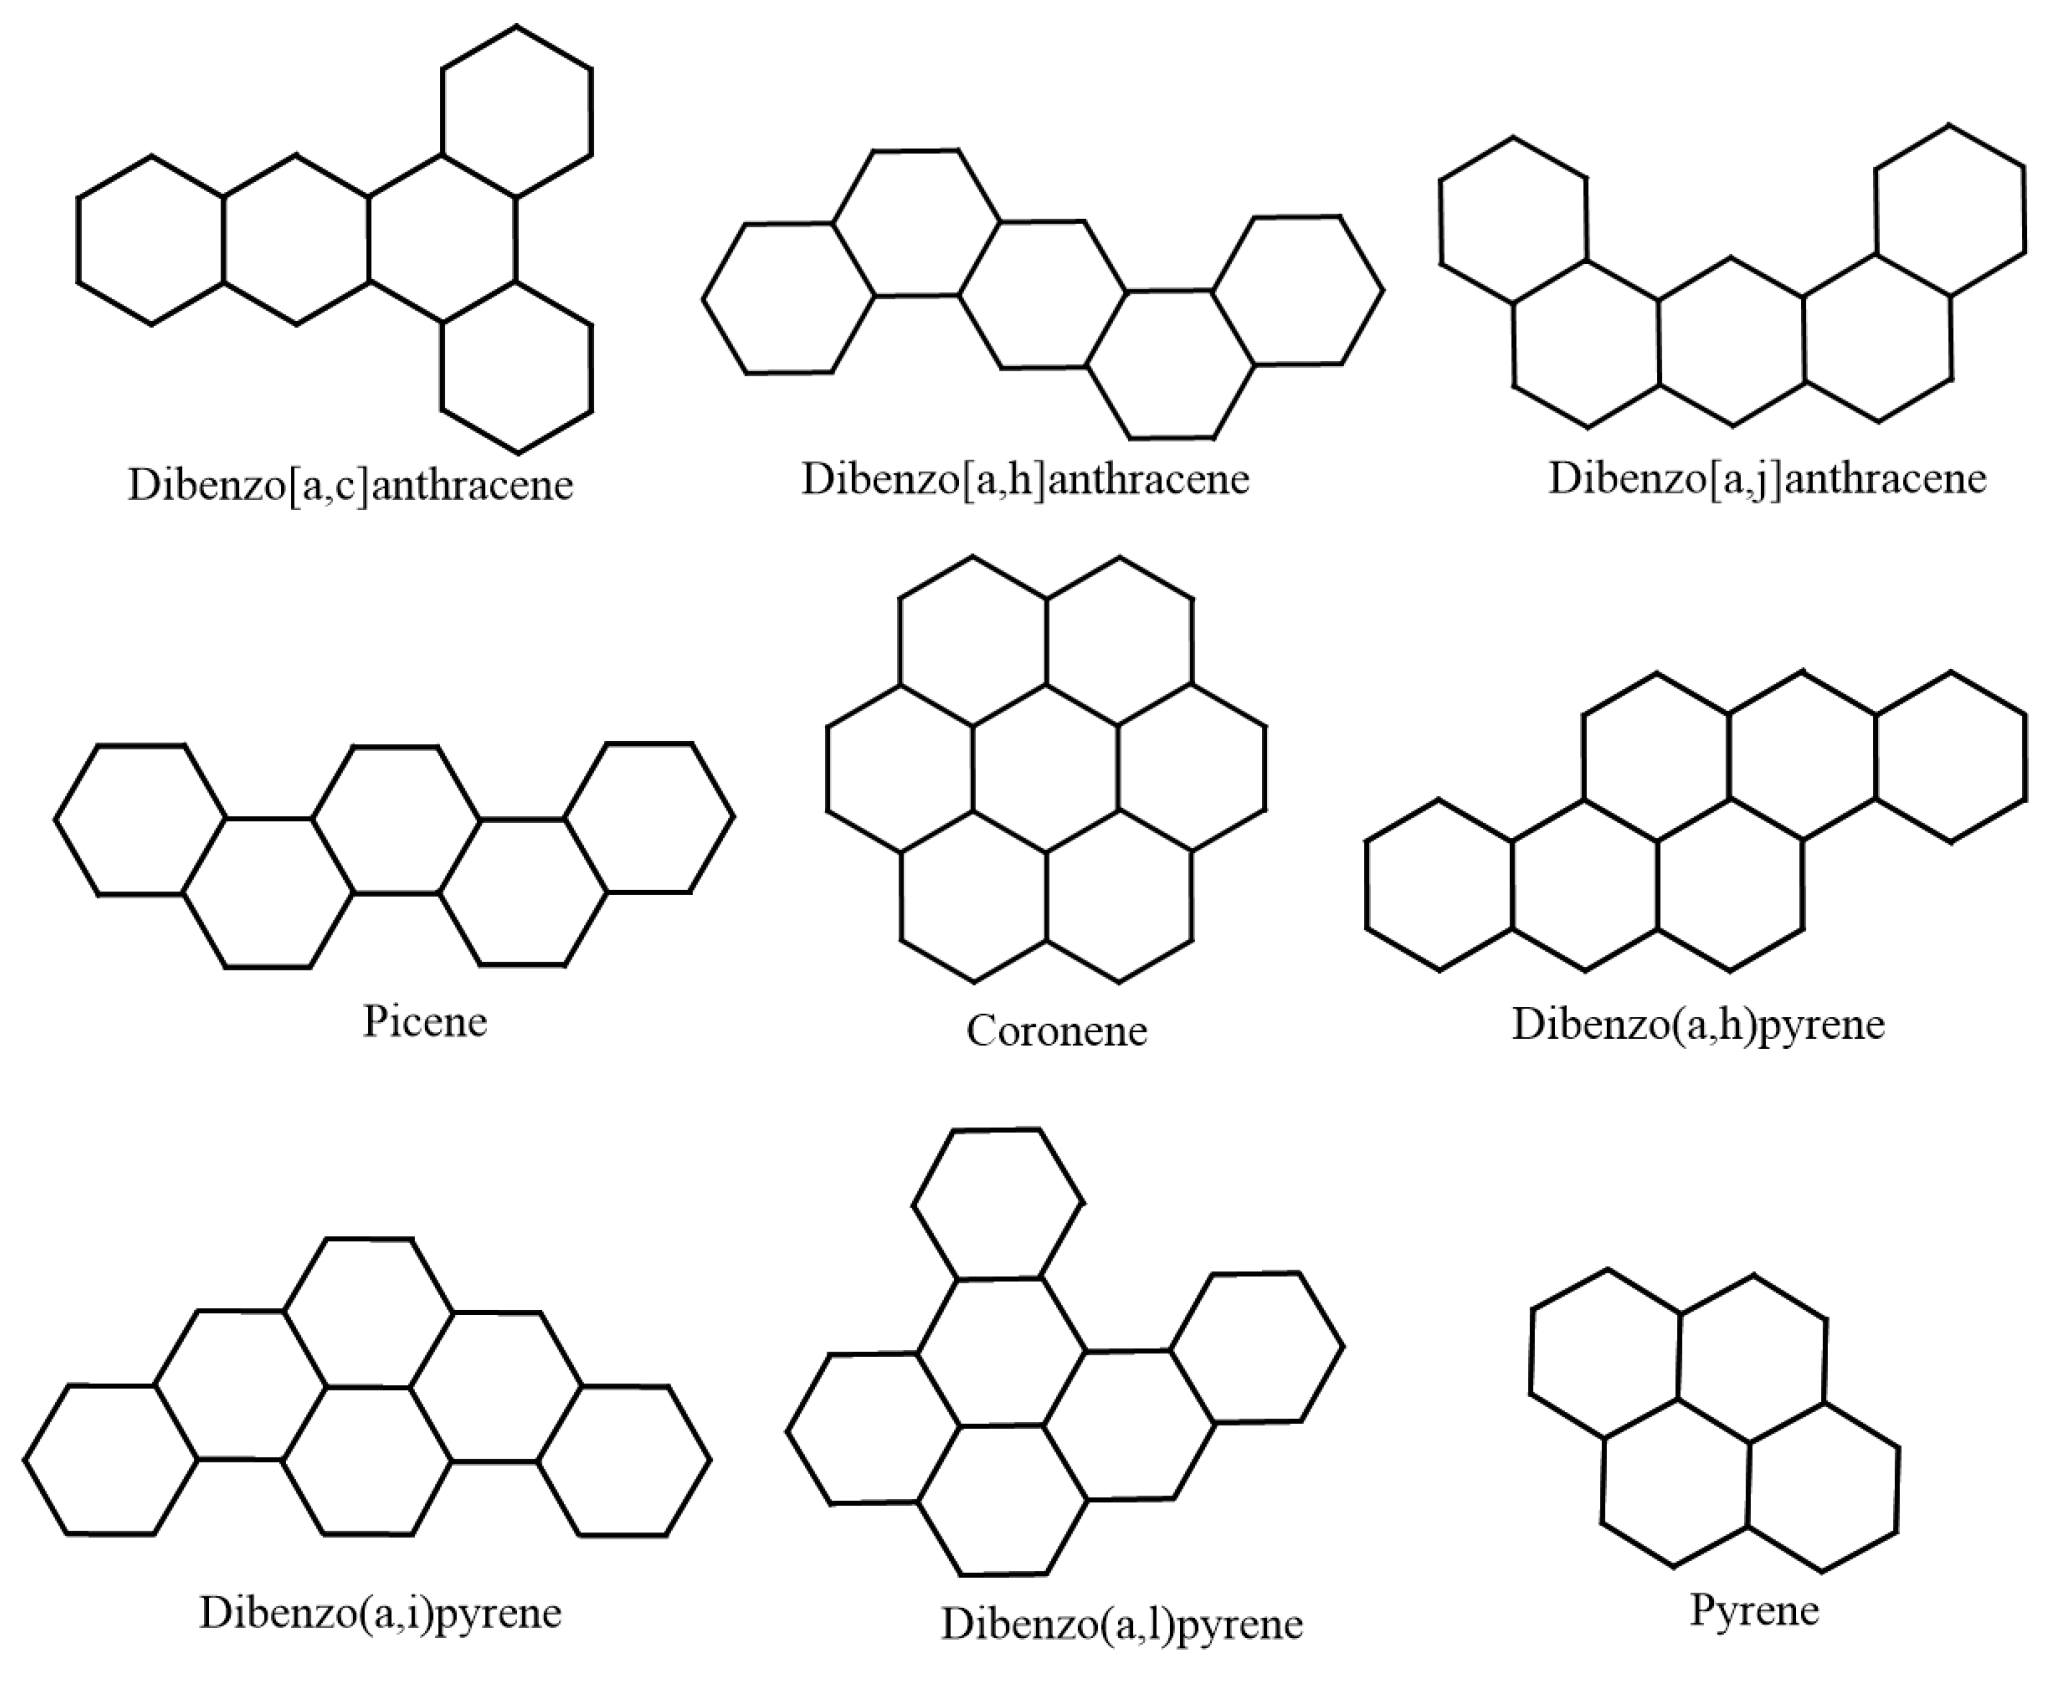
Following the standard choice of chemical compounds, we consider the lower benzenoid hydrocarbons, as they are supposed to represent both cyclic and acyclic chemical structures. For the sake of the authenticity and reliability of the statistical inference, we took 22 lower benzenoid hydrocarbons, claiming the number to be large enough. The public availability of experimental data is another considerable reason for choosing the lower benzenoid hydrocarbons. Note that the lower benzenoid hydrocarbons are actually polycyclic aromatic hydrocarbons (PAHs). Figure 2 and Figure 3 depict the 22 PAHs considered with their aromaticity. For E π , we considered 29 lower benzenoid hydrocarbons as their experimental data are easily accessible.
The experimental data of Δ T b p for the lower PAHs considered here were provided by the standard NIST databases [69]. On the other hand, the experimental data for Δ H f o were retrieved from Allison and Burgess [2]. To tally the data, we confirmed them with Nikolić et al. [70]. The experimental data for E π for the 29 lower benzenoid hydrocarbons was taken from Lučić et al. [67].
For the molecules in Figure 2 and Figure 3, a degree-based irregularity index was calculated conveniently. However, to save time, one may employ the computational method in Section 3.1 to compute all the irregularity indices in Section 2 simultaneously. After calculating the irregularity indices, we calculated the Pearson correlation coefficient ρ with E π , Δ T b p , and Δ H f o for the 29 lower benzenoid hydrocarbons. Table 2 presents the irregularity indices defined in Section 2 and their correlation coefficients with E π , Δ T b p and Δ H f o for the lower benzenoid hydrocarbons.
By calculating the average of all three correlation coefficients, we can easily see in Table 2 that only the I R A index warrants further usage in the QSPR modeling of the physicochemical and quantum-theoretic properties of benzenoid hydrocarbons. Based on this motivation, next, we focus on the I R A index only.
We conducted a detailed statistical analysis of the I R A index with the experimental data of Δ T b p and Δ H f o for the benzenoid hydrocarbons in Figure 2 and Figure 3. The corresponding statistical parameters such as the correlation coefficient, the regression model with the confidence interval, the standard error of the fit, the determination coefficient, the scatter plot, etc., were computed to assess how closely the I R A index correlated with the experimental data. A similar treatment was given for the π -electronic energy E π and the I R A index for the lower 29 benzenoid hydrocarbons. Table 3 (respectively Table 4) exhibits the values of Δ T b p and Δ H f o (respectively E π ) and the I R A index of the 22 (respectively 29) lower benzenoid hydrocarbons.
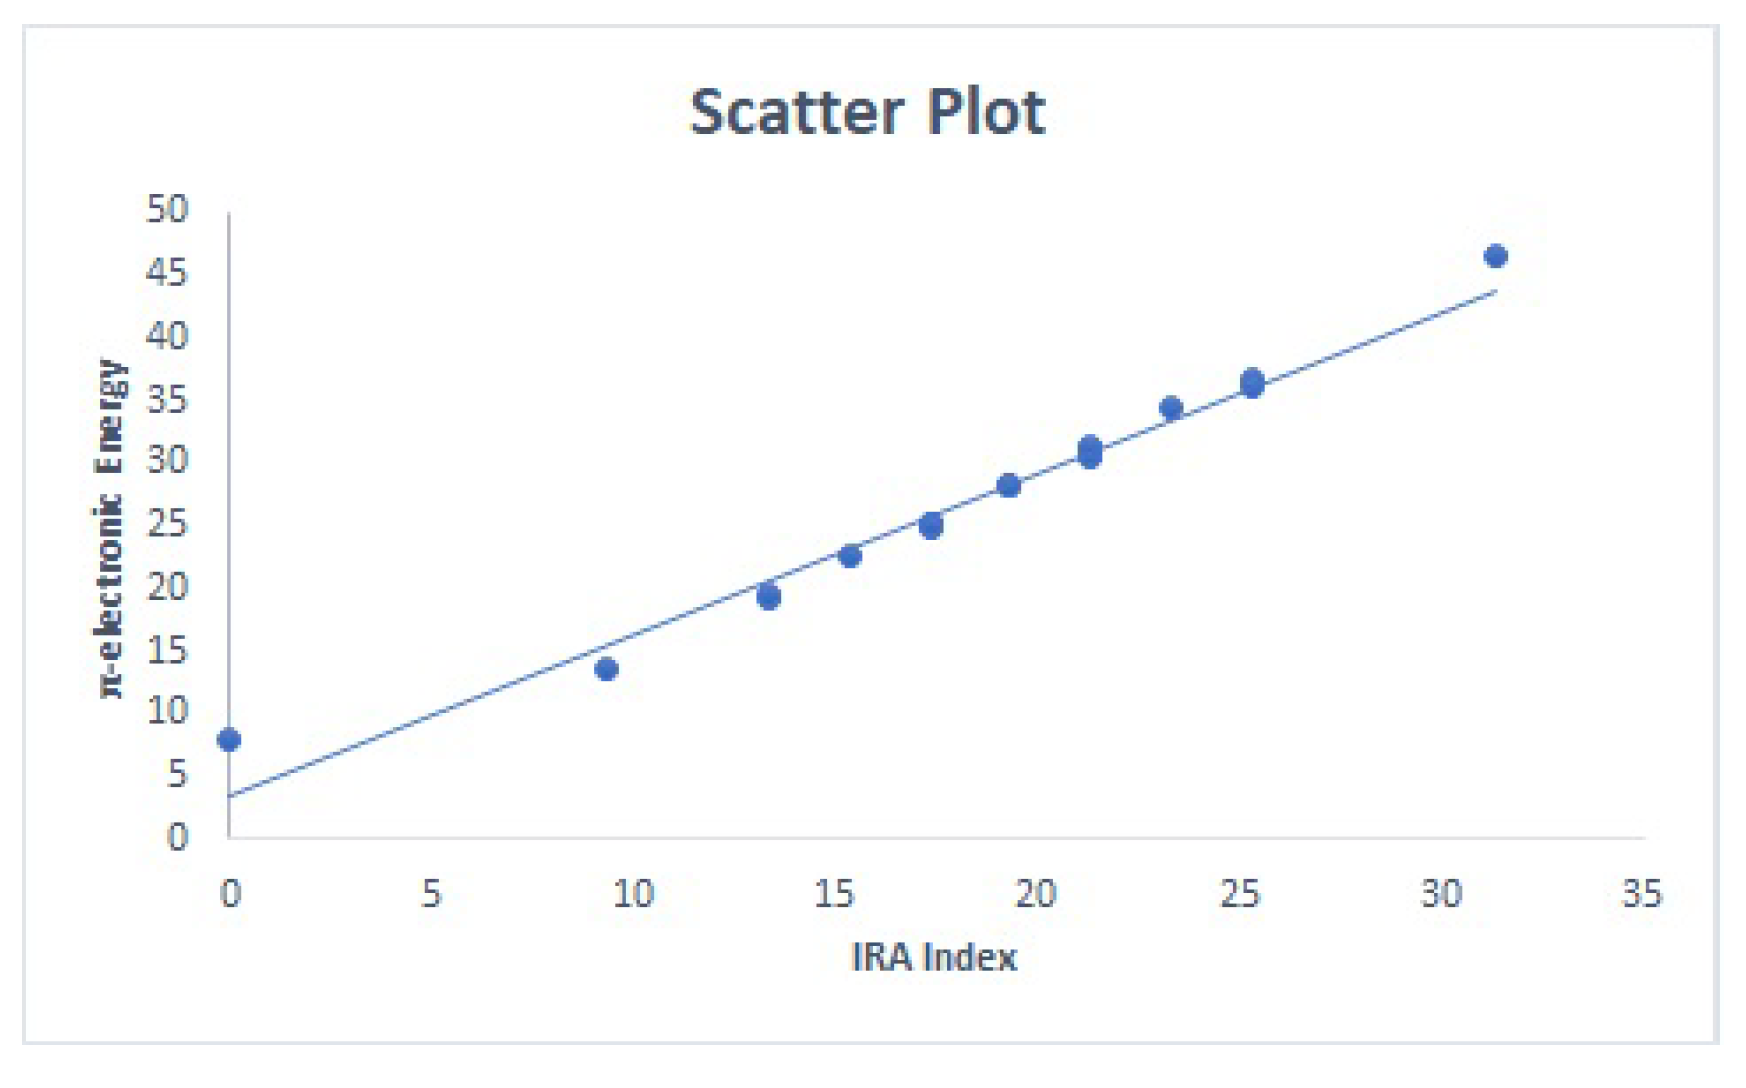
For E π , the linear regression model with the 95 % confidence intervals for the slope and intercepts of the model and the corresponding statistical parameters are given as follows:
E π = 1 . 2808 ± 0.0820 I R A + 3 . 5939 ± 1.6409 , ρ = 0.999 , r 2 = 0.9734 , s = 0.3128 .
Between E π and the I R A index, Figure 4 depicts the scatter plot.
Let ρ be the correlation coefficient. Then, ρ ( Δ H f o ) and ρ ( Δ T b p ) are presented in the following expression.
ρ ( Δ T b p ) = 0.9967 , ρ ( Δ H f o ) = 0.9343 .
The corresponding linear regression models with the 95 % confidence intervals for the slope and intercepts of the models, the determination coefficients, and the standard error of the estimates are given as follows:
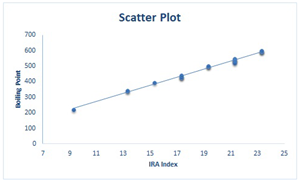
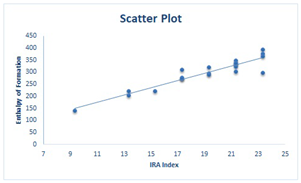
Δ T b p = 25 . 937 ± 19.8399 I R A 13 . 847 ± 1.0223 , r 2 = 0.9933 , s = 8.3218 . Δ H f o = 15 . 003 ± 53.3614 I R A + 11 . 309 ± 2.7496 , r 2 = 0.8728 , s = 22.3824 .
Moreover, Table 5 gives the scatter plots between the I R A index and the two selected properties, i.e., Δ T b p and Δ H f o .
The statistical analysis shows that the I R A index correlates very well with E π , well with Δ T b p , and fairly well with Δ H f o for the lower PAHs. Thus, based on the analysis in this section, further applications of the I R A index in the quantitative structure activity/property relationship models are warranted. This also suggests a window for exploring further mathematical properties of the I R A index.
Next, we derived some mathematical properties of the I R A index. First, we computed the I R A index of various transformation graphs introduced by Wu and Meng [60].

4. The IRA Index of Transformation Graphs

Next, we calculated the I R A index of different transformation and total transformation graphs. The next theorem calculates the I R A index of Γ a b , where a = b = + .
Theorem 1.
Let Γ be an ( υ , ε )-graph. Then, the I R A index of Γ + + of Γ is
I R A ( Γ + + ) = ( υ + ε ) R ( Γ ) E R R ( Γ ) .
Proof. 
By the definition of the I R A index, we have
I R A ( Γ ) = υ 2 y z E ( Γ ) 1 d ( y ) × d ( z ) .
Employing the definition of Γ + + , we have
I R A ( Γ + + ) = ( υ + ε ) 2 y z E ( Γ + + ) 1 d ( y ) × d ( z ) , = ( υ + ε ) 2 y z E a ( Γ + + ) 1 d ( y ) × d ( z ) 2 y z E c ( Γ + + ) 1 d ( y ) × d ( z ) , = ( υ + ε ) 2 y z E ( Γ ) 1 2 d ( y ) × 2 d ( z ) 2 y V ( Γ ) , f E ( Γ ) , f y 1 2 d ( y ) × 2 , = ( υ + ε ) y z E ( Γ ) 1 d ( y ) × d ( z ) 2 y V ( Γ ) , f E ( Γ ) , f y 1 4 d ( y ) , = ( υ + ε ) R ( Γ ) y V ( Γ ) d ( y ) 1 d ( y ) , = ( υ + ε ) R ( Γ ) y V ( Γ ) d ( y ) , = ( υ + ε ) R ( Γ ) E R R ( Γ ) .
This completes the proof. □
The next theorem computes the I R A index of Γ a b , where a = + , b = .
Theorem 2.
Let Γ be an ( υ , ε )-graph. Then, the I R A index of Γ + of Γ is
I R A ( Γ + ) = ( υ + ε ) 2 2 ε ( υ 2 ) υ ! ( υ 2 ) ! 2 ε .
Proof. 
By the definition of the I R A index, we have
I R A ( Γ ) = υ 2 y z E ( Γ ) 1 d ( y ) × d ( z )
Employing the definition of Γ + , we have
I R A ( Γ + ) = ( υ + ε ) 2 y z E ( Γ + ) 1 d ( y ) × d ( z ) , = ( υ + ε ) 2 y z E a ( Γ + ) 1 d ( y ) × d ( z ) 2 y z E c ( Γ + ) 1 d ( y ) × d ( z ) , = ( υ + ε ) 2 y z E ( Γ ) 1 ε × ε 2 y V ( Γ ) , f E ( Γ ) , f y 1 ε × ( υ 2 ) , = ( υ + ε ) 2 y z E ( Γ ) 1 ε 2 2 y V ( Γ ) , f E ( Γ ) , f y 1 ε ( υ 2 ) , = ( υ + ε ) 2 y z E ( Γ ) 1 ε 2 y V ( Γ ¯ ) d ( y ) 1 ε ( υ 2 ) , = ( υ + ε ) 2 2 ε ( υ 2 ) υ ! ( υ 2 ) ! 2 ε , = ( υ + ε ) 2 2 ε ( υ 2 ) υ ! ( υ 2 ) ! 2 ε .
This completes the proof. □
The next result calculates the I R A index of Γ a b , where a = , b = + .
Theorem 3.
Let Γ be an ( υ , ε )-graph. Then, the I R A index of Γ + of Γ is
I R A ( Γ + ) = ( υ + ε ) 2 υ 1 υ ! 2 ! ( υ 2 ) ! ε 4 ε 2 ( υ 1 ) .
Proof. 
By the definition of the I R A index, we have
I R A ( Γ ) = υ 2 y z E ( Γ ) 1 d ( y ) × d ( z )
Employing the definition of Γ + , we have
I R A ( Γ + ) = ( υ + ε ) 2 y z E ( Γ + ) 1 d ( y ) × d ( z ) , = ( υ + ε ) 2 y z E a ( Γ + ) 1 d ( y ) × d ( z ) 2 y z E c ( Γ + ) 1 d ( y ) × d ( z ) , = ( υ + ε ) 2 y z E ( Γ ¯ ) 1 ( υ 1 ) × ( υ 1 ) 2 y V ( Γ ) , f E ( Γ ) , f y 1 ( υ 1 ) × 2 ,
= ( υ + ε ) 2 y z E ( Γ ¯ ) 1 ( υ 1 ) 2 2 y V ( Γ ) , f E ( Γ ) , f y 1 2 ( υ 1 ) , = ( υ + ε ) 2 y z E ( Γ ¯ ) 1 υ 1 2 y V ( Γ ) d ( y ) 1 2 ( υ 1 ) , = ( υ + ε ) 2 υ 1 υ ! 2 ! ( υ 2 ) ! ε 2 2 ε 2 ( υ 1 ) , = ( υ + ε ) 2 υ 1 υ ! 2 ! ( υ 2 ) ! ε 4 ε 2 ( υ 1 ) .
This completes the proof. □
Next, we calculated the I R A index of Γ a b , where a = b = .
Theorem 4.
Let Γ be an ( υ , ε )-graph. Then, the I R A index of Γ of Γ is
I R A ( Γ ) = ( υ + ε ) 2 E R a ( Γ ¯ ) 2 E R R a ( Γ ) .
Proof. 
By the definition of the I R A index, we have
I R A ( Γ ) = υ 2 y z E ( Γ ) 1 d ( y ) × d ( z )
Employing the definition of Γ , we have
I R A ( Γ ) = ( υ + ε ) 2 y z E ( Γ ) 1 d ( y ) × d ( z ) , = ( υ + ε ) 2 y z E a ( Γ ) 1 d ( y ) × d ( z ) 2 y z E c ( Γ ) 1 d ( y ) × d ( z ) , = ( υ + ε ) 2 y z E ( Γ ¯ ) 1 ( ε + υ 1 2 d ( y ) ) × ( ε + υ 1 2 d ( z ) ) 2 y V ( Γ ) , f E ( Γ ) , f y 1 ( ε + υ 1 2 d ( y ) ) × ( υ 2 ) , = ( υ + ε ) 2 E R a ( Γ ¯ ) 2 E R R a ( Γ ) .
This completes the proof. □
The next section calculates the analytically closed formulas of the I R A for various derived graphs introduced in Section 2.

5. The IRA Index of Derived Graphs

This section calculates the I R A index of various derived graphs including the subdivision graph, the line graph, the semi-total point graph, the semi-total line graph, the total graph, the double-graph, the double-graph, the strong double-graph, and the extended double-cover graph.
Next, we calculated the I R A index of the subdivision graph.
Theorem 5.
Let Γ be an ( υ , ε )-graph. Then, the I R A index of the subdivision graph S ( Γ ) of Γ is
I R A ( S ( Γ ) ) = ( υ + ε ) 2 E R R ( Γ ) .
Proof. 
By the definition of the I R A index, we have
I R A ( Γ ) = υ 2 y z E ( Γ ) 1 d ( y ) × d ( z )
By using the structure of the subdivision graph, we have
I R A ( S ( Γ ) ) = ( υ + ε ) 2 y z E S ( Γ ) 1 d ( y ) × d ( z ) , = ( υ + ε ) 2 y z E c S ( Γ ) 1 d ( y ) × d ( z ) , = ( υ + ε ) 2 y V ( Γ ) , f E ( Γ ) , y f 1 d ( y ) × d ( f ) , = ( υ + ε ) 2 y V ( Γ ) , f E ( Γ ) , y f 1 d ( y ) × 2 , = ( υ + ε ) 2 y V ( Γ ) d ( y ) 1 d ( y ) , = ( υ + ε ) 2 y V ( Γ ) d ( y ) , = ( υ + ε ) 2 E R R ( Γ ) .
This completes the proof. □
The following theorem computes the I R A index of the line graph.
Theorem 6.
Let Γ be an ( υ , ε )-graph. Then, the I R A index of the line graph L ( Γ ) of Γ is
I R A ( L ( Γ ) ) = ε 2 R A ( Γ ) .
Proof. 
By the definition of the I R A index, we have
I R A ( Γ ) = υ 2 y z E ( Γ ) 1 d ( y ) × d ( z )
By using the structure of the line graph, we have
I R A ( L ( Γ ) ) = ε 2 y z E ( Γ ) 1 d ( y ) × d ( z ) , = ε 2 y z E b ( Γ ) 1 d ( y ) × d ( z ) , = ε 2 x y , y z E ( Γ ) 1 ( d ( x ) + d ( y ) 2 ) × ( d ( y ) + d ( z ) 2 ) , = ε 2 R A ( Γ ) .
This completes the proof. □
Next, we calculated the exact expression of the I R A index of the semi-total point graph.
Theorem 7.
Let Γ be an ( υ , ε )-graph. Then, the I R A index of the semi-total point graph T 1 ( Γ ) of Γ is
I R A T 1 ( Γ ) = ( ε + υ ) R a ( Γ ) E R R ( Γ ) .
Proof. 
By the definition of the I R A index, we have
I R A ( Γ ) = υ 2 y z E ( Γ ) 1 d ( y ) × d ( z )
By using the structure of the semi-total point graph, we have:
I R A T 1 ( Γ ) = ( ε + υ ) 2 y z E T 1 ( Γ ) 1 d ( y ) × d ( z ) , = ( ε + υ ) 2 y z E a T 1 ( Γ ) 1 d ( y ) × d ( z ) 2 y z E c T 1 ( Γ ) 1 d ( y ) × d ( z ) = ( ε + υ ) 2 y z E ( Γ ) 1 2 d ( y ) × 2 d ( z ) 2 y V ( Γ ) , f E ( Γ ) , y f 1 2 d ( y ) × 2 , = ( ε + υ ) y z E ( Γ ) 1 d ( y ) × d ( z ) y V ( Γ ) d ( y ) 1 d ( y ) , = ( ε + υ ) R a ( Γ ) y V ( Γ ) d ( y ) , = ( ε + υ ) R a ( Γ ) E R R ( Γ ) .
This completes the proof. □
The next theorem calculates the I R A index of the semi-total line graph.
Theorem 8.
Let Γ be an ( υ , ε )-graph. Then, the I R A index of the semi-total line graph T 2 ( Γ ) of Γ is
I R A T 2 ( Γ ) = ( ε + υ ) 2 L R a ( Γ ) 2 M R a ( Γ ) .
Proof. 
By the definition of the I R A index, we have
I R A ( Γ ) = υ 2 y z E ( Γ ) 1 d ( y ) × d ( z )
By using the structure of the semi-total line graph, we have
I R A T 2 ( Γ ) = ( ε + υ ) 2 y z E T 2 ( Γ ) 1 d ( y ) × d ( z ) = ( ε + υ ) 2 y z E b T 2 ( Γ ) 1 d ( y ) × d ( z ) 2 y z E c T 2 ( Γ ) 1 d ( y ) × d ( z ) , = ( ε + υ ) 2 x y , y z E ( Γ ) 1 ( d ( x ) + d ( y ) ) × ( d ( y ) + d ( z ) ) 2 y V ( Γ ) , f E ( Γ ) , y f 1 d ( y ) × d ( f ) , = ( ε + υ ) 2 L R a ( Γ ) 2 y z E ( Γ ) 1 d ( y ) × ( d ( y ) + d ( z ) ) , = ( ε + υ ) 2 L R a ( Γ ) 2 M R a ( Γ ) .
This completes the proof. □
The following theorem calculates the I R A index of the total graph.
Theorem 9.
Let Γ be an ( υ , ε )-graph. Then, the I R A index of the total graph T ( Γ ) of Γ is
I R A T ( Γ ) = ( ε + υ ) R a ( Γ ) 2 L R a ( Γ ) 2 M R a ( Γ ) .
Proof. 
By the definition of the I R A index, we have
I R A ( Γ ) = υ 2 y z E ( Γ ) 1 d ( y ) × d ( z )
By using the structure of the total graph, we have
I R A T ( Γ ) = ( ε + υ ) 2 y z E T ( Γ ) 1 d ( y ) × d ( z ) = ( ε + υ ) 2 y z E a T ( Γ ) 1 d ( y ) × d ( z ) 2 y z E b T ( Γ ) 1 d ( y ) × d ( z ) 2 y z E c T ( Γ ) 1 d ( y ) × d ( z ) , = ( ε + υ ) 2 y z E ( Γ ) 1 2 d ( y ) × 2 d ( z ) 2 x y , y z E ( Γ ) 1 ( d ( x ) + d ( y ) ) × ( d ( y ) + d ( z ) ) 2 y V ( Γ ) , f E ( Γ ) , y f 1 2 d ( y ) × d ( f ) , = ( ε + υ ) R a ( Γ ) 2 L R a ( Γ ) 2 y z E ( Γ ) 1 d ( y ) × ( d ( y ) + d ( z ) ) , = ( ε + υ ) R a ( Γ ) 2 L R a ( Γ ) 2 M R a ( Γ ) .
This completes the proof. □
Next, we calculated the exact expression of the I R A index of the double-graph.
Theorem 10.
Let Γ be an ( υ , ε )-graph. Then, the I R A index of the double-graph D ( Γ ) of Γ is
I R A D ( Γ ) = ( ε + υ ) 4 R a ( Γ ) .
Proof. 
By the definition of the I R A index, we have
I R A ( Γ ) = υ 2 y z E ( Γ ) 1 d ( y ) × d ( z )
By using the structure of the double-graph, we have
I R A D ( Γ ) = ( ε + υ ) 2 y z E D ( Γ ) 1 d ( y ) × d ( z ) = ( ε + υ ) 2 × 2 y z E D ( Γ ) 1 2 d ( y ) × 2 d ( z ) 2 × 2 y z E D ( Γ ) 1 2 d ( y ) × 2 d ( z ) , = ( ε + υ ) 2 R a ( Γ ) 2 R a ( Γ ) , = ( ε + υ ) 4 R a ( Γ ) .
This completes the proof. □
For the strong double-graph, the following theorem computes the I R A index.
Theorem 11.
Let Γ be an ( υ , ε )-graph. Then, the I R A index of the strong double-graph S D ( Γ ) of Γ is
I R A S D ( Γ ) = ( ε + υ ) 8 A R a ( Γ ) .
Proof. 
By the definition of the I R A index, we have
I R A ( Γ ) = υ 2 y z E ( Γ ) 1 d ( y ) × d ( z )
By using the structure of the strong double-graph, we have
I R A ( S D ( Γ ) ) = ( ε + υ ) 2 y z E S D ( Γ ) 1 d ( y ) × d ( z ) = ( ε + υ ) 2 × 2 y z E D ( Γ ) 1 ( 2 d ( y ) + 1 ) × ( 2 d ( z ) + 1 ) 2 × 2 y z E D ( Γ ) 1 ( 2 d ( y ) + 1 ) × ( 2 d ( z ) + 1 ) , = ( ε + υ ) 8 y z E D ( Γ ) 1 ( 2 d ( y ) + 1 ) × ( 2 d ( z ) + 1 ) , = ( ε + υ ) 8 A R a ( Γ ) .
This completes the proof. □
The next theorem calculates the I R A index of the extended double-cover graph.
Theorem 12.
Let Γ be an ( υ , ε )-graph. Then, the I R A index of the extended double-cover graph Γ * of Γ is
I R A ( Γ * ) = ( ε + υ ) 6 B R a ( Γ ) .
Proof. 
By the definition of the I R A index, we have
I R A ( Γ ) = υ 2 y z E ( Γ ) 1 d ( y ) × d ( z )
By using the structure of the extended double-cover graph, we have
I R A ( Γ * ) = ( ε + υ ) 2 y z E ( Γ ) 1 d ( y ) × d ( z ) = ( ε + υ ) 2 × 3 y z E D ( Γ ) 1 ( d ( y ) + 1 ) × ( d ( z ) + 1 ) = ( ε + υ ) 6 y z E D ( Γ ) 1 ( d ( y ) + 1 ) × ( d ( z ) + 1 ) , = ( ε + υ ) 6 B R a ( Γ ) .
This completes the proof. □

6. Applications of Mathematical Results

In this section, we describe how to use the mathematical results in this paper to find the I R A index derivative organic compounds.
Note that all the graph operations employed in the derived and transformation graphs are applicable in both planar and non-planar graphs. However, from the application perspective, all chemical structures are planar, either embeddable in R 2 or R 3 . Thus, first, we redefine some related operations for planar graphs and devise a way to use the results.
Let Ω = ( V , E , F ) be a planar graph with the set of vertices (respectively edges) V (respectively E) and the set of faces F. Let υ : = | V | , ε : = | E | , and ξ : = | F | be the number of vertices, edges, and faces of Ω , respectively. The stellation/capping/triangulation  S t ( Ω ) of Ω is obtained by assigning a new node to each face and adjoining it to all the vertices of the respective face. The Poincaré dual  D u ( Ω ) of a graph Ω is obtained by locating a point in the center of each face and joining two such points if their corresponding faces share a common edge. The medial  M e ( Ω ) of Ω is constructed by putting the new vertices as the midpoints of the original edges. Join two such vertices if and only if the original edges span an angle. The leapfrog  L e ( Γ ) is a composite operation defined as L e ( Γ ) = D u ( S t ( Ω ) ) .
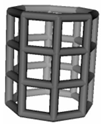
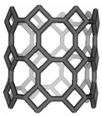
Table 6 presents some carbon nanotubes on a finite number of vertices, edges, and faces. Note that
M e ( T U C 4 [ 8 , 4 ] ) = T U H R C 4 [ 8 , 4 ]
L e ( T U H R C 4 [ 8 , 4 ] ) = T U V S C 4 C 8 [ 8 , 12 ]
L e ( T U Z [ 8 , 4 ] ) = T U A [ 8 , 9 ] .
Equations (3)–(5) imply that, if we know the I R A index of T U C 4 [ 8 , 4 ] and T U Z [ 8 , 4 ] , we could calculate the I R A index of all the other nanotubes. The results in this paper could also be applied to different inorganic structures in a similar fashion.

7. Concluding Remarks

7.1. Conclusions

In this paper, we conducted a quality testing for irregularity indices to correlate with the physicochemical and quantum-theoretic properties of benzenoid hydrocarbons. The normal boiling point Δ T b p and the enthalpy of formation Δ H f o were chosen as representatives of the physicochemical properties, and the π -electronic energy E π was chosen as a representative of the quantum-theoretic properties. A computer-based computational technique was proposed to calculate commonly occurring irregularity indices of any given graph. The computational method was used to calculate irregularity indices for lower benzenoid hydrocarbons. A detailed statistical analysis of the irregularity indices and the experimental values of Δ T b p , Δ H f o , and E π of the lower benzenoid hydrocarbons revealed that the I R A index has the best performance among all commonly occurring irregularity indices.
The I R A index was further studied in context with the derived and transformation graphs. In particular, the I R A index was calculated for the four transformation graphs and various derived graphs such as the semi-total point/line, total, and subdivision graph, among others. Finally, planar versions of those operations for Γ were introduced to propose a way of using those mathematical results to calculate the I R A index of those operated graphs from I R A ( Γ ) .

7.2. Implications

The implications of the research conducted in this paper include:
  • The strong predictive potential of the I R A index warrants its further usage in the quantitative structure activity/property relationship models.
  • The I R A index of all the derived and transformation graphs of a graph Γ can be calculated simply from the information of Γ and I R A ( Γ ) .
  • The planar version of those operations can be employed to study the physicochemical and quantum-theoretic properties of the derivatives of organic compounds.

7.3. Limitations

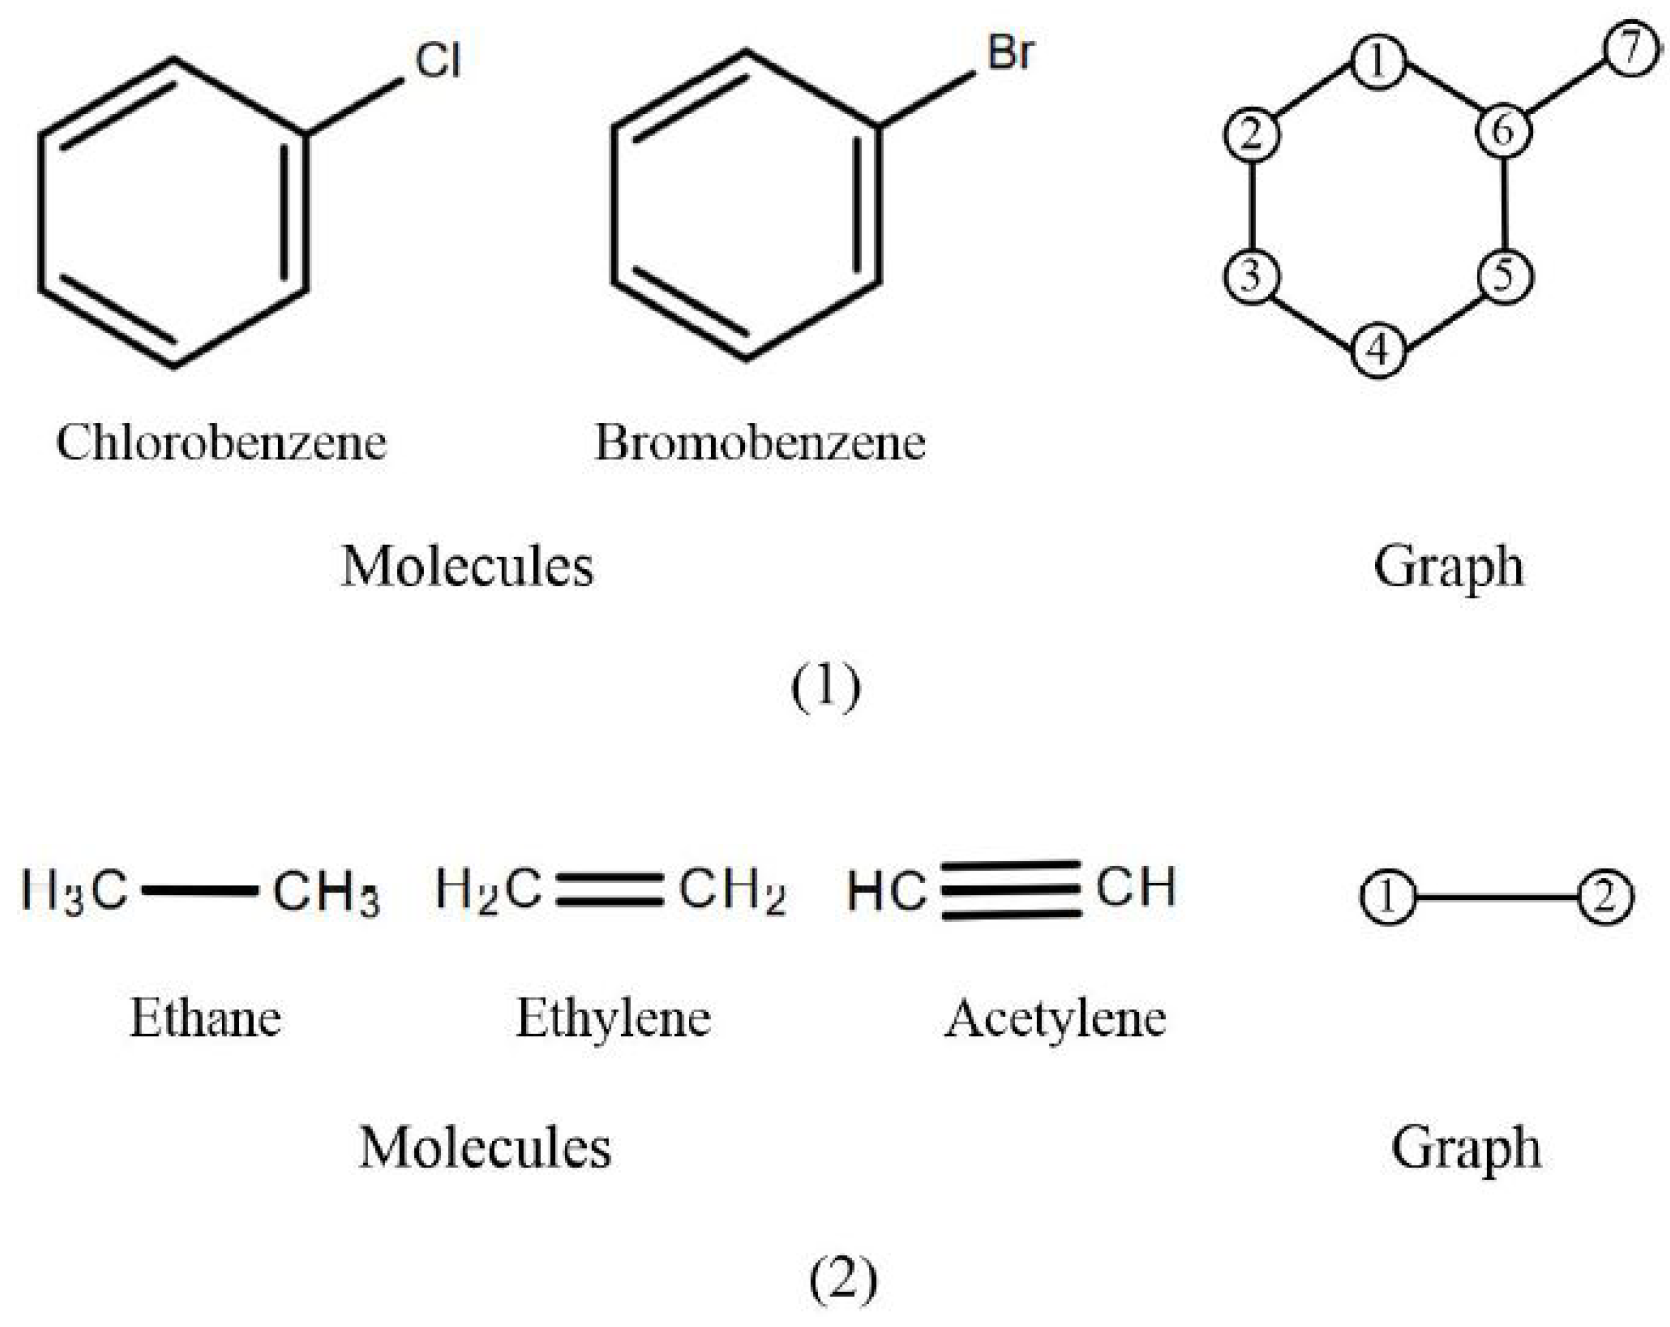
The construction of a chemical graph does not distinguish between the nature of atoms and bonds in a chemical structure and the corresponding vertices and edges of the graph. This leads to the degeneracy of a topological descriptor. For instance, the I R A indices of chlorobenzene and bromobenzene would be the same, as they lead to the same chemical graph. Similarly, the I R A indices of ethane, ethylene, and acetylene would be the same as they also correspond to the same chemical graph. See Figure 5 for a depiction of this phenomenon.
Thus, the current study has a limitation where the degeneracy of topological descriptors occurs.

7.4. Future Scope

The degeneracy of a topological descriptor mentioned in the Limitations Section motivates us to focus on the following problem:
Problem 1.
Employ graph signal processing (GSP) in addressing the degeneracy of irregularity indices or, in general, topological descriptors.
Further mathematical investigation of this I R A index is proposed herewith. Some particular problems that can be studied are as follows:
Problem 2.
Find sharp upper and lower bounds on the I R A index of υ-vertex graphs with a given number of cut-vertices. Moreover, characterize the corresponding extremal cases.
Problem 3.
Find sharp upper/lower bounds on the I R A index of υ-vertex bipartite graphs with a given diameter. Furthermore, characterize the corresponding extremal cases.
Problem 4.
Find sharp upper/lower bounds on the I R A index of υ-vertex trees with a given domination number. Moreover, characterize the corresponding extremal cases.
Problem 5.
Find sharp upper/lower bounds on the I R A index of υ-vertex graphs with a given vertex/edge connectivity.

Author Contributions

S.H. and Y.Z. contributed equally to this work. Conceptualization, S.H. and Y.Z.; methodology, S.H. and A.A.; software, L.Z.; validation, S.H., A.A. and A.K.; formal analysis, A.K.; investigation, A.A. and L.Z.; resources, Y.Z.; data curation, S.H. and A.K.; writing—original draft preparation, A.A., A.K. and L.Z.; writing—review and editing, S.H. and Y.Z.; visualization, S.H.; supervision, Y.Z.; project administration, Y.Z.; funding acquisition, A.K. All authors have read and agreed to the published version of the manuscript.

Funding

Sakander Hayat is supported by the National Natural Science Foundation of China, Grant/Award Number 12250410247. Sakander Hayat (respectively Asad Khan) is supported by the Guangzhou Government Project, Grant/Award Number: 62216235 (respectively 62104301).

Institutional Review Board Statement

Not applicable.

Informed Consent Statement

Not applicable.

Data Availability Statement

There are no data associated with this manuscript.

Acknowledgments

The authors would like to thank the anonymous Reviewers for a careful reading of this article and for all their comments, which led to a number of improvements in the article.

Conflicts of Interest

The authors declare no conflict of interest.

References

  1. Roy, K.; Kar, S.; Das, R.N. A Primer on QSAR/QSPR Modeling: Fundamental Concepts; Springer: Berlin/Heidelberg, Germany, 2015. [Google Scholar]
  2. Allison, T.C.; Burgess, D.R., Jr. First-principles prediction of enthalpies of formation for polycyclic aromatic hydrocarbons and derivatives. J. Phys. Chem. A 2015, 119, 11329–11365. [Google Scholar] [CrossRef] [Green Version]
  3. Estrada, E.; Torres, L.; Rodríguez, L.; Gutman, I. An atom-bond connectivity index: Modelling the enthalpy of formation of alkanes. Indian J. Chem. 1998, 37A, 849–855. [Google Scholar]
  4. Redžepović, I.; Marković, S.; Furtula, B. On structural dependence of enthalpy of formation of catacondensed benzenoid hydrocarbons. MATCH Commun. Math. Comput. Chem. 2019, 82, 663–678. [Google Scholar]
  5. Yu, J.; Sumathi, R.; Green, W.H. Accurate and efficient method for predicting thermochemistry of polycyclic aromatic hydrocarbons-bond-centered group additivity. J. Am. Chem. Soc. 2004, 126, 12685–12700. [Google Scholar] [CrossRef] [PubMed]
  6. Zavitsas, A.A.; Matsunaga, N.; Rogers, D.W. Enthalpies of formation of hydrocarbons by hydrogen atom counting. Theoretical implications. J. Phys. Chem. A 2008, 112, 5734–5741. [Google Scholar] [CrossRef]
  7. Teixeira, A.L.; Leal, J.P.; Falcao, A.O. Random forests for feature selection in QSPR models—An application for predicting standard enthalpy of formation of hydrocarbons. J. Cheminf. 2013, 5, 9–24. [Google Scholar] [CrossRef]
  8. Song, X.; Chai, L.; Zhang, J. Graph signal processing approach to QSAR/QSPR model learning of compounds. IEEE Trans. Pattern Anal. Mach. Intell. 2020; in press. [Google Scholar] [CrossRef]
  9. Dudek, A.Z.; Arodz, T.; Galvez, J. Computational methods in developing quantitative structure-activity relationships (QSAR): A review. Comb. Chem. High Throughput Screen 2006, 9, 213–228. [Google Scholar] [CrossRef]
  10. Mauri, A.; Consonni, V.; Todeschini, R. Molecular Descriptors. Handbook of Computational Chemistry; Springer: Cham, Switzerland, 2016. [Google Scholar]
  11. Todeschini, R.; Consonni, V. Molecular Descriptors for Chemoinformatics; Wiley-VCH: Weinheim, Germany, 2009; Volumes 1 and 2. [Google Scholar]
  12. Vladimirova, N.; Puchkova, E.; Dar’in, D.; Turanov, A.; Babain, V.; Kirsanov, D. Predicting the potentiometric sensitivity of membrane sensors based on modified diphenylphosphoryl acetamide ionophores with QSPR modeling. Membranes 2022, 12, 953. [Google Scholar] [CrossRef]
  13. Dearden, J.C. Advances in QSAR Modeling-Applications in Pharmaceutical, Chemical, Food, Agricultural and Environmental Sciences; Roy, K., Ed.; Springer: Cham, Switzerland, 2017. [Google Scholar]
  14. Devillers, J.; Balaban, A.T. Topological Indices and Related Descriptors in QSAR and QSPR; Gordon & Breach: Amsterdam, The Netherlands, 1999. [Google Scholar]
  15. Talevi, A.; Bellera, C.L.; Di Ianni, M.; Duchowicz, P.R.; Bruno-Blanch, L.E.; Castro, E.A. An integrated drug development approach applying topological descriptors. Curr. Comput. Aided Drug Des. 2012, 8, 172–181. [Google Scholar] [CrossRef]
  16. Hayat, S.; Khan, S.; Khan, A.; Imran, M. Distance-based topological descriptors for measuring the π-electronic energy of benzenoid hydrocarbons with applications to carbon nanotubes. Math. Methods Appl. Sci. 2020; Early View. [Google Scholar] [CrossRef]
  17. Malik, M.Y.H.; Hayat, S.; Khan, S.; Binyamin, M.A. Predictive potential of spectrum-based topological descriptors for measuring the π-electronic energy of benzenoid hydrocarbons with applications to boron triangular and boron α-nanotubes. Math. Methods Appl. Sci. 2021; Early View. [Google Scholar] [CrossRef]
  18. Azadifar, S.; Rostami, M.; Berahmand, K.; Moradi, P.; Oussalah, M. Graph-based relevancy-redundancy gene selection method for cancer diagnosis. Comput. Biol. Med. 2022, 147, 105766. [Google Scholar] [CrossRef] [PubMed]
  19. Gutman, I. Degree-based topological indices. Croat. Chem. Acta 2013, 86, 351–361. [Google Scholar] [CrossRef]
  20. Gutman, I.; Hansen, P.; Mélot, H. Variable neighborhood search for extremal graphs. 10. comparison of irregularity indices for chemical trees. J. Chem. Inf. Model. 2005, 45, 222–230. [Google Scholar] [CrossRef]
  21. Hansen, P.; Mélot, H. Variable neighborhood search for extremal graphs. 9. bounding the irregularity of a graph. Discret. Math. Theor. Comput. Sci. 2005, 69, 253–264. [Google Scholar]
  22. Zhou, B.; Luo, W. On irregularity of graphs. Ars Comb. 2008, 88, 55–64. [Google Scholar]
  23. Luo, W.; Zhou, B. On the irregularity of trees and unicyclic graphs with given matching number. Util. Math. 2010, 83, 141–148. [Google Scholar]
  24. Mukwembi, S. On maximally irregular graphs. Bull. Malays. Math. Sci. Soc. 2013, 36, 717–721. [Google Scholar]
  25. Réti, T.; Dimitrov, D. On irregularities of bidegreed graphs. Acta Polytech. Hung. 2013, 10, 117–134. [Google Scholar]
  26. Dimitrov, D.; Réti, T. Graphs with equal irregularity indices. Acta Polytech. Hung. 2014, 11, 41–57. [Google Scholar]
  27. Abdo, H.; Dimitrov, D.; Gutman, I. Graph irregularity and its measures. Appl. Math. Comput. 2019, 357, 317–324. [Google Scholar] [CrossRef]
  28. Réti, T. On some properties of graph irregularity indices with a particular regard to the σ-index. Appl. Math. Comput. 2019, 344–345, 107–115. [Google Scholar] [CrossRef]
  29. Henning, M.A.; Rautenbach, D. On the irregularity of bipartite graphs. Discret. Math. 2007, 307, 1467–1472. [Google Scholar] [CrossRef] [Green Version]
  30. Abdo, H.; Brandt, S.; Dimitrov, D. The total irregularity of a graph. Discret. Math. Theor. Comput. Sci. 2014, 16, 201–206. [Google Scholar] [CrossRef]
  31. Liu, F.; Zhang, Z.; Meng, J. The size of maximally irregular graphs and maximally irregular triangle-free graphs. Graph. Comb. 2014, 30, 699–705. [Google Scholar] [CrossRef]
  32. Elphick, C.; Wocjan, P. New measures of graph irregularity. arXiv Preprint 2014, arXiv:1305.3570v7. [Google Scholar]
  33. Abdo, H.; Cohen, N.; Dimitrov, D. Graphs with maximal irregularity. Filomat 2014, 28, 1315–1322. [Google Scholar] [CrossRef]
  34. Gutman, I.; Togan, M.; Yurttas, A.; Cevik, A.S.; Cangul, I.N. Inverse problem for sigma index. MATCH Commun. Math. Comput. Chem. 2018, 79, 491–508. [Google Scholar]
  35. Abdo, H.; Dimitrov, D.; Gutman, I. Graphs with maximal σ irregularity. Discret. Appl. Math. 2018, 250, 57–64. [Google Scholar] [CrossRef]
  36. Chen, X.; Hou, Y.; Lin, F. Some new spectral bounds for graph irregularity. Appl. Math. Comput. 2018, 320, 331–340. [Google Scholar] [CrossRef]
  37. Abdo, H.; Dimitrov, D. The irregularity of graphs under graph operations. Discuss. Math. Graph Theory 2014, 34, 263–278. [Google Scholar] [CrossRef]
  38. Abdo, H.; Dimitrov, D. The total irregularity of graphs under graph operations. Miskolc Math. Notes 2014, 15, 3–17. [Google Scholar] [CrossRef]
  39. Abdo, H.; Dimitrov, D. The total irregularity of some composite graphs. Int. J. Comput. Appl. 2015, 122, 1–9. [Google Scholar] [CrossRef]
  40. De, N.; Pal, A.; Nayeem, S.M.A. The irregularity of some composite graphs. Int. J. Appl. Comput. Math. 2016, 2, 411–420. [Google Scholar] [CrossRef] [Green Version]
  41. Réti, T.; Sharafdini, R.; Dregelyi-Kiss, A.; Haghbin, H. Graph irregularity indices used as molecular descriptor in QSPR studies. MATCH Commun. Math. Comput. Chem. 2018, 79, 509–524. [Google Scholar]
  42. Emadi Kouchak, M.M.; Safaei, F.; Reshadi, M. Graph entropies-graph energies indices for quantifying network structural irregularity. J. Supercomput. 2022; Early View. [Google Scholar] [CrossRef]
  43. Collatz, L.; Sinogowitz, U. Spektren endlicher grafen. Abh. Math. Sem. Univ. Hamburg. 1957, 21, 63–77. [Google Scholar] [CrossRef]
  44. Bell, F.K. A note on the irregularity of a graph. Linear Algebra Appl. 1992, 161, 45–54. [Google Scholar] [CrossRef] [Green Version]
  45. Randić, M. On characterization of molecular branching. J. Am. Chem. Soc. 1975, 97, 6609–6615. [Google Scholar] [CrossRef]
  46. Li, X.; Gutman, I. Mathematical Aspects of Randić-Type Molecular Structure Descriptors; Univ. Kragujevac: Kragujevac, Serbia, 2006. [Google Scholar]
  47. Gutman, I.; Ruščić, B.; Trinajstić, N.; Wilcox, C.X. Graph theory and molecular orbital. XII. Acyclic polyenes. J. Chem. Phys. 1975, 62, 3399. [Google Scholar] [CrossRef]
  48. Balaban, A.T.; Motoc, I.; Bonchev, D.; Mekenyan, O. Topological indices for structure-activity correlations. J. Chem. Phys. 1983, 14, 21–55. [Google Scholar]
  49. Furtula, B.; Gutman, I. A forgotten topological index. J. Math. Chem. 2015, 53, 1184–1190. [Google Scholar] [CrossRef]
  50. Li, X.; Shi, Y. A survey on the Randić index. MATCH Commun. Math. Comput. Chem. 2008, 59, 127–156. [Google Scholar]
  51. Estrada, E. Randić index, irregularity and complex biomolecular networks. Acta Chim. Slov. 2010, 57, 597–603. [Google Scholar]
  52. Estrada, E. Quantifying network heterogeneity. Phys. Rev. E 2010, 82, 066102. [Google Scholar] [CrossRef] [Green Version]
  53. Gutman, I. Topological indices and irregularity measures. Bull. Int. Math. Virtual Inst. 2018, 8, 469–475. [Google Scholar]
  54. Kang, S.; Chu, Y.-M.; Virk, A.R.; Nazeer, W.; Jia, J. Computing irregularity indices for probabilistic neural network. Front. Phys. 2020, 8, 359. [Google Scholar] [CrossRef]
  55. Chu, Y.-M.; Abid, M.; Qureshi, M.I.; Fahad, A.; Aslam, A. Irregular topological indices of certain metal organic frameworks. Main Group Met. Chem. 2021, 44, 73–81. [Google Scholar] [CrossRef]
  56. Behzad, M. A criterion for the planarity of a total graph. Proc. Camb. Philos. Soc. 1967, 63, 679–681. [Google Scholar] [CrossRef]
  57. Sampathkumar, E.; Chikkodimath, S.B. The semi-total graphs of a graph-I. J. Karnatak Univ. Sci. 1973, 18, 274–280. [Google Scholar]
  58. Akiyama, J.; Hamada, T.; Yoshimura, I. Miscellaneous properties of middle graphs. TRU Math. 1974, 10, 41–53. [Google Scholar]
  59. Alon, N. Eigenvalues and expanders. Combinatorica 1986, 6, 83–89. [Google Scholar] [CrossRef]
  60. Wu, B.; Meng, J. Basic properties of total transformation graphs. J. Math. Study 2001, 34, 109–116. [Google Scholar]
  61. Xu, L.; Wu, B. Transformation graph G−+−. Discret. Math. 2008, 308, 5144–5148. [Google Scholar] [CrossRef] [Green Version]
  62. Yi, L.; Wu, B. The transformation graph G++−. Aust. J. Comb. 2009, 44, 37–42. [Google Scholar]
  63. Stevanović, D.; Brankov, V.; Cvetković, D.; Simić, S. newGRAPH: A Fully Integrated Environment Used for Research Process in Graph Theory. Available online: http://www.mi.sanu.ac.rs/newgraph/index.html (accessed on 18 November 2022).
  64. MATLAB 8.0 and Statistics Toolbox 8.1; The MathWorks, Inc.: Natick, MA, USA, 2000.
  65. Gutman, I.; Tošović, J. Testing the quality of molecular structure descriptors. Vertex-degree-based topological indices. J. Serb. Chem. Soc. 2013, 78, 805–810. [Google Scholar] [CrossRef]
  66. Gutman, I.; Trinajstić, N. Graph theory and molecular orbitals: Total π-electron energy of alternant hydrocarbons. Chem. Phys. Lett. 1972, 17, 535–538. [Google Scholar] [CrossRef]
  67. Lučić, B.; Trinajstić, N.; Zhou, B. Comparison between the sum-connectivity index and product-connectivity index for benzenoid hydrocarbons. Chem. Phys. Lett. 2009, 47, 146–148. [Google Scholar] [CrossRef]
  68. Chen, D. Comparison between two kinds of connectivity indices for measuring the π-electronic energies of benzenoid hydrocarbons. Z. Naturforsch. A 2019, 74, 367–370. [Google Scholar] [CrossRef]
  69. NIST Standard Reference Database. Available online: http://webbook.nist.gov/chemistry/ (accessed on 18 November 2022).
  70. Nikolić, S.; Trinajstić, N.; Baučić, I. Comparison between the vertex- and edge-connectivity indices for benzenoid hydrocarbons. J. Chem. Inf. Comput. Sci. 1998, 38, 42–46. [Google Scholar] [CrossRef]
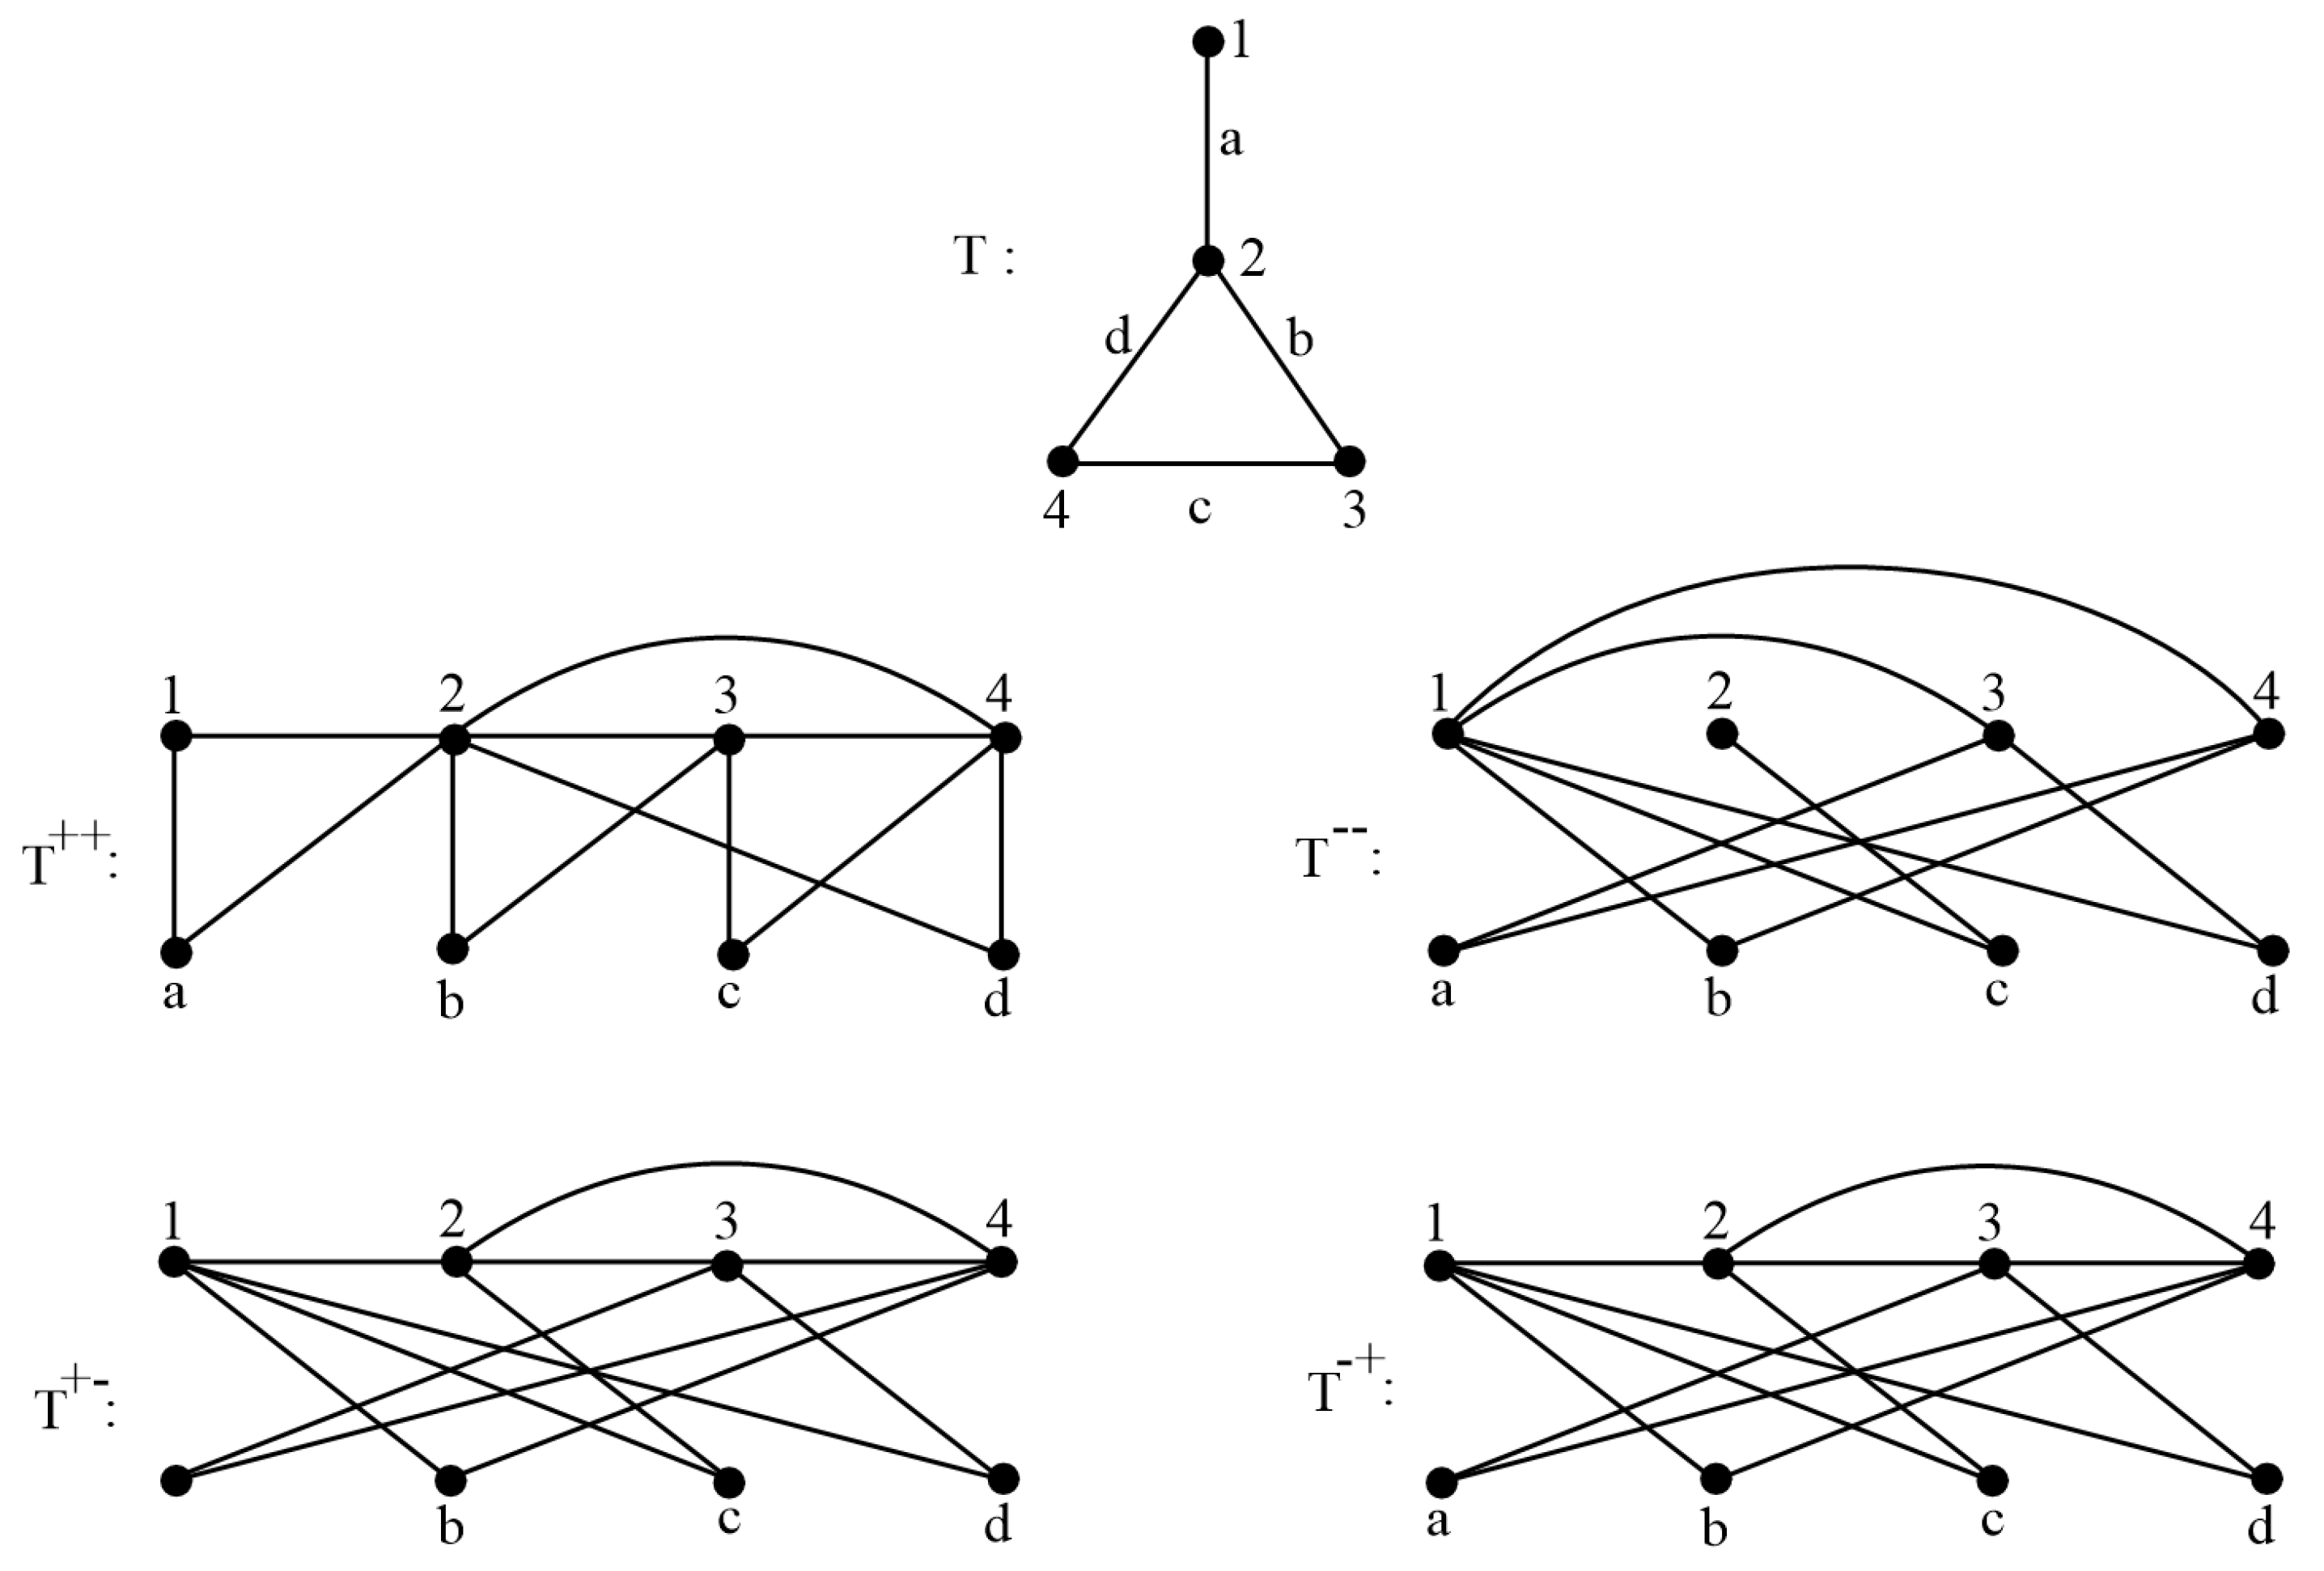
Figure 1. A graph T and its four transformation graphs.
Mathematics 10 04377 g001
Figure 2. The 22 lower benzenoid hydrocarbons. Contd.
Mathematics 10 04377 g002
Figure 3. The 22 lower benzenoid hydrocarbons.
Mathematics 10 04377 g003
Figure 4. Scatter plot between the I R A index and the π -electronic energy.
Mathematics 10 04377 g004
Figure 5. Cases where the degeneracy of the I R A index would occur.
Mathematics 10 04377 g005
Table 1. Some methods studying irregularity indices.
MethodDescription
Gutman et al. [20]Restricted to the class of chemical trees.
Hansen and Mélot [21]Lacks applicability. Restricted to Albertson’s index.
Zhou and Luo [22]Lacks applicability. Restricted to Albertson’s index.
Mukwembi in 2013 [24]Lacks applicability. Restricted to Albertson’s index.
Réti and Dimitrov [25]Lacks applicability. Restricted to bidegreed graphs.
Dimitrov and Réti [26]Lacks applicability. Restricted to Albertson’s index.
Abdo et al. [27]Lacks applicability.
Réti [28]Lacks applicability
Abdo and Dimitrov [37]Applicable to Albertson’s index only.
Abdo and Dimitrov [39]Applicable to Albertson’s index only.
De et al. [40]Applicable to Albertson’s index only.
Réti et al. [41]Chemical applicability restricted to isomeric octanes.
Emadi Kouchak et al. [42]Applications to computer science.
Table 2. The Pearson correlation coefficient ρ between irregularity indices and E π , Δ T b p , and Δ H f o .
Irregularity Index E π Δ T bp Δ H f o
I R A 0.99970.99760.9343
A L 0.73930.80910.7803
σ 0.73930.80910.7803
V a r 0.78350.90210.7793
I R 1 0.99510.99640.9055
I R 2 0.29240.69890.6053
I R F 0.73930.80910.7803
I R F W 0.0862 0.3355 0.2005
I R B 0.73930.80910.7803
I R C 0.45570.79550.6886
I R D I F 0.73930.80910.7803
I R G 0.73930.80910.7803
I R L U 0.73930.80910.7803
I R L F 0.73930.80910.7803
I R L A 0.73930.80910.7803
I R D 0.73930.80910.7803
I R G A 0.73930.80920.7803
I R M 1 0.21860.10720.1526
I R M 2 0.73930.80910.7803
Table 3. The experimental data of Δ T b p and Δ H f o and the I R A index of the 22 lower PAHs.
Molecule Δ T bp in C Δ H f o in kJ/mol IRA
Naphthalene2181419.3333
Phenanthrene338202.713.3333
Anthracene340222.613.3333
Chrysene431271.117.3333
Benzo[a]anthracene425277.117.3333
Triphenylene429275.117.3333
Tetracene440310.517.3333
Benzo[a]pyrene49629619.3333
Benzo[e]pyrene493289.919.3333
Perylene497319.219.3333
Anthanthrene54732321.3333
Benzo[ghi]perylene542301.221.3333
Dibenzo[a,c]anthracene53534821.3333
Dibenzo[a,h]anthracene53533521.3333
Dibenzo[a,j]anthracene531336.321.3333
Picene519336.921.3333
Coronene590296.723.3333
Dibenzo(a,h)pyrene596375.623.3333
Dibenzo(a,i)pyrene59436623.3333
Dibenzo(a,l)pyrene595393.323.3333
Pyrene393221.315.3333
Table 4. The experimental data of E π and the I R A index of the 29 lower PAHs.
Molecule E π (in β Units) IRA
Naphthalene13.68329.3333
Anthracene19.313713.3333
Phenanthrene19.448313.3333
Tetracene24.930817.3333
Benzo[c]phenanthrene25.187517.3333
Benzo[a]anthracene25.101217.3333
Chrysene25.192217.3333
Triphenylene25.274517.3333
Pyrene22.505515.3333
Pentacene30.54421.3333
Benzo[a]tetracene30.725521.3333
Dibenzo[a,h]anthracene30.880521.3333
Dibenzo[a,j]anthracene30.879521.3333
Pentaphene30.762721.3333
Benzo[g]chrysene30.99921.3333
Pentahelicene30.936221.3333
Benzo[c]chrysene30.938621.3333
Picene30.943221.3333
Benzo[b]chrysene30.83921.3333
Dibenzo[a,c]anthracene30.941821.3333
Dibenzo[b,g]phenanthrene30.833621.3333
Perylene28.245319.3333
Benzo[e]pyrene28.336119.3333
Benzo[a]pyrene28.22219.3333
Hexahelicene36.681425.3333
Benzo[ghi]perylene31.425121.3333
Hexacene36.155725.3333
Coronene34.571823.3333
Ovalene46.497431.3333
Table 5. Scatter plots between the I R A index and the two selected properties, i.e., Δ T b p and Δ H f o .
Mathematics 10 04377 i001Mathematics 10 04377 i002  
Between I R A and Δ T b p Between I R A and Δ H f o
Table 6. Some finite-dimensional carbon nanotubes.
Mathematics 10 04377 i003Mathematics 10 04377 i004Mathematics 10 04377 i005
T U C 4 [ 8 , 4 ] T U R C 4 C 8 [ 8 , 4 ] T U H R C 4 [ 8 , 4 ]
Mathematics 10 04377 i006Mathematics 10 04377 i007Mathematics 10 04377 i008
T U V S C 4 C 8 [ 8 , 12 ] T U Z [ 8 , 4 ] T U A [ 8 , 9 ]
Publisher’s Note: MDPI stays neutral with regard to jurisdictional claims in published maps and institutional affiliations.