Abstract
Existing infrared (IR)-visible (VIS) image fusion algorithms demand source images with the same resolution levels. However, IR images are always available with poor resolution due to hardware limitations and environmental conditions. In this correspondence, we develop a novel image fusion model that brings resolution consistency between IR-VIS source images and generates an accurate high-resolution fused image. We train a single deep convolutional neural network model by considering true degradations in real time and reconstruct IR images. The trained multiple degradation skilled network (MDSNet) increases the prominence of objects in fused images from the IR source image. In addition, we adopt multi-resolution singular value decomposition (MRSVD) to capture maximum information from source images and update IR image coefficients with that of VIS images at the finest level. This ensures uniform contrast along with clear textural information in our results. Experiments demonstrate the efficiency of the proposed method over nine state-of-the-art methods using five image quality assessment metrics.
Keywords:
multiple degradation model; deep networks; image fusion; multi-resolution singular value decomposition MSC:
34A08; 26A33; 34A08; 34A34; 34B10
1. Introduction
Multi-modal images have huge demand in many areas, such as medical imaging, target recognition, and remote sensing []. This is due to the advancement in sensor technology. In particular, the infrared (IR) and visible (VIS) sensor combination has distinct advantages. IR sensors capture thermal radiation and represent as IR images. On the contrary, VIS images hold textural details captured from the reflected light on VIS sensors. By considering the mapped IR and VIS sensor data, the fused IR-VIS images have inherent features with good visual understating of a scene [].
Image fusion aims to extract the vital features from multiple source images and merge them into a single image. In this regard, various algorithms have been developed with certain fusion rules. These are based on saliency detection [,,], sparse representation theory [,,], multi-scale transforms [,], convolutional neural networks [,], subspace methods [,], machine and deep learning [,,], hybrid methods [,], and other fusion strategies [,].
In spite of the appreciable performance achieved by these methods, the IR-VIS image fusion at different resolutions still remains an unsolved research problem. IR images usually suffer from poor resolution when compared with the corresponding VIS data. However, the existing methods [,,,,,,,,,,,,,,,,,] do not consider resolution differences between IR and VIS source images, leading to inaccurate fusion results. Under this condition, there are two possible cases while fusing the IR and VIS images with different resolution levels. For intuitiveness, these cases are illustrated in Figure 1. Let the dimensions of IR and VIS images be and , respectively. In case 1, the VIS image is downsampled with a factor s before applying the fusion process []. The fused output in this procedure still suffers from low resolution. For consistency and also to compare with other methods, the fused image is forcibly converted to an HR image. However, this cannot recover the loss of VIS textures caused by the downsampling operation prior to image fusion.
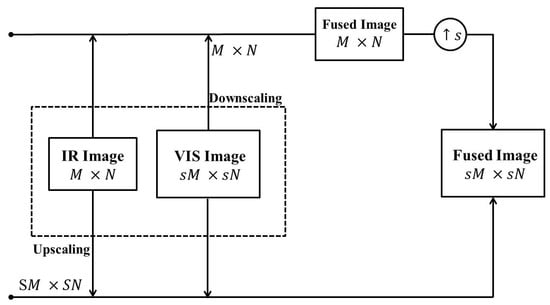
Figure 1.
Different resolution IR-VIS image fusion.
To address this, we confine to case 2 in our work and eliminate inaccuracy and blur in the fused image. Here, the IR image is first upscaled to before using it as the source image []. Hence, both IR and VIS images have the same HR dimensions before applying the fusion process. With the proper upscaling of IR images, both IR and VIS source images contribute to the fused image with improved resolution.
In this paper, we address the problem of image fusion with different resolution VIS-IR source images. We learn a deep CNN by assuming multiple true degradations in real time to improve practicability. The learned multiple degradations skilled network (MDSNet) provides good scalability to recover the IR images with low resolution (LR). Moreover, it creates resolution compatibility between IR-VIS images for the fusion process. Correspondingly, the multi-resolution singular value decomposition captures information from IR-VIS source images in horizontal, vertical and diagonal directions at different levels. The contrast correction on IR image coefficients with that of VIS image coefficients at the finest level ensures better fused images. The rest of this paper is organized as follows. In Section 2, we discuss the degradation model, network structure and loss function of MDSNet. In Section 3, we propose our IR-VIS fusion method by detailing MDSNet upscaling and MRSVD updating. In Section 4, the proposed method is validated over the existing methods based on quantitative metrics and qualitative analysis. Finally, conclusions are presented in Section 5.
2. MDSNet
In recent times, CNNs have shown unprecedented success in extensive applications. However, we limit our discussion on CNNs to super-resolution (SR) imaging in this paper. Existing SR CNN methods apply bicubic downsampling on an HR image, which do not consider true degradation, thus leading to poor performance. To address this issue, we employ the MDSNet for SR that can handle multiple degradations and improve the practicability [,]. In general, the degradation model of an LR image p from the corresponding HR image q can be viewed as
where ⊗ represents convolution operation, b is a blur kernel, indicates a downsampling operation with a factor s, and n is additive Gaussian noise. To obtain better insights on CNNs in the context of SR, we analyze the approximate solution to Equation (1) using the maximum a posteriori (MAP) framework as
Here, the first term represents data fidelity and the second term indicates regularization with a trade-off . The above MAP problem in Equation (2) conveys that the SR reconstruction process should obey the degradation model while estimating HR images. In addition, it is clear that the estimated SR image is a function of LR input p, blur operator b, and standard deviation representing noise level and .
where represents the MAP inference parameter. However, the existing SR networks [,,] limit the single image SR problem to interpolation, neglecting the blurring operation and noise level as . However, this does not cover true degradations, resulting in poor performance. So, we consider the three inputs and together as in Equation (3) while modeling MDSNet. The sizes of and are different, which causes dimensionality mismatch while feeding the CNN. Hence, we apply dimensionality stretching and convert all the input parameters to have a similar size. Let us assume an LR image of size with C number of channels as , a blur operator of size , and a noise level . First, the blur matrix is vectorized to and projected onto k-dimensional space using the principal component analysis (PCA) approach. The obtained vector is then concatenated with the noise level and denoted by a vector t, which is finally stretched into degradation maps of size represented as . Now, these maps have similar size compared to LR images, thus enabling MDSNet capable of handling three inputs simultaneously.
The MDSNet is designed for multiple degradations for improving the real-time SR performance. We describe the architecture of MDSNet in the following.
- The network takes images as input by considering LR images concatenated with degradation maps. The MDSNet achieves non-linear mapping using multiple convolutional layers in cascade form []. Each layer includes convolution operation (CONV), batch normalization (BN) [] and rectifier linear unit (ReLU) [].
- The first “CONV+BN+ReLU” layer operates on input images.
- All the middle layers are similar to each other, performing “CONV+BN+ReLU” operations.
- The last layer consists of “CONV” operation alone, which produces output HR image patches. The last layer is followed by a sub-pixel convolution layer [] to convert HR image patches to a single HR image .
- We use Adam optimizer [] to minimize the loss function,where K is the total number of images including the degradation maps and are the i-th LR and HR images, respectively. For all scale factors s, we set a total of 12 convolution layers with 128 feature maps in each layer. The training is performed separately for different scaling factors. We use the trained model to enhance the resolution of the input LR-IR image in our proposed method.
3. Proposed Method
In this paper, we aim to solve the different resolution IF problem of IR and VIS images. Let us denote the ratio of IR image resolution and VIS image resolution by a factor s. That is, the IR image has dimensions and that of the VIS image is . Given an LR-IR image and an HR-VIS image, the fusion process of our proposed MDSNet-MRSVD algorithm is outlined in Figure 2.
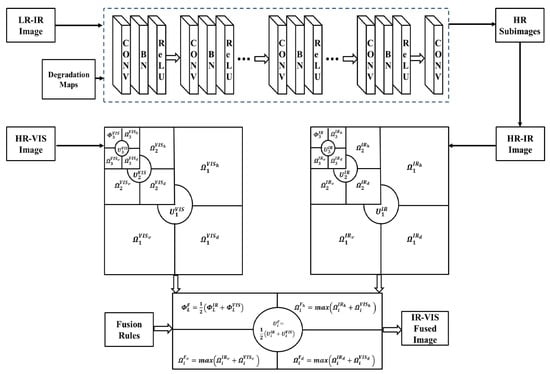
Figure 2.
Proposed IR-VIS image fusion methodology.
3.1. LR-IR Image Upscaling Using MDSNet
Since the IR image has a lower resolution, it is first subjected to MDSNet to generate the corresponding HR-IR image . The MDSNet is trained with numerous HR-LR example patches where the LR images are synthesized using Equation (1). However, the sizes of LR images, blur kernel, and noise are different, which causes dimensionality mismatch while feeding the CNN. Hence, we apply dimensionality stretching and convert all the input parameters to have the same size.
To synthesize HR images using MDSNet, it is required to specify the blur operator and noise level for defining the degradation maps. For blur operation, isotropic Gaussian kernel with a fixed width and anisotropic Gaussian kernel with probability density function having zero mean and variable covariance are used. The blur matrix is vectorized and projected onto k-dimensional space using the PCA approach. The obtained blur vector is concatenated with the additive white Gaussian noise and stretched into degradation maps. By considering these maps, MDSNet can handle multiple degradations in real time and improve the practicability.
MDSNet is optimized by minimizing the loss function in Equation (4) using Adam optimizer []. The learned knowledge is used to produce the HR-IR image with factor s. In other words, the size of HR-IR is which is similar to that of the HR-VIS image.
3.2. MRSVD Coefficients Generation and Updation
The implementation of MRSVD resembles the discrete wavelet transform (DWT) except the finite impulse response filters are replaced with SVDs [,]. However, MRSVD performs similar to DWT but with reduced computations. Moreover, its basis is data dependent unlike a fixed basis in DWT, discrete cosine transform and discrete Fourier transform. Hence, it can capture maximum information from the source IR and VIS images, thereby proving the finest details in the fused image.
The MRSVD of the HR-VIS image is given by
where denotes the L-th level approximation coefficient of the HR-VIS image , are the detailed coefficients of at different levels i in the vertical, horizontal and diagonal directions. represents the eigenvectors of corresponding to .
Similarly, the MRSVD of HR-IR can be written as
where denotes the L-th level approximation coefficient of the HR-IR image , are the detailed coefficients of at different levels i in the vertical, horizontal and diagonal directions. represents the eigenvectors of corresponding to .
The HR-IR image is obtained from its LR-IR using MDSNet. In the process of approximation, a non-uniform illumination may be induced in the resulting image due to the external training database considered. To address this issue, we correct the HR-IR image MRSVD approximation coefficient in Equation (5) using the corresponding VIS image coefficient in Equation (6).
where is the correction factor for updating the coefficient using and at the L-th level. Now, the updated IR approximation coefficient can be obtained as and thus representing the new set of IR coefficients as .
3.3. Fusion Process
In this section, the fusion process of HR-IR and HR-VIS images using approximation coefficients, detailed coefficients and eigenvector matrices is presented. From Equation (5), the is decomposed into , and from Equation (6), is decomposed and updated as . The approximation coefficients and the eigen matrices are fused by following the average strategy, whereas the detailed coefficients of the fused image are obtained by taking the maximum value of IR and VIS image detailed coefficients,
Here, denotes the L-th level approximation coefficient of the fused image. The set represents the detailed coefficients of the fused image in the vertical, horizontal and diagonal directions. In addition, is the fused eigen matrix corresponding to the IR and VIS images. Finally, we apply the inverse MRSVD process and reconstruct the HR fused image using these fused coefficients .
4. Results and Discussion
In this section, we present the experimental settings of the proposed fusion algorithm, methods and metrics used for comparison. Finally, we present a qualitative and quantitative analysis to validate our MDSNet-MRSVD approach over the existing state-of-the-art methods.
4.1. Datasets and Settings
The resolution ratio between IR and VIS input images is set to . However, the dimensions for IR image and for VIS image vary with the input test images. The problem of super-resolving IR images can be solved using or . In general, small scaling factors result in a better enhancement of IR images, and thus, considering large upscaling factors is a challenging task in real time. For this reason, we employ MDSNet with to perform super-resolution on IR input images.
The training data should be as close as possible to the data on which predictions are to be made. In our use case, MDSNet training involves blurry and LR data from a security camera. However, we first select a clean large-scale HR image dataset with DIV2K [] 800 images and BSDS [] 500 images. Out of these 1300 images, 1200 images are randomly selected for training, and the remaining 100 images are used as validation data. Next, the LR images are synthesized using Equation (1) to generate LR-HR image patch pairs. For this, the width of the blur kernel is set to for isotropic Gaussian, the angle range of eigenvectors is set to to determine the space of anisotropic Gaussian kernel, and the noise range is set to [0, 75]. The PCA approach is implemented by setting dimensional space. The loss function in Equation (4) is minimized using the Adams approach [], with an initial learning rate and mini-batch size set to and 8, respectively. The learning rate reduces by a factor of 10 when the loss is becoming saturated.
The MRSVD of HR-VIS and HR-VIS images in Equations (5) and (6) are implemented with levels, and the corresponding is computed for the 2nd level as shown in Equation (7). The coefficients and the updated coefficients are fused using Equations (8)–(12), which are followed by the inverse MRSVD with levels. For testing the MDSNet-MRSVD approach, we select 20 IR-VIS registered HR image pairs from the TNO Human Factors [] dataset. The IR and VIS images corresponding to each image pair in the dataset have the same resolution. In our experiments, we downscale the IR images to LR by the factor .
4.2. Methods and Evaluation Metrics
We compare the proposed method with nine state-of-the-art IF methods, including a deep networks based super-resolution model in the stationary wavelet domain [], the adversarial game model [], total variation minimization (TVM) [], gradient transfer–TVM problem [], multi-sensor IF model with one level SVD [], wavelets approach [], image guided filtering [], curvelet transform [], and Laplacian pyramid model []. All the methods are implemented using Matlab software on a system with Intel(R) Core(TM) i7-8750H CPU @ 2.20 GHz and 16 GB RAM.
For the comprehensive evaluation of different IF methods, we adopt the peak signal-to-noise ratio (PSNR) [] and structural similarity index measure (SSIM) []. In addition, the total IF performance , IF loss , and IF artifacts are also considered for in-depth IF performance analysis []. It is noted that the sum of , , and should be unity []. The metrics SD, EN, and SF depend on the fused image only, whereas PSNR, SSIM, , , and depend on both fused and IR and VIS source images. Theoretically, PSNR, SSIM, SD, SF, EN, and should be high, and , and should be low for better IF performance.
4.3. Qualitative Results Analysis
For qualitative comparison of different state-of-the-art IF methods, the visual IF results on seven typical IR-VIS image pairs are presented in Figure 3, Figure 4, Figure 5, Figure 6, Figure 7, Figure 8 and Figure 9. In Figure 3 and Figure 4, the fused images of the proposed method, existing methods [,,,,,,,,] on test image pair1-duine sequence and test image pair4-tree sequence are given, respectively. Figure 3a,b represent the IR-VIS source images of the duine sequence and Figure 4a,b represent the IR-VIS source images of the tree sequence. Figure 3c and Figure 4c show the results of the proposed MDSNet-MRSVD method, whereas Figure 3d–l and Figure 4d–l are the fused images from the methods in [,,,,,,,,]. Here, we have selected the captains present in the duine sequence and tree sequence as our region of interest. It can be noticed that the thermal information is well preserved in our result. In Figure 3, the captains contrast is higher in Figure 3c than in Figure 3f–j. The fused images in Figure 3d,e,k,l also enhance the contrast, but it comes with an additional blurring.
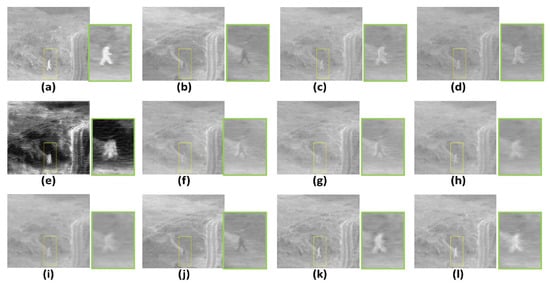
Figure 3.
Visual IF results of different methods on duine sequence: (a) IR image, (b) VIS image, (c) Proposed method, (d) [], (e) [], (f) [], (g) [], (h) [], (i) [], (j) [], (k) [], and (l) [].
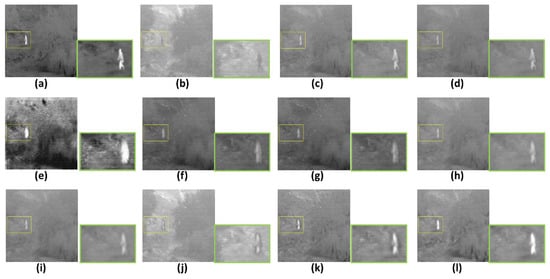
Figure 4.
Visual IF results of different methods on tree sequence: (a) IR image, (b) VIS image, (c) Proposed method, (d) [], (e) [], (f) [], (g) [], (h) [], (i) [], (j) [], (k) [], and (l) [].
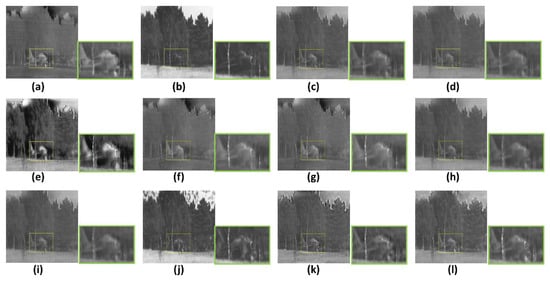
Figure 5.
Visual IF results of different methods on airplane in trees: (a) IR image, (b) VIS image, (c) Proposed method, (d) [], (e) [], (f) [], (g) [], (h) [], (i) [], (j) [], (k) [], and (l) [].
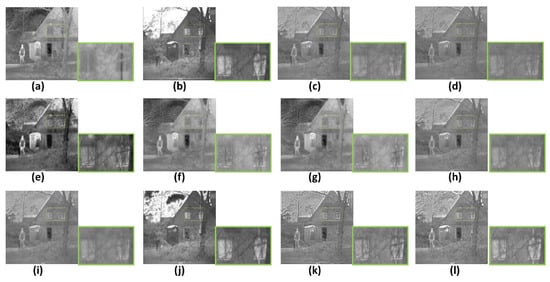
Figure 6.
Visual IF results of different methods on two men in front of house: (a) IR image, (b) VIS image, (c) Proposed method, (d) [], (e) [], (f) [], (g) [], (h) [], (i) [], (j) [], (k) [], and (l) [].
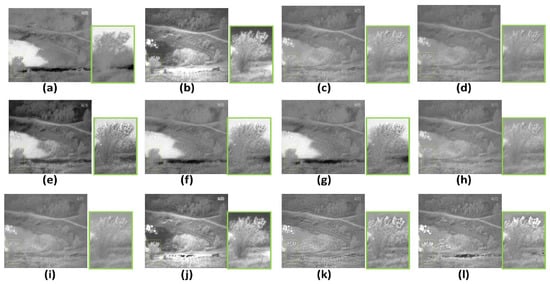
Figure 7.
Visual IF results of different methods on lake: (a) IR image, (b) VIS image, (c) Proposed method, (d) [], (e) [], (f) [], (g) [], (h) [], (i) [], (j) [], (k) [], and (l) [].
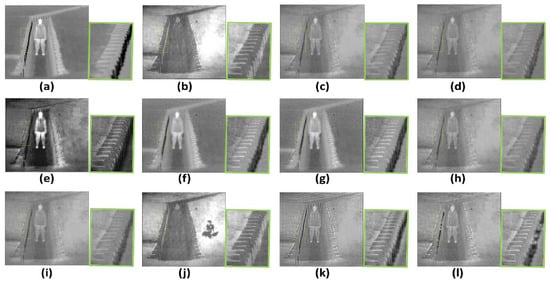
Figure 8.
Visual IF results of different methods on soldier in trench: (a) IR image, (b) VIS image, (c) Proposed method, (d) [], (e) [], (f) [], (g) [], (h) [], (i) [], (j) [], (k) [], and (l) [].
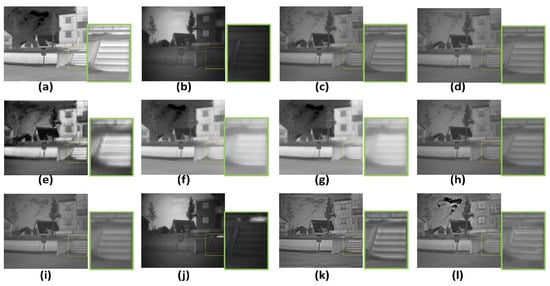
Figure 9.
Visual IF results of different methods on marne: (a) IR image, (b) VIS image, (c) Proposed method, (d) [], (e) [], (f) [], (g) [], (h) [], (i) [], (j) [], (k) [], and (l) [].
In Figure 5, Figure 6 and Figure 7, the results of the proposed method and the existing methods [,,,,,,,,] on test image pair7-airplane in trees, test image pair10-two men in front of house, and test image pair13-lake are evaluated. Figure 5a,b represent the IR-VIS source images of airplane in trees, Figure 6a,b represent the IR-VIS source images of two men in front of house, and Figure 7a,b represent the IR-VIS source images of lake. Figure 5c, Figure 6c and Figure 7c show the results of the proposed MDSNet-MRSVD method, whereas the fused images of the methods in [,,,,,,,,] are shown in Figure 5d–l, Figure 6d–l and Figure 7d–l. For airplane in trees, our region of interest is airplane, and for two men in front of house and lake, we highlight the tree branches. Here, the fine textures are greatly recovered in our results. For example, the tree branches corresponding to the test image pair10 and test image pair13 are clearly visible in Figure 6c and Figure 7c, whereas the results in Figure 6d–l and Figure 7d–l suffer from non-uniform illumination along the textures.
Finally, Figure 8 and Figure 9 compare the proposed method with the existing methods [,,,,,,,,] using the results on test image pair16-soldier in trench and test image pair19-marne. Figure 8a,b represent the IR-VIS source images of soldier in trench and Figure 9a,b are the IR-VIS source images of marne. Figure 8c and Figure 9c show the results of the proposed MDSNet-MRSVD method. The fused images of the methods in [,,,,,,,,] are shown in Figure 8d–l and Figure 9d–l. Here, we have selected the stairs present in soldier in trench and marne as our region of interest. We can notice that the stairs are clearer for our method in Figure 8c and Figure 9c compared to the existing methods. Moreover, our results provide good thermal information with minimized blurring effect.
4.4. Quantitative Results Analysis
We first performed qualitative analysis in Figure 3, Figure 4, Figure 5, Figure 6, Figure 7, Figure 8 and Figure 9. It is based on human visual perception and usually focuses on the contrast, edge details, and sharpness of an image. However, the visual results alone are insufficient to prove the significance of the proposed method. Therefore, we also present quantitative analysis which is consistent with visual results and is based on PSNR, SSIM, , and . In Table 1, we show different metrics of the proposed method averaged over 20 IR-VIS test image pairs. The individual metric results of different fusion methods are summarized in Figure 10.

Table 1.
Average PSNR, SSIM, , and indices of different methods.
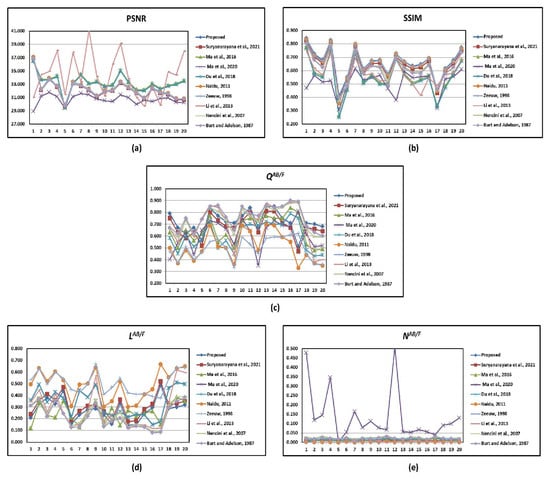
Figure 10.
Metric results of different methods [,,,,,,,,] on 20 IR-VIS test image pairs: (a) PSNR (b) SSIM (c) (d) (e) .
As seen, the proposed method produces outstanding results in terms of PSNR, SSIM, , and . The method in [] and proposed method are capable of generating PSNR values above 34. In addition, the proposed method has the highest SSIM index of 0.663 compared to other methods. The methods in [,] and the proposed method have values of 0.759, 0.738, and 0.720, respectively. In addition to the proposed method, the methods in [,] are advantageous with smaller indices. In terms of , the proposed method is comparable to the methods in [,,].
The average runtime values corresponding to the proposed method and the existing methods [,,,,,,,,] are given in Table 2. It can be noticed that the methods in [,,] are the fastest methods that can execute in 1 s. The proposed method and the methods in [,,] consume less than 10 s. In contrast, the methods in [,,] are the slowest methods with execution times of 14.52, 32.56, and 12.79 s, respectively. Even though the methods in [,,] are the fastest methods, the method in [] yields very poor fusion performance , resulting in high fusion loss . The methods in [,] suffer from poor SSIM indices with more noise compared to the proposed method. In particular, when better visual quality is desired with high PSNR, SSIM indices and low fusion loss, a slight increase in computational time is acceptable in view of improved computational facilities.
Table 2.
Average runtime (in seconds) comparison of different methods on 20 IR-VIS test image pairs.
Thus, comparing all metrics together, the proposed method can be seen as the best method in terms of SSIM, second best performed in terms of PSNR and , and third best performed with metrics. Additionally, it gives comparable results in view of the metrics as well.
5. Conclusions
In this correspondence, we propose a IR-VIS image fusion algorithm based on MDSNet and MRSVD updation. The proposed method does not demand source images with the same spatial resolution but still produces a high spatial resolution. The multi-degradation handling capabilities of MDSNet and IR image coefficient correction using MRSVD enrich the fused image with clear visible textures and thermal radiation information. Extensive visual comparisons on various IR-VIS test images demonstrate the qualitative superiority of our method. The proposed method yields good results on PSNR, SSIM, and with less fusion loss and artifcats as well.
Author Contributions
Conceptualization, S.R.P.; Methodology, G.S.; Supervision, V.V.; Writing—original draft, G.S.; Writing—review & editing, G.N. and G.K. All authors have read and agreed to the published version of the manuscript.
Funding
This research received no external funding.
Institutional Review Board Statement
Not applicable.
Informed Consent Statement
Not applicable.
Data Availability Statement
Not applicable.
Conflicts of Interest
The authors declare no conflict of interest.
References
- Hervella, Á.S.; Rouco, J.; Novo, J.; Ortega, M. Retinal microaneurysms detection using adversarial pre-training with unlabeled multimodal images. Inf. Fusion 2022, 79, 146–161. [Google Scholar] [CrossRef]
- Jin, X.; Jiang, Q.; Yao, S.; Zhou, D.; Nie, R.; Hai, J.; He, K. A survey of infrared and visual image fusion methods. Infrared Phys. Technol. 2017, 85, 478–501. [Google Scholar] [CrossRef]
- Zhang, X.; Ma, Y.; Fan, F.; Zhang, Y.; Huang, J. Infrared and visible image fusion via saliency analysis and local edge-preserving multi-scale decomposition. JOSA A 2017, 34, 1400–1410. [Google Scholar] [CrossRef] [PubMed]
- Shibata, T.; Tanaka, M.; Okutomi, M. Visible and near-infrared image fusion based on visually salient area selection. In Digital Photography XI, Proceedings of the International Society for Optics and Photonics, San Francisco, CA, USA, 9–10 February 2015; SPIE: Bellingham, WA, USA, 2015; Volume 9404, p. 94040G. [Google Scholar]
- Suryanarayana, G.; Tu, E.; Yang, J. Infrared super-resolution imaging using multi-scale saliency and deep wavelet residuals. Infrared Phys. Technol. 2019, 97, 177–186. [Google Scholar] [CrossRef]
- Li, S.; Yin, H.; Fang, L. Group-sparse representation with dictionary learning for medical image denoising and fusion. IEEE Trans. Biomed. Eng. 2012, 59, 3450–3459. [Google Scholar] [CrossRef]
- Zhang, Q.; Liu, Y.; Blum, R.S.; Han, J.; Tao, D. Sparse representation based multi-sensor image fusion for multi-focus and multi-modality images: A review. Inf. Fusion 2018, 40, 57–75. [Google Scholar] [CrossRef]
- Suryanarayana, G.; Dhuli, R. Image resolution enhancement using wavelet domain transformation and sparse signal representation. Procedia Comput. Sci. 2016, 92, 311–316. [Google Scholar] [CrossRef]
- Pajares, G.; De La Cruz, J.M. A wavelet-based image fusion tutorial. Pattern Recognit. 2004, 37, 1855–1872. [Google Scholar] [CrossRef]
- Dogra, A.; Goyal, B.; Agrawal, S. From multi-scale decomposition to non-multi-scale decomposition methods: A comprehensive survey of image fusion techniques and its applications. IEEE Access 2017, 5, 16040–16067. [Google Scholar] [CrossRef]
- Liu, Y.; Chen, X.; Cheng, J.; Peng, H.; Wang, Z. Infrared and visible image fusion with convolutional neural networks. Int. J. Wavelets Multiresolut. Inf. Process. 2018, 16, 1850018. [Google Scholar] [CrossRef]
- Kong, W.; Zhang, L.; Lei, Y. Novel fusion method for visible light and infrared images based on NSST–SF–PCNN. Infrared Phys. Technol. 2014, 65, 103–112. [Google Scholar] [CrossRef]
- Bavirisetti, D.P.; Xiao, G.; Liu, G. Multi-sensor image fusion based on fourth order partial differential equations. In Proceedings of the 2017 20th International Conference on Information Fusion (Fusion), Xi’an, China, 10–13 July 2017; IEEE: Piscataway, NJ, USA, 2017; pp. 1–9. [Google Scholar]
- Patil, U.; Mudengudi, U. Image fusion using hierarchical PCA. In Proceedings of the 2011 International Conference on Image Information Processing, Shimla, India, 3–5 November 2011; IEEE: Piscataway, NJ, USA, 2011; pp. 1–6. [Google Scholar]
- Ma, J.; Yu, W.; Liang, P.; Li, C.; Jiang, J. FusionGAN: A generative adversarial network for infrared and visible image fusion. Inf. Fusion 2019, 48, 11–26. [Google Scholar] [CrossRef]
- Liu, Y.; Chen, X.; Wang, Z.; Wang, Z.J.; Ward, R.K.; Wang, X. Deep learning for pixel-level image fusion: Recent advances and future prospects. Inf. Fusion 2018, 42, 158–173. [Google Scholar] [CrossRef]
- Suryanarayana, G.; Chandran, K.; Khalaf, O.I.; Alotaibi, Y.; Alsufyani, A.; Alghamdi, S.A. Accurate magnetic resonance image super-resolution using deep networks and Gaussian filtering in the stationary wavelet domain. IEEE Access 2021, 9, 71406–71417. [Google Scholar] [CrossRef]
- Liu, Y.; Liu, S.; Wang, Z. A general framework for image fusion based on multi-scale transform and sparse representation. Inf. Fusion 2015, 24, 147–164. [Google Scholar] [CrossRef]
- Ma, J.; Zhou, Z.; Wang, B.; Zong, H. Infrared and visible image fusion based on visual saliency map and weighted least square optimization. Infrared Phys. Technol. 2017, 82, 8–17. [Google Scholar] [CrossRef]
- Ma, Y.; Chen, J.; Chen, C.; Fan, F.; Ma, J. Infrared and visible image fusion using total variation model. Neurocomputing 2016, 202, 12–19. [Google Scholar] [CrossRef]
- Ma, J.; Chen, C.; Li, C.; Huang, J. Infrared and visible image fusion via gradient transfer and total variation minimization. Inf. Fusion 2016, 31, 100–109. [Google Scholar] [CrossRef]
- Ma, J.; Xu, H.; Jiang, J.; Mei, X.; Zhang, X.P. DDcGAN: A dual-discriminator conditional generative adversarial network for multi-resolution image fusion. IEEE Trans. Image Process. 2020, 29, 4980–4995. [Google Scholar] [CrossRef]
- Zhou, Z.; Wang, B.; Li, S.; Dong, M. Perceptual fusion of infrared and visible images through a hybrid multi-scale decomposition with Gaussian and bilateral filters. Inf. Fusion 2016, 30, 15–26. [Google Scholar] [CrossRef]
- Chen, R.; Zhang, H.; Liu, J. Multi-attention augmented network for single image super-resolution. Pattern Recognit. 2022, 122, 108349. [Google Scholar] [CrossRef]
- Zhang, K.; Zuo, W.; Zhang, L. Learning a single convolutional super-resolution network for multiple degradations. In Proceedings of the IEEE Conference on Computer Vision and Pattern Recognition, Salt Lake City, UT, USA, 18–23 June 2018; pp. 3262–3271. [Google Scholar]
- Ioffe, S.; Szegedy, C. Batch normalization: Accelerating deep network training by reducing internal covariate shift. In Proceedings of the International Conference on Machine Learning, Lille, France, 6–11 July 2015; pp. 448–456. [Google Scholar]
- Krizhevsky, A.; Sutskever, I.; Hinton, G.E. Imagenet classification with deep convolutional neural networks. Adv. Neural Inf. Process. Syst. 2012, 25. [Google Scholar] [CrossRef]
- Shi, W.; Caballero, J.; Huszár, F.; Totz, J.; Aitken, A.P.; Bishop, R.; Rueckert, D.; Wang, Z. Real-time single image and video super-resolution using an efficient sub-pixel convolutional neural network. In Proceedings of the IEEE Conference on Computer Vision and Pattern Recognition, Las Vegas, NV, USA, 27–30 June 2016; pp. 1874–1883. [Google Scholar]
- Na, G.S. Efficient learning rate adaptation based on hierarchical optimization approach. Neural Netw. 2022, 150, 326–335. [Google Scholar] [CrossRef]
- Zhang, X.; Zhang, C.; Wei, Z. Carbon price forecasting based on multi-resolution singular value decomposition and extreme learning machine optimized by the moth–flame optimization algorithm considering energy and economic factors. Energies 2019, 12, 4283. [Google Scholar] [CrossRef]
- Suryanarayana, G.; Dhuli, R. Super-resolution image reconstruction using dual-mode complex diffusion-based shock filter and singular value decomposition. Circuits Syst. Signal Process. 2017, 36, 3409–3425. [Google Scholar] [CrossRef]
- Martin, D.; Fowlkes, C.; Tal, D.; Malik, J. A database of human segmented natural images and its application to evaluating segmentation algorithms and measuring ecological statistics. In Proceedings of the Eighth IEEE International Conference on Computer Vision, ICCV 2001, Vancouver, BC, Canada, 7–14 July 2001; IEEE: Piscataway, NJ, USA, 2001; Volume 2, pp. 416–423. [Google Scholar]
- Du, Q.; Xu, H.; Ma, Y.; Huang, J.; Fan, F. Fusing infrared and visible images of different resolutions via total variation model. Sensors 2018, 18, 3827. [Google Scholar] [CrossRef]
- Naidu, V. Image fusion technique using multi-resolution singular value decomposition. Def. Sci. J. 2011, 61, 479. [Google Scholar] [CrossRef]
- Zeeuw, P. Wavelets and Image Fusion; CWI: Amsterdam, The Netherlands, 1998; Volume 444. [Google Scholar]
- Li, S.; Kang, X.; Hu, J. Image fusion with guided filtering. IEEE Trans. Image Process. 2013, 22, 2864–2875. [Google Scholar]
- Nencini, F.; Garzelli, A.; Baronti, S.; Alparone, L. Remote sensing image fusion using the curvelet transform. Inf. Fusion 2007, 8, 143–156. [Google Scholar] [CrossRef]
- Burt, P.J.; Adelson, E.H. The Laplacian pyramid as a compact image code. In Readings in Computer Vision; Elsevier: Amsterdam, The Netherlands, 1987; pp. 671–679. [Google Scholar]
- Hore, A.; Ziou, D. Image quality metrics: PSNR vs. SSIM. In Proceedings of the 2010 20th International Conference on Pattern Recognition, Istanbul, Turkey, 23–26 August 2010; IEEE: Piscataway, NJ, USA, 2010; pp. 2366–2369. [Google Scholar]
- Zhao, C.; Shao, G.; Ma, L.; Zhang, X. Image fusion algorithm based on redundant-lifting NSWMDA and adaptive PCNN. Optik 2014, 125, 6247–6255. [Google Scholar] [CrossRef]
- Shreyamsha Kumar, B. Multifocus and multispectral image fusion based on pixel significance using discrete cosine harmonic wavelet transform. Signal Image Video Process. 2013, 7, 1125–1143. [Google Scholar] [CrossRef]
- Petrovic, V.; Xydeas, C. Objective image fusion performance characterisation. In Proceedings of the Tenth IEEE International Conference on Computer Vision (ICCV’05) Volume 1, Beijing, China, 17–21 October 2005; IEEE: Piscataway, NJ, USA, 2005; Volume 2, pp. 1866–1871. [Google Scholar]
Publisher’s Note: MDPI stays neutral with regard to jurisdictional claims in published maps and institutional affiliations. |
© 2022 by the authors. Licensee MDPI, Basel, Switzerland. This article is an open access article distributed under the terms and conditions of the Creative Commons Attribution (CC BY) license (https://creativecommons.org/licenses/by/4.0/).