Article

Binary Approaches of Quantum-Based Avian Navigation Optimizer to Select Effective Features from High-Dimensional Medical Data

by
Mohammad H. Nadimi-Shahraki
1,2,3,*,
Ali Fatahi
1,2,
Hoda Zamani
1,2 and
Seyedali Mirjalili
3,4,*
1
Faculty of Computer Engineering, Najafabad Branch, Islamic Azad University, Najafabad 8514143131, Iran
2
Big Data Research Center, Najafabad Branch, Islamic Azad University, Najafabad 8514143131, Iran
3
Centre for Artificial Intelligence Research and Optimisation, Torrens University Australia, Brisbane 4006, Australia
4
Yonsei Frontier Lab, Yonsei University, Seoul 03722, Korea
*
Authors to whom correspondence should be addressed.
Mathematics 2022, 10(15), 2770; https://doi.org/10.3390/math10152770
Submission received: 6 July 2022 / Revised: 31 July 2022 / Accepted: 1 August 2022 / Published: 4 August 2022
(This article belongs to the Special Issue Quantum Algorithms and Relative Problems)

Abstract

:
Many metaheuristic approaches have been developed to select effective features from different medical datasets in a feasible time. However, most of them cannot scale well to large medical datasets, where they fail to maximize the classification accuracy and simultaneously minimize the number of selected features. Therefore, this paper is devoted to developing an efficient binary version of the quantum-based avian navigation optimizer algorithm (QANA) named BQANA, utilizing the scalability of the QANA to effectively select the optimal feature subset from high-dimensional medical datasets using two different approaches. In the first approach, several binary versions of the QANA are developed using S-shaped, V-shaped, U-shaped, Z-shaped, and quadratic transfer functions to map the continuous solutions of the canonical QANA to binary ones. In the second approach, the QANA is mapped to binary space by converting each variable to 0 or 1 using a threshold. To evaluate the proposed algorithm, first, all binary versions of the QANA are assessed on different medical datasets with varied feature sizes, including Pima, HeartEW, Lymphography, SPECT Heart, PenglungEW, Parkinson, Colon, SRBCT, Leukemia, and Prostate tumor. The results show that the BQANA developed by the second approach is superior to other binary versions of the QANA to find the optimal feature subset from the medical datasets. Then, the BQANA was compared with nine well-known binary metaheuristic algorithms, and the results were statistically assessed using the Friedman test. The experimental and statistical results demonstrate that the proposed BQANA has merit for feature selection from medical datasets.

1. Introduction

In recent years, artificial intelligence technologies have been used to solve various problems [1], which dictates the importance of storing data and information. With continued advances in science, a plethora of enormous datasets, including a large number of features, are being stored in different fields, such as business, text mining, biology, and medicine. Since medical datasets are often gathered for different purposes and from different sources, they may have challenges and complexities, such as structural and type heterogeneity, high dimensional, outliers, missing values, skewness, integration, and irrelevant and redundant features [2,3,4]. The existence of irrelevant and redundant features may degrade the accuracy of the classifier and bring additional computational costs [5]. To tackle this issue, many effective methods have been proposed to select effective features by reducing such disadvantageous features [6,7,8,9,10]. Feature selection (FS) is employed in a wide range of real-world applications, including disease diagnosis [11,12,13,14,15], text clustering [16,17], intrusion detection systems [18,19,20,21], e-mail spam detection [22,23,24,25], and genomic analysis [25,26,27,28,29].
The FS algorithms are broadly classified into filter-based, wrapper-based, and embedded-based methods [30,31,32]. The filter-based methods assess and rank features of datasets based on principle criteria such as distance, information, similarity, consistency, and statistical measures [33,34]. Although filter-based methods demand lower computational costs than other methods, they cannot provide satisfactory performance. The wrapper-based methods search for an optimal feature subset using a predetermined learning algorithm for evaluating the feature subsets. The advantages of both filter-based and wrapper-based methods are combined in embedded-based methods. These methods incorporate the search for an optimal feature subset as part of the classifier training process [32]. The wrapper-based methods can generally provide greater classification accuracy than other methods by using a machine-learning algorithm to assess possible solutions [6,35]. Since assessing 2N subsets of problem space with N features is an NP-hard issue, near-optimal subsets are discovered using approximate algorithms that heuristically search for an optimal subset [36,37,38].
Metaheuristic algorithms are a subset of approximate algorithms that have been used for solving many NP-hard problems in different fields of science, such as engineering design [39,40,41,42,43,44,45,46,47,48,49,50], task scheduling [51,52,53], engineering prediction [54,55,56,57,58], and optimal power flow [59,60,61,62,63,64] problems. When tackling the FS problem, metaheuristic algorithms have shown outstanding results in prior studies [65,66,67,68]. For instance, Emary et al. [69] introduced two versions of binary grey wolf optimizer (bGWO) to solve the FS problem as a wrapper-based method. The first approach was developed by performing stochastic crossover among the three best solutions, while in the second approach, the authors applied the S-shaped transfer function to convert continuous solutions of GWO to binary ones. Mafarja et al. [70] proposed a binary grasshopper optimization algorithm (BGOA) to tackle the feature selection problem within a wrapper-based framework by applying S-shaped and V-shaped transfer functions as the first mechanism. The second mechanism employs a new method that combines the finest solutions found so far. Furthermore, a mutation operator is used in the BGOA algorithm to improve the exploration phase.
Sindhu et al. [71] proposed an improved sine cosine algorithm (ISCA) that includes a feature selection elitism technique and a new best solution update method to select the best features and increase the classification accuracy. Dhiman et al. [72] developed eight binary versions of the emperor penguin optimizer to solve the FS problem by employing S-shaped and V-shaped transfer functions. In this study, 25 standard benchmark functions have been used to validate the results of the developed algorithms. The results revealed that the V4 transfer function provides better solutions than other transfer functions. A binary farmland fertility algorithm (BFFA) has been proposed by Naseri et al. [18] to tackle feature selection problems in intrusion detection systems using a V-shaped transfer function. Although many metaheuristic algorithms have been developed in the FS domain, most of them are not scalable enough to overcome small and large datasets.
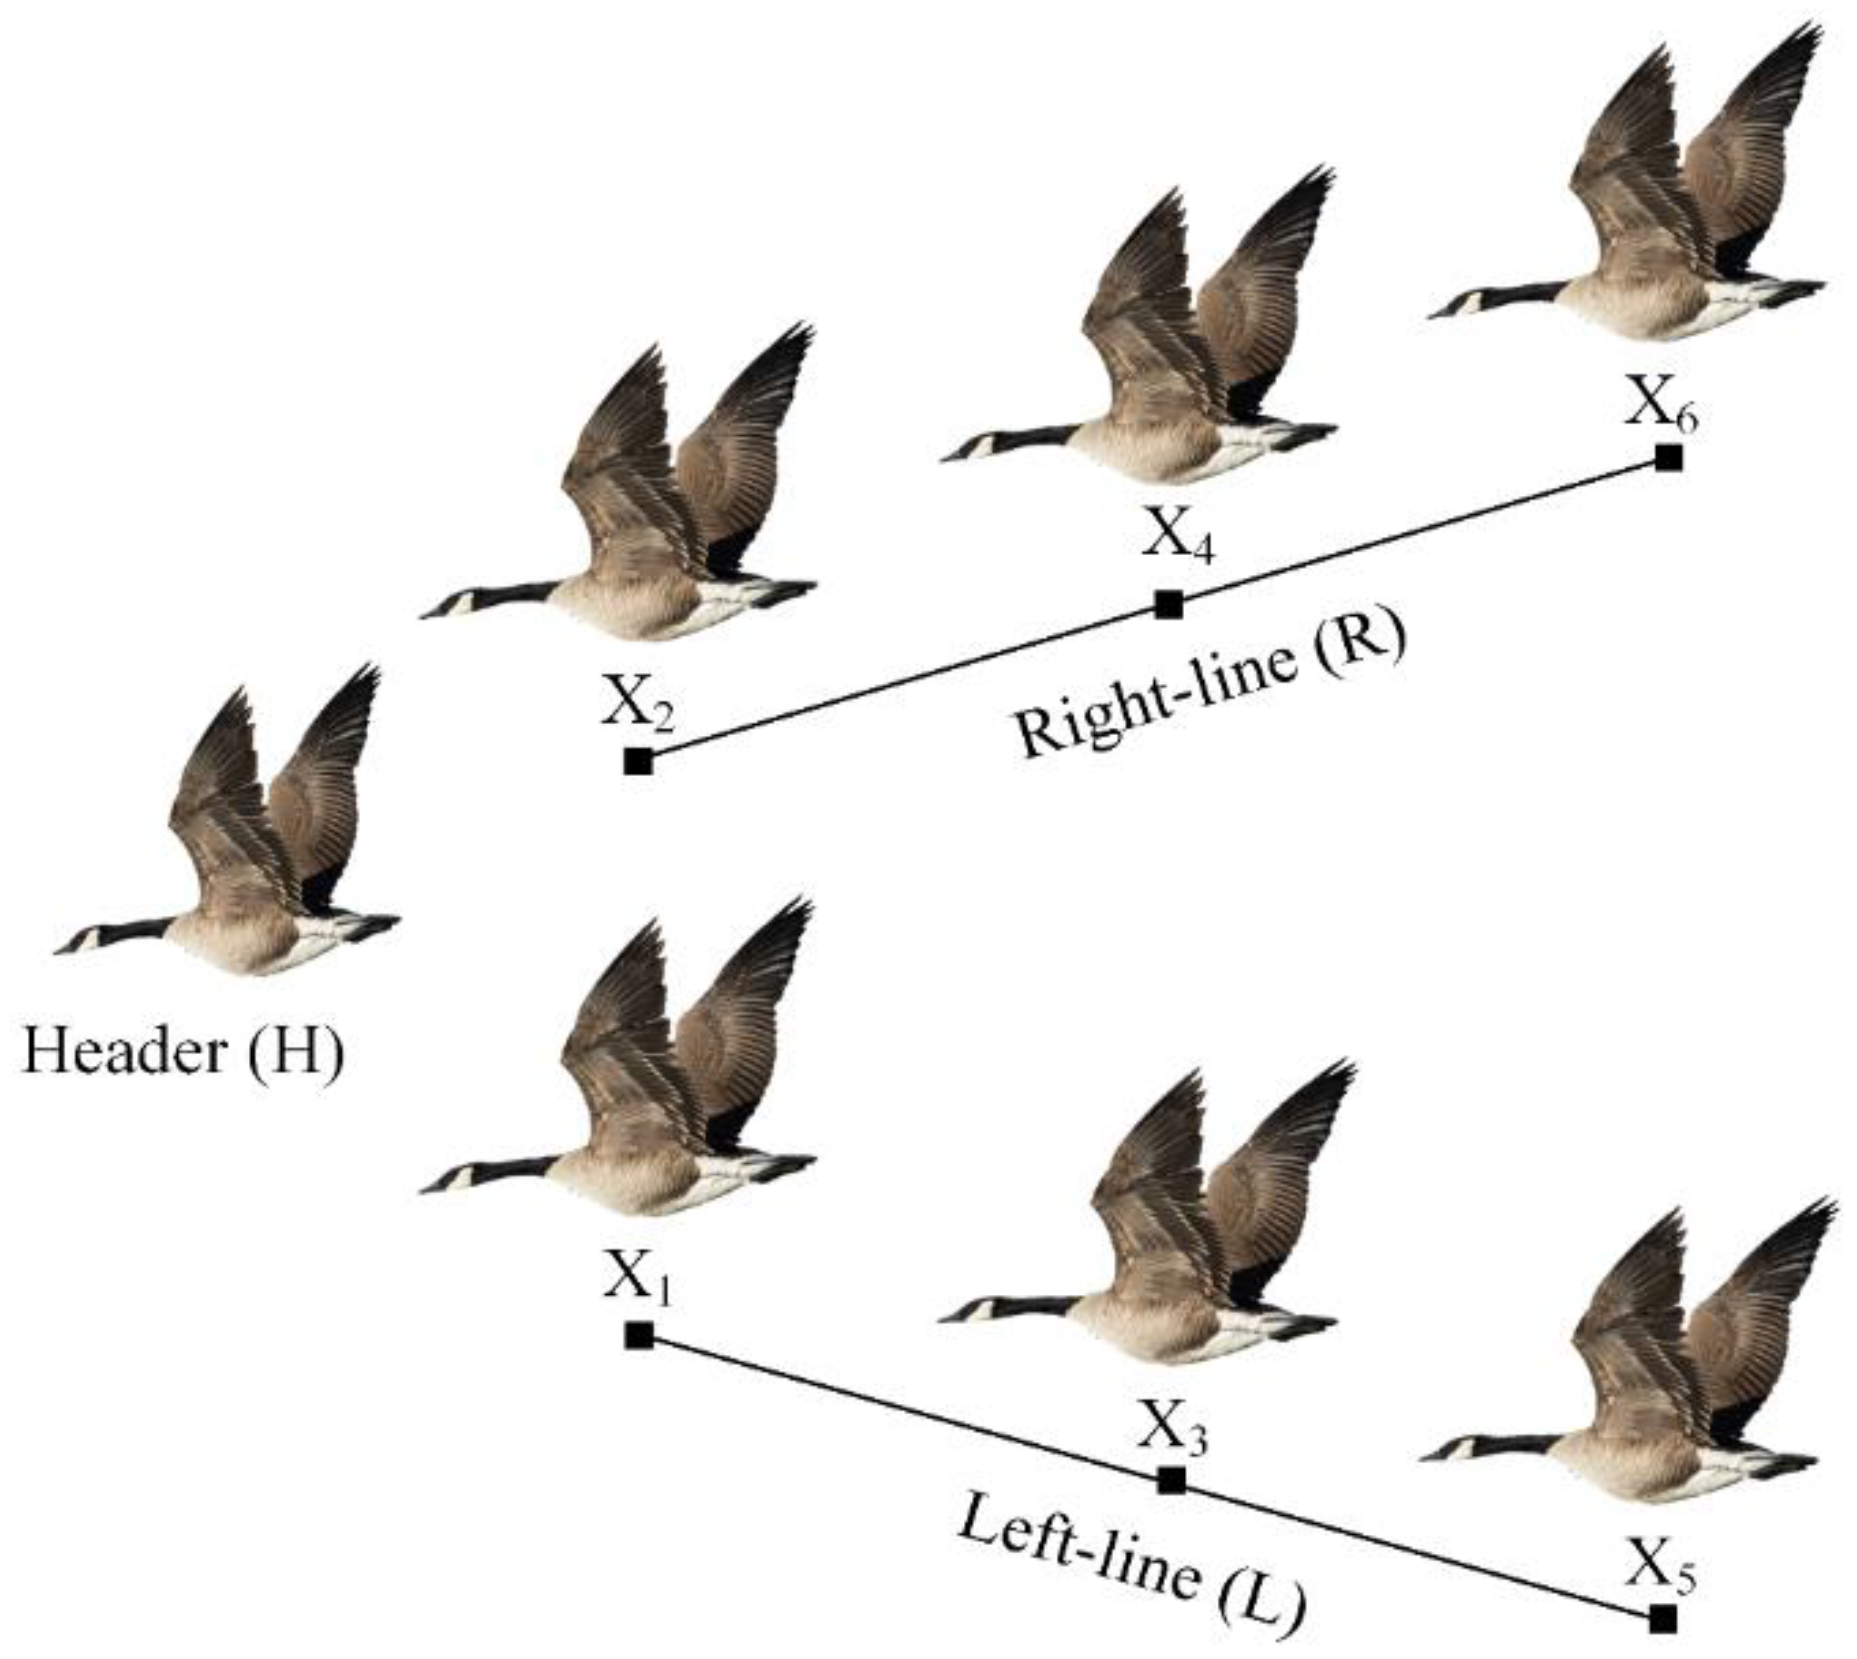
Quantum-based avian navigation optimizer algorithm (QANA) [73] is a recently introduced evolutionary algorithm inspired by the navigation mechanism of migratory birds during long-distance aerial paths for solving continuous optimization problems. The QANA provides competitive results by employing several operators, including population partitioning, self-adaptive quantum orientation, a qubit-crossover, and two mutation strategies. Moreover, the gained information is shared among search agents using a V-echelon communication topology. The experimental evaluations reveal that QANA is scalable for solving high-dimensional problems. It is worth mentioning that when working with high-dimensional datasets, tackling optimization problems becomes particularly difficult due to the curse of dimensionality problems [74,75].
This paper aims to extend our earlier study [73] by using our proposed binary QANA (BQANA) to overcome the curse of dimensionality difficulties in the FS domain and generate high-quality solutions using two approaches. In the first approach, the canonical QANA is converted to binary using 20 different transfer functions from five categories of S-shaped [76], V-shaped [77], U-shaped [78], Z-shaped [79], and quadratic [80,81] to solve FS problem in medical datasets. The transfer functions are discussed in this paper, and then they are paired with the QANA to develop several binary QANA models. In the second approach, a threshold is assigned for each dimension to map the continuous solutions of QANA to binary and develop BQANA without any further computational cost. The effectiveness of the proposed approaches is investigated on 10 medical datasets with various scales. To validate the proposed algorithms, the results of the winner version of binary QANA named BQANA were compared with the results of nine well-known metaheuristic algorithms, including binary particle swarm optimization (BPSO) [82], ant colony optimization (ACO) [83], binary differential evolution (BDE) [84], binary bat algorithm (BBA) [85], feature selection based on whale optimization algorithm (FSWOA) [11], binary ant lion optimizer (BALO) [86], binary dragonfly algorithm (BDA) [87], quadratic binary Harris hawk optimization (QBHHO) [80], and binary atom search optimization (BASO) [88]. The convergence behavior, the average number of selected features, and the accuracy of the proposed BQANA and comparative algorithms were visualized and investigated for all datasets. Moreover, the BQANA is statistically assessed by the Friedman test to demonstrate the algorithm’s superiority. The main contributions of this study are summarized as follows.
  • Introducing binary approaches of quantum-based avian navigation optimizer algorithm (QANA) to select effective features from high-dimensional medical datasets.
  • The binary QANA variants have been developed by adapting the main components of the standard QANA.
  • Comparing the behavior of QANA with different transfer functions from five different categories, S-shaped, V-shaped, U-shaped, Z-shaped, and quadratic, to develop 20 versions of binary QANA based on the first approach.
  • Applying the second approach as a low-cost and effective method to develop the superior version of binary QANA named BQANA by assigning a threshold for each variable.
  • Dimensionality reduction, generating solutions with high accuracy and a minimum number of features are obtained by the second approach.
  • The experiments prove that the BQANA developed by the second approach provides superior results compared to the first approach and nine other comparative algorithms in terms of increasing classification accuracy and minimizing the number of features for 10 medical datasets with various scales.

2. Related Works

The Fs is an NP-hard problem with discrete search space, in which the number of potential solutions grows exponentially as the number of features grows. Hence, metaheuristic algorithms are known as powerful optimizers in the literature. Ant colony optimization (ACO) [89] is a discrete metaheuristic algorithm inspired by the behavior of some ants in nature that has been applied for solving FS problems in different fields such as text categorization [90], image feature selection [91], intrusion detection system [92], and email spam classification [93]. As most of the metaheuristic algorithms are proposed for continuous search spaces, many researchers applied metaheuristic algorithms to discover an optimal feature subset by converting the continuous solutions into a binary form using logical operators or different transfer functions [94]. Logical operators have been applied for producing binary solutions due to their low computational costs [95]. Boolean particle swarm optimization was first proposed by Marandi et al. [96] to solve antenna design by converting continuous particle swarm optimization (PSO) into a binary form using three Boolean operators. In [97], the authors proposed a binary form of the Jaya algorithm named Jayax using the xor logical operator and incorporating a local search module to boost the algorithm’s performance.
Many researchers apply different transfer functions to convert continuous values of optimizer algorithms into binary ones. The most well-known transfer functions used in the literature are S-shaped [76], V-shaped [77,98], U-shaped [78], Z-shaped [78], and quadratic [81] transfer functions. In 1997, Kennedy and Eberhart [76] introduced a binary version of the particle swarm optimization (BPSO) algorithm by applying the sigmoid transfer function to solve discrete optimization problems [82,99]. The sigmoid function is known as the S-shaped transfer function and has been applied to many other metaheuristic algorithms. Gong et al. [84] proposed binary differential evolution (BDE) algorithm to apply the differential evolution algorithm in discrete search space. To construct binary-adapted DE operators, DE operator templates are explicitly specified through the forma analysis. In [85] authors proposed a binary bat algorithm (BBA) for solving FS by applying the S-shaped transfer function to restrict the new search agent’s position to only binary values. A new binary algorithm named feature selection based on whale optimization algorithm (FSWOA) was proposed by Zamani et al. [11] to handle the dimensionality of medical data using the whale optimization algorithm (WOA). To map continuous solutions of WOA to binary ones, the authors applied the S-shaped transfer function. The binary dragonfly algorithm (BDA) is the binary version of the dragonfly algorithm proposed by Mirjalili [87] which mimics the static and dynamic swarming behaviors of dragonflies in nature. The exploration and exploitation of the algorithm are modeled by the social interaction of dragonflies in searching for foods, avoiding enemies, and navigating when swarming dynamically or statistically.
The V-shaped transfer function introduced by Rashdi et al. [77] is a symmetric transfer function initially used in binary gravity search algorithm (BGSA) to map continuous values of GSA into binary ones. Emary et al. [86] proposed a binary antlion optimizer (BALO) for finding optimal feature subsets by applying S-shaped and V-shaped transfer functions. The findings indicate that the developed binary algorithm based on V-shaped transfer functions outperforms the S-shaped transfer functions. In a comparative study, Mirjalili et al. [98] evaluated six variants of S-shaped and V-shaped transfer functions on the traditional BPSO algorithm. The results indicate that the newly presented V-shaped family of transfer functions significantly outperforms the original BPSO. Too et al. [88] proposed eight versions of the binary atom search optimization (BASO) algorithm to effectively select an optimal feature subset by applying S-shaped and V-shaped transfer functions. In comparison to other BASO versions, the results showed that BASO with S-shaped transfer function (S1) is highly capable of finding effective features.
Mirjalili et al. [68] proposed a new U-shaped transfer function for the PSO algorithm to convert continuous values of velocity to binary solutions. The obtained results reveal that the U-shaped transfer functions greatly enhance the performance of BPSO. The DEOSA proposed by Guha et al. [100] is a discrete combination of equilibrium optimizer and simulated annealing for selecting optimal features. This algorithm uses a U-shaped transfer function to convert continuous values into binary. Nadimi-Shahraki et al. [101] proposed an enhanced version of the whale optimization algorithm named E-WOA to solve continuous optimization problems using a pooling mechanism and three robust search strategies. To address the FS problem, the solutions of E-WOA are converted to binary form using a U-shaped (U2) transfer function.
The Z-shaped [79] and quadratic [81] transfer functions are two recently proposed transfer functions for mapping continuous solutions to binary ones. The quadratic binary Harris hawk optimization (QBHHO) [80] algorithm is a binary version of the Harris hawk optimization algorithm developed by applying quadratic transfer functions for converting continuous solutions to binary. Considering a threshold for each variable is another efficient method to map continuous solutions to binary ones. Hafez et al. [102] utilized the sine cosine algorithm (SCA) to address the FS problem by assigning a variable threshold (0.5) to convert solutions to binary form. In [103], the authors proposed a PSO-based FS algorithm with a variable-length representation called VLPSO. The results showed that the variable-length representation enhances the scalability of PSO. The algorithm uses a predefined threshold (0.6) to map solutions into binary form.

3. Quantum-Based Avian Navigation Optimizer Algorithm (QANA)

QANA is a recent population-based metaheuristic algorithm inspired by the navigation behavior of migratory birds during long-distance aerial routes. The QANA is modeled using multi-flock construction and quantum-based navigation which consists of two mutation strategies and a qubit-crossover operator to explore the search space effectively.

3.1. Multi-Flock Construction

Initially, the population of migratory birds is randomly divided into multi-flocks. Next, the migratory birds’ flight formation is mimicked in this algorithm to distribute the gained information among the search agents by adopting a V-echelon communication topology. Suppose V indicates a set of n members of the flock fq, which includes a header (H) and two subsets called right-line (R) and left-line (L) considered in a V-shaped formation. The migratory birds’ aerial maneuver using the V-echelon topology is depicted in Figure 1.

3.2. Quantum-Based Navigation (Movement Strategy)

The flocks use quantum-based navigation to explore the search space, which includes a success-based population distribution (SPD) policy, two mutation strategies including “DE/quantum/I” and “DE/quantum/II,” and a qubit-crossover operator. Each flock is dynamically allocated to one of these mutation techniques throughout the optimization process, depending on the SPD policy presented in Equation (1),
S R m ( t ) = ( ( i f m j = 1 n τ i j n ) / | f m | ) × 100
where fm is the set of flocks that used Mm in iteration t, and 𝜏ij is equal to 1 if Mm improved aj of the i-th flock in the set fm; otherwise, 𝜏ij is equal to 0.
Quantum mutation strategies, including DE/quantum/I and DE/quantum/II, are described by Equations (2) and (3), where xi (t) denotes the position of search agent ai in the current iteration t, xV_echelon (t) is the position of the search agent followed by ai, and xbest (t) is the location of the best search agent. xjSTM (t) and xjLTM (t) are randomly picked from short-term memory (STM) and long-term memory (LTM), respectively. Equation (4) is used to calculate the trial vector vH (t + 1) as a leader in the V-echelon topology, where L and U are the lower and upper bounds of the search space and Si is the quantum orientation for avian ai, which is defined in [73], and it also uses parameter adaptation mechanism based on a historical record of successful parameter [104].
v i ( t + 1 ) = x b e s t ( t ) + S i ( t ) × ( x V e c h e l o n ( t ) x j L T M ( t ) ) + S i ( t ) × ( x V e c h e l o n ( t ) x b e s t ( t ) ) + S i ( t ) × ( x j L T M ( t ) x j S T M ( t ) )
v i ( t + 1 ) = S i ( t ) × ( x b e s t ( t ) x V e c h e l o n ( t ) ) + S i ( t ) × ( x i ( t ) x j L T M ( t ) x j S T M ( t ) )
v H ( t + 1 ) = S i ( t ) × x b e s t + ( L + ( U L ) × r a n d ( 0 , 1 ) )
To construct trial vector ui (t + 1), the mutant vector vi (t + 1) is crossed by its parent xi (t) using Equation (5), where |ψid is a qubit-crossover probability of the d-th dimension.
u i d ( t + 1 ) = { x i d ( t + 1 ) ,     | ψ i d < r a n d v i d ( t + 1 ) ,     | ψ i d r a n d
In each iteration, Equation (6) computes a qubit-crossover |ψid for each dimension of the trial vector ui (t + 1), where the parameter |ψRd is a random integer that serves as a coefficient for modifying the length of the vector |ψid in the Bloch sphere.
| ψ i d = | ψ R d × ( c o s ( θ 2 ) | 0 + e i φ s i n ( θ 2 ) | 1 )      θ , φ = r a n d × π 2
Based on the avian navigator modeling given in the previous sections, the flowchart of the quantum-based avian navigation optimizer algorithm (QANA) is presented in Figure 2.

4. The Proposed Binary QANA

According to the previous study [73], QANA outperforms other well-known optimizers in various continuous search space benchmark tests. In comparison to its competitors, QANA outperforms them in terms of exploration and exploitation abilities. Hence, the main components of the standard QANA are utilized to develop binary QANA for solving the FS problem. To develop binary QANA, initially, solutions are randomly generated in the range [0, 1]. The iterative procedure is continued after initialization until the stopping condition (maximum number of iterations) is met. In each iteration, the positions of search agents are mapped to binary using the transfer function (first approach) or by assigning a threshold for each variable (second approach). In the first approach, 20 different transfer functions from five categories, S-shaped, V-shaped, U-shaped, Z-shaped, and quadratic, are applied to map the continuous solutions of the canonical QANA to binary ones. While in the second approach, the QANA is converted to binary by simply assigning a threshold for each dimension. Both approaches are described and investigated in more detail in the following subsections.

4.1. Binary QANA Development Using Different Transfer Functions

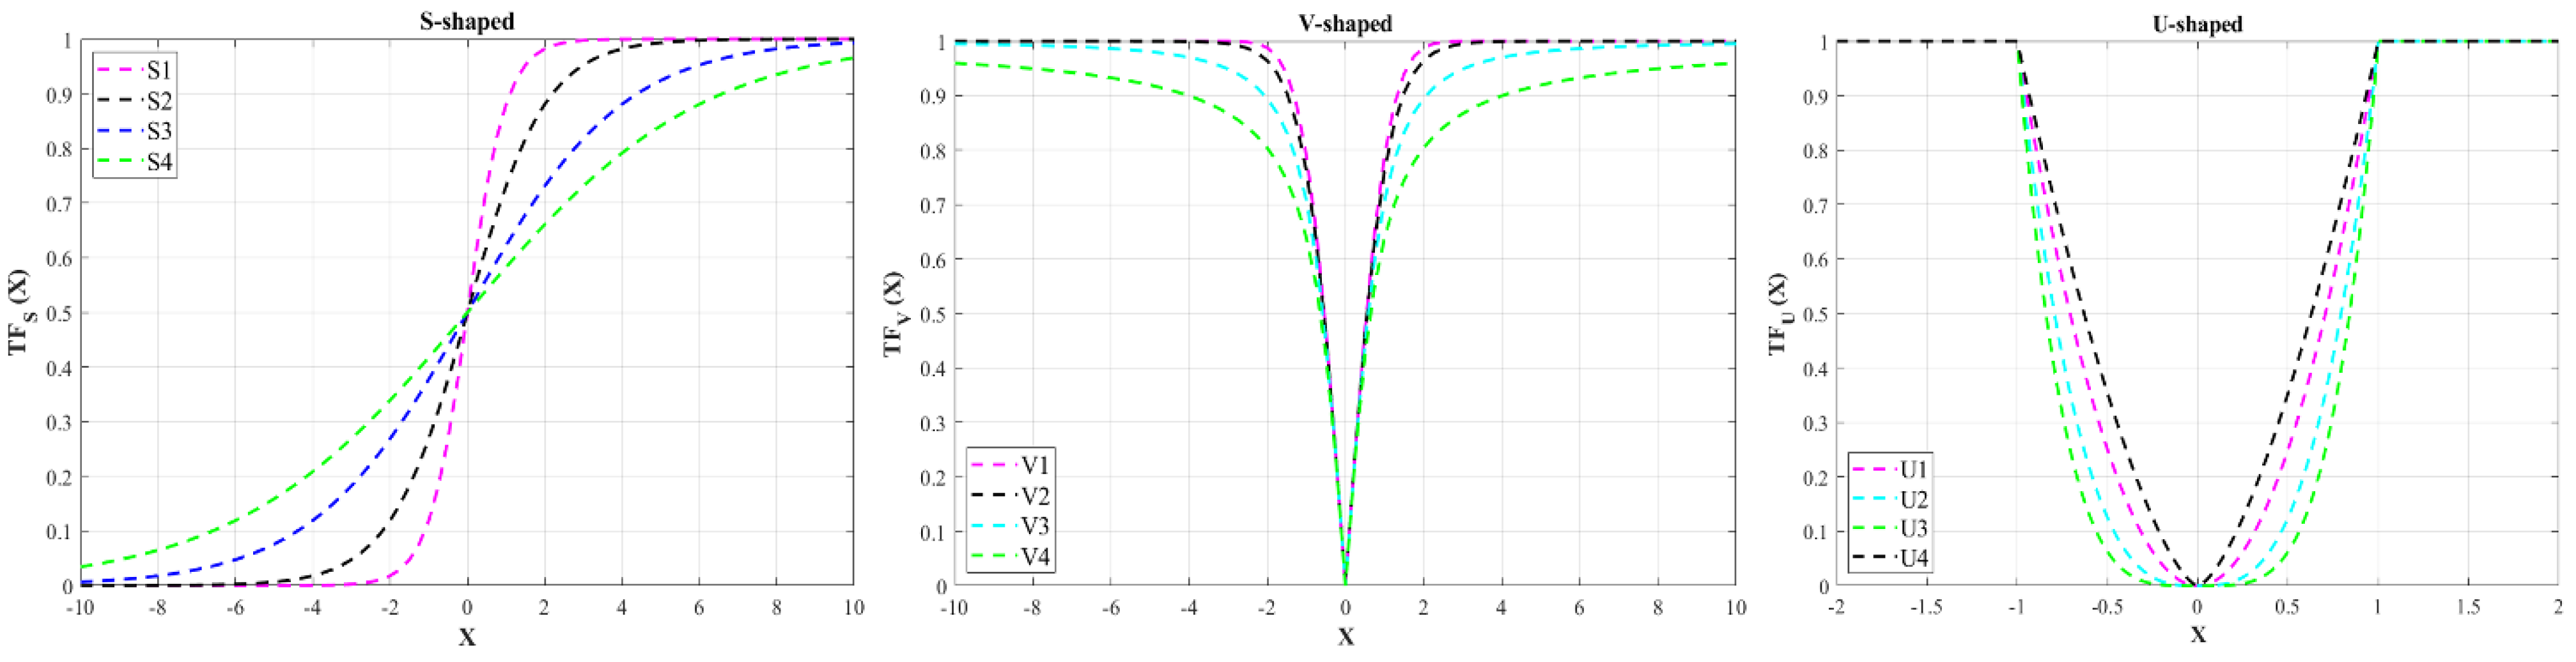
In accordance with the literature, the transfer function has a crucial role in mapping continuous solutions to discrete space. The output of a transfer function is in the range of [0, 1]. The value of the search agent’s position determines the probability of changing the solution of the previous iteration, where the transfer function has to provide a large enough probability of changing the previous solution for a higher value of the search agent’s position. On the other hand, the computed probability of changing the solution should also be low if the value is low. Based on the above discussion, choosing a suitable transfer function will enhance the algorithm’s performance in solving the FS problem. Hence, in this study, the four versions of each transfer function S-shaped, V-shaped, U-shaped, Z-shaped, and quadratic are discussed and applied to develop different variants of binary QANA.

4.1.1. Binary QANA Using S-Shaped Transfer Function (S-BQANA)

The S-shaped transfer function first used in BPSO [76] employs the sigmoid function (S2) to map continuous position into binary form based on Equation (7),
T F S ( x i d ( t + 1 ) ) = 1 / ( 1 + exp x i d ( t ) )
where x i d ( t ) is the position of the i-th search agent in the d-th dimension at the current iteration. The new position of the search agent is then updated using Equation (8), where r is a random number in [0, 1].
b i d ( t + 1 ) = { 1 , i f    r < T F s ( x i d ( t + 1 ) ) 0 ,      i f    r T F s ( x i d ( t + 1 ) )
S2 and three other variants of S-shaped transfer functions are presented visually in Figure 3 and mathematically in Table 1. As shown in Figure 3, S1 sharply grows and hits saturation as the value of the position increases substantially higher than S2, while S3 and S4 saturations begin later than S2. Hence, among these four versions of the S-shaped transfer function, S1 generates the highest probability for the same value, while S4 returns the lowest value.
The S-shaped transfer function has certain flaws. In SI algorithms, if the value is 0, the next solution remains the same as the present position. To put it another way, the 0 value indicates that the new location should not be modified. However, with a chance of 0.5, the new position in the S-shaped transfer function may be modified to 0 or 1. Also, in the SI algorithms, there is no difference between large positive or negative values, as a large absolute position value implies that the present search agent’s location is insufficient and that a significant movement is necessary to attain the ideal position. A tiny absolute value also indicates that the present search agent’s location is near the ideal solution and that only a small distance is required to reach it. However, in S-shaped transfer functions, a positive value results in a higher likelihood (probability of 1), whereas a negative value results in a probability of 0 for the following particles’ location, which is in contrast with the natural movements of SI algorithms.

4.1.2. Binary QANA Using V-Shaped Transfer Function (V-BQANA)

The V-shaped transfer function (hyperbolic) is a symmetric function introduced by Rashdi et al. [77] to develop a binary version of the gravity search algorithm named BGSA. According to Equation (9), this function calculates the probability of changing the value of each dimension based on the position of each search agent in continuous search space,
T F v ( x i d ( t + 1 ) ) = | t a n h ( x i d ( t ) ) |
where x i d ( t ) indicates the position value of the i-th search agent in the d-th dimension at the current iteration. As illustrated in Equation (10), the position updating rules of V-shaped transfer functions are quite different from S-shaped transfer functions,
b i d ( t + 1 ) = { ( b i d ( t ) ) 1 , i f    r < T F v ( x i d ( t + 1 ) ) b i d ( t ) , i f    r T F v ( x i d ( t + 1 ) )
where b i d ( t ) and x i d ( t ) represent the binary position and continuous position value of the i-th search agent in the d-th dimension at the current iteration, ( b i d ( t ) ) 1 is the complement of b i d ( t ) , and r denotes a random value in [0, 1]. Based on this rule, if the value obtained from the transfer function is equal to or greater than r, the value of the d-th dimension will change to the complement of the current binary position as the continuous value is high enough to change the current position. In contrast, the binary position of the d-th dimension remains constant if the value obtained from the transfer function is less than r. As can be seen in Table 1, three new transfer functions have been introduced by implementing different mathematical equations. According to Figure 3, transfer functions V1, V2, V3, and V4 provide the highest probability of switching search agents’ positions, respectively.
Unlike the S-shaped transfer functions, V-shaped transfer functions do not require search agents to take 0 or 1 values, as they let search agents with low values remain at their current positions or switch to their complements if their value is high enough. Also, the V-shaped transfer functions solve the shortcomings of the S-shaped transfer functions by assigning 0 probability of changing the position of a search agent with zero value and considering the absolute value of the continuous position in the equations to avoid assigning a probability of 0 for search agents with negative values. Moreover, in another study, Mirjalili et al. [98] evaluated and compared different versions of sigmoid and hyperbolic functions, which showed the relative superiority of hyperbolic family functions in solving the FS problem.

4.1.3. Binary QANA Using U-Shaped Transfer Function (U-BQANA)

In a recent study, Mirjalili et al. [78] proposed a new U-shaped transfer function for the PSO algorithm to map continuous solutions to binary ones. This transfer function comes with two control parameters to modify the range of exploration and exploitation. As can be seen in Figure 3, similar to the V-shaped transfer function, U-shaped is a symmetric function, which means that it assigns 0 probability of changing the position of a search agent with 0 value. Also, as the absolute value of continuous position is considered in this transfer function, there are no differences between the positive and negative values. The mathematical formulation of the U-shaped transfer function is presented in Equations (11) and (12),
T F u ( x i d ( t + 1 ) ) = α | ( x i d ( t ) ) β |
b i d ( t + 1 ) = { ( b i d ( t ) ) 1 , i f   r < T F u ( x i d ( t + 1 ) ) b i d ( t ) , i f    r T F u ( x i d ( t + 1 ) )
where α and β are two control parameters for determining the slope and saturation point of the U-shaped transfer function. b i d and x i d represent the binary and continuous positions of the i-th search agent in the d-th dimension, respectively. r is a uniform random value in [0, 1].
Table 1 and Figure 3 illustrate different versions of the U-shaped transfer function labeled U1, U2, U3, and U4 that were established using different values of control parameters. The α control parameter determines the U-shaped curve’s saturation point. In contrast, β modifies the exploration range of the transfer function by changing the width of the U-shaped transfer function’s basin. Hence, it is noticeable that U4 provides a higher exploration range than other variations. It is also noticeable that all U-shaped variants offer higher exploration than V-shaped ones.

4.1.4. Binary QANA Using Z-Shaped Transfer Function (Z-BQANA)

The Z-shaped transfer function proposed by Guo et al. [79] is a symmetric transfer function applied to denote the probability that an element of the position vector will change from 0 to 1 in the BPSO algorithm. Based on this transfer function, when the continuous position value is 0, the probability of change should be low because when the particle reaches the best value, the continuous position value should be lowered to 0, and the probability of the particle’s position change should be 0. The Z-shaped transfer function is defined mathematically based on Equations (13) and (14),
T F z ( x i d ( t + 1 ) ) = 1 a x i d ( t + 1 )
b i d ( t + 1 ) = { ( b i d ( t ) ) 1 , i f   r < T F z ( x i d ( t + 1 ) ) b i d ( t ) , i f   r T F z ( x i d ( t + 1 ) )
where b i d and x i d represent the binary and continuous positions of the i-th search agent in the d-th dimension, respectively, and 
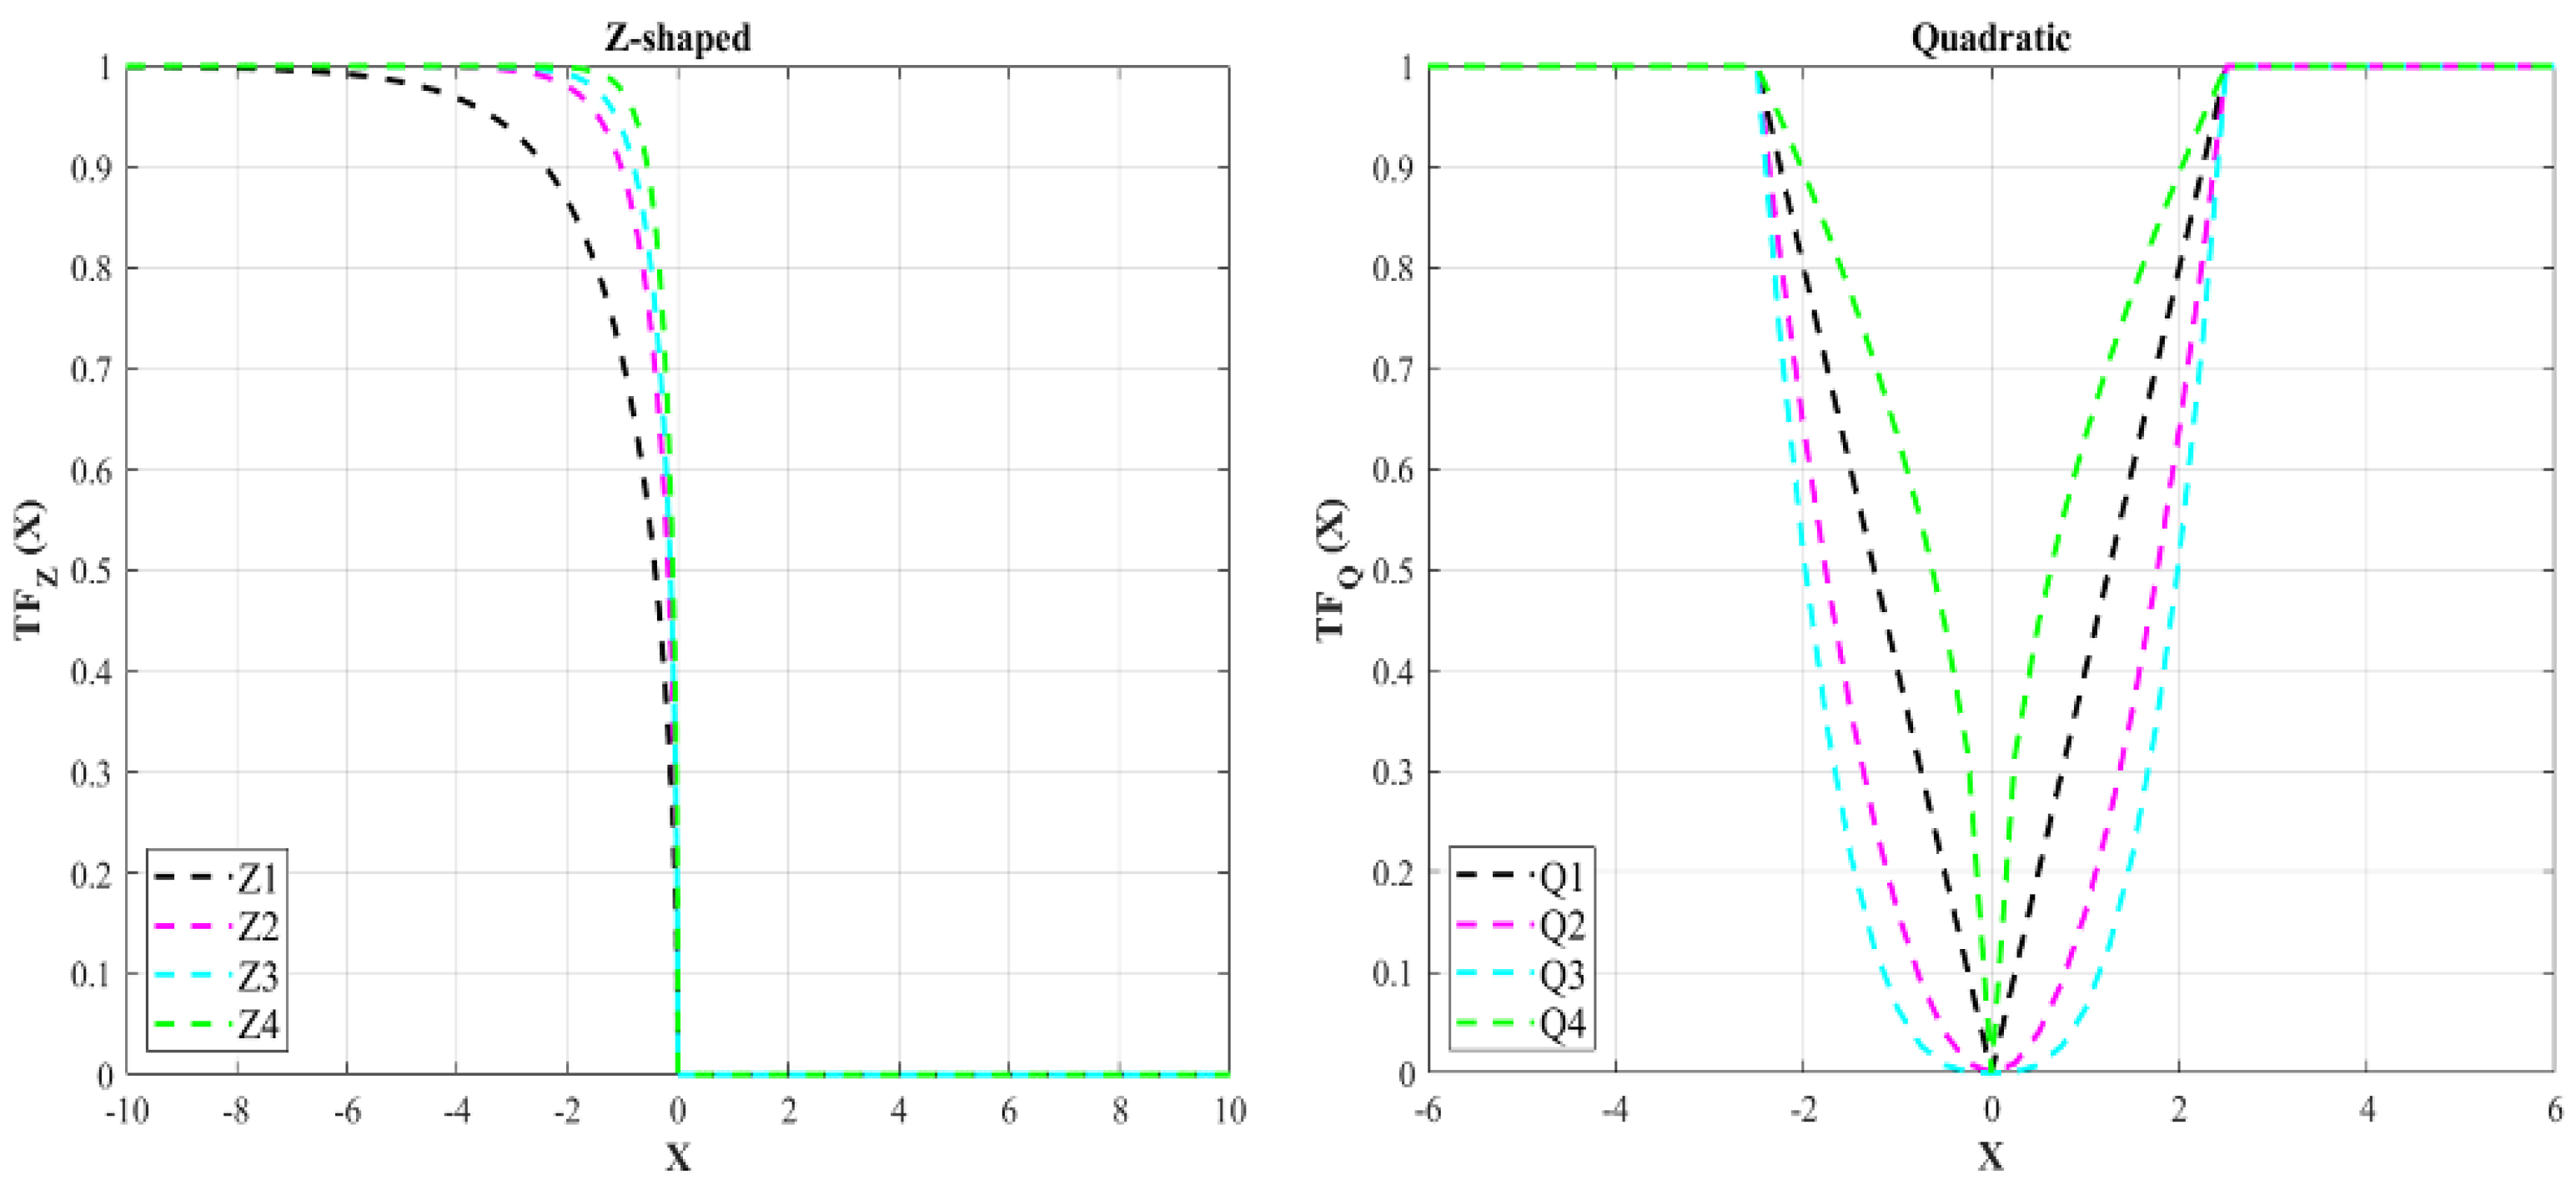
a denotes a positive integer. A collection of Z-shaped function families is generated by modifying the value of a, the formulas and figures of which are presented in Table 2 and Figure 4, respectively. The Z-shaped transfer function is an asymmetric mapping function, as seen in Figure 4. The asymmetric mapping function essentially fulfills the absolute value to calculate the mapping probability of the particle position vector variation, resulting in a quick convergence. The function’s slope varies when the parameter Dparticle = DFunction × 15 is changed. The lesser the slope of the function, the greater Dparticle = DFunction × 15. Hence, when the value remains constant, the probability of obtaining small changes in the location of the i-th particles is greater.

4.1.5. Binary QANA Using Quadratic Transfer Function (Q-BQANA)

The quadratic transfer function proposed by Rezaee Jordehi [81] is a recent transfer function used for converting continuous solutions of the PSO to binary ones based on Equations (15) and (16),
T F Q ( x i d ( t + 1 ) ) = { ( x i d ( t ) 0.5   x m a x ) 2 , i f   x i d ( t ) < 0.5   x m a x   1 , i f   x i d ( t ) 0.5   x m a x  
b i d ( t + 1 ) = { ( b i d ( t ) ) 1 , i f   r < T F Q ( x i d ( t + 1 ) ) b i d ( t ) , i f   r T F Q ( x i d ( t + 1 ) )
where TFQ denotes the quadratic transfer function and b i d and x i d represent the binary and continuous positions of the i-th search agent in the d-th dimension, respectively. The variable r is a random number in [0, 1]. The three other variants of the quadratic transfer function [80] are presented mathematically in Table 2 and visualized in Figure 4.

4.2. Binary QANA Development Using Variable Threshold (BQANA)

The previous subsections introduced different variants of binary QANA based on five different categories of transfer functions. Although transfer functions are widely used in the literature of FS, they impose an additional computational cost. Furthermore, transfer functions cannot provide superior results for every metaheuristic algorithm, especially for high-dimensional datasets. On the other hand, the QANA proved to be an effective problem solver in solving high-dimensional problems as it provides adequate search space coverage [73]. It is expected that the BQANA developed based on the second approach can generate suitable candidates for solving the FS problem. Hence, this section proposes the superior version of binary QANA, named BQANA, by simply using a threshold for assigning continuous solutions of the QANA into binary. In this approach, the generated continuous solutions are converted to binary form based on Equation (17),
b i d ( t + 1 ) = { 1 ,     i f     x i d ( t ) > 0.5 0 ,     i f     x i d ( t ) 0.5
where b i d is the binary solution of the i-th search agent in the d-th dimension, x i d ( t ) denotes the continuous position of the i-th search agent in the d-th dimension at iteration 
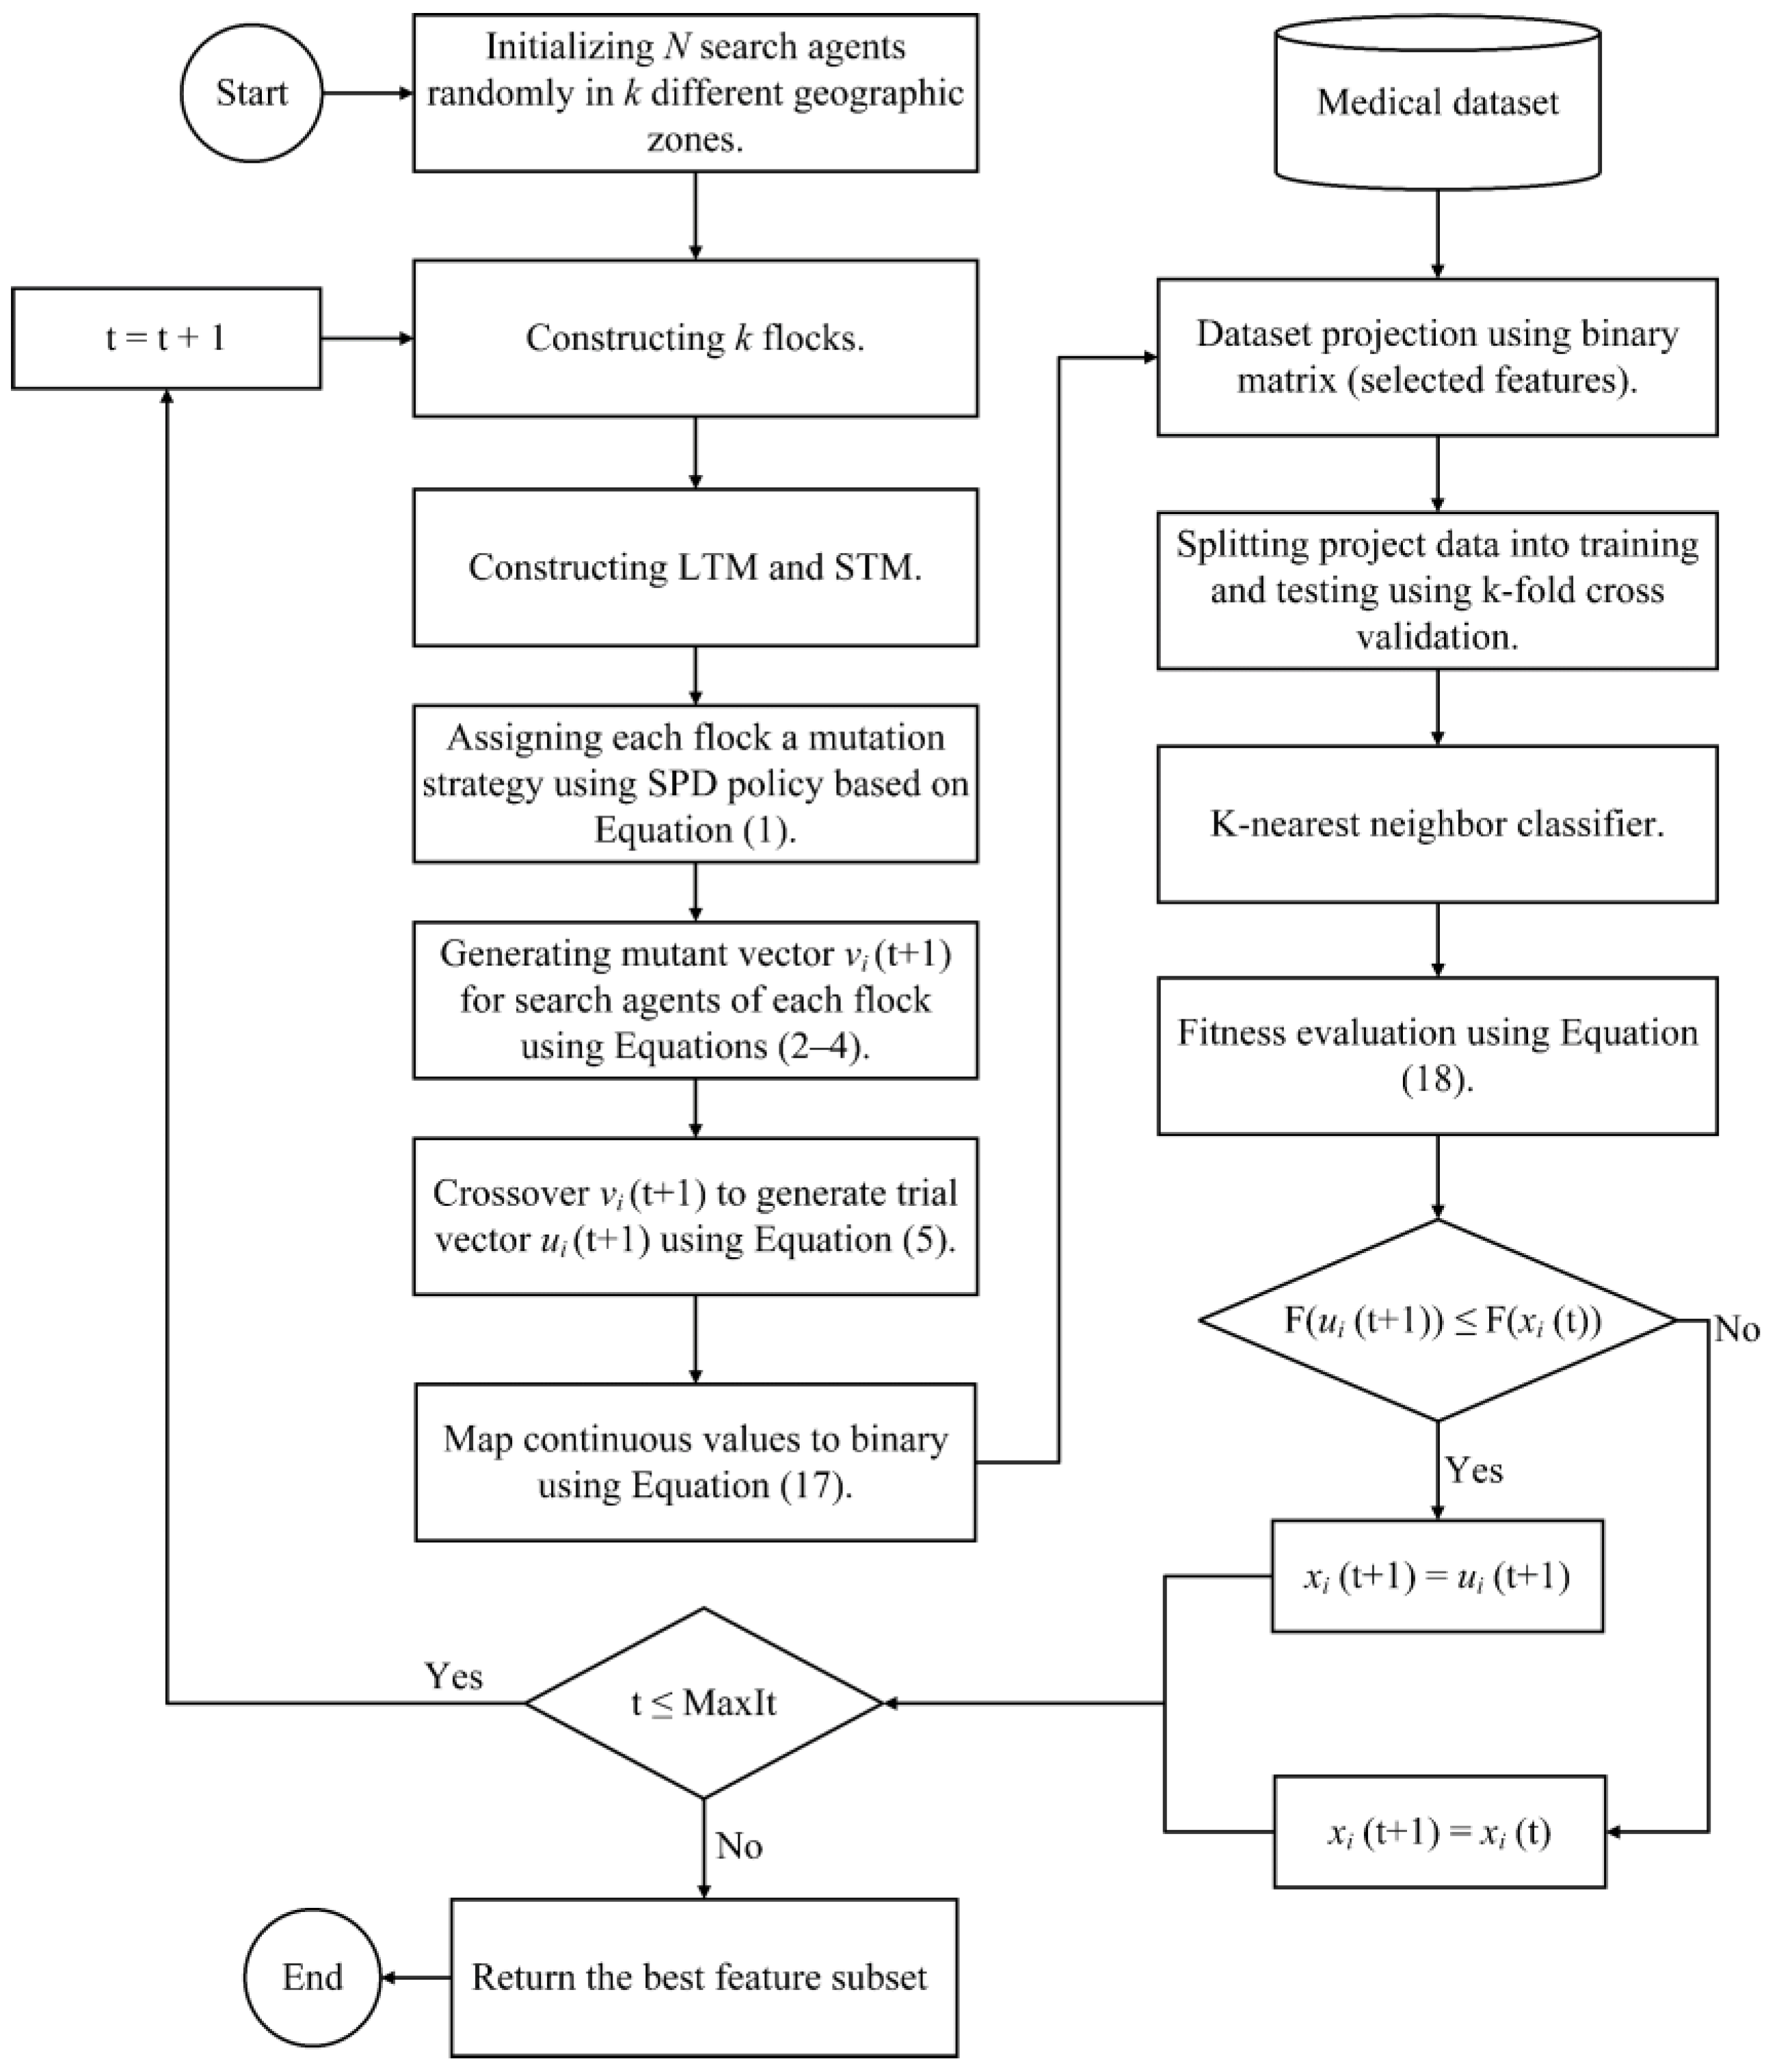
t. The general procedure of selecting effective features with BQANA is illustrated in Figure 5, where the algorithm receives the dataset with all features as input and returns an optimal feature subset as output.

5. Experimental Assessment

In this section, the performance of the proposed binary QANA approaches for solving the FS problem is experimentally assessed on 10 medical datasets of various sizes, which are described in Table 3. Also, the parameters of the algorithms used in this experiment are shown in Table 4. In the first approach, the canonical QANA is converted to binary using 20 different transfer functions from five categories of S-shaped [76], V-shaped [77], U-shaped [78], Z-shaped [79], and quadratic [80,81] to solve FS problem. The comparison results related to different variants of the first approach are tabulated in Table A1, Table A2, Table A3, Table A4 and Table A5. In the second approach, the QANA is converted to binary by assigning a threshold for each dimension to map the continuous solutions into binary without further computational cost. To select the best algorithms from the first approach, one algorithm is considered representative of each transfer function category. Then, the five selected algorithms are compared against the BQANA developed based on the second approach in Table 5. Ultimately, Table 6 presents a comparison between the proposed BQANA and nine well-known metaheuristic algorithms introduced in the literature, including binary particle swarm optimization (BPSO) [82], ant colony optimization (ACO) [83], binary deferential evolution (BDE) [84], binary bat algorithm (BBA) [85], feature selection based on whale optimization algorithm (FSWOA) [11], binary ant lion optimizer (BALO) [86], binary dragonfly algorithm (BDA) [87], quadratic binary Harris hawk optimization (QBHHO) [80], and binary atom search optimization (BASO) [88]. In Table 5, Table 6, Table A1, Table A2, Table A3, Table A4 and Table A5, the bold values indicate the winning algorithms, and at the end of each table, the overall comparisons are shown based on the numbers of the wins (W), ties (T), and losses (L).
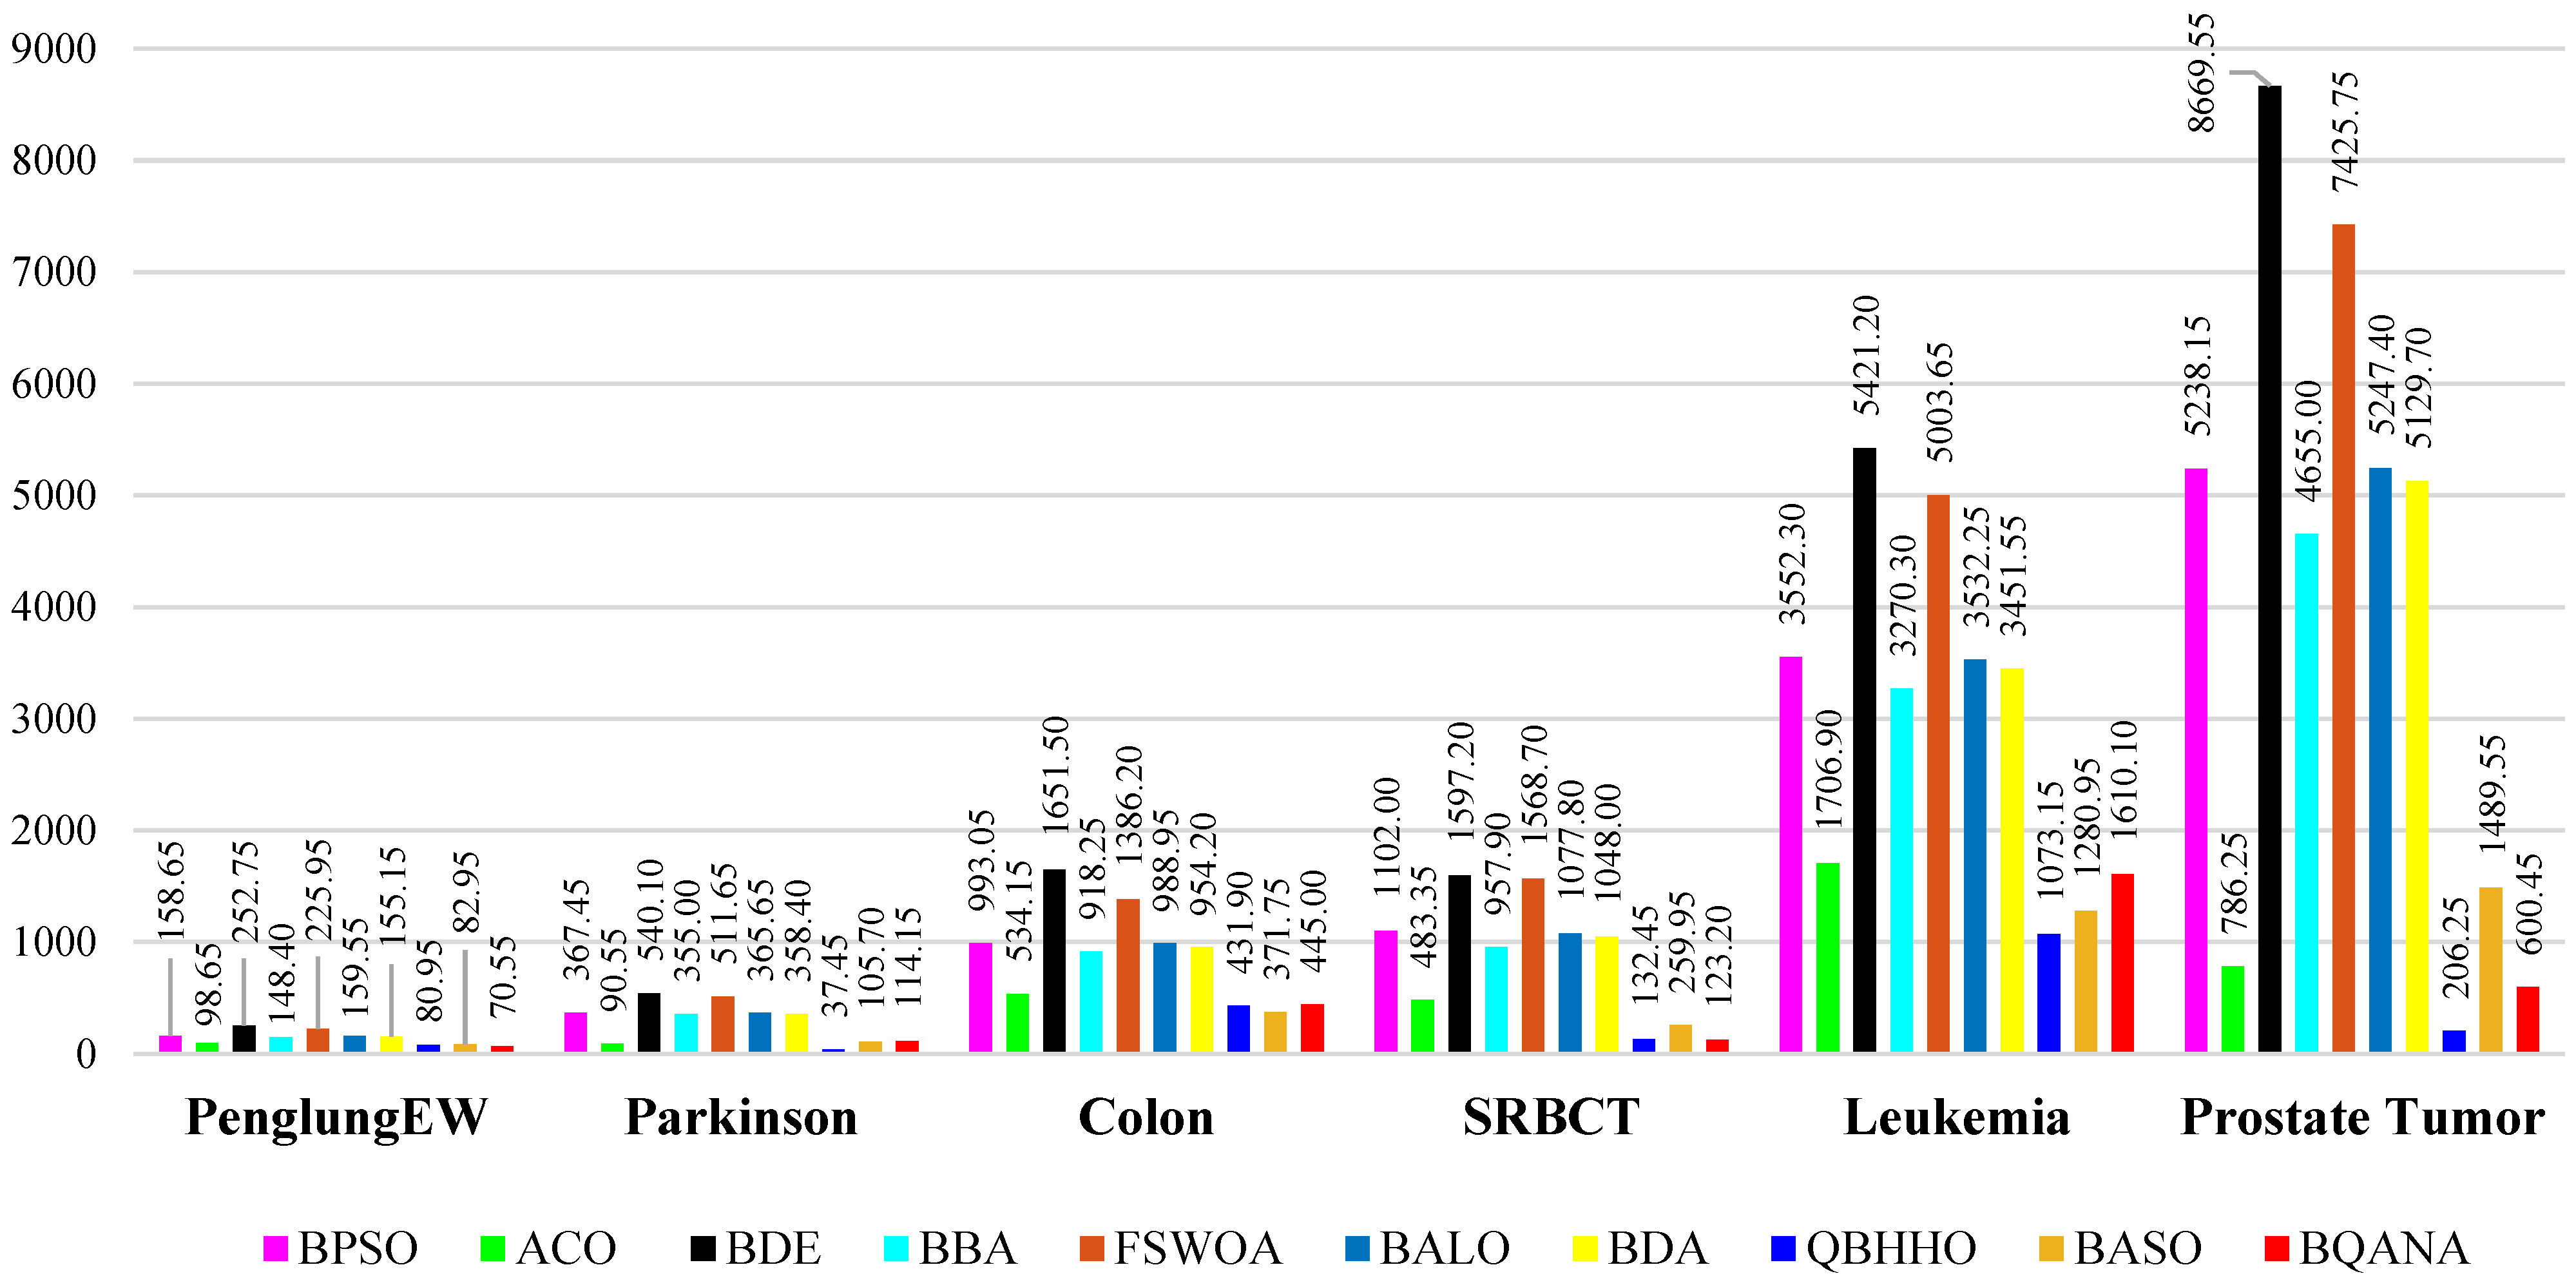
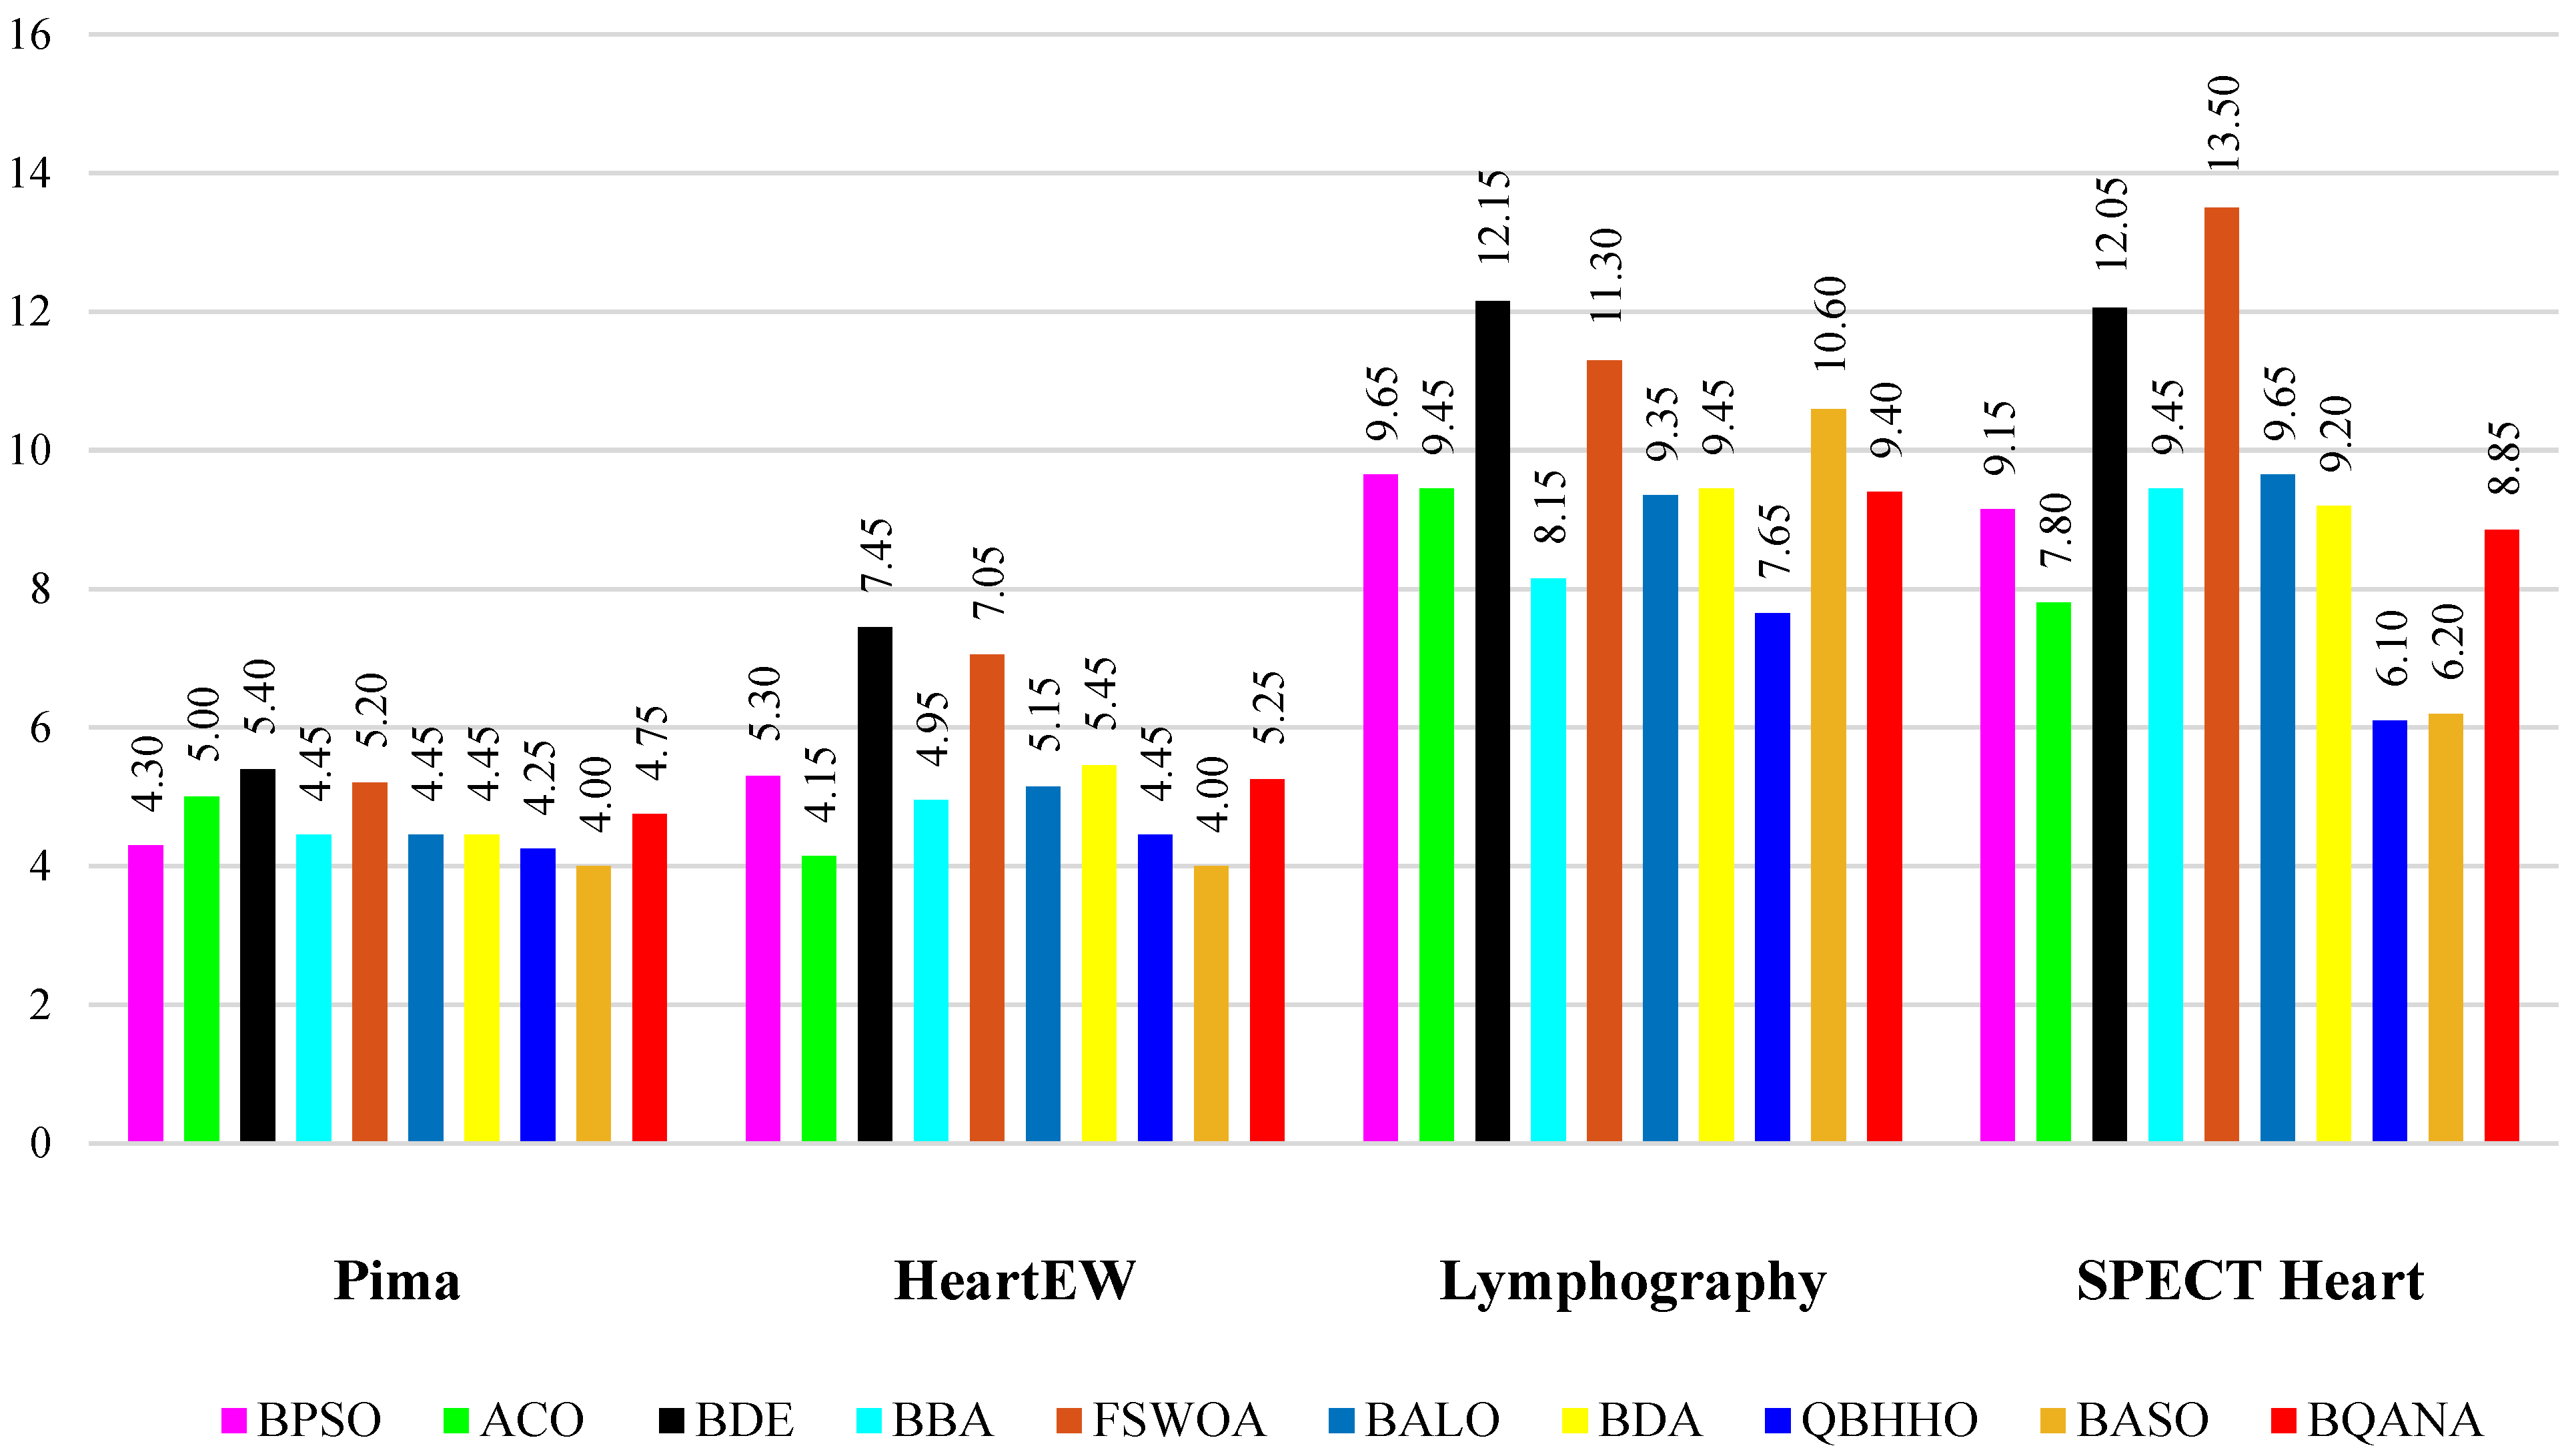
The comparison tables show the average fitness, minimum fitness, average classification accuracy, maximum classification accuracy, average number of selected features, and minimum number of selected features obtained by each algorithm. The average number of selected features by each algorithm from different datasets with various sizes is visualized in Figure 6 and 
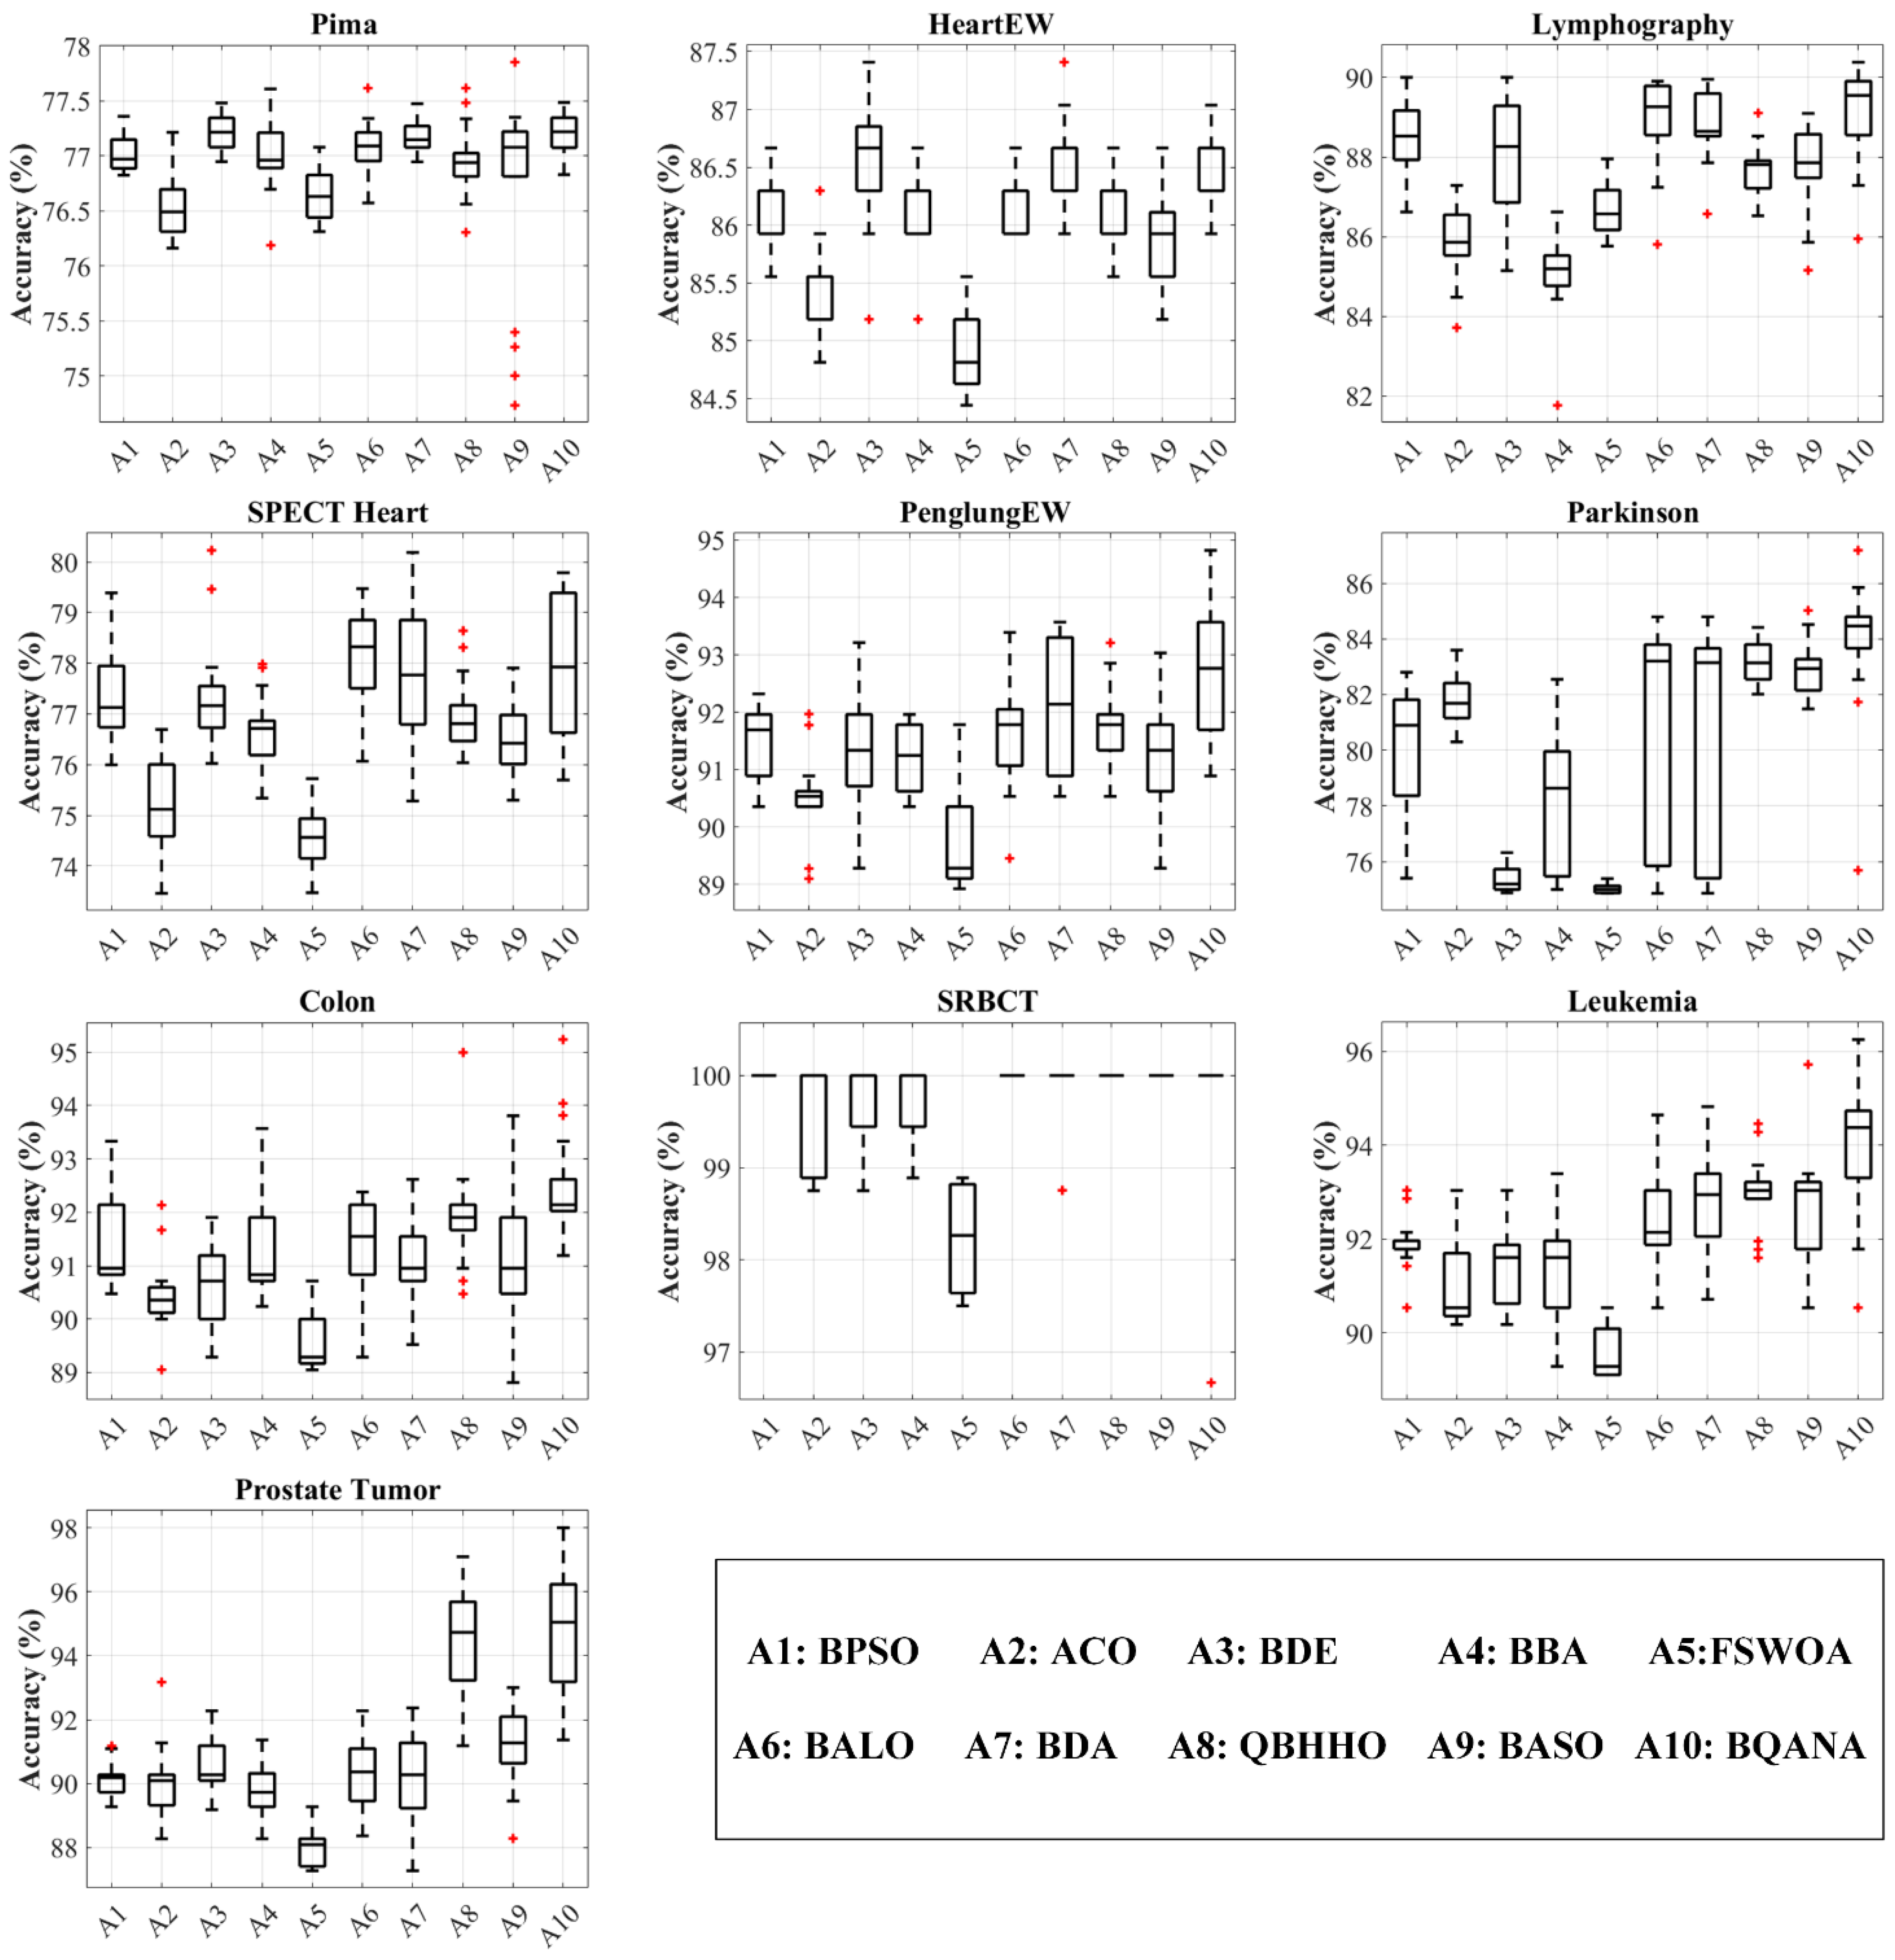
Figure 7. Also, as classification accuracy is the most important criterion in medical datasets, the boxplot results of 10 different algorithms are exhibited in 
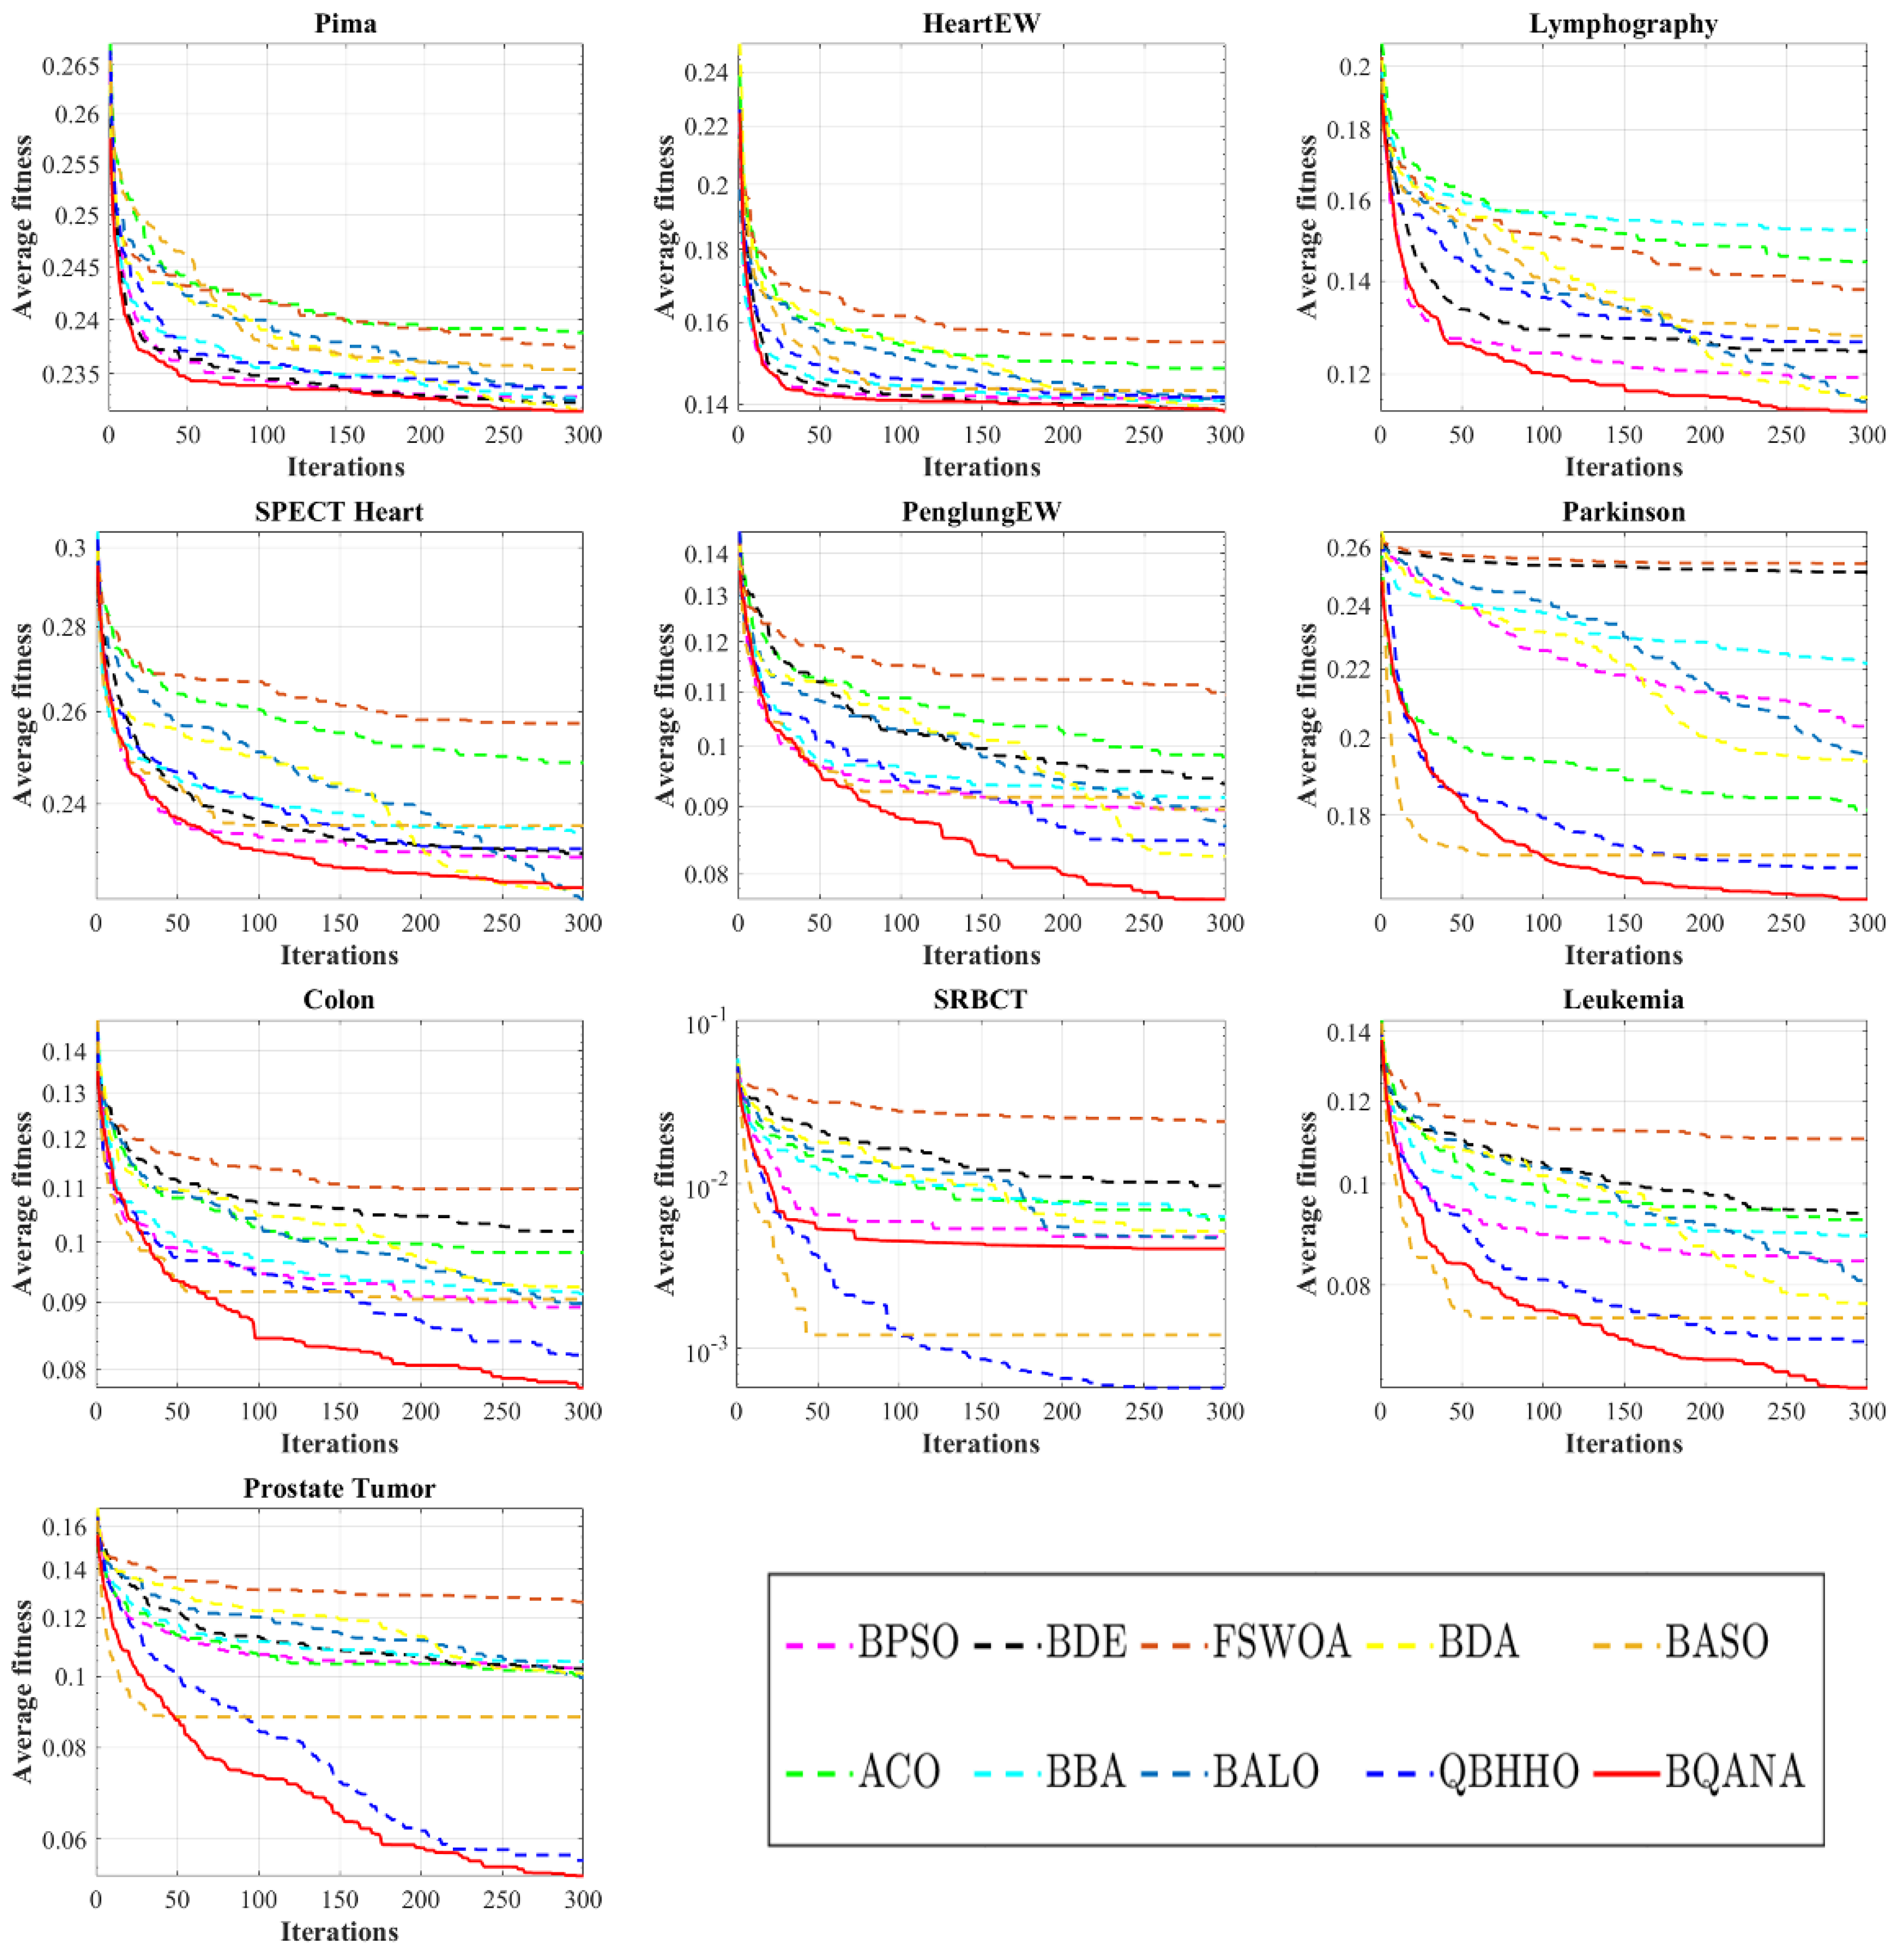
Figure 8. Furthermore, the convergence curves of fitness values obtained during the optimization process are visualized in Figure 9. Ultimately, the nonparametric Friedman test [105] was used to rank the significance of the algorithms based on their performance in minimizing the fitness, as is shown in Table 7 and Figure 10.

5.1. Medical Datasets Description

In this study, 10 medical benchmark datasets, mostly from the UCI machine learning repository, are utilized to evaluate the performance of the proposed BQANA and comparative algorithms in solving the FS problem. The benchmark datasets utilized in the experimental evaluation of this study are on an ordinal scale, as common in the literature. Datasets with non-ordinal features can be encoded in the pre-processing stage [106]. Table 3 provides the specifics of the utilized datasets in terms of the number of samples, total number of features, number of classes, and size that is considered small if Nf < 300, medium if 300 ≤ Nf < 1000, and considered large if Nf ≥ 1000, where Nf is the number of features. To avoid overfitting problems, the K-fold cross-validation method divides datasets into k folds where kfold = 10. In this method, the classifier uses one fold as the testing set and k − 1 folds as the training sets.
The Pima Indian Diabetes dataset aims to diagnose diabetes based on medical examination of females at least 21 years old and being tested for diabetes [107]. The HeartEW dataset [108] predicts the absence or presence of heart disease based on data gathered from 270 samples, 120 samples with a heart problem, and the remaining are healthy. The Lymphography dataset [108] has 18 predictor features and 148 cases, with four distinct values for the class label. The aim of diagnosing cardiac single proton emission computed tomography (SPECT) heart dataset is to discriminate between the normal and abnormal function of patients’ hearts using 267 image sets. The PenglungEW is a medium dataset consisting of 73 samples and 325 features with seven different classes. The Parkinson’s dataset describes diagnosing healthy persons from those with Parkinson’s disease. This dataset is built up of various biological voice measurements with 22 features. The Colon dataset aims to classify tissues as cancerous or normal based on data gathered from 62 colon tissue samples with 2000 genes [109]. There are 83 samples in the small round blue-cell tumor (SRBCT) dataset, each containing 2308 genes. The four classes of this dataset are the Ewing family of tumors (EWS), Burkitt lymphoma (BL) tumors, rhabdomyosarcoma (RMS) tumors, and neuroblastoma (NB) tumors [110]. The data for the Leukemia dataset came from publicly accessible microarray gene data [111]. The bone marrow expressions of 72 samples with 7128 genes are included. The dataset contains two different kinds of Leukemia classifications. The prostate tumor [112] is the largest dataset used in our experiments that contains 10,509 genes from 52 prostate cancers and 50 non-tumor prostate tissues.

5.2. Parameter Settings

In this study, the error rate is calculated using the k-nearest neighbor (KNN) algorithm with Euclidean distance and k = 5 to evaluate the effectiveness of selected feature subsets. The objectives of this study are evaluated by a fitness function presented in Equation (18), where CE denotes the classification error, α is the significance of classification quality, Nsf and Ntf are the numbers of selected features, and the total features of the dataset, respectively. As classification accuracy is the most important factor for medical datasets, we considered α = 0.99 for this study.
F i t n e s s = α × C E + ( 1 α ) N s f N t f
To verify that the comparisons are accurate and fair, all experiments are conducted 20 times independently on a laptop with an Intel Core i7-10750H CPU and 24.0 GB of RAM using MATLAB R2022a. The maximum number of iterations (MaxIt) and the population size (N) were set to 300 and 20, respectively. Furthermore, the competing algorithms’ parameters were adjusted to the same values as the stated settings in their works, shown in Table 4.

6. Discussion

Table A1, Table A2, Table A3, Table A4 and Table A5 show the comparison results of applying different transfer functions to develop different binary versions of the QANA based on the first approach. The results indicate that S4, V2, U4, Z1, and Q3 transfer functions provide superior results compared to other family members. Table 5 compares the results of five selected algorithms developed by the first approach with the BQANA developed based on the second approach. Clearly, the BQANA developed using the second approach overcomes the binary algorithms belonging to the first approach. Table 6 further investigates the proposed BQANA’s effectiveness by comparing it with nine well-known optimization algorithms of the feature selection domain. The results show that the BQANA achieves superior results in terms of average fitness for most of the datasets. Regarding the BQANA’s results shown in Figure 6, it has an average performance in minimizing the number of features, while turning to Figure 7, it is clear that the BQANA and the QBHHO provide the minimum number of features for most of the datasets among the competitors. The boxplots in Figure 8 illustrate the spread of the classification accuracy distribution obtained by each algorithm, in which the BQANA is predominantly the superior algorithm in terms of obtaining the highest accuracy and normal distribution.
Convergence curves plotted in Figure 9 generally suggest that the BQANA has the fastest convergence toward optimum solutions compared to comparative algorithms for most cases. Furthermore, it is noticeable that the BQANA consistently improves the solutions until the final iterations. Overall, the BQANA is fairly scalable as it can find better feature subsets for different scales of medical datasets by maintaining a balance between exploration and exploitation. Based on the results of the Friedman test reported in 
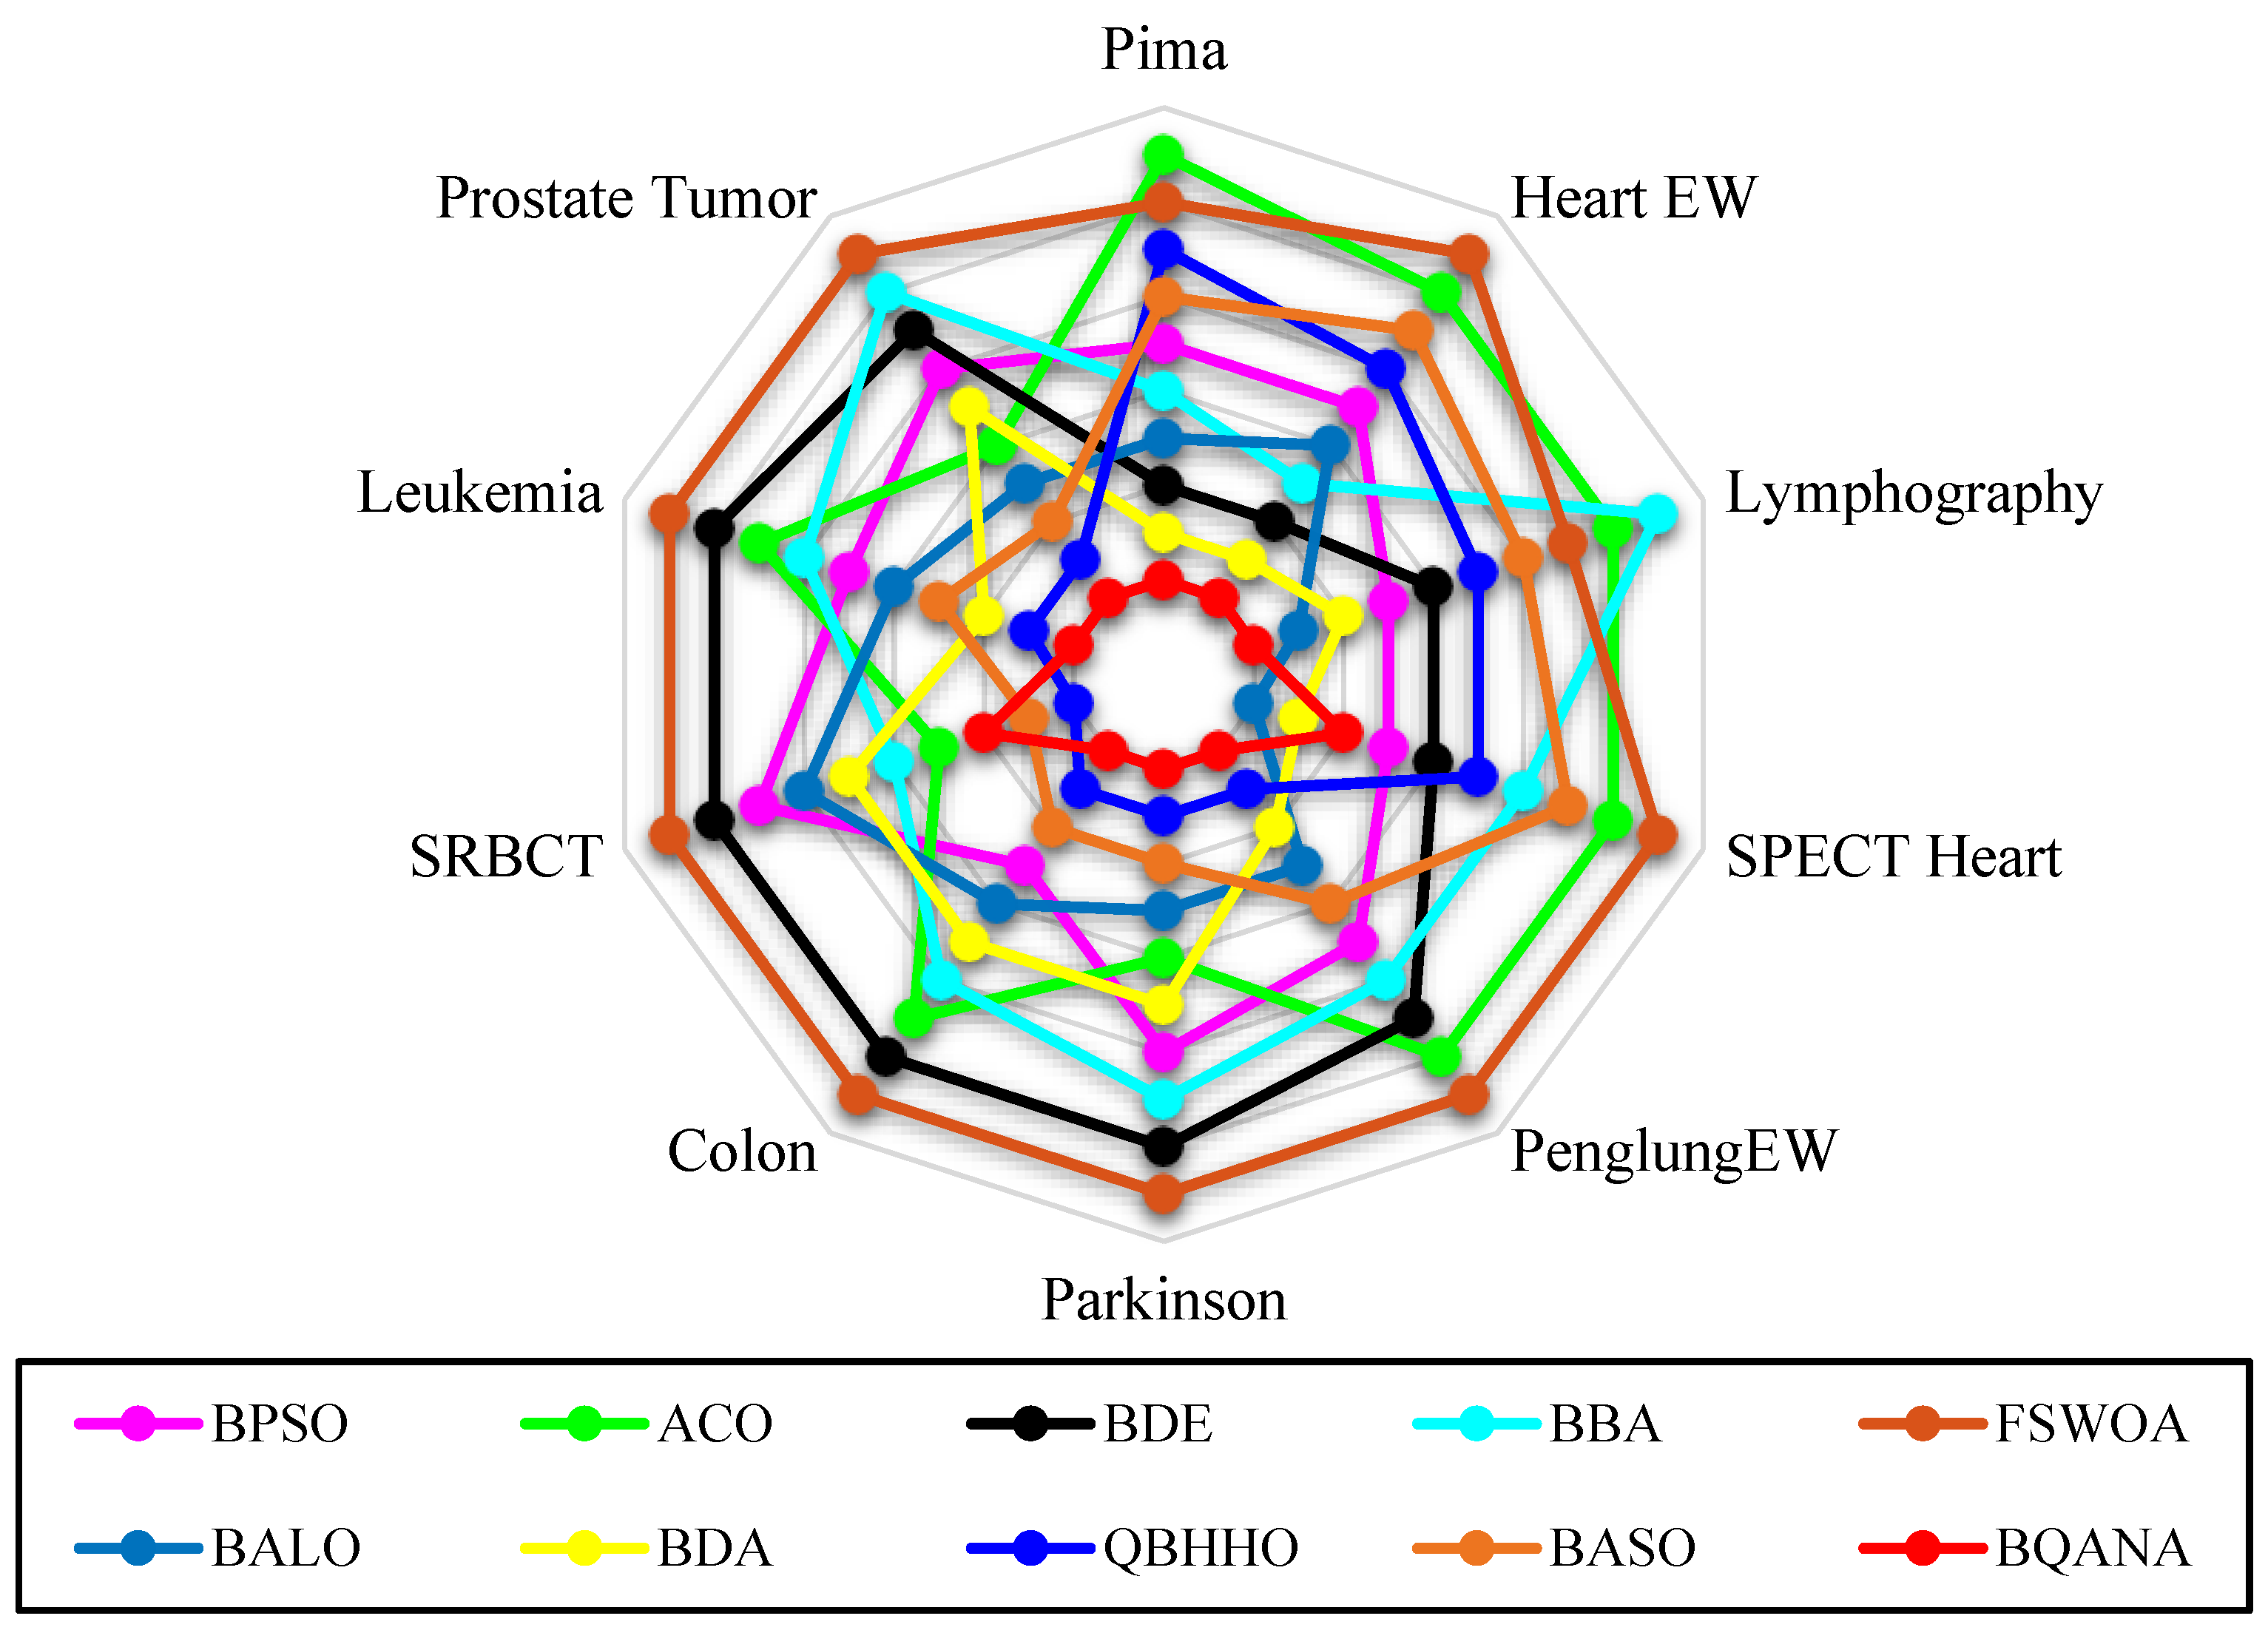
Table 7, the BQANA is superior to comparative algorithms in feature selection from different scales of medical data. For further statistical evaluation, Figure 10 provides the exploratory data analysis in a radar chart format. It is noticeable in the radar chart that the BQANA surrounds the center of the radar chart for most of the datasets, which shows the superiority of the BQANA over the comparative algorithms.

7. Conclusions

The advancement of information storage technologies in medical science has resulted in the generation of massive amounts of raw datasets with many irrelevant or redundant features. Selecting desirable features will reduce the computational costs and improve the algorithms’ accuracy in the data-driven decision-maker software. Although many metaheuristic algorithms have been developed to select effective features, a few can maintain their performance when the number of features increases. This paper introduces an efficient binary version of the quantum-based avian navigation optimizer algorithm (QANA), called BQANA, to select effective features from various scales of medical datasets. The study consists of two approaches for mapping continuous solutions of QANA into binary. In the first approach, 20 different transfer functions from five distinct categories, S-shaped, V-shaped, U-shaped, Z-shaped, and quadratic, were applied to develop different variants of the binary QANA. According to the results, transfer functions cannot generate optimal binary solutions for every metaheuristic algorithm in the FS domain. Moreover, using transfer functions imposes additional computational costs on the optimization algorithms.
In the second approach, a simple threshold with minimum computational costs is used to assign continuous QANA solutions into binary ones to develop the BQANA. All variants were experimentally evaluated on 10 medical datasets to identify the winner variant. The experimental results reveal that the BQANA developed by the second approach generates better solutions than the other variants. Then, the results of the BQANA were compared with results obtained from nine well-known metaheuristic algorithms: BPSO, ACO, BDE, BBA, FSWOA, BALO, BDA, QBHHO, and BASO. Furthermore, the Friedman test was applied to rank the algorithms based on their performance. The experimental results and statistical analysis revealed that the BQANA developed by the second approach outperforms comparative algorithms in selecting effective feature subsets from different scales of medical datasets. In the future, the BQANA can be enhanced by improving its search strategy and using novel and more effective transfer functions. Moreover, the BQANA can be applied to solve real-world applications and other discreet problems such as nurse scheduling.

Author Contributions

Conceptualization, M.H.N.-S.; methodology, M.H.N.-S., A.F. and H.Z.; software, M.H.N.-S., A.F. and H.Z.; validation, M.H.N.-S. and H.Z.; formal analysis, M.H.N.-S., A.F. and H.Z.; investigation, M.H.N.-S., A.F. and H.Z.; resources, M.H.N.-S. and S.M.; data curation, M.H.N.-S., A.F. and H.Z.; writing, M.H.N.-S., A.F. and H.Z.; original draft preparation, M.H.N.-S., A.F. and H.Z.; writing—review and editing, M.H.N.-S., A.F. and H.Z.; visualization, M.H.N.-S., A.F. and H.Z.; supervision, M.H.N.-S. and S.M.; project administration, M.H.N.-S. and S.M. All authors have read and agreed to the published version of the manuscript.

Funding

This research received no external funding.

Institutional Review Board Statement

Not applicable.

Informed Consent Statement

Not applicable.

Data Availability Statement

The data and code used in the research may be obtained from the corresponding author upon request.

Conflicts of Interest

The authors declare no conflict of interest.

Appendix A

Table A1, Table A2, Table A3, Table A4 and Table A5 present the comparison results between different versions of binary QANA developed by the first approach in each transfer function family.
Table A1. The comparison results between different versions of S-BQANA.
DatasetsMetricsS1S2S3S4
PimaFitnessAvg0.23530.23570.23740.2386
Min0.23180.23050.23180.2343
AccuracyAvg76.874476.792076.613176.5053
Max77.218077.344577.221576.9617
HeartEWFitnessAvg0.14790.15040.15100.1493
Min0.13820.14180.14240.1395
AccuracyAvg85.592685.314885.148185.3333
Max86.666786.296385.925986.2963
LymphographyFitnessAvg0.13140.13320.13610.1434
Min0.12040.12180.11360.1324
AccuracyAvg87.366787.140586.819086.0595
Max88.571488.428689.142987.1905
SPECT HeartFitnessAvg0.24960.25040.24620.2503
Min0.23900.23590.23210.2415
AccuracyAvg75.354075.215875.621175.1709
Max76.453076.723677.151076.0969
PenglungEWFitnessAvg0.10840.10420.10350.1014
Min0.09840.09480.09730.0830
AccuracyAvg89.758990.080490.107190.2946
Max90.714391.071490.714392.1429
ParkinsonFitnessAvg0.25380.24890.24370.2341
Min0.24530.23570.21910.2160
AccuracyAvg75.107175.469775.931876.8834
Max75.928176.849178.417578.7018
ColonFitnessAvg0.10880.10340.10340.1012
Min0.09980.09780.09780.0949
AccuracyAvg89.738190.190590.131090.3214
Max90.714390.714390.714390.9524
SRBCTFitnessAvg0.02110.01680.01650.0129
Min0.00590.00600.00550.0053
AccuracyAvg98.576498.930698.888999.2361
Max100.00100.00100.00100.00
LeukemiaFitnessAvg0.10480.10440.10210.1010
Min0.08200.09800.09730.0884
AccuracyAvg90.125090.080490.250090.3393
Max92.321490.714390.714391.6071
Prostate TumorFitnessAvg0.12030.11990.12270.1219
Min0.10500.11060.11100.1044
AccuracyAvg88.590988.522788.172788.2318
Max90.181889.454589.363690.0000
Overall ResultsW|T|L2|0|81|0|91|0|94|0|6
Table A2. The comparison results between different versions of V-BQANA.
DatasetsMetricsV1V2V3V4
PimaFitnessAvg0.23860.23890.23900.2382
Min0.23300.23320.23440.2343
AccuracyAvg76.461676.486376.443176.5175
Max77.093376.953276.831976.9600
HeartEWFitnessAvg0.15180.15130.15130.1521
Min0.14110.14320.14240.1439
AccuracyAvg85.092685.111185.111185.0370
Max86.296385.925985.925985.9259
LymphographyFitnessAvg0.14220.14250.14570.1412
Min0.12630.12470.13820.1252
AccuracyAvg86.152486.104885.785786.2667
Max87.857187.904886.523887.9048
SPECT HeartFitnessAvg0.24680.24570.24990.2465
Min0.22250.23060.23410.2188
AccuracyAvg75.496475.601975.195275.5306
Max77.934577.165276.723678.2621
PenglungEW FitnessAvg0.10300.09930.10010.0998
Min0.09460.08420.08570.0825
AccuracyAvg90.053690.428690.383990.4196
Max90.892991.964391.785792.1429
Parkinson FitnessAvg0.21150.22000.21480.2160
Min0.18050.18820.18310.1908
AccuracyAvg78.955778.100578.684978.6106
Max82.000081.489581.749181.0912
Colon FitnessAvg0.10080.09940.10300.1022
Min0.08490.08520.08740.0970
AccuracyAvg90.297690.428690.071490.1429
Max91.904891.904891.666790.4762
SRBCTFitnessAvg0.01350.01200.01210.0097
Min0.00310.00380.00300.0026
AccuracyAvg99.069499.222299.208399.4236
Max100.00100.00100.00100.00
LeukemiaFitnessAvg0.09740.10000.09820.0977
Min0.08370.08270.05700.0757
AccuracyAvg90.607190.366190.517990.5804
Max91.785792.142994.464392.8571
Prostate TumorFitnessAvg0.12060.12010.11520.1175
Min0.10300.10740.08760.1004
AccuracyAvg88.290988.286488.759188.5864
Max90.090989.545591.454590.3636
Overall ResultsW|T|L2|0|83|1|61|1|83|0|7
Table A3. The comparison results between different versions of U-BQANA.
DatasetsMetricsU1U2U3U4
PimaFitnessAvg0.23990.23860.23770.2393
Min0.23450.23310.22920.2318
AccuracyAvg76.340676.459076.594876.3969
Max76.826777.081377.481277.0933
HeartEWFitnessAvg0.15130.15140.15140.1493
Min0.14320.14180.14530.1432
AccuracyAvg85.148185.129685.092685.2778
Max85.925986.296385.555685.9259
LymphographyFitnessAvg0.14150.14230.14190.1423
Min0.12670.12580.12520.1258
AccuracyAvg86.202486.152486.147686.1690
Max87.761987.857187.857187.8571
SPECT HeartFitnessAvg0.24740.24810.24660.2468
Min0.23260.23280.23740.2260
AccuracyAvg75.444475.349075.522175.4623
Max76.780676.851976.481577.5356
PenglungEW FitnessAvg0.09940.10040.09910.1000
Min0.08270.08800.08330.0935
AccuracyAvg90.428690.330490.437590.3393
Max92.142991.607191.964390.8929
Parkinson FitnessAvg0.21630.21020.20820.2011
Min0.20030.19030.19550.1865
AccuracyAvg78.461879.035179.216079.9472
Max80.045680.950980.398281.4877
Colon FitnessAvg0.10030.10040.09750.0995
Min0.09450.08510.08260.0916
AccuracyAvg90.357190.333390.631090.4167
Max90.952491.904892.142991.1905
SRBCTFitnessAvg0.01120.01100.00840.0101
Min0.00140.00350.00050.0021
AccuracyAvg99.236199.312599.493199.3819
Max100.00100.00100.00100.00
LeukemiaFitnessAvg0.09860.10010.09760.0960
Min0.08630.08800.08270.0690
AccuracyAvg90.482190.321490.580490.7143
Max91.785791.607191.785793.3929
Prostate TumorFitnessAvg0.11640.11690.11860.1147
Min0.09820.09720.09770.0984
AccuracyAvg88.604588.545588.413688.7136
Max90.272790.454590.363690.0909
Overall ResultsW|T|L1|0|90|0|103|0|75|0|5
Table A4. The comparison results between different versions of Z-BQANA.
DatasetsMetricsZ1Z2Z3Z4
PimaFitnessAvg0.23500.23500.23450.2331
Min0.22810.22790.23190.2305
AccuracyAvg76.883776.914076.955477.0729
Max77.467577.484677.228377.4778
HeartEWFitnessAvg0.14960.14720.14350.1465
Min0.13950.13820.13870.1380
AccuracyAvg85.407485.685285.963085.7222
Max86.296386.666786.296386.6667
LymphographyFitnessAvg0.12730.13660.13130.1328
Min0.10490.11380.11320.1120
AccuracyAvg87.702486.854887.407187.1881
Max89.904889.238189.238189.1905
SPECT HeartFitnessAvg0.24500.24910.24110.2411
Min0.22880.22850.21670.2161
AccuracyAvg75.754375.379676.119776.1830
Max77.208077.236578.618278.6325
PenglungEW FitnessAvg0.10120.10020.09920.0985
Min0.08050.08040.08110.0848
AccuracyAvg90.392990.508990.633990.6875
Max92.321492.321492.321491.9643
Parkinson FitnessAvg0.23080.23690.23550.2363
Min0.19490.20820.19310.1935
AccuracyAvg77.247676.697576.799976.7173
Max80.817579.501880.957980.9421
Colon FitnessAvg0.10070.09950.10190.1006
Min0.08740.07810.08270.0855
AccuracyAvg90.440590.476290.345290.4524
Max91.666792.619092.142992.1429
SRBCTFitnessAvg0.01160.01150.01320.0152
Min0.00450.00440.00410.0038
AccuracyAvg99.375099.375099.243199.0347
Max100.00100.00100.00100.00
LeukemiaFitnessAvg0.09690.10030.09840.0983
Min0.08250.08300.07160.0836
AccuracyAvg90.830490.473290.696490.6875
Max92.142992.142993.214391.9643
Prostate TumorFitnessAvg0.11950.11780.11460.1178
Min0.10140.10040.10040.1005
AccuracyAvg88.540988.718289.036488.6864
Max90.272790.363690.363690.3636
Overall ResultsW|T|L3|0|72|0|82|1|82|1|7
Table A5. The comparison results between different versions of Q-BQANA.
DatasetsMetricsQ1Q2Q3Q4
PimaFitnessAvg0.23920.23900.23800.2385
Min0.23310.23180.23190.2344
AccuracyAvg76.414276.445876.499776.4923
Max76.954977.093377.076276.8267
HeartEWFitnessAvg0.15220.15280.15090.1540
Min0.14680.13950.14160.1468
AccuracyAvg85.055684.981585.074184.8333
Max85.555686.296385.925985.5556
LymphographyFitnessAvg0.14380.14160.14320.1428
Min0.13160.12520.13030.1202
AccuracyAvg85.961986.152485.995286.1143
Max87.142987.857187.285788.4762
SPECT HeartFitnessAvg0.24740.24410.24530.2464
Min0.22870.21120.23260.2347
AccuracyAvg75.434575.691675.564875.5221
Max77.179579.031376.823476.7949
PenglungEW FitnessAvg0.10150.09820.09770.0991
Min0.09580.06840.08280.0829
AccuracyAvg90.205490.482190.535790.4821
Max90.714393.571491.964392.1429
Parkinson FitnessAvg0.22560.21090.20490.2188
Min0.19480.18880.18380.1998
AccuracyAvg77.665978.987079.606878.3081
Max80.817581.219381.745680.0281
Colon FitnessAvg0.10080.09940.09470.1017
Min0.08290.07830.08090.0943
AccuracyAvg90.273890.357190.797690.2262
Max92.142992.381092.142990.9524
SRBCTFitnessAvg0.01300.00600.00470.0089
Min0.00260.00210.00180.0024
AccuracyAvg99.138999.715399.833399.5417
Max100.00100.00100.00100.00
LeukemiaFitnessAvg0.10090.09690.09150.0970
Min0.08750.08440.07020.0844
AccuracyAvg90.294690.607191.071490.6696
Max91.607191.785793.214391.7857
Prostate TumorFitnessAvg0.11760.11260.11130.1201
Min0.10320.09990.08820.1040
AccuracyAvg88.577388.986489.081888.3364
Max90.090990.181891.272790.0000
Overall ResultsW|T|L1|0|92|0|86|0|41|0|9

References

  1. Remeseiro, B.; Bolon-Canedo, V. A review of feature selection methods in medical applications. Comput. Biol. Med. 2019, 112, 103375. [Google Scholar] [CrossRef] [PubMed]
  2. Esfandiari, N.; Babavalian, M.R.; Moghadam, A.-M.E.; Tabar, V.K. Knowledge discovery in medicine: Current issue and future trend. Expert Syst. Appl. 2014, 41, 4434–4463. [Google Scholar] [CrossRef]
  3. Hashemi, F.S.G.; Ismail, M.R.; Yusop, M.R.; Hashemi, M.S.G.; Nadimi-Shahraki, M.H.; Rastegari, H.; Miah, G.; Aslani, F. Intelligent mining of large-scale bio-data: Bioinformatics applications. Biotechnol. Biotechnol. Equip. 2018, 32, 10–29. [Google Scholar] [CrossRef] [Green Version]
  4. Kalantari, A.; Kamsin, A.; Shamshirband, S.; Gani, A.; Alinejad-Rokny, H.; Chronopoulos, A.T. Computational intelligence approaches for classification of medical data: State-of-the-art, future challenges and research directions. Neurocomputing 2018, 276, 2–22. [Google Scholar] [CrossRef]
  5. Fayyad, U.; Piatetsky-Shapiro, G.; Smyth, P. From data mining to knowledge discovery in databases. AI Mag. 1996, 17, 37. [Google Scholar]
  6. Guyon, I.; Elisseeff, A. An introduction to variable and feature selection. J. Mach. Learn. Res. 2003, 3, 1157–1182. [Google Scholar]
  7. Qiu, C. A novel multi-swarm particle swarm optimization for feature selection. Genet. Program. Evolvable Mach. 2019, 20, 503–529. [Google Scholar] [CrossRef]
  8. Ibrahim, R.A.; Ewees, A.A.; Oliva, D.; Abd Elaziz, M.; Lu, S. Improved salp swarm algorithm based on particle swarm optimization for feature selection. J. Ambient. Intell. Humaniz. Comput. 2019, 10, 3155–3169. [Google Scholar] [CrossRef]
  9. Gharehchopogh, F.S.; Maleki, I.; Dizaji, Z.A. Chaotic vortex search algorithm: Metaheuristic algorithm for feature selection. Evol. Intell. 2021, 15, 1777–1808. [Google Scholar] [CrossRef]
  10. Liu, H.; Motoda, H. Feature Selection for Knowledge Discovery and Data Mining; Springer Science & Business Media: Berlin/Heidelberg, Germany, 2012; Volume 454. [Google Scholar]
  11. Zamani, H.; Nadimi-Shahraki, M.-H. Feature selection based on whale optimization algorithm for diseases diagnosis. Int. J. Comput. Sci. Inf. Secur. 2016, 14, 1243. [Google Scholar]
  12. Inbarani, H.H.; Azar, A.T.; Jothi, G. Supervised hybrid feature selection based on PSO and rough sets for medical diagnosis. Comput. Methods Programs Biomed. 2014, 113, 175–185. [Google Scholar] [CrossRef] [PubMed]
  13. Polat, H.; Danaei Mehr, H.; Cetin, A. Diagnosis of chronic kidney disease based on support vector machine by feature selection methods. J. Med. Syst. 2017, 41, 55. [Google Scholar] [CrossRef] [PubMed]
  14. Chatterjee, S.; Biswas, S.; Majee, A.; Sen, S.; Oliva, D.; Sarkar, R. Breast cancer detection from thermal images using a Grunwald-Letnikov-aided Dragonfly algorithm-based deep feature selection method. Comput. Biol. Med. 2022, 141, 105027. [Google Scholar] [CrossRef]
  15. Ayar, M.; Isazadeh, A.; Gharehchopogh, F.S.; Seyedi, M. Chaotic-based divide-and-conquer feature selection method and its application in cardiac arrhythmia classification. J. Supercomput. 2022, 78, 5856–5882. [Google Scholar] [CrossRef]
  16. Bharti, K.K.; Singh, P.K. Hybrid dimension reduction by integrating feature selection with feature extraction method for text clustering. Expert Syst. Appl. 2015, 42, 3105–3114. [Google Scholar] [CrossRef]
  17. Abualigah, L.M.Q. Feature Selection and Enhanced Krill Herd Algorithm for Text Document Clustering; Springer: Berlin/Heidelberg, Germany, 2019. [Google Scholar]
  18. Naseri, T.S.; Gharehchopogh, F.S. A Feature Selection Based on the Farmland Fertility Algorithm for Improved Intrusion Detection Systems. J. Netw. Syst. Manag. 2022, 30, 40. [Google Scholar] [CrossRef]
  19. Amiri, F.; Yousefi, M.R.; Lucas, C.; Shakery, A.; Yazdani, N. Mutual information-based feature selection for intrusion detection systems. J. Netw. Comput. Appl. 2011, 34, 1184–1199. [Google Scholar] [CrossRef]
  20. Khater, B.S.; Abdul Wahab, A.W.; Idris, M.Y.I.; Hussain, M.A.; Ibrahim, A.A.; Amin, M.A.; Shehadeh, H.A. Classifier Performance Evaluation for Lightweight IDS Using Fog Computing in IoT Security. Electronics 2021, 10, 1633. [Google Scholar] [CrossRef]
  21. Samadi Bonab, M.; Ghaffari, A.; Gharehchopogh, F.S.; Alemi, P. A wrapper-based feature selection for improving performance of intrusion detection systems. Int. J. Commun. Syst. 2020, 33, e4434. [Google Scholar] [CrossRef]
  22. Mohammadzadeh, H.; Gharehchopogh, F.S. A novel hybrid whale optimization algorithm with flower pollination algorithm for feature selection: Case study Email spam detection. Comput. Intell. 2021, 37, 176–209. [Google Scholar] [CrossRef]
  23. Lee, S.M.; Kim, D.S.; Kim, J.H.; Park, J.S. Spam detection using feature selection and parameters optimization. In Proceedings of the 2010 International Conference on Complex, Intelligent and Software Intensive Systems, Krakow, Poland, 15–18 February 2010; pp. 883–888. [Google Scholar]
  24. Zhang, Y.; Wang, S.; Phillips, P.; Ji, G. Binary PSO with mutation operator for feature selection using decision tree applied to spam detection. Knowl.-Based Syst. 2014, 64, 22–31. [Google Scholar] [CrossRef]
  25. Mohammadzadeh, H.; Gharehchopogh, F.S. Feature selection with binary symbiotic organisms search algorithm for email spam detection. Int. J. Inf. Technol. Decis. Mak. 2021, 20, 469–515. [Google Scholar] [CrossRef]
  26. Abusamra, H. A comparative study of feature selection and classification methods for gene expression data of glioma. Procedia Comput. Sci. 2013, 23, 5–14. [Google Scholar] [CrossRef] [Green Version]
  27. Hauskrecht, M.; Pelikan, R.; Valko, M.; Lyons-Weiler, J. Feature selection and dimensionality reduction in genomics and proteomics. In Fundamentals of Data mining in Genomics and Proteomics; Springer: Berlin/Heidelberg, Germany, 2007; pp. 149–172. [Google Scholar]
  28. Tadist, K.; Najah, S.; Nikolov, N.S.; Mrabti, F.; Zahi, A. Feature selection methods and genomic big data: A systematic review. J. Big Data 2019, 6, 79. [Google Scholar] [CrossRef] [Green Version]
  29. Xing, E.P.; Jordan, M.I.; Karp, R.M. Feature Selection for High-Dimensional Genomic Microarray Data; ICML: Williamstown, MA, USA, 2001; pp. 601–608. [Google Scholar]
  30. Liu, H.; Yu, L. Toward integrating feature selection algorithms for classification and clustering. IEEE Trans. Knowl. Data Eng. 2005, 17, 491–502. [Google Scholar]
  31. Sharda, S.; Srivastava, M.; Gusain, H.S.; Sharma, N.K.; Bhatia, K.S.; Bajaj, M.; Kaur, H.; Zawbaa, H.M.; Kamel, S. A hybrid machine learning technique for feature optimization in object-based classification of debris-covered glaciers. Ain Shams Eng. J. 2022, 13, 101809. [Google Scholar] [CrossRef]
  32. Chen, C.W.; Tsai, Y.H.; Chang, F.R.; Lin, W.C. Ensemble feature selection in medical datasets: Combining filter, wrapper, and embedded feature selection results. Expert Syst. 2020, 37, e12553. [Google Scholar] [CrossRef]
  33. Jović, A.; Brkić, K.; Bogunović, N. A review of feature selection methods with applications. In Proceedings of the 2015 38th International Convention on Information and Communication Technology, Electronics and Microelectronics (MIPRO), Opatija, Croatia, 25–29 May 2015; pp. 1200–1205. [Google Scholar]
  34. Hall, M.A.; Smith, L.A. Feature selection for machine learning: Comparing a correlation-based filter approach to the wrapper. In Proceedings of the FLAIRS Conference, Orlando, FL, USA, 1–5 May 1999; pp. 235–239. [Google Scholar]
  35. Agrawal, P.; Ganesh, T.; Oliva, D.; Mohamed, A.W. S-shaped and v-shaped gaining-sharing knowledge-based algorithm for feature selection. Appl. Intell. 2022, 52, 81–112. [Google Scholar] [CrossRef]
  36. Rodrigues, D.; Pereira, L.A.; Papa, J.P.; Weber, S.A. A binary krill herd approach for feature selection. In Proceedings of the 2014 22nd International Conference on Pattern Recognition, Stockholm, Sweden, 24–28 August 2014; pp. 1407–1412. [Google Scholar]
  37. Nadimi-Shahraki, M.H.; Fatahi, A.; Zamani, H.; Mirjalili, S.; Abualigah, L.; Abd Elaziz, M. Migration-based moth-flame optimization algorithm. Processes 2021, 9, 2276. [Google Scholar] [CrossRef]
  38. Tran, B.; Xue, B.; Zhang, M. Adaptive multi-subswarm optimisation for feature selection on high-dimensional classification. In Proceedings of the Genetic and Evolutionary Computation Conference, Prague, Czech Republic, 13–17 July 2019; pp. 481–489. [Google Scholar]
  39. Abd Elaziz, M.; Oliva, D. Parameter estimation of solar cells diode models by an improved opposition-based whale optimization algorithm. Energy Convers. Manag. 2018, 171, 1843–1859. [Google Scholar] [CrossRef]
  40. Zamani, H.; Nadimi-Shahraki, M.H.; Gandomi, A.H. CCSA: Conscious neighborhood-based crow search algorithm for solving global optimization problems. Appl. Soft Comput. 2019, 85, 105583. [Google Scholar] [CrossRef]
  41. Trojovský, P.; Dehghani, M. Pelican Optimization Algorithm: A Novel Nature-Inspired Algorithm for Engineering Applications. Sensors 2022, 22, 855. [Google Scholar] [CrossRef]
  42. Kharrich, M.; Kamel, S.; Hassan, M.H.; ElSayed, S.K.; Taha, I.B.M. An Improved Heap-Based Optimizer for Optimal Design of a Hybrid Microgrid Considering Reliability and Availability Constraints. Sustainability 2021, 13, 10419. [Google Scholar] [CrossRef]
  43. Gharehchopogh, F.S.; Farnad, B.; Alizadeh, A. A modified farmland fertility algorithm for solving constrained engineering problems. Concurr. Comput. Pract. Exp. 2021, 33, e6310. [Google Scholar] [CrossRef]
  44. Amini, E.; Mehdipour, H.; Faraggiana, E.; Golbaz, D.; Mozaffari, S.; Bracco, G.; Neshat, M. Optimization Study of Hydraulic Power Take-off System for an Ocean Wave Energy Converter. arXiv 2021, arXiv:2112.09803. [Google Scholar]
  45. Ceylan, O.; Neshat, M.; Mirjalili, S. Cascaded H-bridge multilevel inverters optimization using adaptive grey wolf optimizer with local search. Electr. Eng. 2021, 1–15. [Google Scholar] [CrossRef]
  46. Nadimi-Shahraki, M.H.; Fatahi, A.; Zamani, H.; Mirjalili, S.; Abualigah, L. An Improved Moth-Flame Optimization Algorithm with Adaptation Mechanism to Solve Numerical and Mechanical Engineering Problems. Entropy 2021, 23, 1637. [Google Scholar] [CrossRef]
  47. Abd Elaziz, M.; Elsheikh, A.H.; Oliva, D.; Abualigah, L.; Lu, S.; Ewees, A.A. Advanced metaheuristic techniques for mechanical design problems. Arch. Comput. Methods Eng. 2022, 29, 695–716. [Google Scholar] [CrossRef]
  48. Zamani, H.; Nadimi-Shahraki, M.H.; Gandomi, A.H. Starling murmuration optimizer: A novel bio-inspired algorithm for global and engineering optimization. Comput. Methods Appl. Mech. Eng. 2022, 392, 114616. [Google Scholar] [CrossRef]
  49. Chakraborty, S.; Sharma, S.; Saha, A.K.; Saha, A. A novel improved whale optimization algorithm to solve numerical optimization and real-world applications. Artif. Intell. Rev. 2022, 55, 4605–4716. [Google Scholar] [CrossRef]
  50. El-Shorbagy, M. Chaotic Fruit Fly Algorithm for Solving Engineering Design Problems. Complexity 2022, 2022, 6627409. [Google Scholar] [CrossRef]
  51. Sa’ad, S.; Muhammed, A.; Abdullahi, M.; Abdullah, A.; Hakim Ayob, F. An Enhanced Discrete Symbiotic Organism Search Algorithm for Optimal Task Scheduling in the Cloud. Algorithms 2021, 14, 200. [Google Scholar] [CrossRef]
  52. Wang, Y.; Yang, Z.; Guo, Y.; Zhou, B.; Zhu, X. A Novel Binary Competitive Swarm Optimizer for Power System Unit Commitment. Appl. Sci. 2019, 9, 1776. [Google Scholar] [CrossRef] [Green Version]
  53. Izakian, H.; Abraham, A.; Snášel, V. Metaheuristic Based Scheduling Meta-Tasks in Distributed Heterogeneous Computing Systems. Sensors 2009, 9, 5339–5350. [Google Scholar] [CrossRef] [PubMed] [Green Version]
  54. Eslami, M.; Neshat, M.; Khalid, S.A. A Novel Hybrid Sine Cosine Algorithm and Pattern Search for Optimal Coordination of Power System Damping Controllers. Sustainability 2022, 14, 541. [Google Scholar] [CrossRef]
  55. Li, W.; Luo, H.; Wang, L.; Jiang, Q.; Xu, Q. Enhanced Brain Storm Optimization Algorithm Based on Modified Nelder–Mead and Elite Learning Mechanism. Mathematics 2022, 10, 1303. [Google Scholar] [CrossRef]
  56. Heydari, A.; Majidi Nezhad, M.; Neshat, M.; Garcia, D.A.; Keynia, F.; De Santoli, L.; Tjernberg, L.B. A combined fuzzy GMDH neural network and grey wolf optimization application for wind turbine power production forecasting considering SCADA data. Energies 2021, 14, 3459. [Google Scholar] [CrossRef]
  57. Chou, J.-S.; Chong, W.K.; Bui, D.-K. Nature-inspired metaheuristic regression system: Programming and implementation for civil engineering applications. J. Comput. Civ. Eng. 2016, 30, 04016007. [Google Scholar] [CrossRef]
  58. Neshat, M. The Application of Nature-Inspired Metaheuristic Methods for Optimising Renewable Energy Problems and the Design of Water Distribution Networks. Ph.D. Thesis, University of Adelaide, Adelaide, Australia, 2020. [Google Scholar]
  59. Mohamed, A.A.; Kamel, S.; Hassan, M.H.; Mosaad, M.I.; Aljohani, M. Optimal Power Flow Analysis Based on Hybrid Gradient-Based Optimizer with Moth–Flame Optimization Algorithm Considering Optimal Placement and Sizing of FACTS/Wind Power. Mathematics 2022, 10, 361. [Google Scholar] [CrossRef]
  60. Farhat, M.; Kamel, S.; Atallah, A.M.; Khan, B. Optimal power flow solution based on jellyfish search optimization considering uncertainty of renewable energy sources. IEEE Access 2021, 9, 100911–100933. [Google Scholar] [CrossRef]
  61. Abido, M.A. Optimal power flow using particle swarm optimization. Int. J. Electr. Power Energy Syst. 2002, 24, 563–571. [Google Scholar] [CrossRef]
  62. Bakirtzis, A.G.; Biskas, P.N.; Zoumas, C.E.; Petridis, V. Optimal power flow by enhanced genetic algorithm. IEEE Trans. Power Syst. 2002, 17, 229–236. [Google Scholar] [CrossRef]
  63. Nadimi-Shahraki, M.H.; Fatahi, A.; Zamani, H.; Mirjalili, S.; Oliva, D. Hybridizing of Whale and Moth-Flame Optimization Algorithms to Solve Diverse Scales of Optimal Power Flow Problem. Electronics 2022, 11, 831. [Google Scholar] [CrossRef]
  64. Saha, A.; Bhattacharya, A.; Das, P.; Chakraborty, A.K. Crow search algorithm for solving optimal power flow problem. In Proceedings of the 2017 Second International Conference on Electrical, Computer and Communication Technologies (ICECCT), Coimbatore, India, 22–24 February 2017; pp. 1–8. [Google Scholar]
  65. Radpour, V.; Gharehchopogh, F.S. A Novel Hybrid Binary Farmland Fertility Algorithm with Naïve Bayes for Diagnosis of Heart Disease. Sak. Univ. J. Comput. Inf. Sci. 2022, 5, 90–103. [Google Scholar]
  66. Abualigah, L.; Diabat, A. Chaotic binary group search optimizer for feature selection. Expert Syst. Appl. 2022, 192, 116368. [Google Scholar] [CrossRef]
  67. Ibrahim, R.A.; Abualigah, L.; Ewees, A.A.; Al-Qaness, M.A.; Yousri, D.; Alshathri, S.; Abd Elaziz, M. An electric fish-based arithmetic optimization algorithm for feature selection. Entropy 2021, 23, 1189. [Google Scholar] [CrossRef]
  68. Mostafa, R.R.; Ewees, A.A.; Ghoniem, R.M.; Abualigah, L.; Hashim, F.A. Boosting chameleon swarm algorithm with consumption AEO operator for global optimization and feature selection. Knowl. Based Syst. 2022, 246, 108743. [Google Scholar] [CrossRef]
  69. Emary, E.; Zawbaa, H.M.; Hassanien, A.E. Binary grey wolf optimization approaches for feature selection. Neurocomputing 2016, 172, 371–381. [Google Scholar] [CrossRef]
  70. Mafarja, M.; Aljarah, I.; Faris, H.; Hammouri, A.I.; Ala’M, A.-Z.; Mirjalili, S. Binary grasshopper optimisation algorithm approaches for feature selection problems. Expert Syst. Appl. 2019, 117, 267–286. [Google Scholar] [CrossRef]
  71. Sindhu, R.; Ngadiran, R.; Yacob, Y.M.; Zahri, N.A.H.; Hariharan, M. Sine–cosine algorithm for feature selection with elitism strategy and new updating mechanism. Neural Comput. Appl. 2017, 28, 2947–2958. [Google Scholar] [CrossRef]
  72. Dhiman, G.; Oliva, D.; Kaur, A.; Singh, K.K.; Vimal, S.; Sharma, A.; Cengiz, K. BEPO: A novel binary emperor penguin optimizer for automatic feature selection. Knowl.-Based Syst. 2021, 211, 106560. [Google Scholar] [CrossRef]
  73. Zamani, H.; Nadimi-Shahraki, M.H.; Gandomi, A.H. QANA: Quantum-based avian navigation optimizer algorithm. Eng. Appl. Artif. Intell. 2021, 104, 104314. [Google Scholar] [CrossRef]
  74. Bellman, R. Dynamic Programming; Princeton University Press: Princeton, NJ, USA, 1957. [Google Scholar]
  75. Nadimi-Shahraki, M.H.; Zamani, H. DMDE: Diversity-maintained multi-trial vector differential evolution algorithm for non-decomposition large-scale global optimization. Expert Syst. Appl. 2022, 198, 116895. [Google Scholar] [CrossRef]
  76. Kennedy, J.; Eberhart, R.C. A discrete binary version of the particle swarm algorithm. In Proceedings of the 1997 IEEE International Conference on Systems, Man, and Cybernetics. Computational Cybernetics and Simulation, Orlando, FL, USA, 12–15 October 1997; pp. 4104–4108. [Google Scholar]
  77. Rashedi, E.; Nezamabadi-Pour, H.; Saryazdi, S. BGSA: Binary gravitational search algorithm. Nat. Comput. 2010, 9, 727–745. [Google Scholar] [CrossRef]
  78. Mirjalili, S.; Zhang, H.; Mirjalili, S.; Chalup, S.; Noman, N. A novel U-shaped transfer function for binary particle swarm optimisation. In Soft Computing for Problem Solving 2019; Springer: Berlin/Heidelberg, Germany, 2020; pp. 241–259. [Google Scholar]
  79. Guo, S.-S.; Wang, J.-S.; Guo, M.-W. Z-shaped transfer functions for binary particle swarm optimization algorithm. Comput. Intell. Neurosci. 2020, 2020, 6502807. [Google Scholar] [CrossRef] [PubMed]
  80. Too, J.; Abdullah, A.R.; Mohd Saad, N. A new quadratic binary harris hawk optimization for feature selection. Electronics 2019, 8, 1130. [Google Scholar] [CrossRef] [Green Version]
  81. Jordehi, A.R. Binary particle swarm optimisation with quadratic transfer function: A new binary optimisation algorithm for optimal scheduling of appliances in smart homes. Appl. Soft Comput. 2019, 78, 465–480. [Google Scholar] [CrossRef]
  82. Liao, C.-J.; Tseng, C.-T.; Luarn, P. A discrete version of particle swarm optimization for flowshop scheduling problems. Comput. Oper. Res. 2007, 34, 3099–3111. [Google Scholar] [CrossRef]
  83. Dorigo, M.; Di Caro, G. Ant colony optimization: A new meta-heuristic. In Proceedings of the 1999 Congress on Evolutionary Computation-CEC99 (Cat. No. 99TH8406), Washington, DC, USA, 6–9 July 1999; pp. 1470–1477. [Google Scholar]
  84. Gong, T.; Tuson, A.L. Differential evolution for binary encoding. In Soft Computing in Industrial Applications; Springer: Berlin/Heidelberg, Germany, 2007; pp. 251–262. [Google Scholar]
  85. Nakamura, R.Y.; Pereira, L.A.; Costa, K.A.; Rodrigues, D.; Papa, J.P.; Yang, X.-S. BBA: A binary bat algorithm for feature selection. In Proceedings of the 2012 25th SIBGRAPI Conference on Graphics, Patterns and Images, Ouro Preto, Brazil, 22–25 August 2012; pp. 291–297. [Google Scholar]
  86. Emary, E.; Zawbaa, H.M.; Hassanien, A.E. Binary ant lion approaches for feature selection. Neurocomputing 2016, 213, 54–65. [Google Scholar] [CrossRef]
  87. Mirjalili, S. Dragonfly algorithm: A new meta-heuristic optimization technique for solving single-objective, discrete, and multi-objective problems. Neural Comput. Appl. 2016, 27, 1053–1073. [Google Scholar] [CrossRef]
  88. Too, J.; Rahim Abdullah, A. Binary atom search optimisation approaches for feature selection. Connect. Sci. 2020, 32, 406–430. [Google Scholar] [CrossRef]
  89. Dorigo, M.; Birattari, M.; Stutzle, T. Ant colony optimization. IEEE Comput. Intell. Mag. 2006, 1, 28–39. [Google Scholar] [CrossRef]
  90. Aghdam, M.H.; Ghasem-Aghaee, N.; Basiri, M.E. Text feature selection using ant colony optimization. Expert Syst. Appl. 2009, 36, 6843–6853. [Google Scholar] [CrossRef]
  91. Chen, B.; Chen, L.; Chen, Y. Efficient ant colony optimization for image feature selection. Signal Process. 2013, 93, 1566–1576. [Google Scholar] [CrossRef]
  92. Aghdam, M.H.; Kabiri, P. Feature selection for intrusion detection system using ant colony optimization. Int. J. Netw. Secur. 2016, 18, 420–432. [Google Scholar]
  93. Renuka, D.K.; Visalakshi, P.; Sankar, T. Improving Email spam classification using ant colony optimization algorithm. Int. J. Comput. Appl. 2015, 22, 22–26. [Google Scholar]
  94. Taghian, S.; Nadimi-Shahraki, M.H.; Zamani, H. Comparative analysis of transfer function-based binary Metaheuristic algorithms for feature selection. In Proceedings of the 2018 International Conference on Artificial Intelligence and Data Processing (IDAP), Malatya, Turkey, 28–30 September 2018; pp. 1–6. [Google Scholar]
  95. Papa, J.P.; Rosa, G.H.; Papa, L.P. A binary-constrained Geometric Semantic Genetic Programming for feature selection purposes. Pattern Recog. Lett. 2017, 100, 59–66. [Google Scholar] [CrossRef] [Green Version]
  96. Marandi, A.; Afshinmanesh, F.; Shahabadi, M.; Bahrami, F. Boolean particle swarm optimization and its application to the design of a dual-band dual-polarized planar antenna. In Proceedings of the 2006 IEEE international conference on evolutionary computation, Vancouver, BC, Canada, 16–21 July 2006; pp. 3212–3218. [Google Scholar]
  97. Aslan, M.; Gunduz, M.; Kiran, M.S. JayaX: Jaya algorithm with xor operator for binary optimization. Appl. Soft Comput. 2019, 82, 105576. [Google Scholar] [CrossRef]
  98. Mirjalili, S.; Lewis, A. S-shaped versus V-shaped transfer functions for binary particle swarm optimization. Swarm Evol. Comput. 2013, 9, 1–14. [Google Scholar] [CrossRef]
  99. Lin, J.C.-W.; Yang, L.; Fournier-Viger, P.; Hong, T.-P.; Voznak, M. A binary PSO approach to mine high-utility itemsets. Soft Comput. 2017, 21, 5103–5121. [Google Scholar] [CrossRef]
  100. Guha, R.; Ghosh, K.K.; Bera, S.K.; Sarkar, R.; Mirjalili, S. Discrete Equilibrium Optimizer Combined with Simulated Annealing for Feature Selection, 4 January 2022, PREPRINT (Version 2). Research Square. Available online: https://assets.researchsquare.com/files/rs-28683/v2_covered.pdf?c=1641365319 (accessed on 30 June 2022).
  101. Nadimi-Shahraki, M.H.; Zamani, H.; Mirjalili, S. Enhanced whale optimization algorithm for medical feature selection: A COVID-19 case study. Comput. Biol. Med. 2022, 148, 105858. [Google Scholar] [CrossRef] [PubMed]
  102. Hafez, A.I.; Zawbaa, H.M.; Emary, E.; Hassanien, A.E. Sine cosine optimization algorithm for feature selection. In Proceedings of the 2016 International Symposium on Innovations in Intelligent Systems and Applications (INISTA), Sinaia, Romania, 2–5 August 2016; pp. 1–5. [Google Scholar]
  103. Tran, B.; Xue, B.; Zhang, M. Variable-length particle swarm optimization for feature selection on high-dimensional classification. IEEE Trans. Evol. Comput. 2018, 23, 473–487. [Google Scholar] [CrossRef]
  104. Tanabe, R.; Fukunaga, A. Success-history based parameter adaptation for differential evolution. In Proceedings of the 2013 IEEE Congress on Evolutionary Computation, Cancun, Mexico, 20–23 June 2013; pp. 71–78. [Google Scholar]
  105. Derrac, J.; García, S.; Molina, D.; Herrera, F. A practical tutorial on the use of nonparametric statistical tests as a methodology for comparing evolutionary and swarm intelligence algorithms. Swarm Evol. Comput. 2011, 1, 3–18. [Google Scholar] [CrossRef]
  106. Seger, C. An Investigation of Categorical Variable Encoding Techniques in Machine Learning: Binary versus One-Hot and Feature Hashing. Bachelor’s Thesis, KTH School of Electrical Engineering and Computer Science, Stockholm, Sweden, 2018. [Google Scholar]
  107. Kaur, H.; Kumari, V. Predictive modelling and analytics for diabetes using a machine learning approach. Appl. Comput. Inform. 2020, 18, 90–100. [Google Scholar] [CrossRef]
  108. Blake, C. UCI Repository of Machine Learning Databases. 1998. Available online: http://www.ics.uci.edu/~mlearn/MLRepository.html (accessed on 30 June 2022).
  109. Alon, U.; Barkai, N.; Notterman, D.A.; Gish, K.; Ybarra, S.; Mack, D.; Levine, A.J. Broad patterns of gene expression revealed by clustering analysis of tumor and normal colon tissues probed by oligonucleotide arrays. Proc. Natl. Acad. Sci. USA 1999, 96, 6745–6750. [Google Scholar] [CrossRef] [PubMed] [Green Version]
  110. Khan, J.; Wei, J.S.; Ringner, M.; Saal, L.H.; Ladanyi, M.; Westermann, F.; Berthold, F.; Schwab, M.; Antonescu, C.R.; Peterson, C. Classification and diagnostic prediction of cancers using gene expression profiling and artificial neural networks. Nat. Med. 2001, 7, 673–679. [Google Scholar] [CrossRef]
  111. Golub, T.R.; Slonim, D.K.; Tamayo, P.; Huard, C.; Gaasenbeek, M.; Mesirov, J.P.; Coller, H.; Loh, M.L.; Downing, J.R.; Caligiuri, M.A. Molecular classification of cancer: Class discovery and class prediction by gene expression monitoring. Science 1999, 286, 531–537. [Google Scholar] [CrossRef] [Green Version]
  112. Kar, S.; Sharma, K.D.; Maitra, M. Gene selection from microarray gene expression data for classification of cancer subgroups employing PSO and adaptive K-nearest neighborhood technique. Expert Syst. Appl. 2015, 42, 612–627. [Google Scholar] [CrossRef]
Figure 1. The V-shaped formation consists of a header (H), left-line (L), and right-line (R) [73].
Mathematics 10 02770 g001
Figure 2. Flowchart of the QANA.
Mathematics 10 02770 g002
Figure 3. The S-shaped, V-shaped, and U-shaped transfer functions.
Mathematics 10 02770 g003
Figure 4. The Z-shaped and quadratic transfer functions.
Mathematics 10 02770 g004
Figure 5. Flowchart of the proposed BQANA using a variable threshold.
Mathematics 10 02770 g005
Figure 6. The average number of features selected by BQANA and comparative algorithms on small datasets.
Mathematics 10 02770 g006
Figure 7. The average number of features selected by BQANA and comparative algorithms on medium and large datasets.
Mathematics 10 02770 g007
Figure 8. Boxplot of accuracy rate obtained by BQANA and comparative algorithms.
Mathematics 10 02770 g008
Figure 9. Convergence behavior of the BQANA and comparative algorithms.
Mathematics 10 02770 g009
Figure 10. The rank of BQANA and comparative algorithms for feature selection problems.
Mathematics 10 02770 g010
Table 1. The formulation of S-shaped, V-shaped, and U-shaped family transfer functions.
No.S-Shaped Transfer FunctionsNo.V-Shaped Transfer FunctionsNo.U-Shaped Transfer Functions
S1 T F S ( x ) = 1 / ( 1 + exp 2 x ) V1 T F V ( x ) = | e r f ( π 2 x ) | U1 T F U ( x ) = α | x 1.5 |
S2 T F S ( x ) = 1 / ( 1 + exp x ) V2 T F V ( x ) = | t a n   h ( x ) | U2 T F U ( x ) = α | x 2 |
S3 T F S ( x ) = 1 / ( 1 + exp x / 2 ) V3 T F V ( x ) = | ( x ) / 1 + x 2 | U3 T F U ( x ) = α | x 3 |
S4 T F S ( x ) = 1 / ( 1 + exp x / 3 ) V4 T F V ( x ) = | 2 π a r c t a n ( π 2 x ) | U4 T F U ( x ) = α | x 4 |
Table 2. The formulation of Z-shaped and quadratic family transfer functions.
No.Z-Shaped Transfer FunctionsNo.Quadratic Transfer Functions
Z1 T F Z ( x ) = 1 2 x Q1 T F Q ( x ) = { | x ( 0.5   x m a x   ) | ,                   i f   x < 0.5   x m a x   1                       ,                   i f   x 0.5   x m a x  
Z2 T F Z ( x ) = 1 5 x Q2 T F Q ( x ) = { ( x ( 0.5   x m a x   ) ) 2 ,                   i f   x < 0.5   x m a x   1                         ,                   i f   x 0.5   x m a x  
Z3 T F Z ( x ) = 1 8 x Q3 T F Q ( x ) = { ( x ( 0.5   x m a x   ) ) 3 ,                   i f   x < 0.5   x m a x   1                         ,                   i f   x 0.5   x m a x  
Z4 T F Z ( x ) = 1 20 x Q4 T F Q ( x ) = { ( x ( 0.5   x m a x   ) ) 1 2 ,                   i f   x < 0.5   x m a x   1                       ,                     i f   x 0.5   x m a x  
Table 3. Datasets specifications.
No.Medical DatasetsNo. SamplesNo. FeaturesClassesSize
1Pima76882Small
2HeartEw270132Small
3Lymphography148184Small
4SPECT Heart267222Small
5PenglungEW733257Medium
6Parkinson7567542Medium
7Colon6220002Large
8SRBCT8323084Large
9Leukemia7271294Large
10Prostate tumor102105092Large
Table 4. Parameters of the algorithms.
AlgorithmParameter Settings
BPSOc1 = c2 = 2, w = [0.9 to 0.4].
ACOτ = 1, α = 1, ρ = 0.2, β = 0.1, η = 1.
BDECr = 0.9.
BBAA = 0.9, r = 0.9, Qmin = 0, Qmax = 2.
FSWOAa is linearly decreased from 2 to 0, a2 = is linearly decreased from −1 to −2, b = 1.
BALOV-shaped transfer function.
BDADmax = 6.
QBHHOβ = 1.5, Q4 transfer function, and xmax = 5.
BASOα = 50, β = 0.2.
BQANAThe number of flocks (k) = 2, LTM size (K′) = 2, and STM size (K″) = 10.
Table 5. The comparison between the BQANA and winners of each family.
DatasetsMetricsS4V2U4Z1Q3BQANA
PimaFitnessAvg0.23860.23890.23930.23500.23800.2316
Min0.23430.23320.23180.22810.23190.2291
AccuracyAvg76.505376.486376.396976.883776.499777.2076
Max76.961776.953277.093377.467577.076277.4863
HeartEWFitnessAvg0.14930.15130.14930.14960.15090.1384
Min0.13950.14320.14320.13950.14160.1329
AccuracyAvg85.333385.111185.277885.407485.074186.4259
Max86.296385.925985.925986.296385.925987.0370
LymphographyFitnessAvg0.14340.14250.14230.12730.14320.1128
Min0.13240.12470.12580.10490.13030.1008
AccuracyAvg86.059586.104886.169087.702485.995289.1310
Max87.190587.904887.857189.904887.285790.3810
SPECT HeartFitnessAvg0.25030.24570.24680.24500.24530.2231
Min0.24150.23060.22600.22880.23260.2038
AccuracyAvg75.170975.601975.462375.754375.564877.8725
Max76.096977.165277.535677.208076.823479.7863
PenglungEWFitnessAvg0.10140.09930.10000.10120.09770.0765
Min0.08300.08420.09350.08050.08280.0545
AccuracyAvg90.294690.428690.339390.392990.535792.6429
Max92.142991.964390.892992.321491.964394.8214
ParkinsonFitnessAvg0.23410.22000.20110.23080.20490.1604
Min0.21600.18820.18650.19490.18380.1279
AccuracyAvg76.883478.100579.947277.247679.606883.9765
Max78.701881.489581.487780.817581.745687.1807
ColonFitnessAvg0.10120.09940.09950.10070.09470.0775
Min0.09490.08520.09160.08740.08090.0481
AccuracyAvg90.321490.428690.416790.440590.797692.5000
Max90.952491.904891.190591.666792.142995.2381
SRBCTFitnessAvg0.01290.01200.01010.01160.00470.0040
Min0.00530.00380.00210.00450.00180.0003
AccuracyAvg99.236199.222299.381999.375099.833399.8333
Max100.00100.00100.00100.00100.00100.00
LeukemiaFitnessAvg0.10100.10000.09600.09690.09150.0638
Min0.08840.08270.06900.08250.07020.0426
AccuracyAvg90.339390.366190.714390.830491.071493.9196
Max91.607192.142993.392992.142993.214396.2500
Prostate TumorFitnessAvg0.12190.12010.11470.11950.11130.0534
Min0.10440.10740.09840.10140.08820.0199
AccuracyAvg88.231888.286488.713688.540989.081894.7773
Max90.000089.545590.090990.272791.272798.0000
Overall ResultsW|T|L0|0|100|0|100|0|100|0|100|0|1010|0|0
Table 6. The comparison between the BQANA and comparative algorithms.
DatasetsMetricsBPSOACOBDEBBAFSWOABALOBDAQBHHOBASOBQANA
PimaFitnessAvg0.23290.23800.23240.23270.23740.23230.23170.23370.23530.2316
Min0.23040.23170.22920.22670.22660.24990.22800.22660.22430.2291
AccuracyAvg77.022476.51977.210177.019576.675277.093677.185576.932976.735977.2076
Max77.359977.21177.481277.609477.079677.619677.474477.614577.852077.4863
No. featuresAvg4.3004.4005.4004.4505.2004.4504.4504.2504.0004.750
Min4.0004.0004.0004.0004.0004.0004.0004.0002.0004.000
HeartEWFitnessAvg0.14140.14890.13900.14080.15480.14070.13860.14170.14260.1384
Min0.13580.13950.13080.13580.14680.13580.13080.13510.13800.1329
AccuracyAvg86.129685.33386.537086.148184.907486.185286.42686.037085.907486.4259
Max86.666786.29687.407486.666785.555686.666787.40786.666786.666787.0370
No. featuresAvg5.3004.1507.4504.9507.0505.1505.4504.4504.0005.250
Min3.0003.0005.0003.0004.0003.0004.0003.0003.0003.000
lymphographyFitnessAvg0.11940.14500.12460.15240.13800.11460.11540.12660.12750.1128
Min0.10460.13030.10500.13750.12520.10550.10540.11300.11350.1008
AccuracyAvg88.492985.90088.100085.071486.690588.947688.87187.650087.716789.1310
Max90.000087.28690.000086.619087.952489.904889.95289.095289.095290.3810
No. featuresAvg9.6509.60012.1508.15011.3009.3509.4507.65010.6009.400
Min6.0005.00010.0005.0009.0006.0007.0006.0006.0006.000
SPECT HeartFitnessAvg0.22910.24880.22980.23390.25740.22090.22300.23080.23540.2231
Min0.20910.23480.19940.22260.24580.20690.20120.21500.22190.2038
AccuracyAvg77.287775.23477.344076.625474.619778.134677.90076.970876.502177.8725
Max79.387576.69580.227977.977275.726579.472980.18578.646777.906079.7863
No. featuresAvg9.1507.80012.0509.45013.5009.6509.2006.1006.2008.850
Min6.0002.0006.0004.00010.0007.0004.0002.0002.0002.000
PenglungEW FitnessAvg0.08950.09770.09360.09150.10930.08980.08260.08430.08950.0765
Min0.08070.08160.07350.08320.08780.08030.06810.06950.07460.0545
AccuracyAvg91.455490.44691.330491.214389.660791.732192.14391.741191.250092.6429
Max92.321491.96493.214391.964391.785793.392993.57193.214393.035794.8214
No. featuresAvg158.65098.650252.750148.400225.950159.550155.1580.95094.400120.650
Min139.00034.000204.000118.000212.000143.000131.0028.00038.00047.000
Parkinson FitnessAvg0.20330.18130.25120.22170.25410.19530.19380.16730.17030.1604
Min0.17540.16280.24290.17680.25000.15560.15490.15460.14890.1279
AccuracyAvg79.961281.81375.354378.070275.016680.761880.90283.154282.923483.9765
Max82.801883.59576.322882.547475.391284.789584.79584.412385.038687.1807
No. featuresAvg367.45090.550540.100355.000511.650365.650358.4037.45096.550130.100
Min331.0007.000402.000299.000184.000325.000332.008.00046.00016.000
ColonFitnessAvg0.08920.09830.10200.09130.10980.08980.09250.08210.09050.0775
Min0.07100.07950.08820.06840.09690.08030.07760.05010.06250.0481
AccuracyAvg91.488190.38190.535791.238189.607191.428691.14391.928691.071492.5000
Max93.333392.14391.904893.571490.714392.381092.61995.000093.809595.2381
No. featuresAvg993.050534.151651.50918.2501386.20988.950954.20431.900422.950644.300
Min963.00036.0001355.00636.000989.000939.000848.00117.000164.00080.000
SRBCTFitnessAvg0.00480.00610.00970.00640.02410.00470.00520.00060.00120.0040
Min0.00460.00100.00570.00250.01790.00420.00390.00020.00090.0003
AccuracyAvg100.00099.60499.715399.722298.2500100.00099.938100.000100.00099.8333
Max100.000100.00100.000100.00098.8889100.000100.00100.000100.000100.000
No. featuresAvg1102.00483.351597.20957.9001568.701077.801048.0132.450277.850551.850
Min1068.00138.001327.00566.000979.000972.0004.00057.000208.00077.000
LeukemiaFitnessAvg0.08440.09250.09370.08930.11050.08020.07680.07060.07440.0638
Min0.07390.07080.07660.07000.10070.05800.05600.05600.04380.0426
AccuracyAvg91.982190.9291.303691.348289.544692.401892.73293.017992.678693.9196
Max93.035793.03693.035793.392990.535794.642994.82194.464395.714396.2500
No. featuresAvg3552.301706.95421.203270.305003.653532.253451.61073.151385.952546.800
Min3496.0068.0004057.002251.004723.003451.003108.0315.000737.000536.000
Prostate TumorFitnessAvg0.10260.09970.10240.10470.12630.09970.10090.05610.08800.0534
Min0.09220.06780.08280.09020.11320.08140.08060.02890.07040.0199
AccuracyAvg90.140990.00090.486489.818287.954590.436490.30094.350091.240994.7773
Max91.181893.18292.272791.363689.272792.272792.36497.090993.000098.0000
No. featuresAvg5238.15786.258669.554655.007425.755247.405129.7206.2501342.501833.300
Min5157.0083.0006645.002420.007230.005138.004809.065.0001012.0082.000
Overall ResultsW|T|L0|0|100|0|100|0|100|0|100|0|101|0|90|0|101|0|90|0|108|0|2
Table 7. The Friedman test for the fitness obtained by each algorithm.
DatasetsBPSOACOBDEBBAFSWOABALOBDAQBHHOBASOBQANA
Pima5.739.703.655.188.904.332.856.855.901.93
HeartEw5.978.952.924.5710.004.822.206.307.252.00
Lymphography3.959.055.359.957.902.632.656.006.051.48
SPECT Heart4.359.004.856.9510.001.852.454.957.802.80
PenglungEW5.458.557.906.9510.004.352.952.904.851.10
Parkinson6.355.159.107.659.905.105.652.102.801.20
Colon4.558.058.905.9510.004.755.452.004.351.00
SRBCT6.855.208.855.659.956.305.851.002.303.05
Leukemia6.257.908.756.9010.005.003.052.003.751.40
Prostate Tumor6.805.656.907.8510.005.506.151.653.151.35
Average rank5.627.726.716.769.664.463.923.574.821.73
Overall rank69781043251
Publisher’s Note: MDPI stays neutral with regard to jurisdictional claims in published maps and institutional affiliations.

