
Investigating the Effectiveness of Government Public Health Systems against COVID-19 by Hybrid MCDM Approaches


Abstract
:1. Introduction
2. Literature Review
2.1. Public Health System Preparedness
2.2. Evaluation Approaches
3. Data
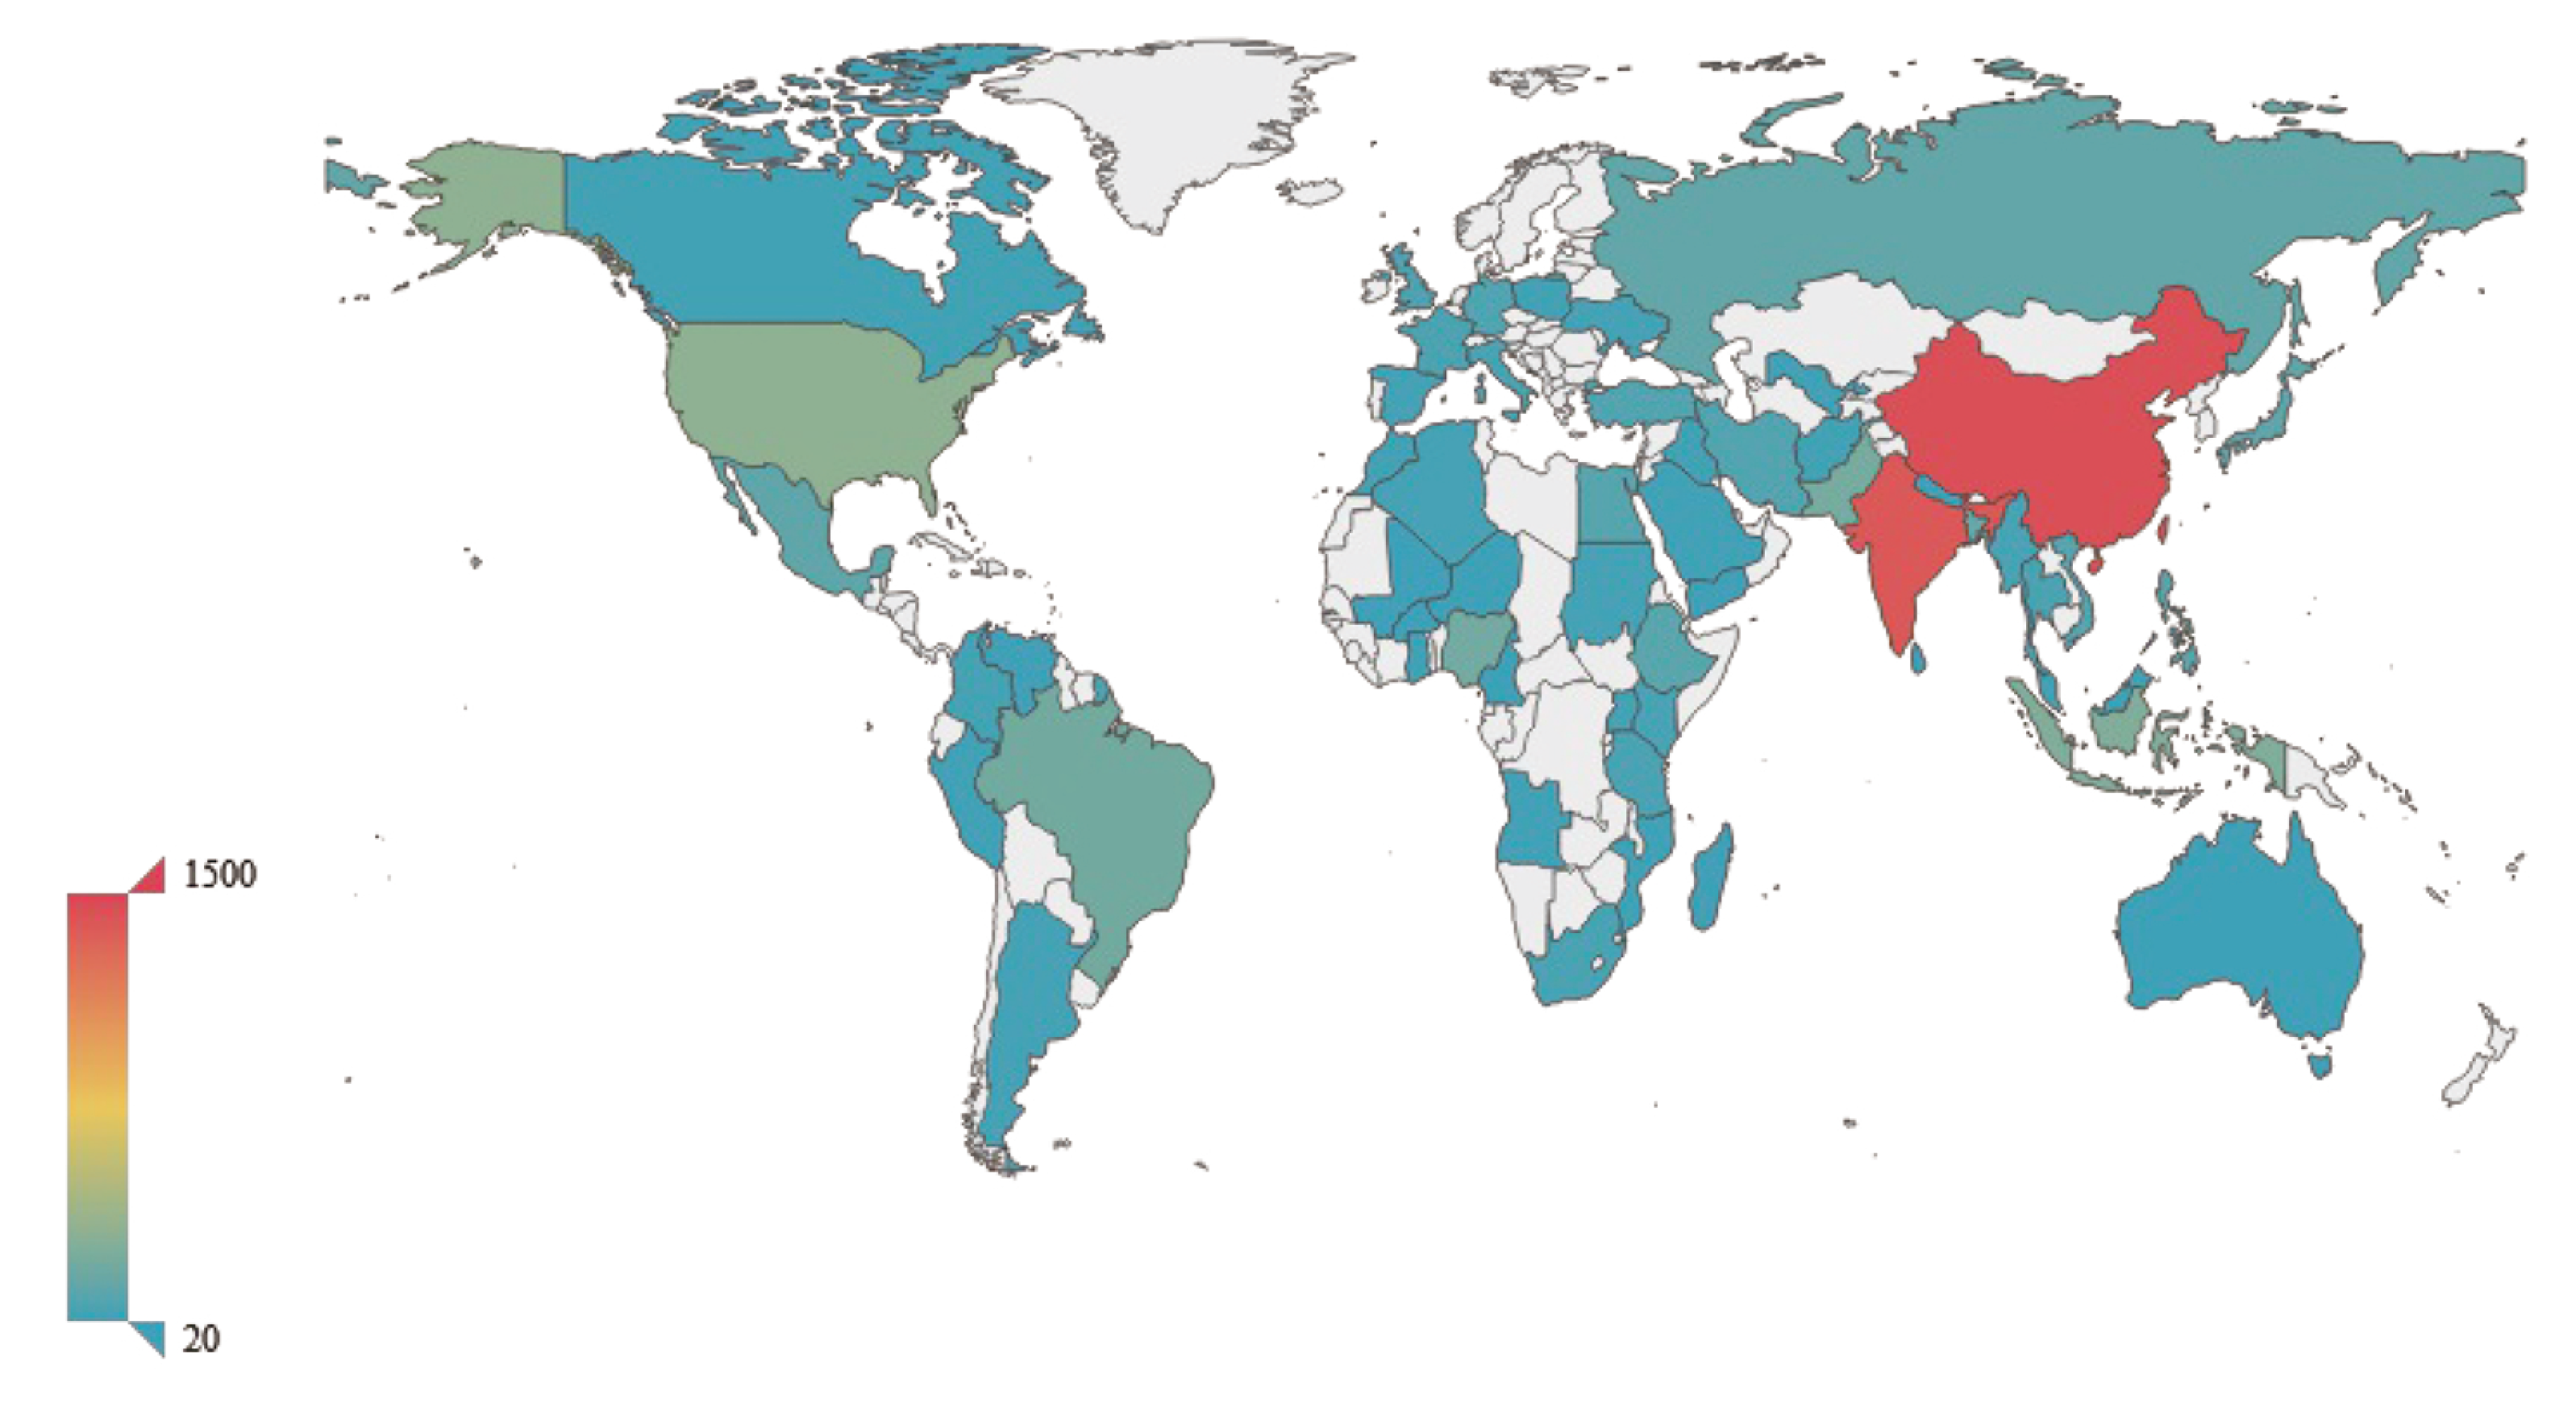
3.1. Data Collection
3.2. Data Preprocessing
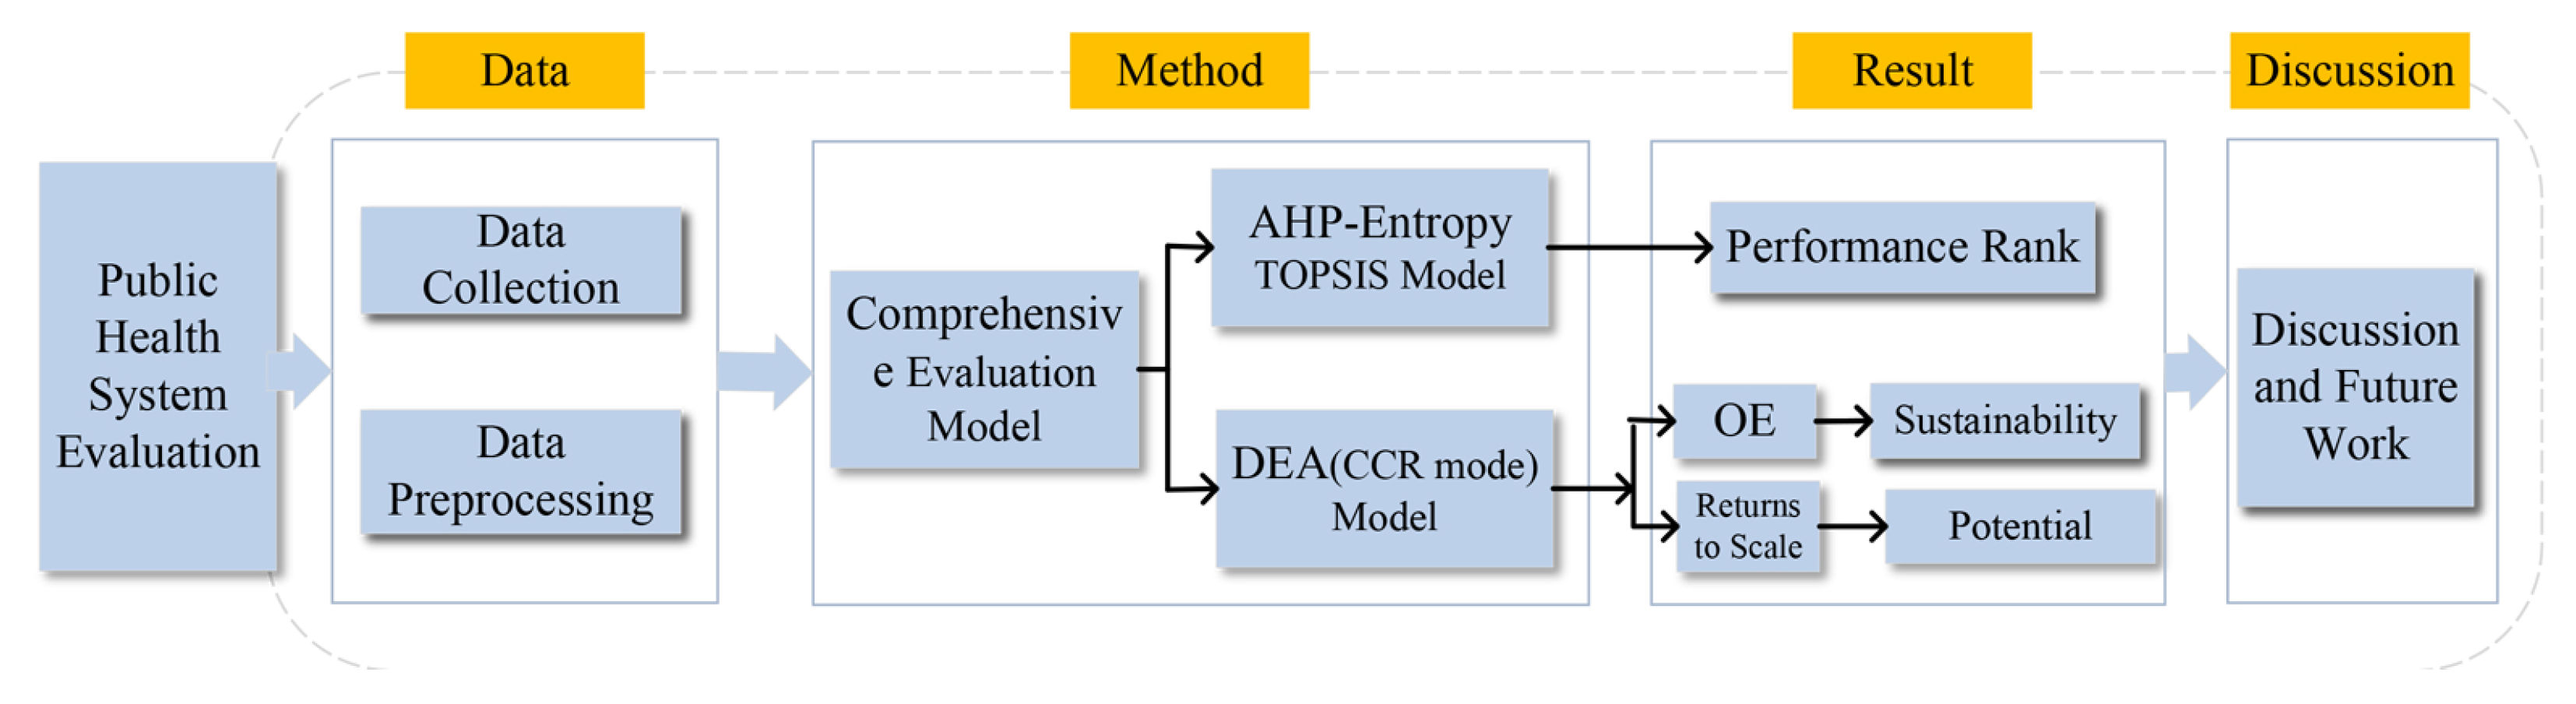
4. Comprehensive Evaluation Models
4.1. Assessment of the Performance Based on AHP-Entropy TOPSIS Evaluation Model
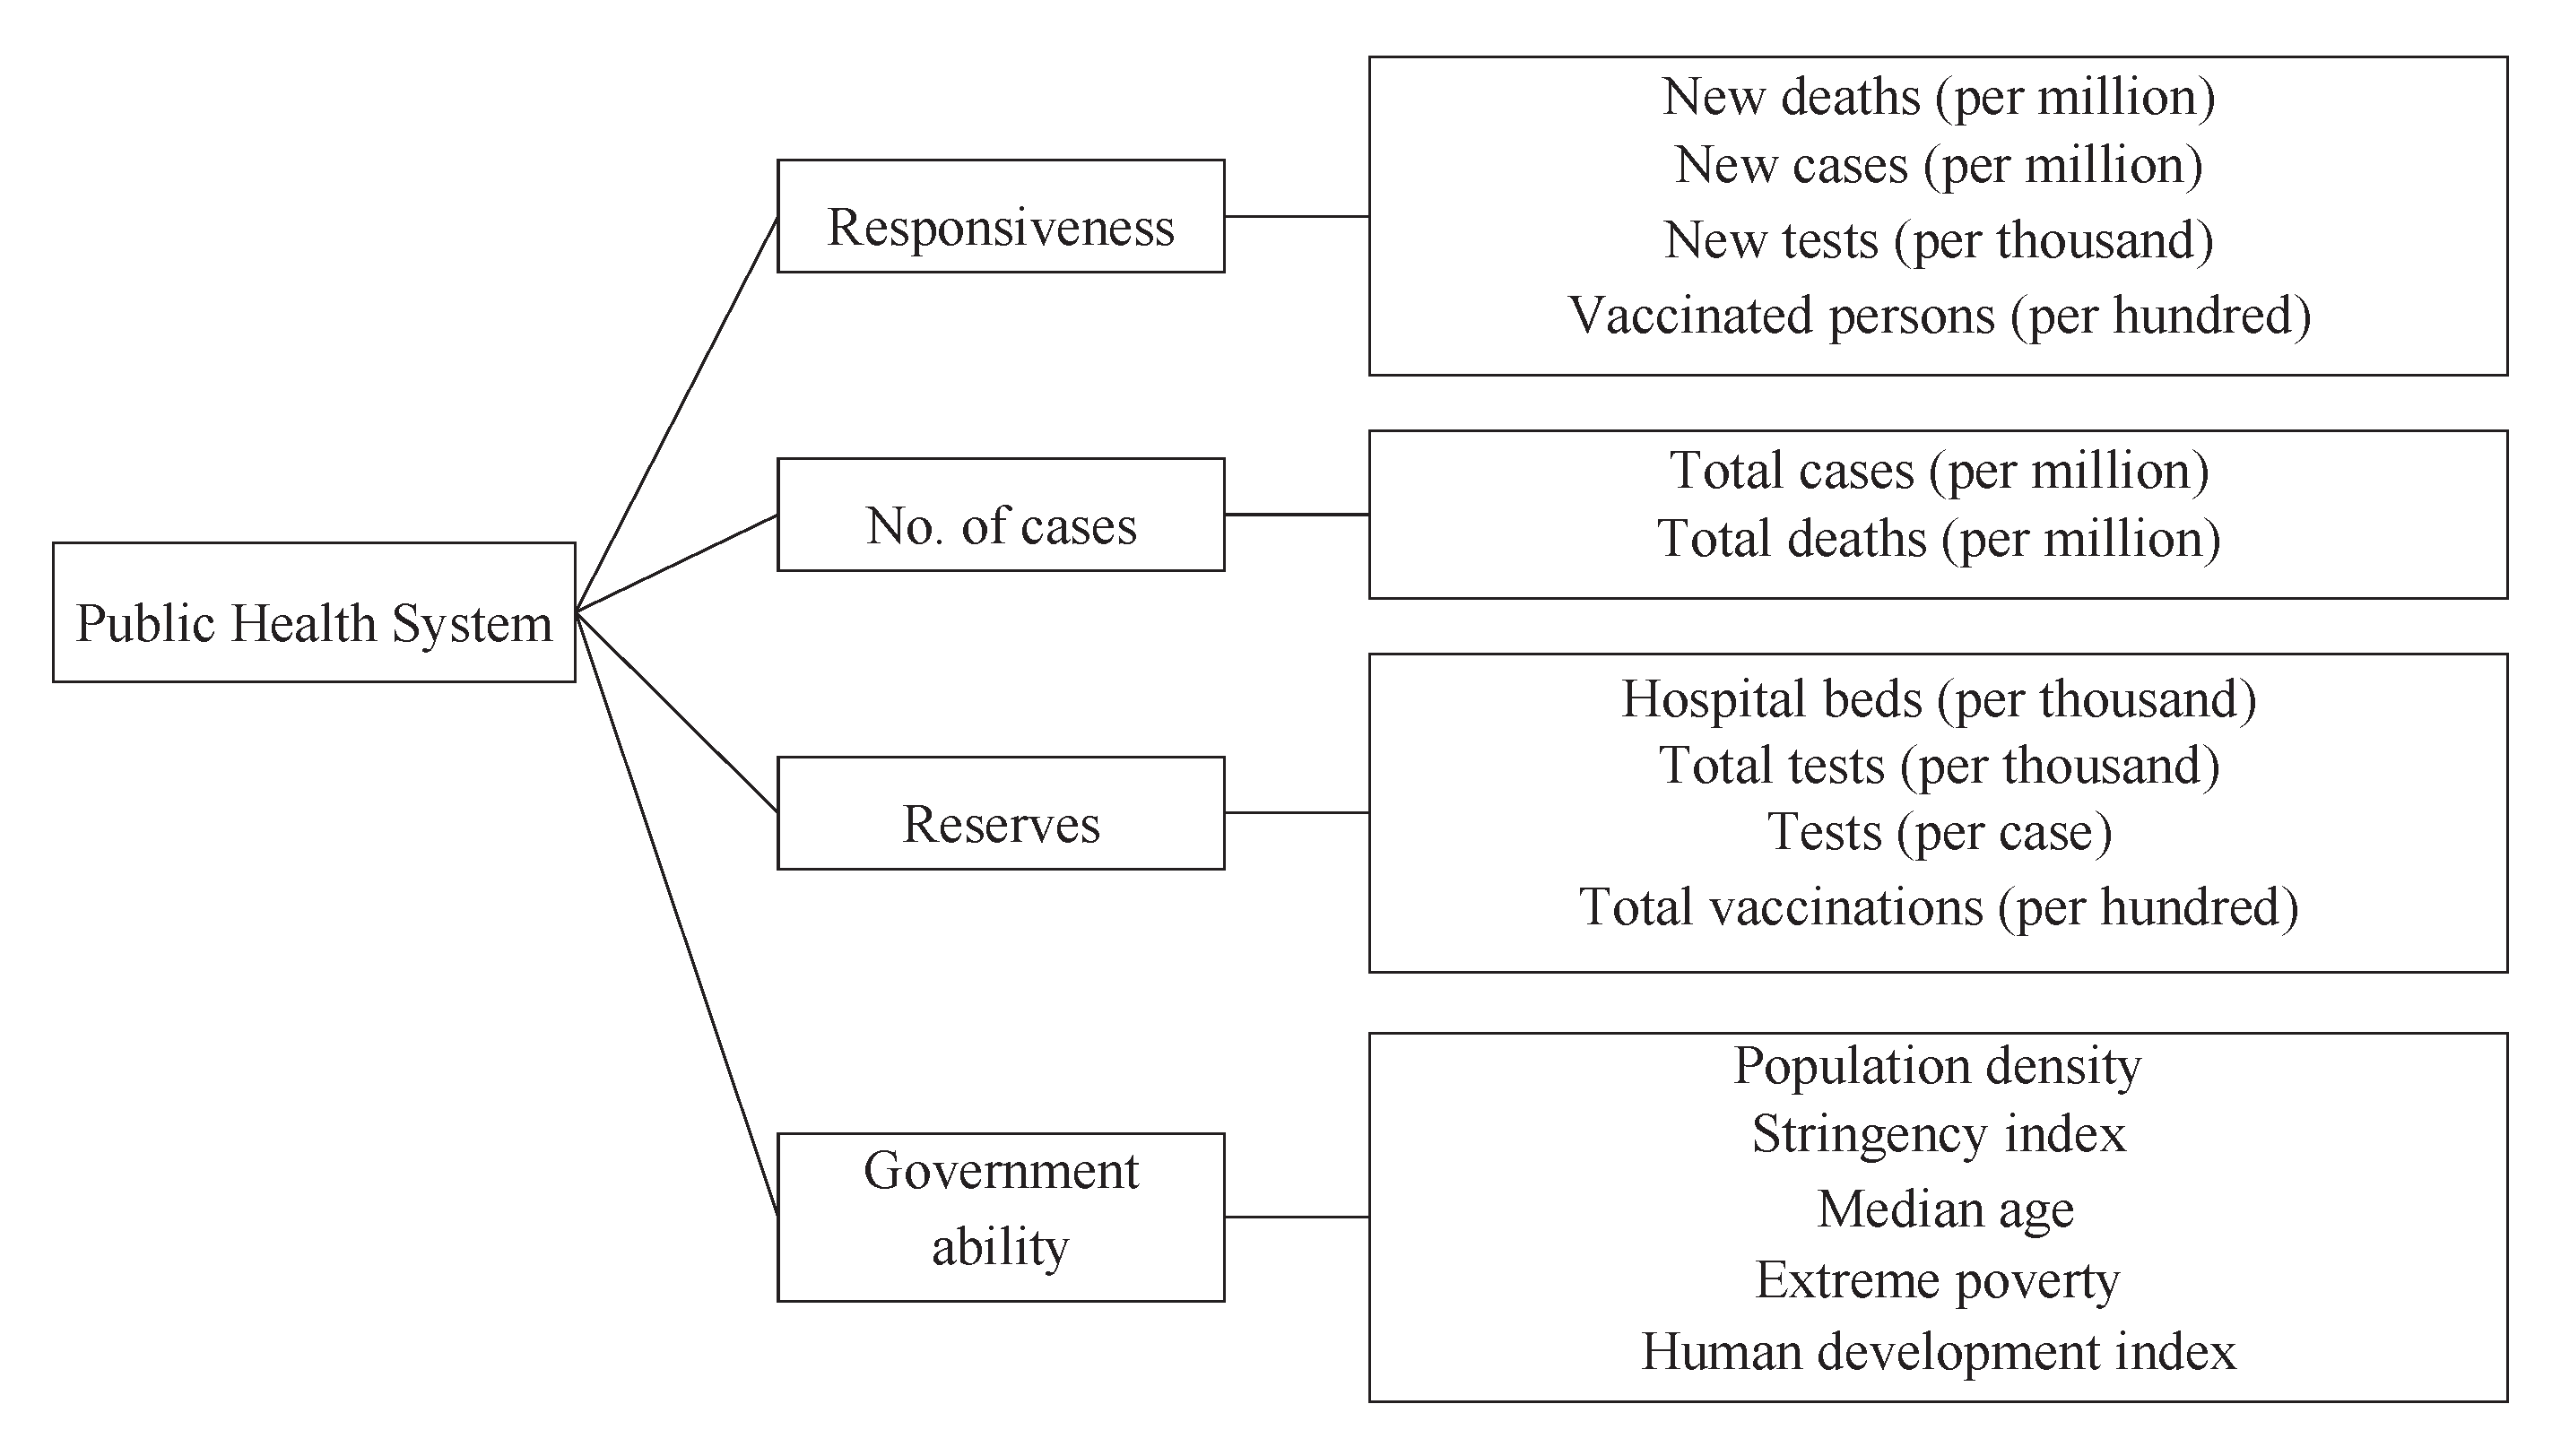
4.1.1. Decision-Making Criteria
- (1)
- Responsiveness: The speed of response refers to how quickly the countries’ public health systems respond to a significant public health emergency, such as this outbreak of COVID-19. It is one of the critical evaluation factors for measuring the performance, sustainability, and potential of the public health system of a country. The faster a country responds, the stronger the public health system is. New deaths (per million), new cases (per million), new tests (per thousand), and vaccinated persons (per hundred) are selected as secondary indicators. For example, if the number of new deaths is low, the country responds quickly to COVID-19.
- (2)
- No. of cases: The number of cases refers to the number of people infected in each country during the epidemic. The total cases (per million) and total deaths (per million) are selected as secondary indicators. The lower the number of cases and deaths, the better the country controls the epidemic and the stronger the public health system.
- (3)
- Reserves: The reserves indicate the amount of relevant medical supplies that countries store in their daily production life. It is related to a country’s capacity to produce supplies. It is also an essential measure of the strength of a public health system. According to the definition of the factor, we select hospital beds (per thousand), total tests (per thousand), tests (per case), and total vaccinations (per hundred) as the detailed indicator of the number of material reserves.
- (4)
- Government ability: Government ability refers to the long-term human development indicators, such as extreme poverty and population density. Five indicators are used to characterize the factor: population density, stringency index, median age, extreme poverty, and human development index [63].
4.1.2. AHP-Based Weight Determination
- Step 1:
- Build the comparison matrixFactors and indicators are divided into different layers. The first layer is sorted by the importance subjectively: Reserves ≥ Government ability ≥ Responsiveness ≥ No. of cases. The comparison matrix is obtained:where represents the factors Responsiveness, No. of cases, Reserves, and Government ability. is the relative importance of compared with .
- Step 2:
- Consistency checkBased on the established comparison matrix, we calculate the largest eigenvalue and the corresponding eigenvector v. In this case, the random inconsistency is 0.9 when the order of comparison matrix [66]. The consistency index and the consistency ratio are determined by the following calculation procedure:andand , which is less than 0.1, implying the comparison matrix is consistent [67].
- Step 3:
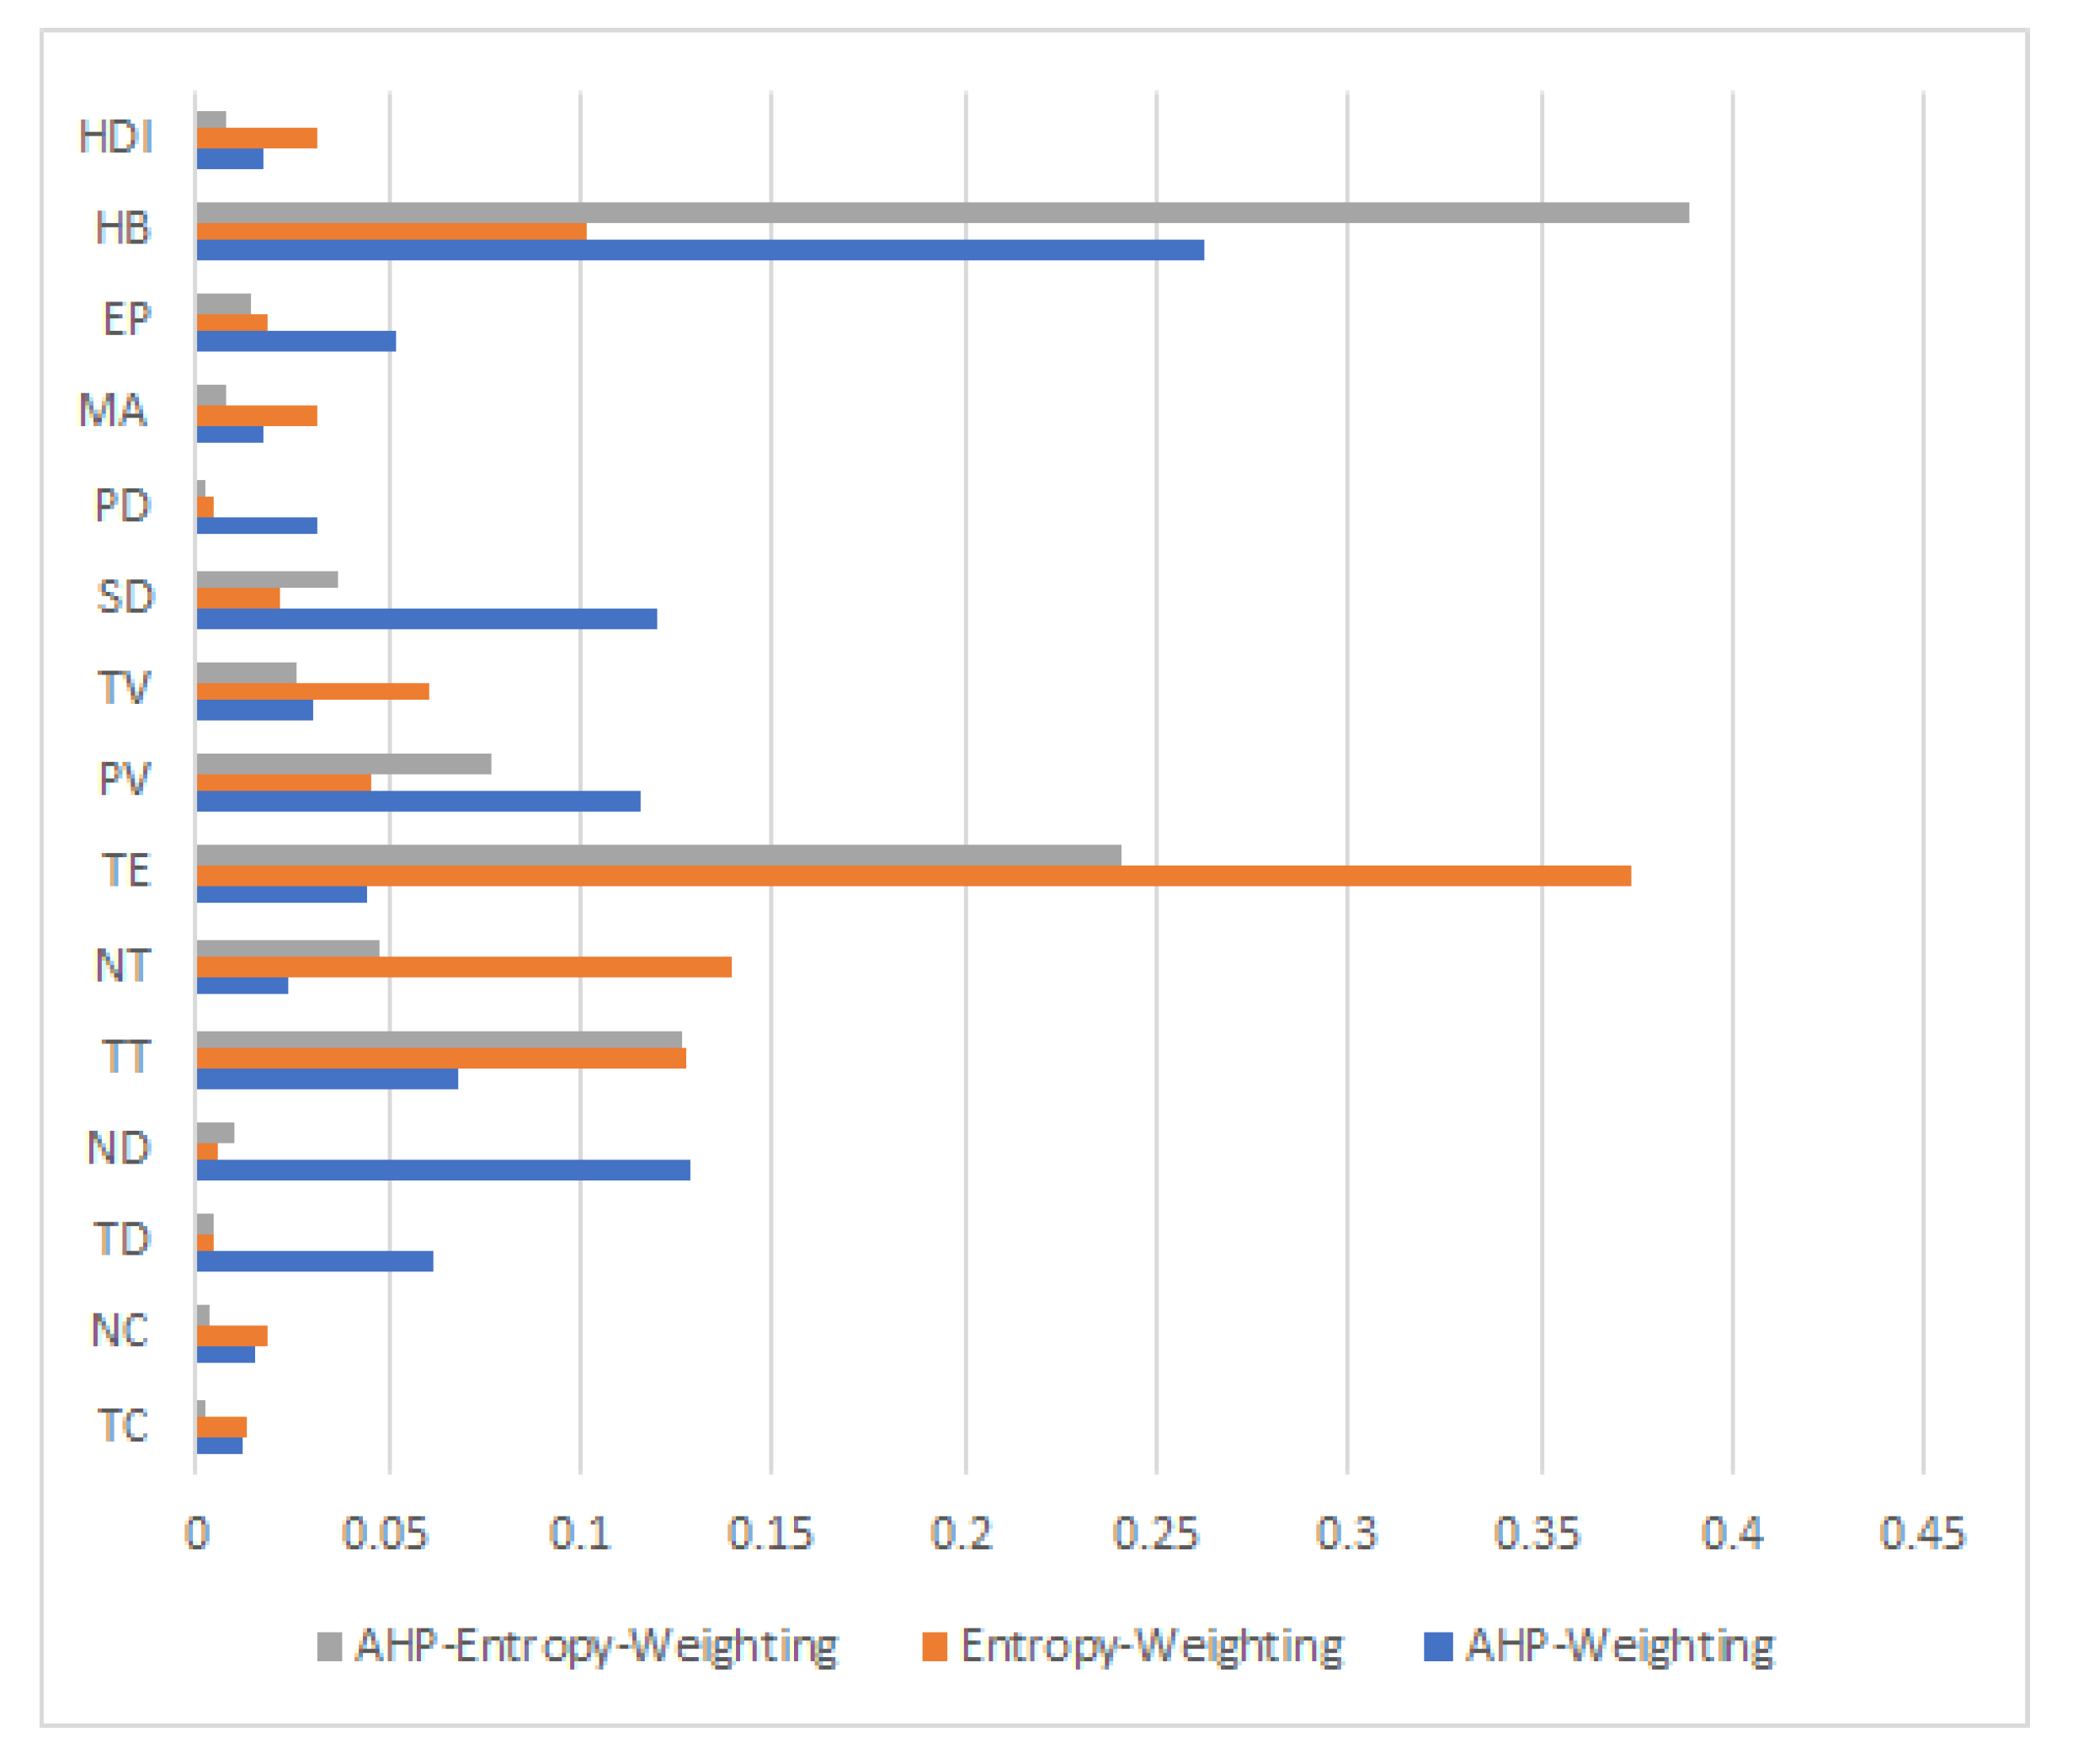
- Determine the weights of indicatorsThe eigenvector v after normalization is the weight vector corresponding to . The weight of Responsiveness is 0.1982; the weight of No. of cases is 0.0736; the weight of Reserves is 0.4901; the weight of Government ability is 0.2381. Similarly, all the weights of each indicator are determined under different factors (Figure 4).
4.1.3. AHP-Entropy Weight Determination
- Step 1:
- Matrix normalization.
- Step 2:
- Determination of the ratio of each indicator.The ratio of the indicator j in country i is the varying size of the indicator as follows:
- Step 3:
- Entropy weight determinationThe information entropy of the ratio of each indicatorWhen , is defined as 0.
- Step 4:
- Entropy weightsCalculate the weights by the entropy weight method as
- Step 5:
- AHP–Entropy combined weightingTogether with the subjective weight by AHP, the comprehensive AHP–Entropy weight of each indicator j is calculated based on the following equation:
4.1.4. AHP-Entropy TOPSIS Evaluation Modeling
- Step 1:
- Matrix normalizationAfter normalization, the original data matrix X (the data of indicators in 4.3.2) is denoted as matrix Z.
- Step 2:
- Optimal and worst solution calculationThe ideal optimal solution takes the optimal value of the evaluation index in the system, denoted as . On the contrary, the ideal worst solution is defined as .
- Step 3:
- Distance calculationWith the weight of each indicator ⋯ determined by the previous subsection, the ideal optimal solution for the distance of the indicator vector of the country ⋯ and the opposite ideal worst solution are given by
- Step 4:
- Performance score determination. The comprehensive score of the country i performance isis normalized to get the final relative score of the public health system of each country:
4.2. Assessing Sustainability and Potential Based on Data Envelopment Analysis (DEA)
4.2.1. DEA Modeling
- Step 1:
- Decision-making unit establishmentThere are 60 countries as a decision-making unit. Each country has 11 kinds of inputs and 4 kinds of outputs. are denoted as the input indicator j of the country i. is the output j of the country i. represent the input weight vector. represent the output weight vector.
- Step 2:
- DEA efficiency evaluation model (CCR mode) establishmentThe benefit evaluation index of the decision-making unit for country i is denoted as :The idea of the CCR mode linear programming model is to express the input and output of decision-making unit i as a linear combination of other units. We introduce , a very small number, and the slack variable , . The CCR mode linear programming model is:
- Step 3:
- Solution by the hierarchical sequence method. Object 1 of the solution is to find the minimum value of . Object 2 is achieved under the condition that is known.
4.2.2. DEA Output Analysis
4.3. Composite Score Determination
5. Evaluation Results
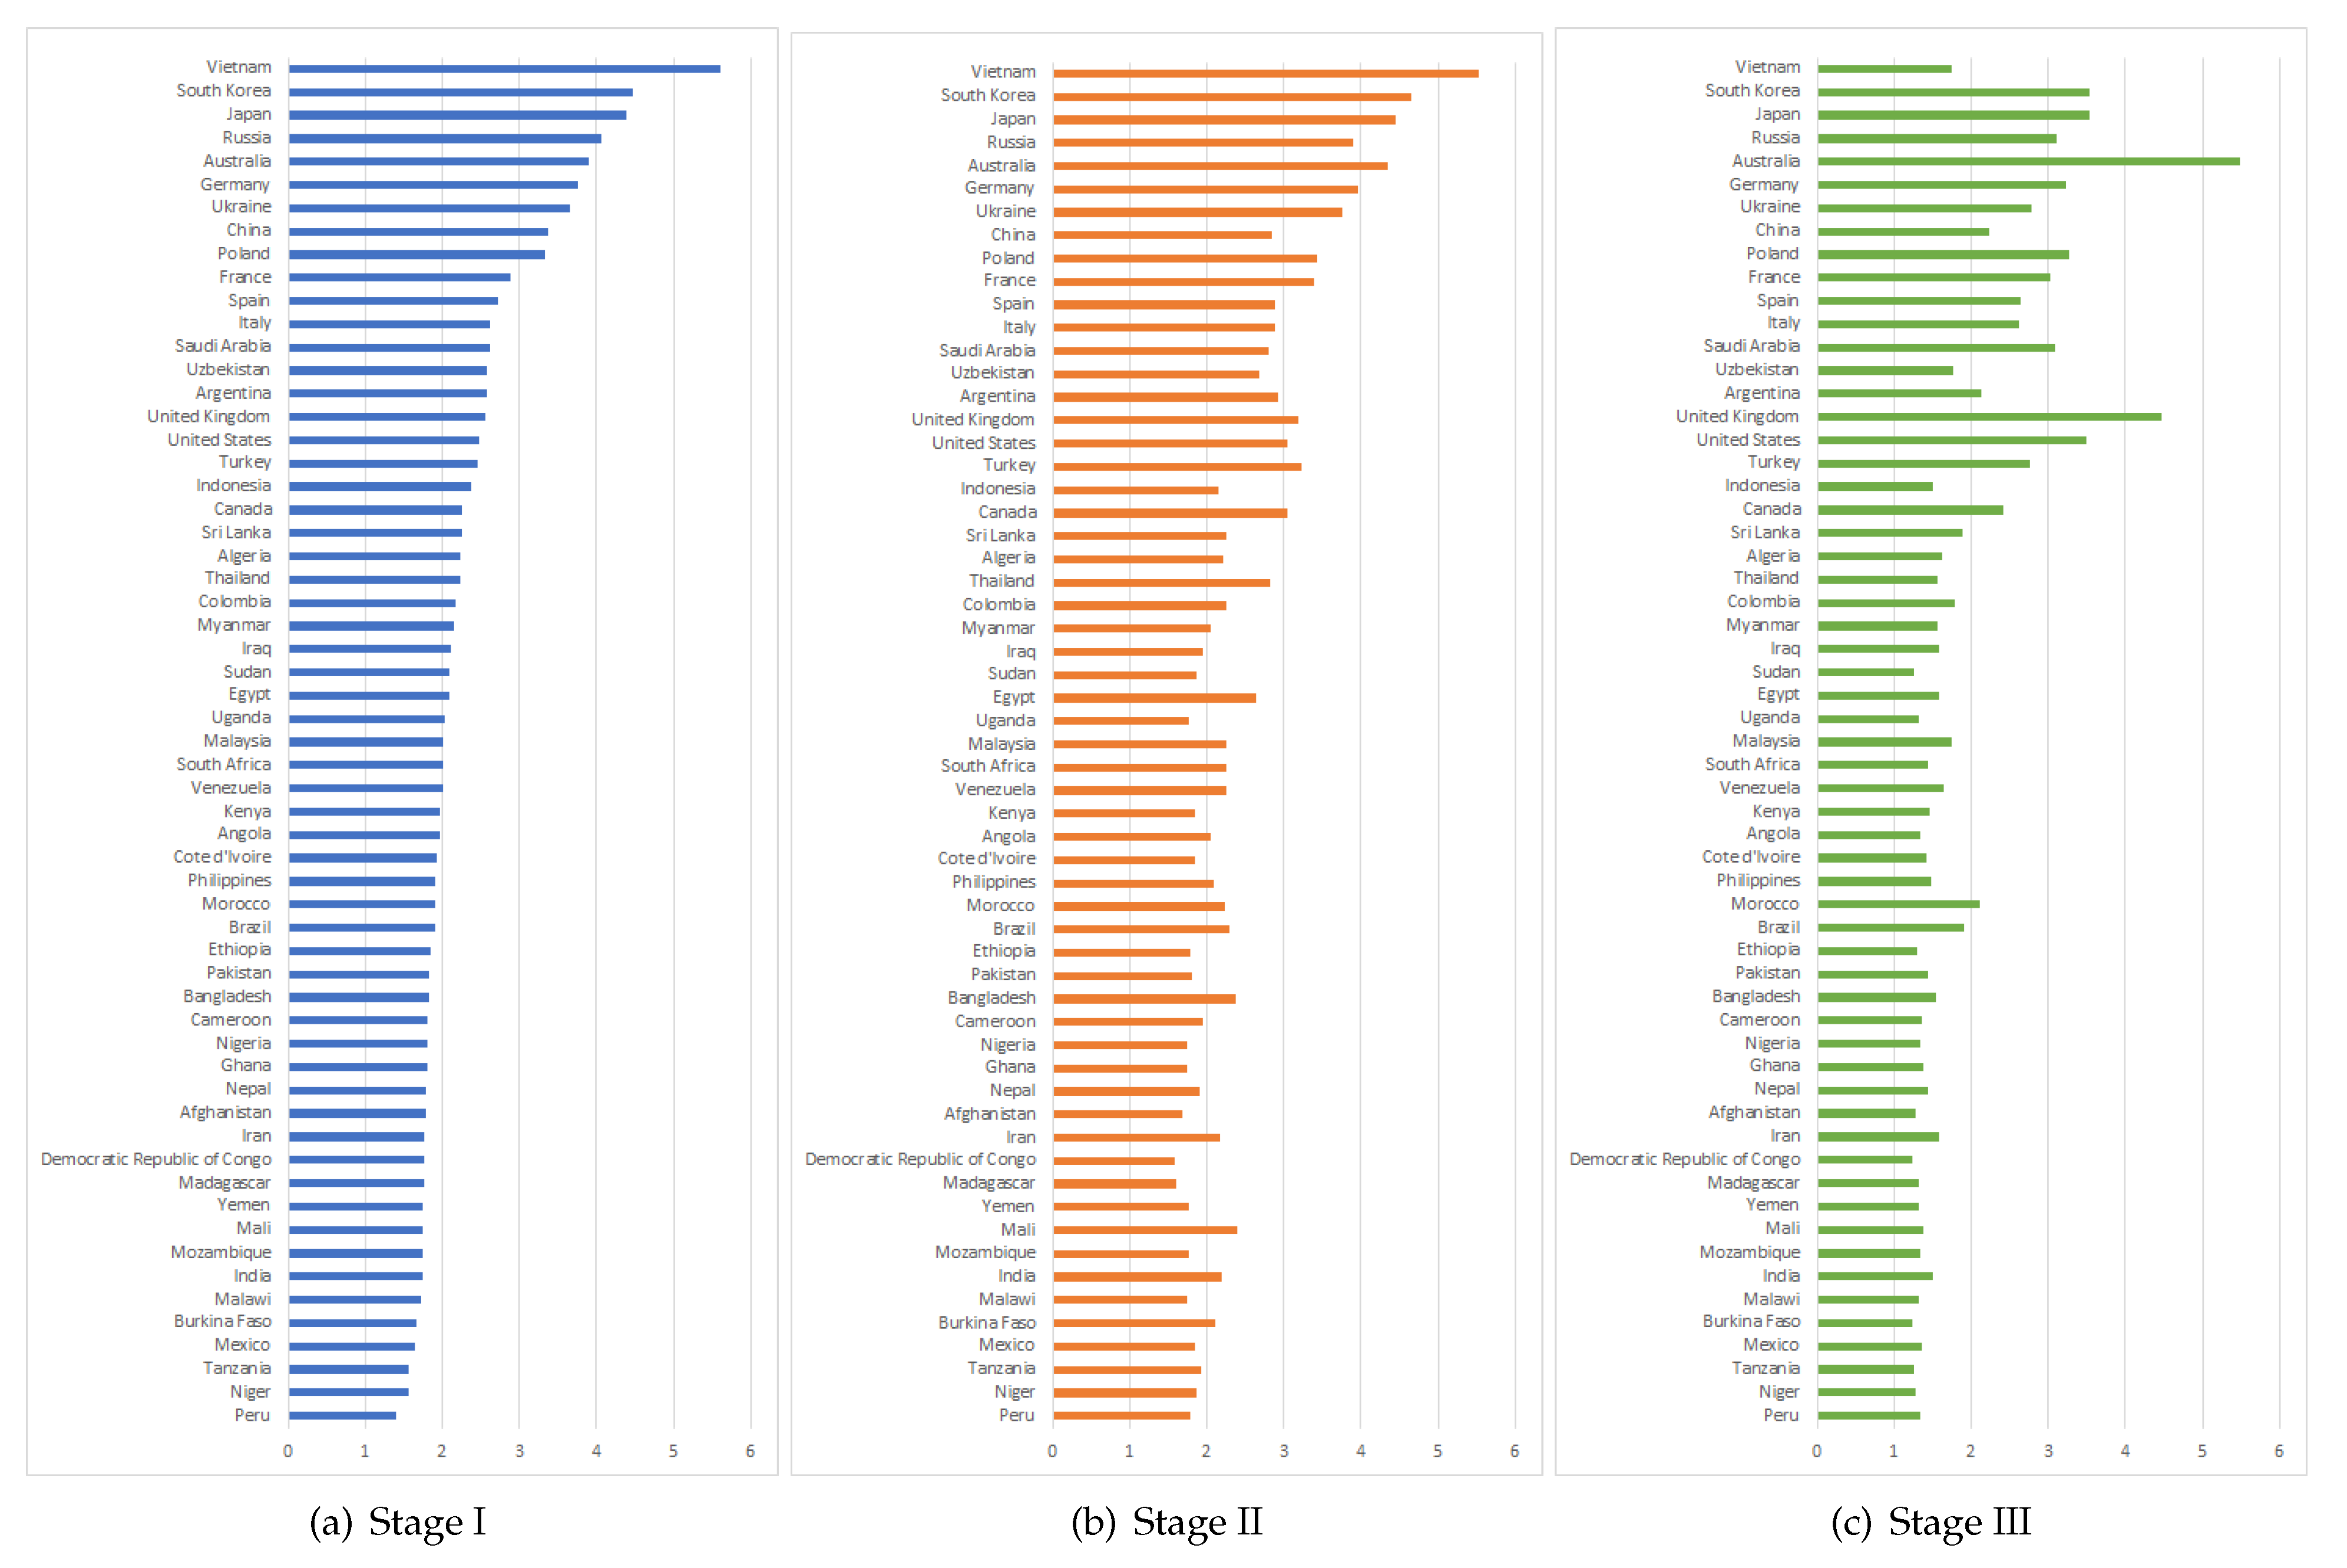
5.1. Performance Ranking
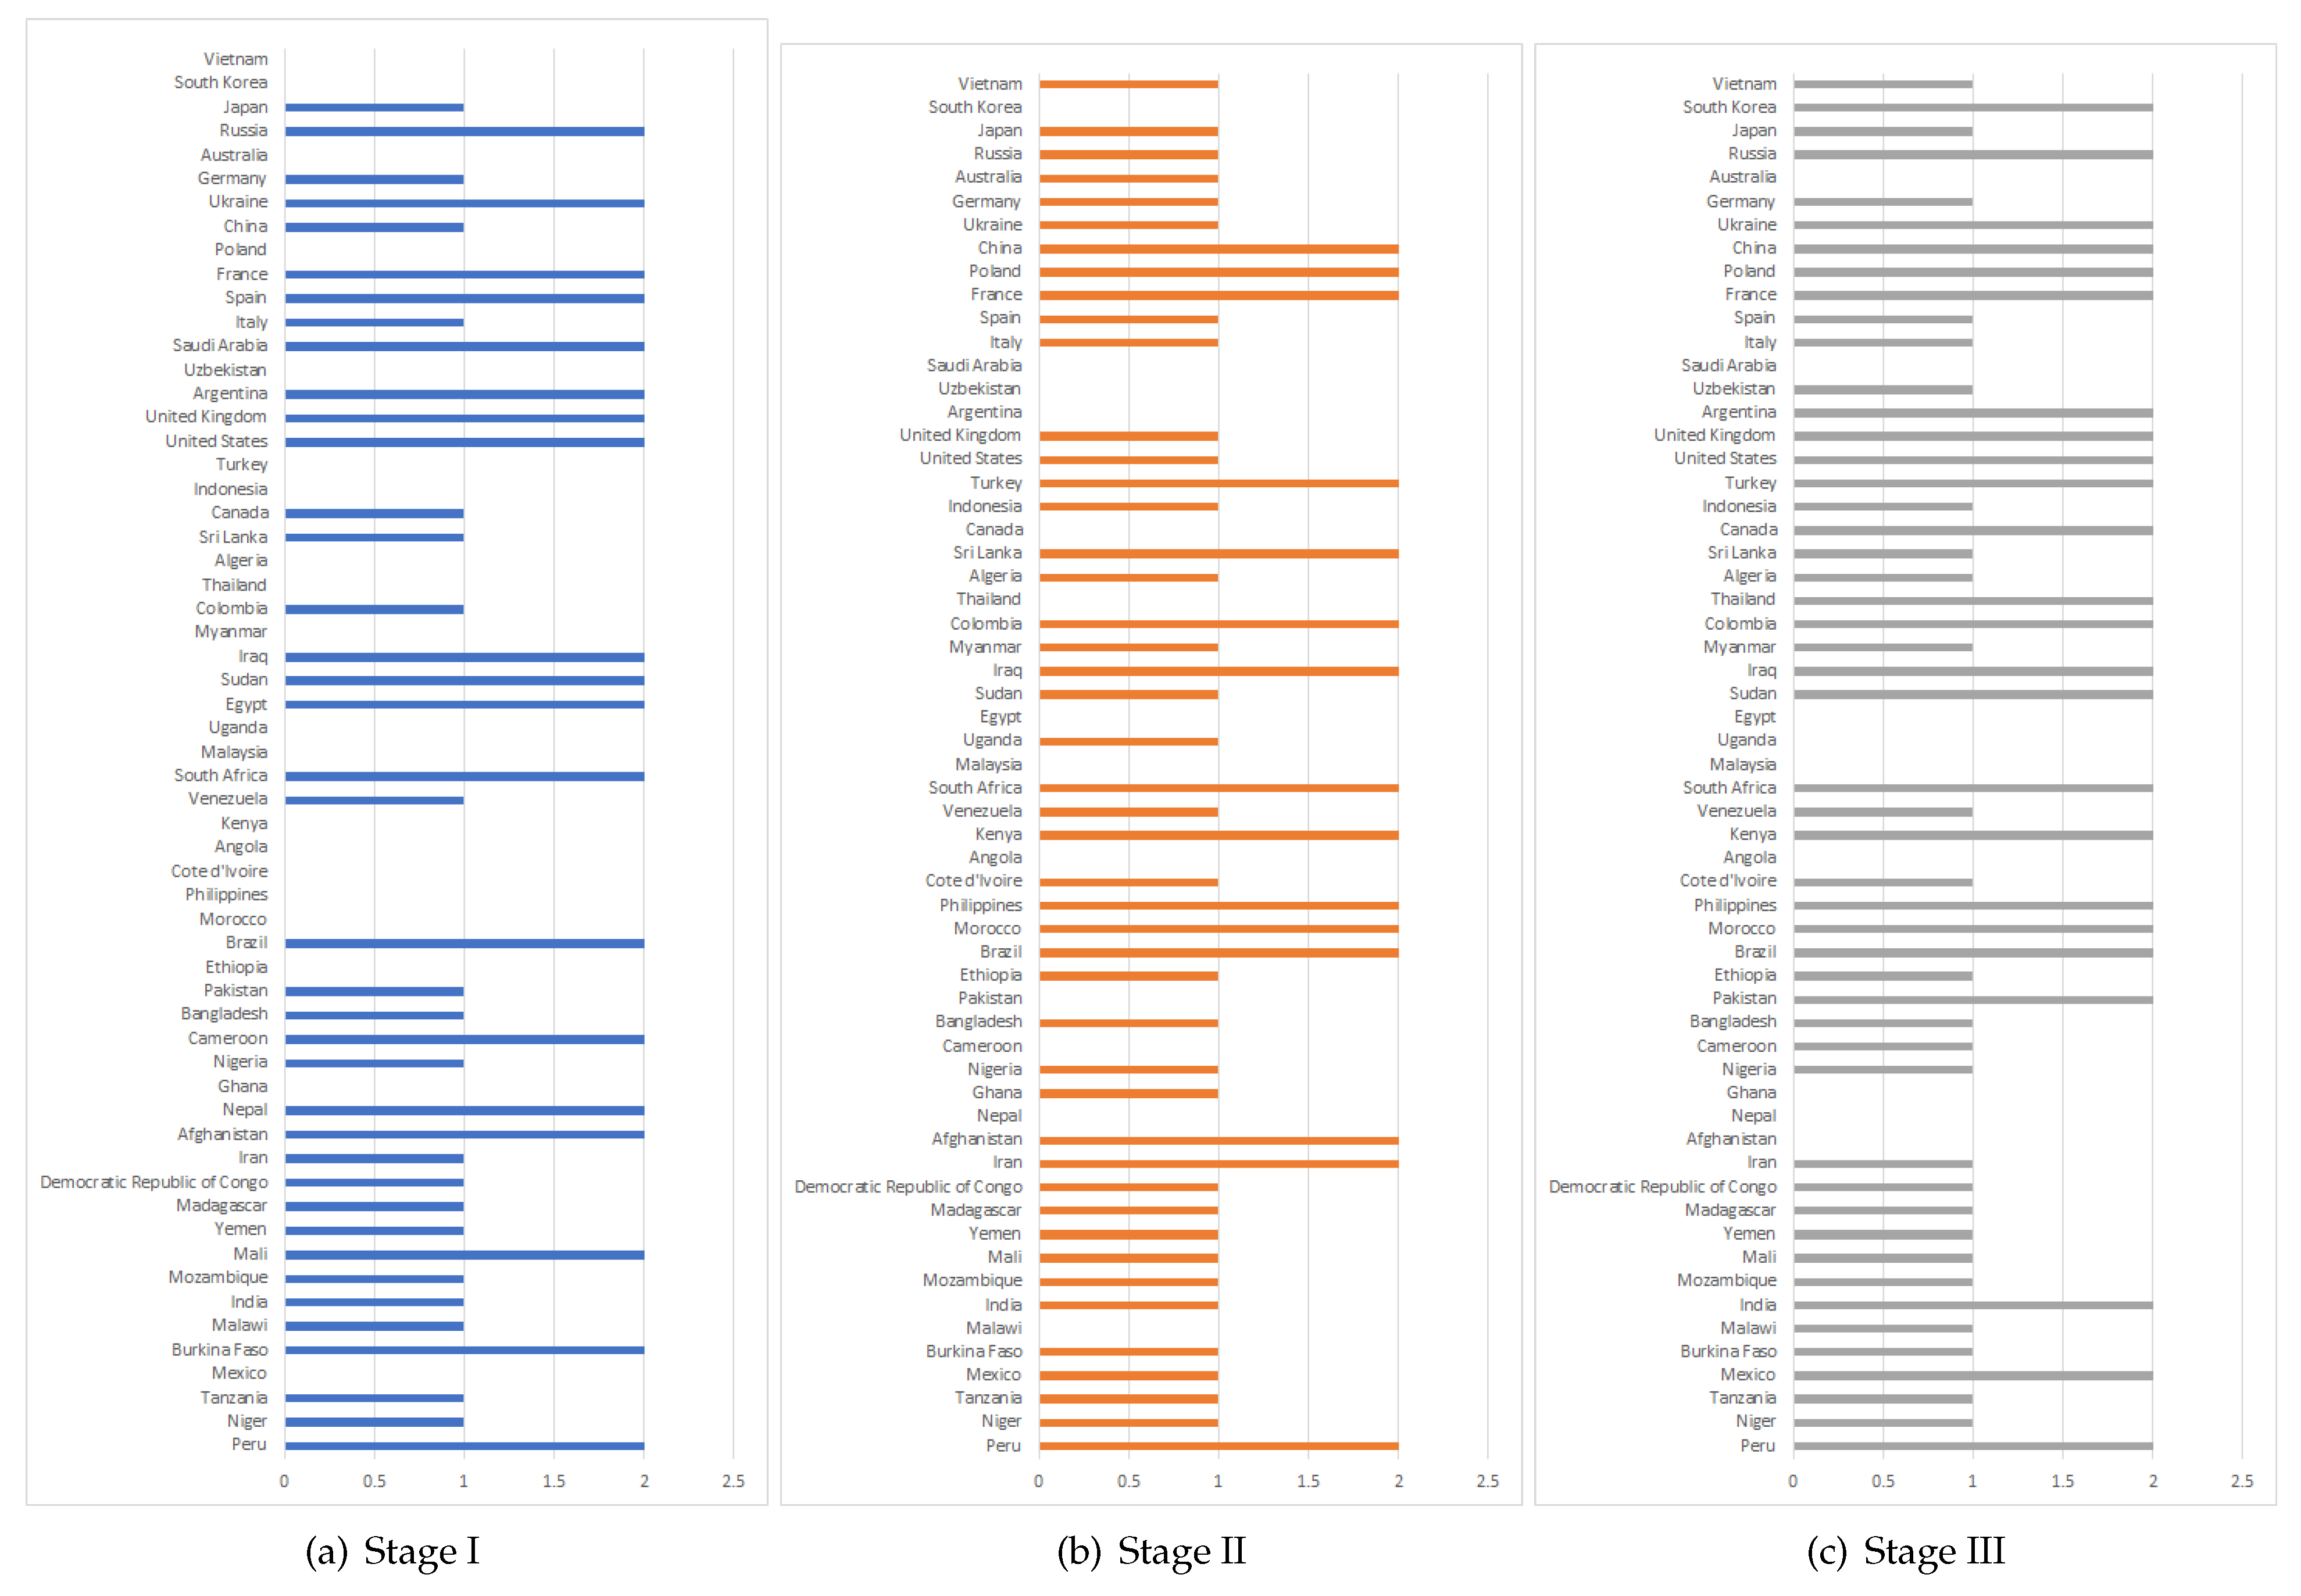
5.2. Sustainability Score
5.3. Potential of the Public Health System
5.4. Composite Score
6. Discussion
7. Conclusions
Author Contributions
Funding
Institutional Review Board Statement
Informed Consent Statement
Data Availability Statement
Conflicts of Interest
Appendix A

| Factor | Indicator | Symbol | Impact | Description |
|---|---|---|---|---|
| Responsiveness | NC | N | New confirmed cases of COVID-19 per 1,000,000 people | |
| ND | N | New deaths attributed to COVID-19 per 1,000,000 people | ||
| PV | P | Total number of people who received at least one vaccine dose per 100 people in the total population | ||
| NT | P | New tests for COVID-19 per 1,000 people | ||
| No. of cases | TC | N | Total confirmed cases of COVID-19 per 1,000,000 people. Counts can include probable cases, where reported | |
| TD | N | Total deaths attributed to COVID-19 per 1,000,000 people. Counts can include probable deaths, where reported | ||
| Reserves | TE | P | Tests conducted per new confirmed case of COVID-19, given as a rolling 7-day average | |
| TT | P | Total tests for COVID-19 per 1,000 people | ||
| HB | P | Hospital beds per 1,000 people | ||
| TV | P | Total number of COVID-19 vaccination doses administered per 100 people in the total population | ||
| Government abilities | SI | P | Government Response Stringency Index: composite measure based on 9 response indicators including school closures, workplace closures and travel bans | |
| HDI | P | A composite index measuring average achievement in three basic dimensions of human development—a long and healthy life, knowledge and a decent standard of living. | ||
| MA | N | Median age of the population, UN projection for 2020 | ||
| EP | N | Share of the population living in extreme poverty, most recent year available since 2010 | ||
| PD | N | Number of people divided by land area, measured in square kilometers, most recent year available |
References
- Zhu, N.; Zhang, D.Y.; Wang, W.L.; Li, X.W.; Yang, B.; Song, J.D.; Zhao, X.; Huang, B.Y.; Shi, W.F.; Lu, R.J.; et al. A Novel Coronavirus from Patients with Pneumonia in China, 2019. N. Engl. J. Med. 2020, 382, 727–733. [Google Scholar] [CrossRef] [PubMed]
- Ahmed, Q.A.; Memish, Z.A. The cancellation of mass gatherings (MGs)? Decision making in the time of COVID-19. Travel Med. Infect. Dis. 2020, 34, 101631. [Google Scholar] [CrossRef] [PubMed]
- Chinazzi, M.; Davis, J.T.; Ajelli, M.; Gioannini, C.; Litvinova, M.; Merler, S.; Piontti, A.P.Y.; Mu, K.P.; Rossi, L.; Sun, K.Y.; et al. The effect of travel restrictions on the spread of the 2019 novel coronavirus (COVID-19) outbreak. Science 2020, 368, 395. [Google Scholar] [CrossRef] [Green Version]
- Lau, H.; Khosrawipour, V.; Kocbach, P.; Mikolajczyk, A.; Ichii, H.; Zacharski, M.; Bania, J.; Khosrawipour, T. The association between international and domestic air traffic and the coronavirus (COVID-19) outbreak. J. Microbiol. Immunol. Infect. 2020, 53, 467–472. [Google Scholar] [CrossRef] [PubMed]
- Munzert, S.; Selb, P.; Gohdes, A.; Stoetzer, L.F.; Lowe, W. Tracking and promoting the usage of a COVID-19 contact tracing app. Nat. Hum. Behav. 2021, 5, 247. [Google Scholar] [CrossRef]
- Chakraborty, I.; Maity, P. COVID-19 outbreak: Migration, effects on society, global environment and prevention. Sci. Total Environ. 2020, 728, 138882. [Google Scholar] [CrossRef]
- Zhong, B.; Huang, Y.; Liu, Q. Mental health toll from the coronavirus: Social media usage reveals Wuhan residents’ depression and secondary trauma in the COVID-19 outbreak. Comput. Hum. Behav. 2021, 114, 106524. [Google Scholar] [CrossRef]
- Fisher, D.; Teo, Y.Y.; Nabarro, D. Assessing national performance in response to COVID-19. Lancet 2020, 396, 653–655. [Google Scholar] [CrossRef]
- Chiossi, S.; Tsolova, S.; Ciotti, M. Assessing public health emergency preparedness: A scoping review on recent tools and methods. Int. J. Disaster Risk Reduct. 2021, 56, 102104. [Google Scholar] [CrossRef]
- Pan, J.; Chen, Z.; He, Y.; Liu, T.; Cheng, X.; Xiao, J.; Feng, H. Why controlling the asymptomatic infection is important: A modelling study with stability and sensitivity analysis. Fractal Fract. 2022, 6, 197. [Google Scholar] [CrossRef]
- Oppenheim, B.; Gallivan, M.; Madhav, N.K.; Brown, N.; Serhiyenko, V.; Wolfe, N.D.; Ayscue, P. Assessing global preparedness for the next pandemic: Development and application of an Epidemic Preparedness Index. BMJ Glob. Health 2019, 4, 1157. [Google Scholar] [CrossRef] [PubMed] [Green Version]
- Johns Hopkins Center for Health Security, T.E.I.U. Nuclear Threat Initiative, Global Health Security Index Report; Northeast Technical Institute: Houston, MA, USA, 2019. [Google Scholar]
- Baum, F.; Freeman, T.; Musolino, C.; Abramovitz, M.; De Ceukelaire, W.; Flavel, J.; Friel, S.; Giugliani, C.; Howden-Chapman, P.; Huong, N.T. Explaining covid-19 performance: What factors might predict national responses? BMJ 2021, 372, n91. [Google Scholar] [CrossRef] [PubMed]
- Dogan, M.I.; Ozsoy, V.S.; Orkcu, H.H. Performance management of OECD countries on Covid-19 pandemic: A criticism using data envelopment analysis models. J. Facil. Manag. 2021, 19, 4. [Google Scholar] [CrossRef]
- Khorram-Manesh, A.; Carlström, E.; Hertelendy, A.J.; Goniewicz, K.; Casady, C.B.; Burkle, F.M. Does the prosperity of a country play a role in COVID-19 outcomes? Disaster Medicine and Public Health Preparedness; Cambridge University Press: Cambridge, MA, USA, 2022; Volume 16, pp. 177–186. [Google Scholar]
- Linde, S.; Egede, L.E. Retrospective observational study of the robustness of provider network structures to the systemic shock of COVID-19: A county level analysis of COVID-19 outcomes. BMJ Open 2022, 12, e059420. [Google Scholar] [CrossRef]
- Pan, J.; Sun, S.; He, Y.; Ren, S.; Li, Q.; Chen, Z.; Feng, H. Dynamic Behavior Investigation of a Novel Epidemic Model Based on COVID-19 Risk Area Categorization. Fractal Fract. 2022, 6, 410. [Google Scholar] [CrossRef]
- Lai, S.; Ruktanonchai, N.W.; Zhou, L.; Prosper, O.; Luo, W.; Floyd, J.R.; Wesolowski, A.; Santillana, M.; Zhang, C.; Du, X. Effect of non-pharmaceutical interventions to contain COVID-19 in China. Nature 2020, 585, 410–413. [Google Scholar] [CrossRef]
- Davies, N.G.; Kucharski, A.J.; Eggo, R.M.; Gimma, A.; Edmunds, W.J.; Jombart, T.; O’Reilly, K.; Endo, A.; Hellewell, J.; Nightingale, E.S. Effects of non-pharmaceutical interventions on COVID-19 cases, deaths, and demand for hospital services in the UK: A modelling study. Lancet Publ. Health 2020, 5, e375–e385. [Google Scholar] [CrossRef]
- Dehning, J.; Zierenberg, J.; Spitzner, F.P.; Wibral, M.; Neto, J.P.; Wilczek, M.; Priesemann, V. Inferring change points in the spread of COVID-19 reveals the effectiveness of interventions. Science 2020, 369, eabb9789. [Google Scholar] [CrossRef]
- Gatto, M.; Bertuzzo, E.; Mari, L.; Miccoli, S.; Carraro, L.; Casagrandi, R.; Rinaldo, A. Spread and dynamics of the COVID-19 epidemic in Italy: Effects of emergency containment measures. Proc. Natl. Acad. Sci. USA 2020, 117, 10484–10491. [Google Scholar] [CrossRef] [Green Version]
- Koo, J.R.; Cook, A.R.; Park, M.; Sun, Y.; Sun, H.; Lim, J.T.; Tam, C.; Dickens, B.L. Interventions to mitigate early spread of SARS-CoV-2 in Singapore: A modelling study. Lancet Infect. Dis. 2020, 20, 678–688. [Google Scholar] [CrossRef] [Green Version]
- Nguyen, P.H.; Tsai, J.F.; Dang, T.T.; Lin, M.H.; Pham, H.A.; Nguyen, K.A. A hybrid spherical fuzzy MCDM approach to prioritize governmental intervention strategies against the COVID-19 pandemic: A case study from Vietnam. Mathematics 2021, 9, 2626. [Google Scholar] [CrossRef]
- Banholzer, N.; Van Weenen, E.; Lison, A.; Cenedese, A.; Seeliger, A.; Kratzwald, B.; Tschernutter, D.; Salles, J.P.; Bottrighi, P.; Lehtinen, S. Estimating the effects of non-pharmaceutical interventions on the number of new infections with COVID-19 during the first epidemic wave. PLoS ONE 2021, 16, e0252827. [Google Scholar] [CrossRef] [PubMed]
- Georgieva, I.; Lantta, T.; Lickiewicz, J.; Pekara, J.; Wikman, S.; Loseviča, M.; Raveesh, B.N.; Mihai, A.; Lepping, P. Perceived effectiveness, restrictiveness, and compliance with containment measures against the Covid-19 pandemic: An international comparative study in 11 countries. Int. J. Environ. Res. Public Health 2021, 18, 3806. [Google Scholar] [CrossRef] [PubMed]
- Hsiang, S.; Allen, D.; Annan-Phan, S.; Bell, K.; Bolliger, I.; Chong, T.; Druckenmiller, H.; Huang, L.Y.; Hultgren, A.; Krasovich, E. The effect of large-scale anti-contagion policies on the COVID-19 pandemic. Nature 2020, 584, 262–267. [Google Scholar] [CrossRef]
- Koh, W.C.; Naing, L.; Wong, J. Estimating the impact of physical distancing measures in containing COVID-19: An empirical analysis. Int. J. Infect. Dis. 2020, 100, 42–49. [Google Scholar] [CrossRef] [PubMed]
- Li, Y.; Campbell, H.; Kulkarni, D.; Harpur, A.; Nundy, M.; Wang, X.; Nair, H.; Usher Network for COVID-19 Evidence Reviews (UNCOVER) group. The temporal association of introducing and lifting non-pharmaceutical interventions with the time-varying reproduction number (R) of SARS-CoV-2: A modelling study across 131 countries. Lancet Infect. Dis. 2021, 21, 193–202. [Google Scholar] [CrossRef]
- Liu, Y.; Morgenstern, C.; Kelly, J.; Lowe, R.; Jit, M. The impact of non-pharmaceutical interventions on SARS-CoV-2 transmission across 130 countries and territories. BMC Med. 2021, 19, 40. [Google Scholar] [CrossRef]
- Brauner, J.M.; Mindermann, S.; Sharma, M.; Johnston, D.; Salvatier, J.; Gavenčiak, T.; Stephenson, A.B.; Leech, G.; Altman, G.; Mikulik, V. Inferring the effectiveness of government interventions against COVID-19. Science 2021, 371, eabd9338. [Google Scholar] [CrossRef]
- Flaxman, S.; Mishra, S.; Gandy, A.; Unwin, H.J.T.; Mellan, T.A.; Coupland, H.; Whittaker, C.; Zhu, H.; Berah, T.; Eaton, J.W. Estimating the effects of non-pharmaceutical interventions on COVID-19 in Europe. Nature 2020, 584, 257–261. [Google Scholar] [CrossRef]
- Pasdar, Z.; Pana, T.A.; Ewers, K.D.; Szlachetka, W.A.; Perdomo-Lampignano, J.A.; Gamble, D.T.; Bhattacharya, S.; Carter, B.; Myint, P.K. An ecological study assessing the relationship between Public Health Policies and Severity of the COVID-19 Pandemic. Healthcare 2021, 9, 1221. [Google Scholar] [CrossRef]
- Sadeghi, B.; Cheung, R.C.Y.; Hanbury, M. Using hierarchical clustering analysis to evaluate COVID-19 pandemic preparedness and performance in 180 countries in 2020. Bmj Open 2021, 11, e049844. [Google Scholar] [CrossRef] [PubMed]
- Brooks, S.K.; Webster, R.K.; Smith, L.E.; Woodland, L.; Wessely, S.; Greenberg, N.; Rubin, G.J. The psychological impact of quarantine and how to reduce it: Rapid review of the evidence. Lancet 2020, 395, 912–920. [Google Scholar] [CrossRef] [Green Version]
- Yao, Z.; Tang, P.; Fan, J.; Luan, J. Influence of Online Social Support on the Public’s Belief in Overcoming COVID-19. Inf. Process. Manag. 2021, 58, 102583. [Google Scholar] [CrossRef] [PubMed]
- Min, H.; Lee, C.C.; Joo, S.J. Assessing the efficiency of the Covid-19 control measures and public health policy in OECD countries from cultural perspectives. Benchmark. Int. J. 2021, 29, 6. [Google Scholar] [CrossRef]
- Jamison, D.T.; Lau, L.J.; Wu, K.B.; Xiong, Y.Y. Country performance against COVID-19: Rankings for 35 countries. BMJ Glob. Health 2020, 5. [Google Scholar] [CrossRef]
- Ghasemi, A.; Boroumand, Y.; Shirazi, M. How Do Governments Perform in Facing COVID-19? Munich Personal RePEc Archive: Munich, Germany, 2020. [Google Scholar]
- Shirouyehzad, H.; Jouzdani, J.; Khodadadi-Karimvand, M. An analysis of the COVID-19 contagion growth in European countries. Iran. J. Optim. 2020, 12, 11–19. [Google Scholar]
- Alizadeh, R.; Soltanisehat, L.; Lund, P.D.; Zamanisabzi, H. Improving renewable energy policy planning and decision-making through a hybrid MCDM method. Energy Policy 2020, 137, 111174. [Google Scholar] [CrossRef]
- Chien, F.; Wang, C.N.; Nguyen, V.T.; Nguyen, V.T.; Chau, K.Y. An evaluation model of quantitative and qualitative fuzzy multi-criteria decision-making approach for hydroelectric plant location selection. Energies 2020, 13, 2783. [Google Scholar] [CrossRef]
- Lo, H.W.; Shiue, W.; Liou, J.J.; Tzeng, G.H. A hybrid MCDM-based FMEA model for identification of critical failure modes in manufacturing. Soft Comput. 2020, 24, 15733–15745. [Google Scholar] [CrossRef]
- Wang, C.N.; Nguyen, V.T.; Chyou, J.T.; Lin, T.F.; Nguyen, T.N. Fuzzy multicriteria decision-making model (MCDM) for raw materials supplier selection in plastics industry. Mathematics 2019, 7, 981. [Google Scholar] [CrossRef] [Green Version]
- Satty, T.L. The Analytic Hierarchy Process, Analytic Hierarchy Process; McGraw-Hill: New York, NY, USA, 1980. [Google Scholar]
- Cottrell, M.; Burns, C.L.; Jones, A.; Rahmann, A.; Young, A.; Sam, S.; Cruickshank, M.; Pateman, K. Sustaining allied health telehealth services beyond the rapid response to COVID-19: Learning from patient and staff experiences at a large quaternary hospital. J. Telemed. Telecare 2021, 27, 615–624. [Google Scholar] [CrossRef] [PubMed]
- Nhamo, L.; Ndlela, B. Nexus planning as a pathway towards sustainable environmental and human health post Covid-19. Environ. Res. 2021, 192, 110376. [Google Scholar] [CrossRef] [PubMed]
- Ecer, F. A consolidated MCDM framework for performance assessment of battery electric vehicles based on ranking strategies. Renew. Sustain. Energy Rev. 2021, 143, 110916. [Google Scholar] [CrossRef]
- Lombardi Netto, A.; Salomon, V.A.P.; Ortiz Barrios, M.A. Multi-criteria analysis of green bonds: Hybrid multi-method applications. Sustainability 2021, 13, 10512. [Google Scholar] [CrossRef]
- Nyimbili, P.H.; Erden, T.; Karaman, H. Integration of GIS, AHP and TOPSIS for earthquake hazard analysis. Natural Hazards 2018, 92, 1523–1546. [Google Scholar] [CrossRef]
- Wu, H.Y.; Chen, J.K.; Chen, I.S.; Zhuo, H.H. Ranking universities based on performance evaluation by a hybrid MCDM model. Measurement 2012, 45, 856–880. [Google Scholar] [CrossRef]
- Zavadskas, E.K.; Turskis, Z.; Kildienė, S. State of art surveys of overviews on MCDM/MADM methods. Technol. Econ. Dev. Econ. 2014, 20, 165–179. [Google Scholar] [CrossRef] [Green Version]
- Zhong, X.; Wang, D.L.; Mo, L.F.; Zhang, W.; Xiao, L.H.; Wu, X.L.; Chen, Y.W.; Yang, L. Evaluation of the quality of COVID-19 prevention and control by a novel comprehensive evaluation model in a tertiary general hospital: A prospective observational study. BMC Public Health 2021, 21, 2022. [Google Scholar] [CrossRef]
- Freeman, J.; Chen, T. Green supplier selection using an AHP-Entropy-TOPSIS framework. Supply Chain.-Manag.-Int. J. 2015, 20, 327–340. [Google Scholar] [CrossRef] [Green Version]
- Hezam, M.; Moddassir, K.N.; Abdelaziz, F.; Alrasheedi, A.F. COVID-19 Vaccine: A neutrosophic MCDM approach for determining the priority groups. Results Phys. 2021, 20, 3654. [Google Scholar] [CrossRef]
- Mian, S.H.; Al-Ahmari, A. Comparative analysis of different digitization systems and selection of best alternative. J. Intell. Manuf. 2019, 30, 2039–2067. [Google Scholar] [CrossRef]
- Zanakis, S.H.; Alvarez, C.; Li, V. Socio-economic determinants of HIV/AIDS pandemic and nations efficiencies. Eur. J. Oper. Res. 2007, 176, 1811–1838. [Google Scholar] [CrossRef]
- Zeng, W.; Shepard, D.S.; Avila-Figueroa, C.; Ahn, H. Resource needs and gap analysis in achieving universal access to HIV/AIDS services: A data envelopment analysis of 45 countries. Health Policy Plann. 2016, 31, 624–633. [Google Scholar] [CrossRef] [PubMed] [Green Version]
- Zeng, W.; Shepard, D.S.; Chilingerian, J.; Avila-Figueroa, C. How much can we gain from improved efficiency? An examination of performance of national HIV/AIDS programs and its determinants in low-and middle-income countries. BMC Health Serv. Res. 2012, 12, 74. [Google Scholar] [CrossRef] [Green Version]
- COVID-19 Pandemic Data. Available online: https://ourworldindata.org/coronavirus (accessed on 1 February 2022).
- Mathieu, E.; Ritchie, H.; Ortiz-Ospina, E.; Roser, M.; Hasell, J.; Appel, C.; Giattino, C.; Rodés-Guirao, L. A global database of COVID-19 vaccinations. Nat. Hum. Behav. 2021, 5, 947–953. [Google Scholar] [CrossRef]
- Awadasseid, A.; Wu, Y.; Tanaka, Y.; Zhang, W. Initial success in the identification and management of the coronavirus disease 2019 (COVID-19) indicates human-to-human transmission in Wuhan, China. Int. J. Biol. Sci. 2020, 16, 1846. [Google Scholar] [CrossRef]
- Lu, W.; Huang, Y.; Gao, C.; Cai, Y.; Yang, L. Three phases of COVID-19: Theoretical thinking on epidemic prevention and control. Ann. Palliat. Med. 2021, 10, 8271–8275. [Google Scholar] [CrossRef] [PubMed]
- Human Development Reports. Available online: http://hdr.undp.org/en/content/human-development-index-hdi (accessed on 25 December 2021).
- Feizi, F.; Karbalaei-Ramezanali, A.; Tusi, H. Mineral potential mapping via TOPSIS with hybrid AHP–Shannon entropy weighting of evidence: A case study for porphyry-cu, Farmahin area, Markazi Province, Iran. Nat. Resour. Res. 2017, 26, 553–570. [Google Scholar] [CrossRef]
- Zanakis, S.H.; Solomon, A.; Wishart, N.; Dublish, S. Multi-attribute decision making: A simulation comparison of select methods. Eur. J. Oper. Res. 1998, 107, 507–529. [Google Scholar] [CrossRef]
- Ma, F.; He, J.; Ma, J.; Xia, S. Evaluation of urban green transportation planning based on central point triangle whiten weight function and entropy-AHP. Transp. Res. Procedia 2017, 25, 3634–3644. [Google Scholar] [CrossRef]
- Xiao, K.; Tamborski, J.; Wang, X.; Feng, X.; Wang, S.; Wang, Q.; Lin, D.; Li, H. A coupling methodology of the analytic hierarchy process and entropy weight theory for assessing coastal water quality. Environ. Sci. Pollut. Res. 2022, 29, 31217–31234. [Google Scholar] [CrossRef] [PubMed]
- Zhang, X.; Xu, Z. Extension of TOPSIS to multiple criteria decision making with Pythagorean fuzzy sets. Int. J. Intell. Syst. 2014, 29, 1061–1078. [Google Scholar] [CrossRef]
- Rezaei, J. Best-worst multi-criteria decision-making method. Omega 2015, 53, 49–57. [Google Scholar] [CrossRef]
- Charnes, A.; Cooper, W.W.; Rhodes, E. Measuring the efficiency of decision making units. Eur. J. Oper. Res. 1978, 2, 429–444. [Google Scholar] [CrossRef]
- Shirouyehzad, H.; Jouzdani, J.; Khodadadi Karimvand, M. Fight against COVID-19: A global efficiency evaluation based on contagion control and medical treatment. J. Appl. Res. Ind. Eng. 2020, 7, 109–120. [Google Scholar]
- Chen, S.; Guo, L.; Alghaith, T.; Dong, D.; Alluhidan, M.; Hamza, M.M.; Herbst, C.H.; Zhang, X.; Tagtag, G.C.A.; Zhang, Y. Effective COVID-19 Control: A Comparative Analysis of the Stringency and Timeliness of Government Responses in Asia. Int. J. Environ. Res. Public Health 2021, 18, 8686. [Google Scholar] [CrossRef]
- Viner, R.M.; Russell, S.J.; Croker, H.; Packer, J.; Ward, J.; Stansfield, C.; Mytton, O.; Bonell, C.; Booy, R. School closure and management practices during coronavirus outbreaks including COVID-19: A rapid systematic review. Lancet Child Adolesc. Health 2020, 4, 397–404. [Google Scholar] [CrossRef]
- Alkan, N.; Kahraman, C. Evaluation of government strategies against COVID-19 pandemic using q-rung orthopair fuzzy TOPSIS method. Appl. Soft Comput. 2021, 110, 107653. [Google Scholar] [CrossRef]


| Scale of Investment | r | Returns to Scale | Potential |
|---|---|---|---|
| Small | Increasing | 2 (High) | |
| Appropriate | Fixed | 1 (Medium) | |
| Huge | Decreasing | 0 (Low) |
| Performing | Country |
|---|---|
| Better | South Korea, Japan, Germany, Australia, China |
| Worse | United States, Indonesia, Egypt, South Africa, Brazil |
Publisher’s Note: MDPI stays neutral with regard to jurisdictional claims in published maps and institutional affiliations. |
© 2022 by the authors. Licensee MDPI, Basel, Switzerland. This article is an open access article distributed under the terms and conditions of the Creative Commons Attribution (CC BY) license (https://creativecommons.org/licenses/by/4.0/).
Share and Cite
Pan, J.; Fan, R.; Zhang, H.; Gao, Y.; Shu, Z.; Chen, Z. Investigating the Effectiveness of Government Public Health Systems against COVID-19 by Hybrid MCDM Approaches. Mathematics 2022, 10, 2678. https://doi.org/10.3390/math10152678
Pan J, Fan R, Zhang H, Gao Y, Shu Z, Chen Z. Investigating the Effectiveness of Government Public Health Systems against COVID-19 by Hybrid MCDM Approaches. Mathematics. 2022; 10(15):2678. https://doi.org/10.3390/math10152678
Chicago/Turabian StylePan, Jiaji, Ruilin Fan, Hanlu Zhang, Yi Gao, Zhiquan Shu, and Zhongxiang Chen. 2022. "Investigating the Effectiveness of Government Public Health Systems against COVID-19 by Hybrid MCDM Approaches" Mathematics 10, no. 15: 2678. https://doi.org/10.3390/math10152678
APA StylePan, J., Fan, R., Zhang, H., Gao, Y., Shu, Z., & Chen, Z. (2022). Investigating the Effectiveness of Government Public Health Systems against COVID-19 by Hybrid MCDM Approaches. Mathematics, 10(15), 2678. https://doi.org/10.3390/math10152678