Abstract
A surveillance system with more than hundreds of cameras and much fewer monitors strongly relies on manual scheduling and inspections from monitoring personnel. A monitoring method which improves the surveillance performance by analyzing and learning from a large amount of manual operation logs is proposed in this paper. Compared to fixed rules or existing computer-vision methods, the proposed method can more effectively learn from the operators’ behaviors and incorporate their intentions into the monitoring strategy. To the best of our knowledge, this method is the first to apply a monitoring-strategy recommendation model containing a global encoder and a local encoder in monitoring systems. The local encoder can adaptively select important items in the operating sequence to capture the main purpose of the operator, while the global encoder is used to summarize the behavior of the entire sequence. Two experiments are conducted on two data sets. Compared with att-RNN and att-GRU, the joint coding model in experiment 1 improves the Recall@20 by 9.4% and 4.6%, respectively, and improves the MRR@20 by 5.49% and 3.86%, respectively. In experiment 2, compared with att-RNN and att-GRU, the joint coding model improves by 11.8% and 6.2% on Recall@20, and improves by 7.02% and 5.16% on MRR@20, respectively. The results illustrate the effectiveness of the our model in monitoring systems.
MSC:
68W40; 94D05; 49J22
1. Introduction
In recent years, video surveillance system has developed rapidly, and it is increasingly used in various security fields, such as prison monitoring of prisoners, and security personnel monitoring of passengers. An increasing number of surveillance videos need to be operated by surveillance personnel, and the number of operation logs is also increasing exponentially. Therefore, mining valuable information from massive logs has become a meaningful topic.
In the realm of surveillance, previous research focused on abnormal behaviors of the monitored person in surveillance video [1], such as gait recognition [2,3,4,5], pedestrian re-identification [6,7], etc., but the operations of monitors should also cause concern. Based on the operation logs, this paper extracts valuable information from the operations of monitors. The operation logs refer to the log files that record the display contents of the monitors and the operations of the operators.
A surveillance system with more than hundreds of cameras and much fewer monitors strongly relies on the manual scheduling and inspections from monitoring personnel.
Since the number of cameras in the surveillance system is much greater than that of monitors, this will cause serious information loss. By formulating monitoring strategies and prioritizing the display of high-risk areas at the current moment, the problem of information loss can be alleviated. Therefore, the quality of the monitoring strategy directly determines the ability of the monitoring system. Tensor-based [8,9], social network-based methods [10,11,12,13], etc., are commonly recommended methods. These methods need to obtain each user’s information as a dimension of the original input. However, in the monitoring system, a department may share the same account, and it is impossible to obtain the click information of each operator.
Two strategies are mainly used in the existing monitoring strategies: fixed rule ordering display and abnormal screen priority ordering display. The first strategy is based on the experience of monitoring personnel to set a fixed interval time for a fixed screen display. This requires the monitoring personnel to be familiar with high-risk areas and time. Due to the fixed screen sequence, it is impossible to carry out regular and fixed-point monitoring for the high-risk area in different time periods. Computer vision algorithms are applied in the second strategy to analyze the abnormal behaviors. Support vector machine (SVM) is a common method for abnormal behavior detection. On the basis of SVM, Olkopf et al. [14] proposed one-class support vector machine (OCSVM). In the model training stage, OCSVM searches for a hyperplane with the largest distance from the zero point in the high-dimensional feature space. At the same time, the hyperplane separates the zero point from all high-dimensional feature data in the space. Refs. [15,16,17] regard OCSVM as a model for abnormal behavior detection, and obtained good experimental results. Chalapathy et al. [18] further introduced the idea of OCSVM into the field of deep learning, and proposed one-class neural networks (OCN) as a classifier for abnormal behavior detection. Tung et al. proposed a strategy to classify trajectories based on the probability framework of particle filtering to complete the detection of abnormal behavior [19]. Cao et al. [20] estimated the kinetic energy of group movement in surveillance video based on optical flow technology. They further combined the direction change of group movement and the change of group movement state in a certain direction to detect the occurrence of abnormal behavior. Luo et al. [21] used convolutional neural network (CNN) and convolutional long short-term memory (ConvLSTM) to learn the regularity of normal samples in the training sample set through historical information and established an abnormal behavior detection model. Liu et al. [22] used the basic principles of the GAN network and the results of previous studies to build a deep neural network for predicting future frames as an abnormal behavior detection model. Xie et al. [23] presented a deep learning algorithm to evaluate abnormal behavior based on spatiotemporal representation learning. Liu et al. [24] adopted the framework of variational abnormal behavior detection to solve the variability of abnormal behavior coupled with huge ambiguity and uncertainty of video contents.
Both of the existing monitoring strategies have great disadvantages: the first strategy requires high experience of the monitoring personnel and cannot accurately judge different risk areas at different times; the second strategy is affected by the accuracy of the image intelligent analysis technology, and the false alarm rate is high, which affects the monitoring personnel’s judgment of the risk. Due to the above drawbacks of existing strategies, a joint coding monitoring strategy recommendation model based on operation log(OL-JCMSR) is proposed in this paper, which contains a global encoder and a local encoder to automatically capture and summarize the optimized behavior of the monitoring personnel. OL-JCMSR is an operation log based model, which can effectively solve the defects of the two existing strategies.
The main contributions of this paper are shown below.
- The operation logs are used to recommend monitoring strategies, which effectively solves the problems of the above two existing strategies and improves the performance of the monitoring system.
- OL-JCMSR is applied in the monitoring system. The experimental results show that OL-JCMSR is more suitable for monitoring strategy recommendation than other models, benefiting from the global encoder’s summary of the entire operation sequence and the local encoder’s precise capture of the operation intent.
Our model and experimental analysis is presented in the following sections. The principle of OL-JCMSR is described in Section 2. The process of the global encoder summarizes the behavior of the entire sequence and is described in Section 2.1. The process of local encoder captures the main purpose and is described in Section 2.2. Section 2.3 introduces the process of decoder. In Section 3, we conduct a large number of experiments and analyses, and the experimental results proved the effectiveness of OL-JCMSR (Supplementary Materials).
2. OL-JCMSR
OL-JCMSR contains a global encoder and a local encoder [25]. For session-based surveillance tasks, the global encoder is used to summarize the entire surveillance sequence, while the local encoder can adaptively select important items in the current session. The sequence behavior is useful for extracting the main purpose of the user in the current session. Therefore, this paper uses the representation of sequence behavior and the previous hidden state to calculate the attention weight of each click.
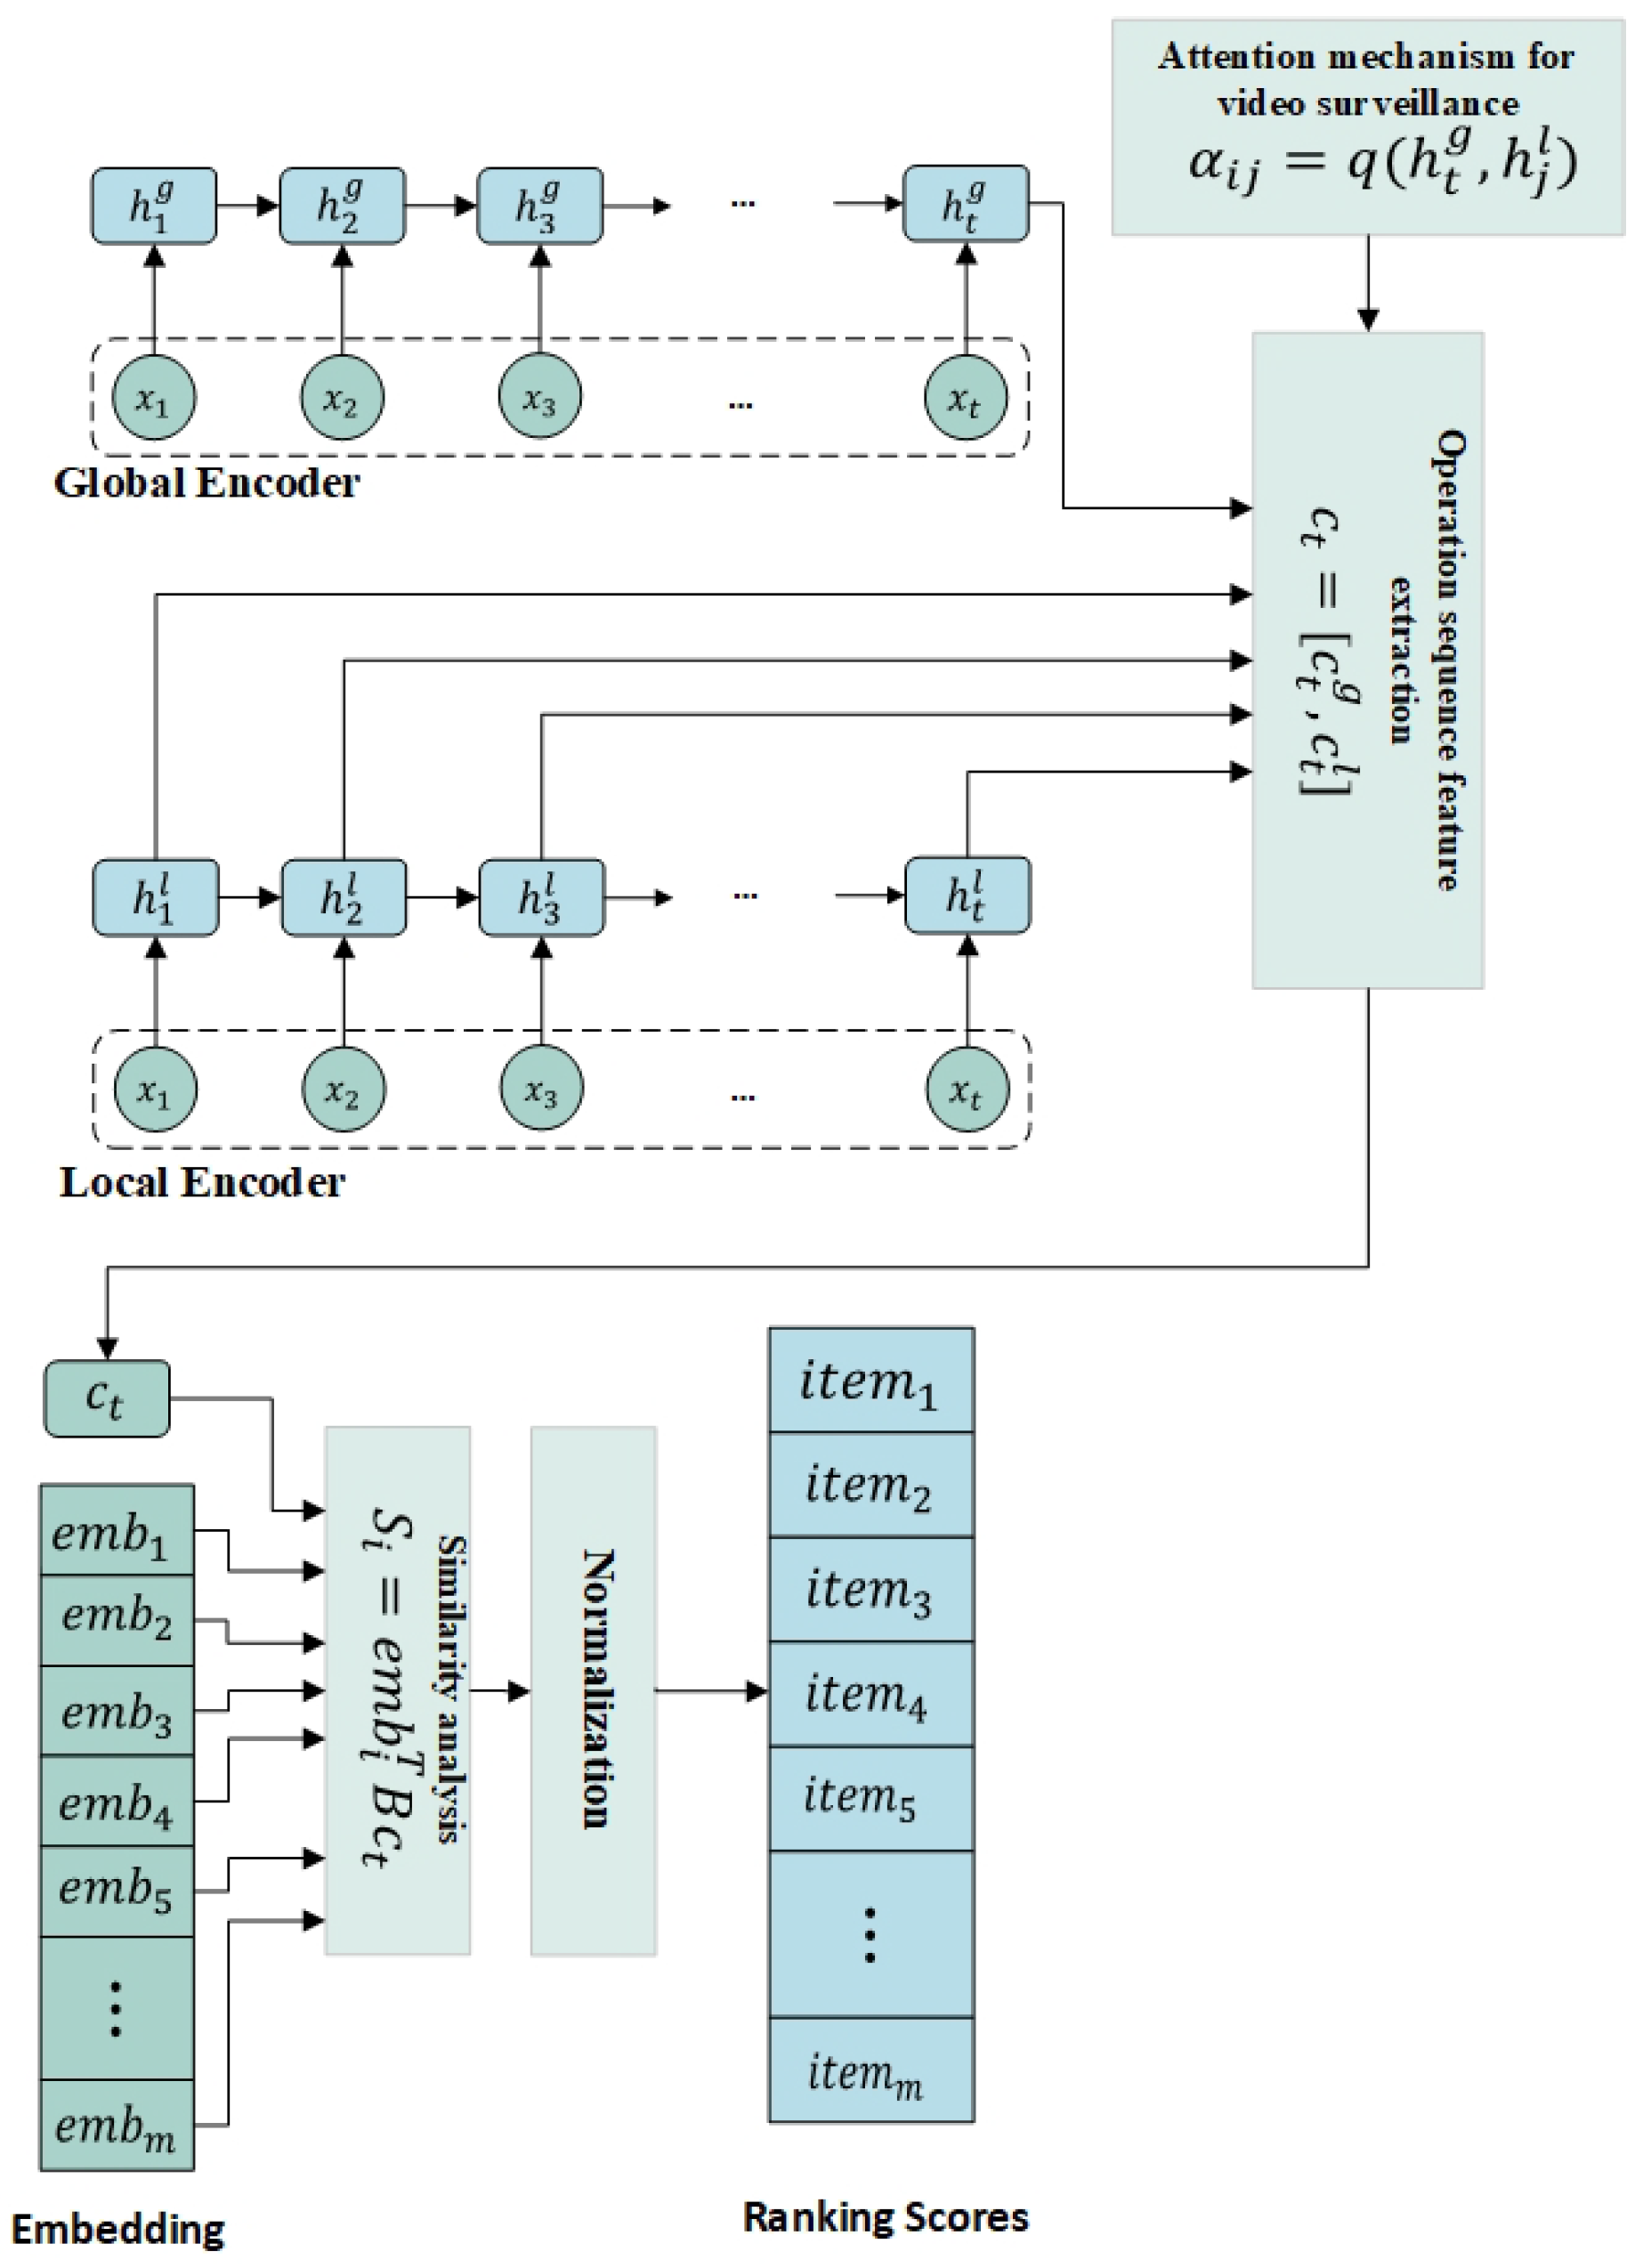
Figure 1 is a model diagram of OL-JCMSR. The global encoder is integrated into to provide the sequential behavior representation of our model. The function of the last hidden state of global encoder is different from that of local encoder . is used to calculate the attention weight of the previous hidden state, while encodes the entire sequence behavior. Combining these two coding schemes, is the unified representation of the entire behavior sequence and the main purpose of the current conversation:
where is a weight coefficient that determines the importance of item, which will be introduced in detail in the local encoder.
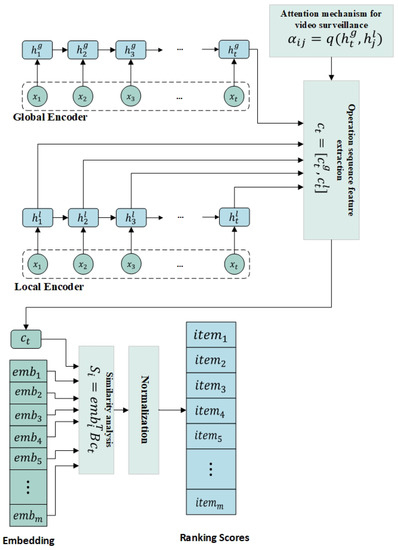
Figure 1.
OL-JCMSR diagram.
2.1. Global Encoder
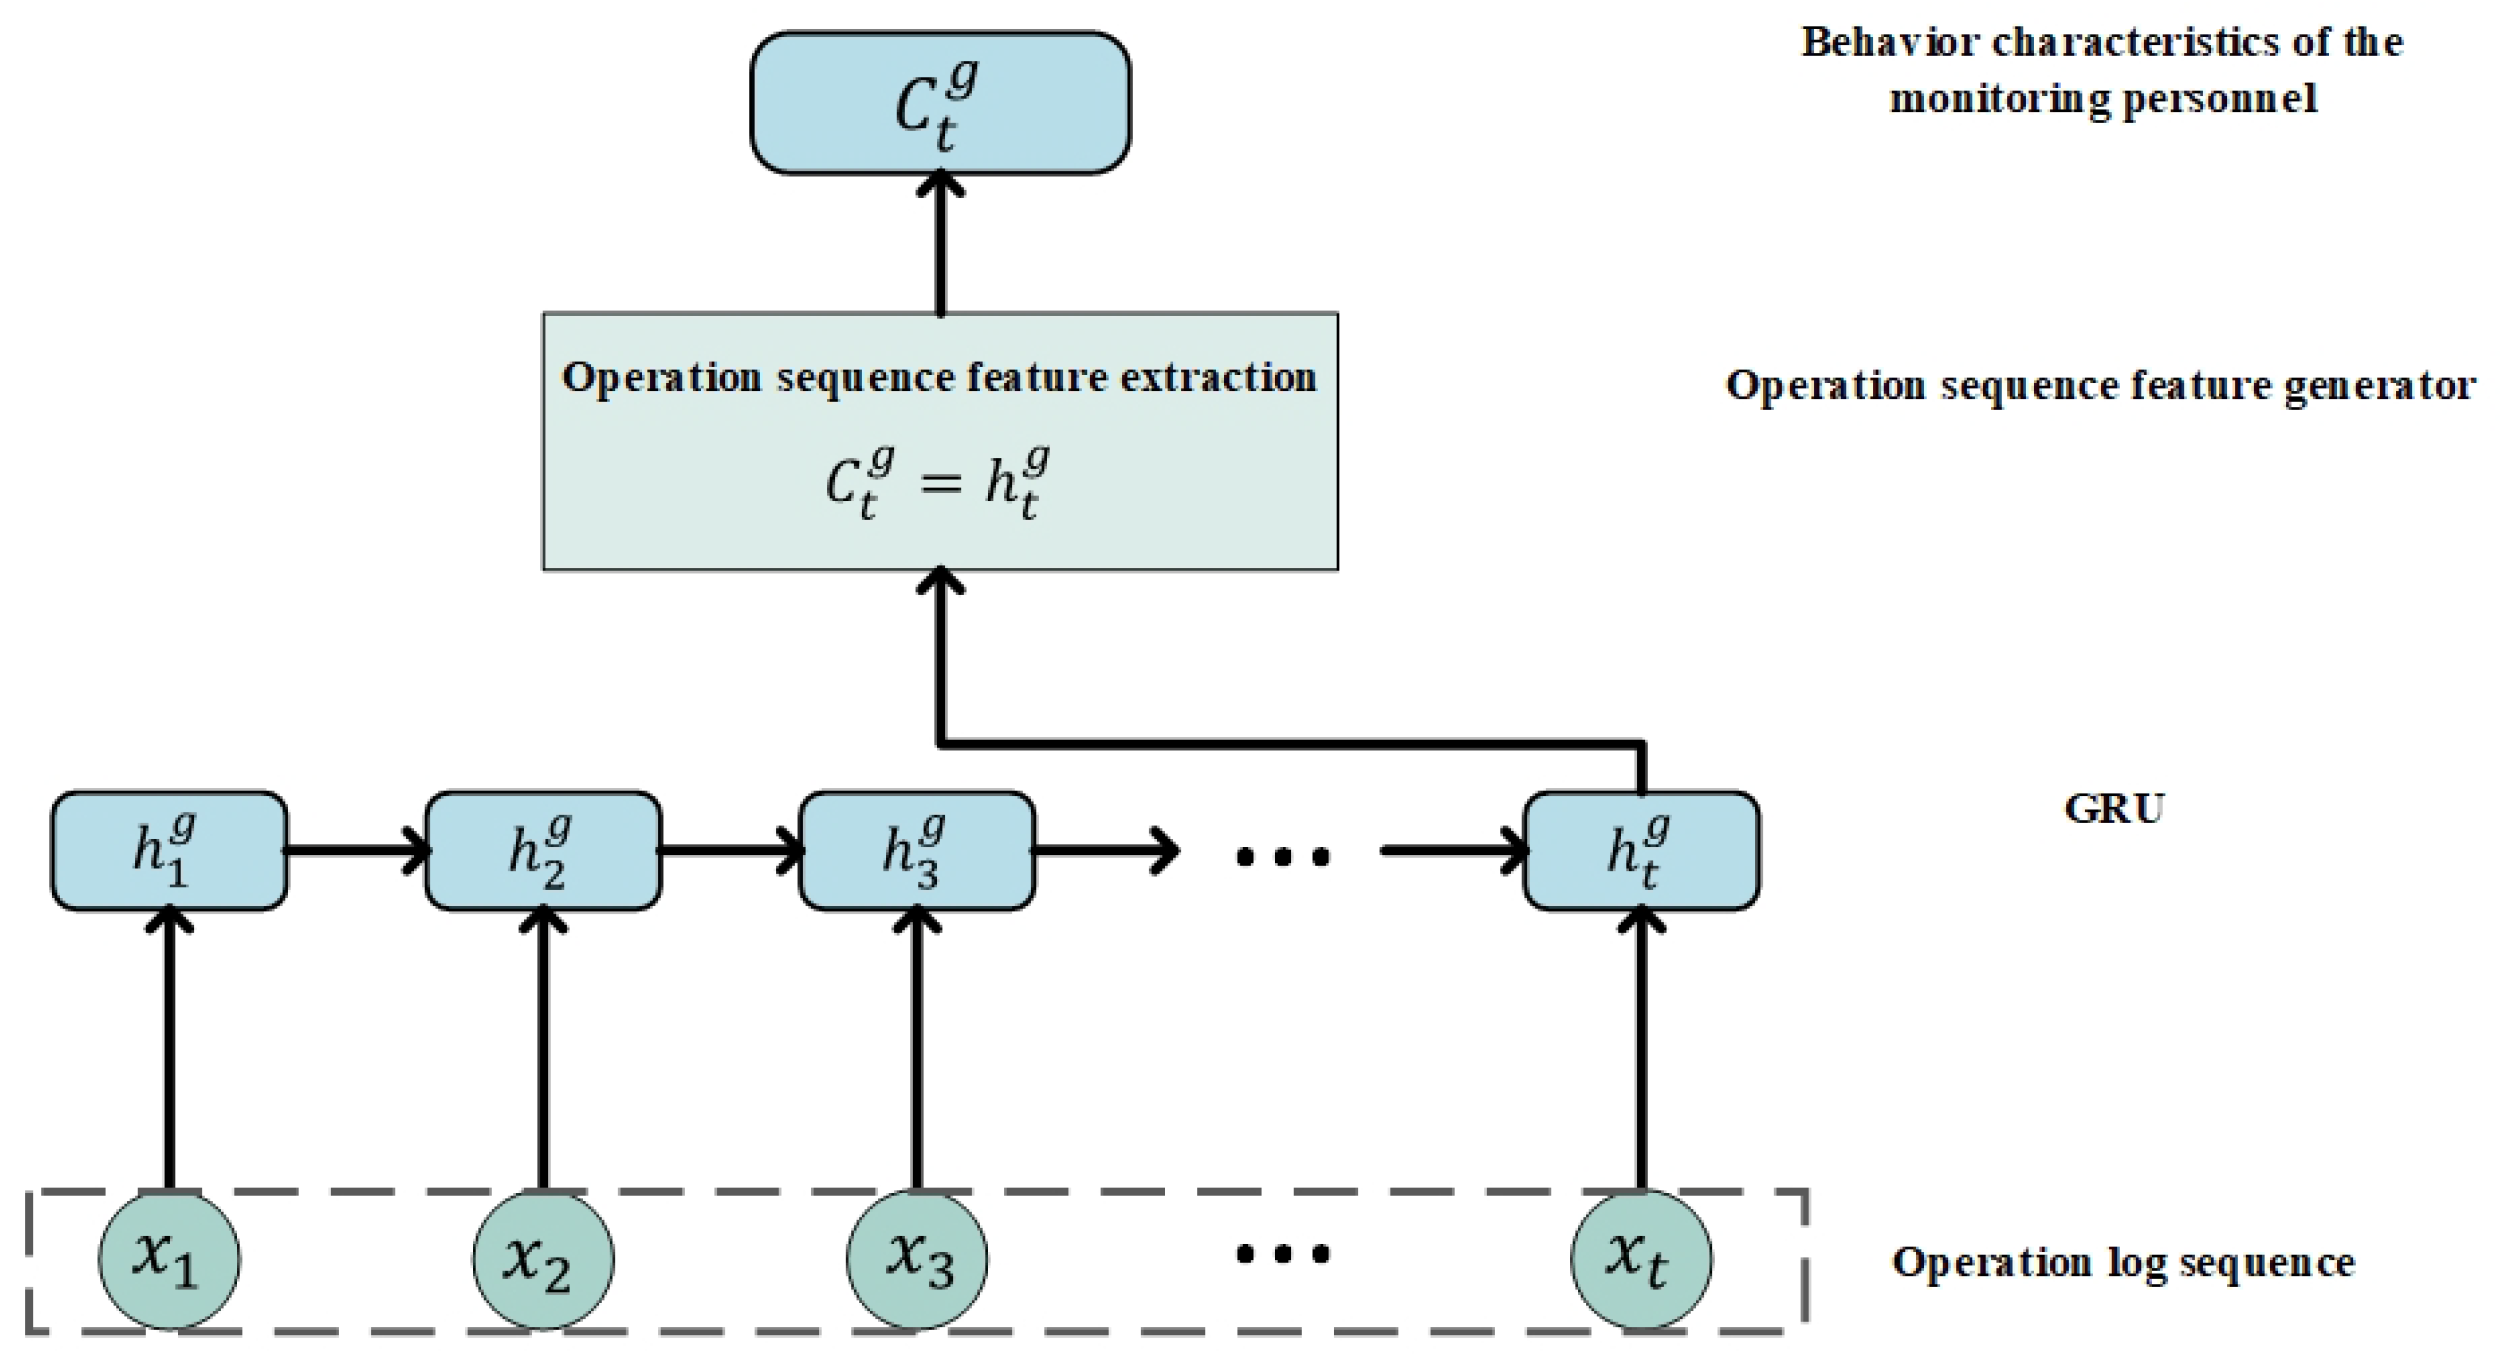
The entire operation sequence is used as the input of the global encoder, and the behavior characteristics of monitoring personnel in the sequence are used as the output of the global encoder. Figure 2 is a model diagram of the global encoder. The relationship between the candidate behavior and its previous behavior is as follows:
where is the update gate:
and is the candidate behavior:
where ⨀ is the Hadamard product and is the reset gate:
where is the sigmoid function. Through , the data can be transformed into a value within the range of 0–1. So we use as the gating signal. The pseudocode for the global encoder is shown in Algorithm 1.
| Algorithm 1: Global encoder. |
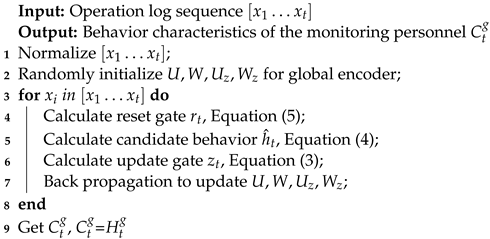 |

Figure 2.
The global encoder.
Because the global encoder’s vectorized generalization of the entire operation sequence is difficult to accurately obtain the intention of the surveillance personnel, so a local encoder for operation sequence is designed.
2.2. Local Encoder
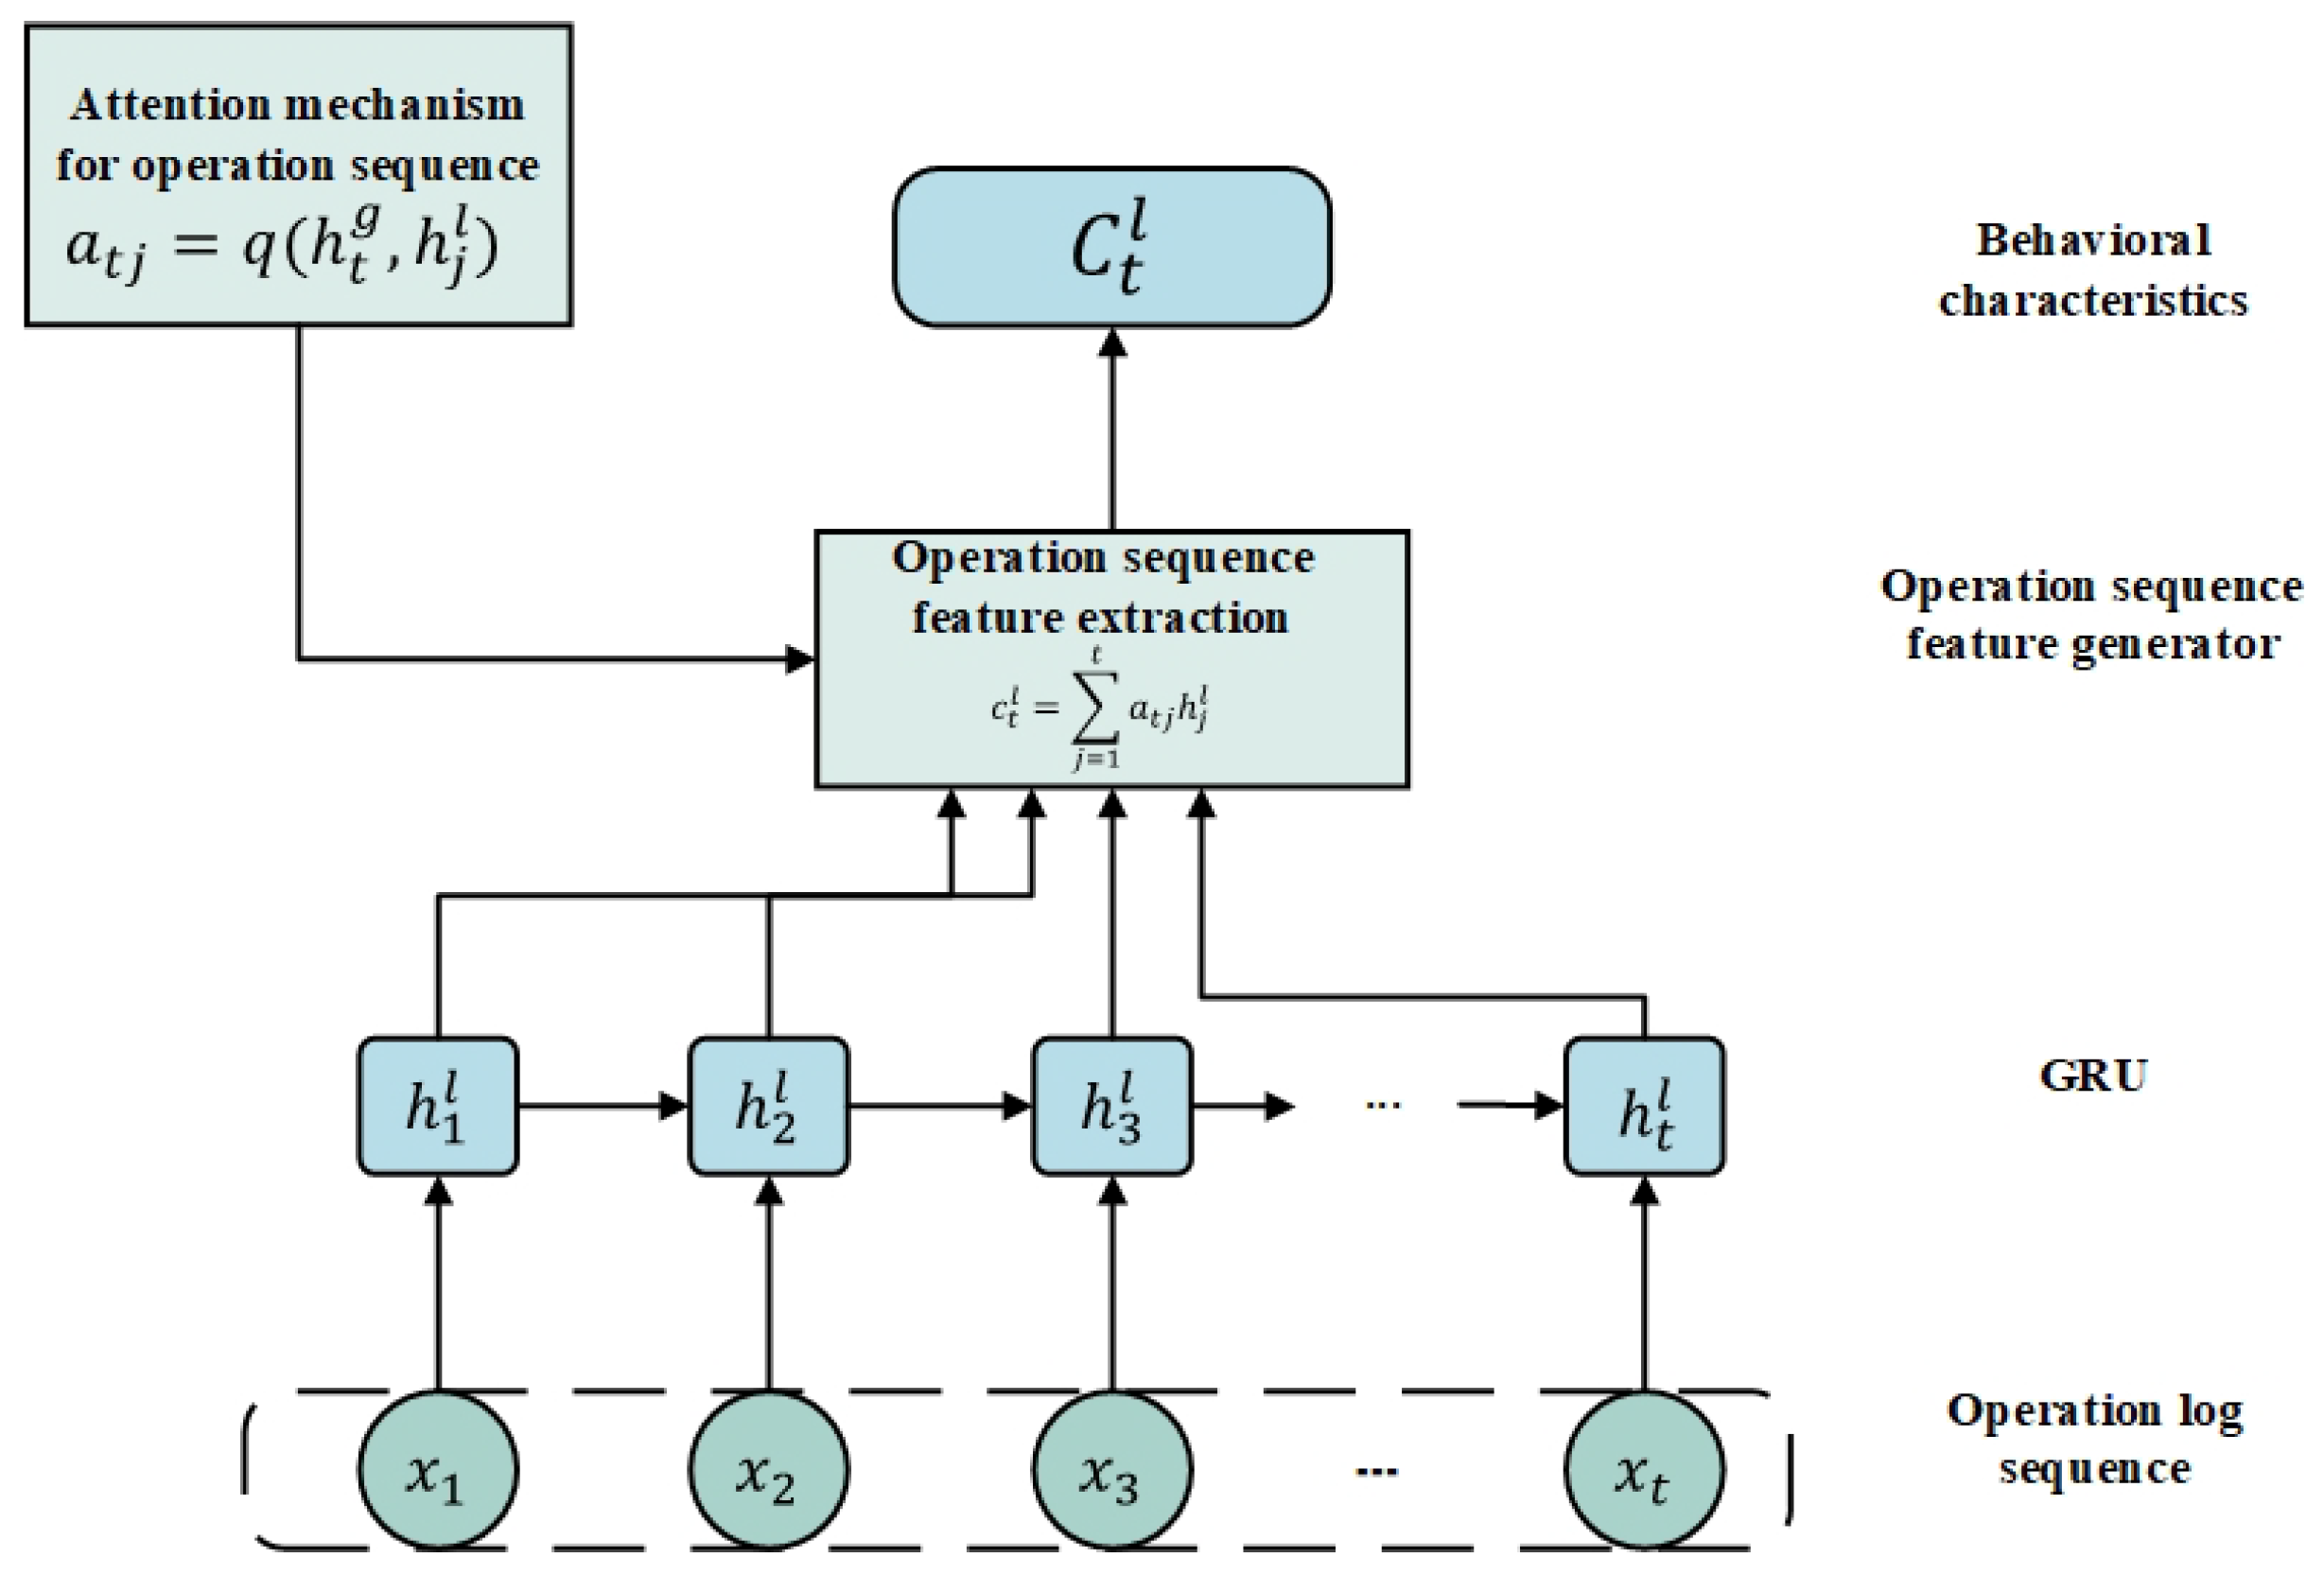
The structure of the local encoder (Figure 3) is similar to that of the global encoder. In order to obtain the precise intention of the monitoring personnel in the operation sequences, this paper uses an item-level attention mechanism. The dynamic selection and linear combination of different input sequence are as follows:
where is the weight factor. It is up to to decide which parts of the prediction should be emphasized or ignored. The design of is as follows:
where is the hidden layer output of global encoder in t-th step, and is the hidden layer output of local encoder in t-th step. The q function is to calculate the similarity between and :
where matrix is used to transform into a latent space, also acts on . The local encoder can adaptively capture the intention of the monitoring personnel. The pseudocode for the local encoder is shown in Algorithm 2.
| Algorithm 2: Local encoder. |
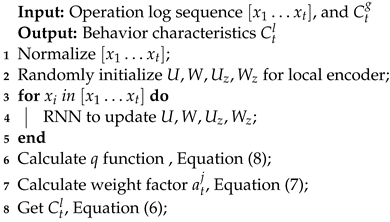 |
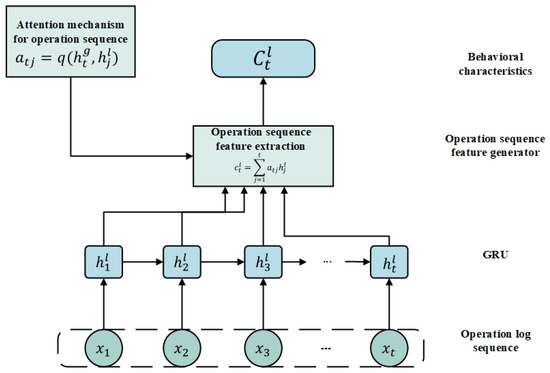
Figure 3.
The local encoder.
2.3. Decoder
A bi-linear decoding scheme is used in this paper, which not only reduces the number of parameters, but also improves the performance of the model. Specifically, the bi-linear similarity function between each candidate and the representation of the current operation sequence is used to calculate the similarity score :
where B is a dimension conversion matrix. Finally, the similarity score of each item is input into the SoftMax layer to obtain the probability of the item.
3. Experimental Results and Analysis of OL-JCMSR
Two experiments are carried out in this paper. Experiment 1 uses the entire data set. Since the data set contains a large amount of log data generated by the original monitoring strategy, the amount of information contained in this part of the data is much lower than that generated by the personal operation of the monitoring personnel. Therefore, the second experiment removes the data generated by the original monitoring strategy, and only retains the log data manually operated by the operator.
Compared with recurrent neural network (RNN) with attention mechanism and GRU with attention mechanism, OL-JCMSR has a better predictive effect on the operation sequence. The prediction effect of this model during the day is better than that at night. The difference between the prediction effect on working days and non-working days is not obvious. The experimental results and analysis will be introduced in detail in the next two experiments.
We adopt OL-JCMSR and the Adam optimizer for learning optimization. The initial learning rate is set to 0.001, the learning rate decay rate is set to 0.1, and the batch size is set to 100. If over-fitting occurs, the training is terminated early. Experiments are based on the TensorFlow deep learning framework, and the experimental environment used is shown in Table 1.

Table 1.
Model running environment.
Two indicators Recall@20 and MMR@20 are used for evaluation,
where indicates the number of positive classes predicted as positive classes. represents the number of positive classes predicted as negative classes. Recall@20 represents the proportion of the top 20 items that are correctly predicted in the ranking of all predicted camera scores by the model.
MRR is an indicator used to measure the effect of search algorithms. It is currently widely used in problems that allow multiple results to be returned. The model will give a confidence (scoring) to each returned result, and then sort the results according to the confidence, and return the results with high scores first, that is, the average number of the inverse of the first correct answer for a query. If the returned correct item is outside the top 20, the inverse score for this item will be 0. The calculation method is as follows:
where Q is the set of sample queries; is the number of queries in Q; represents the ranking of the first correct answer in the i-th query.
3.1. Experiment 1
Experiment 1 uses all the data in the data set. In order to verify the predictive effect of joint coding model on the monitoring strategy, RNN+attention (att-RNN) and GRU+attention (att-GRU) are used for comparison. At the same time, the operation logs are grouped according to different time. The normal group contains all operation logs for 4 months, with a total of 12,176,640 operations. The day group only contains operation logs during the day (6:00–18:00). The night group only contains operation logs at night (18:00–6:00 the next day). The wd group only contains operation logs of working days (Monday to Friday). The non-wd group only contains operation logs of non-working days (Saturday and Sunday). Day group, night group, wd group and non-wd group are subsets of the normal group, they contain part of the data of all operation logs.
Table 2 shows that in the normal group, the Recall@20 is 2% higher of att-GRU than that of att-RNN, and MRR@20 is 3% higher. We can know that, without considering the regularity of work and rest, att-GRU’s recommendation strategy is slightly better than att-RNN, but the effect is not obvious. Due to the addition of the local encoder in the joint coding model, the calculation of the weight is more accurate, making it easier to determine which parts of the normal group should be emphasized or ignored. The Recall@20 of the joint coding model is 4% higher than that of att-GRU, and the MRR@20 is 2% higher, which shows that the model we use is better than att-RNN and att-GRU without considering the time dimension.
Table 2.
Experimental results of the normal group.
The three models used in this experiment can capture the rules of the day–night group, so the overall experimental effect in the day–night group is better than that in the normal group. Since the joint coding model is more accurate in judging which part of the day–night group should be emphasized or ignored, its experimental effect is greatly improved. Table 3 shows that in the day group, att-GRU outperforms the att-RNN by 7% on the Recall@20 indicator, and the joint coding model is 12% and 5% higher than att-RNN and att-GRU in Recall@20, respectively. In the night group, the Recall@20 of joint coding model is 13% and 7% higher than that of att-RNN and att-GRU, respectively. At the same time, the MRR@20 of joint coding model is also significantly better than that of att-RNN and att-GRU. This shows that the joint coding model is better than the other two models when considering day and night.
Table 3.
Experimental results of day–night group.
Table 4 shows that att-GRU is still better than att-RNN in the groups which distinguish between working days and non-working days. The effect of the workday and non-workday group is comparable to that of the normal group, due to the small changes in the operating rules between working days and non-working days in the data set. However, benefiting from the global encoder’s summary of the entire sequence and the local encoder’s precise capture of operational intent, the joint encoding model is still better than the other two models. In the wd group, the joint coding model is 7% and 4% higher than att-RNN and att-GRU in Recall@20, respectively. In the non-wd group, the Recall@20 of joint coding model is 9% and 3% higher than that of att-RNN and att-GRU, respectively. In the wd group, MRR@20 of joint coding model is 7% and 4% higher than that of att-RNN and att-GRU, respectively. In the non-wd group, the MRR@20 of joint coding model is 6% and 3% higher than that of att-RNN and att-GRU, respectively. Although the experimental effect is not as good as the day_night group when distinguishing between working days and non-working days, the joint coding model still has advantages compared with the other two methods.
Table 4.
Experimental results of the workday and non-workday group.
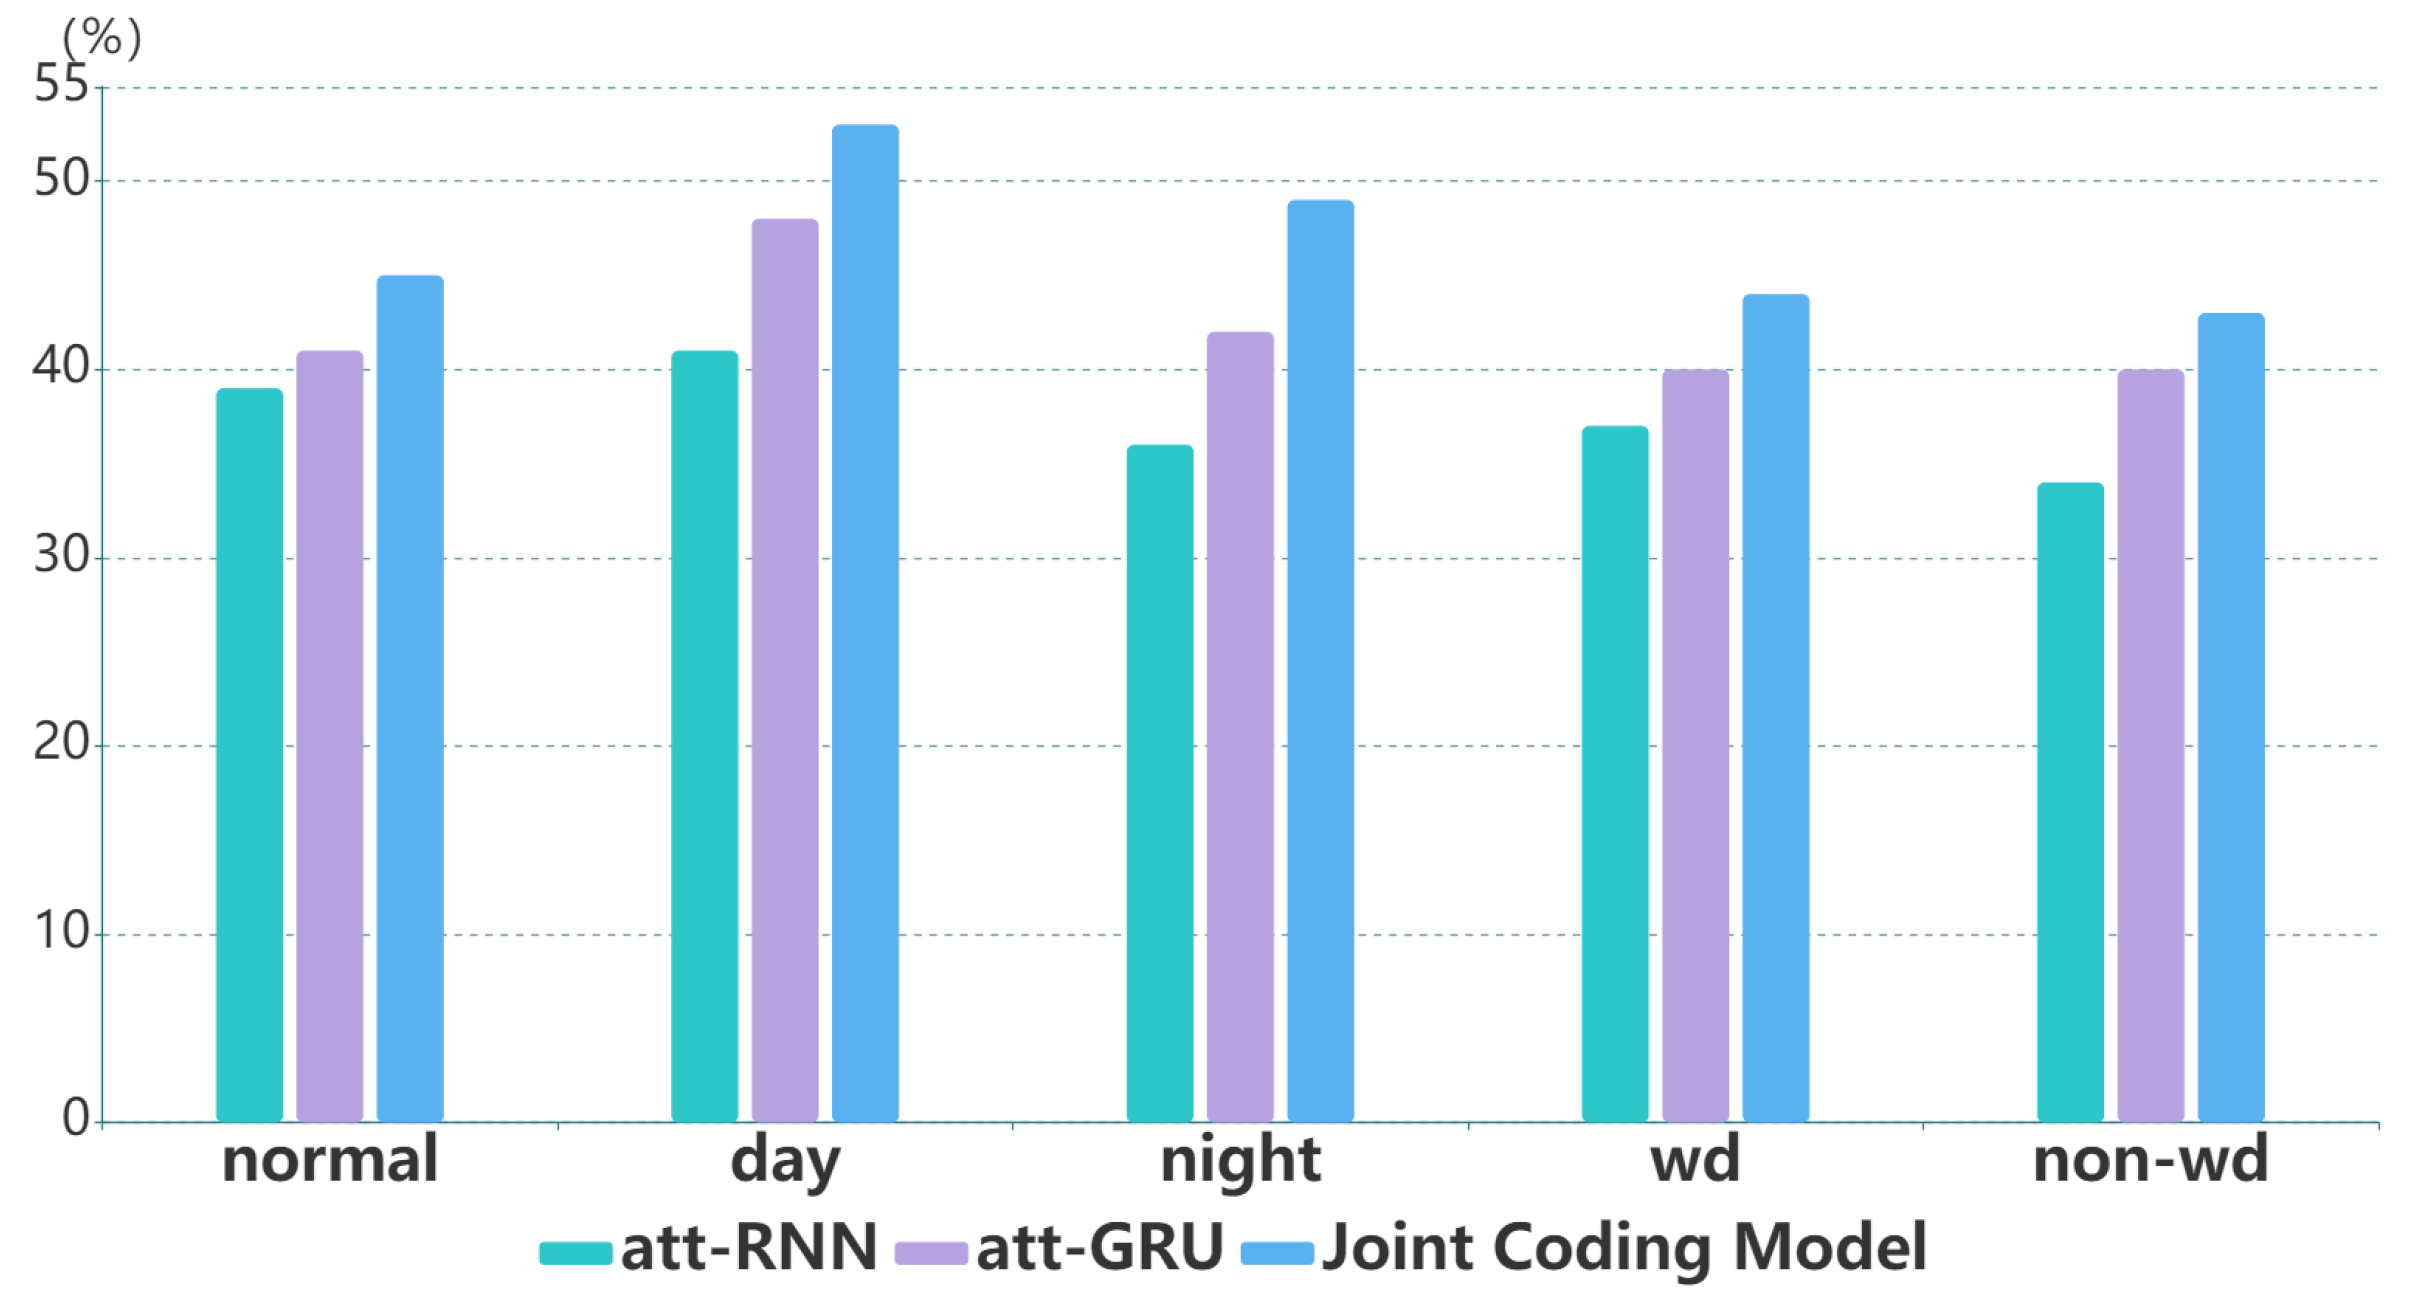
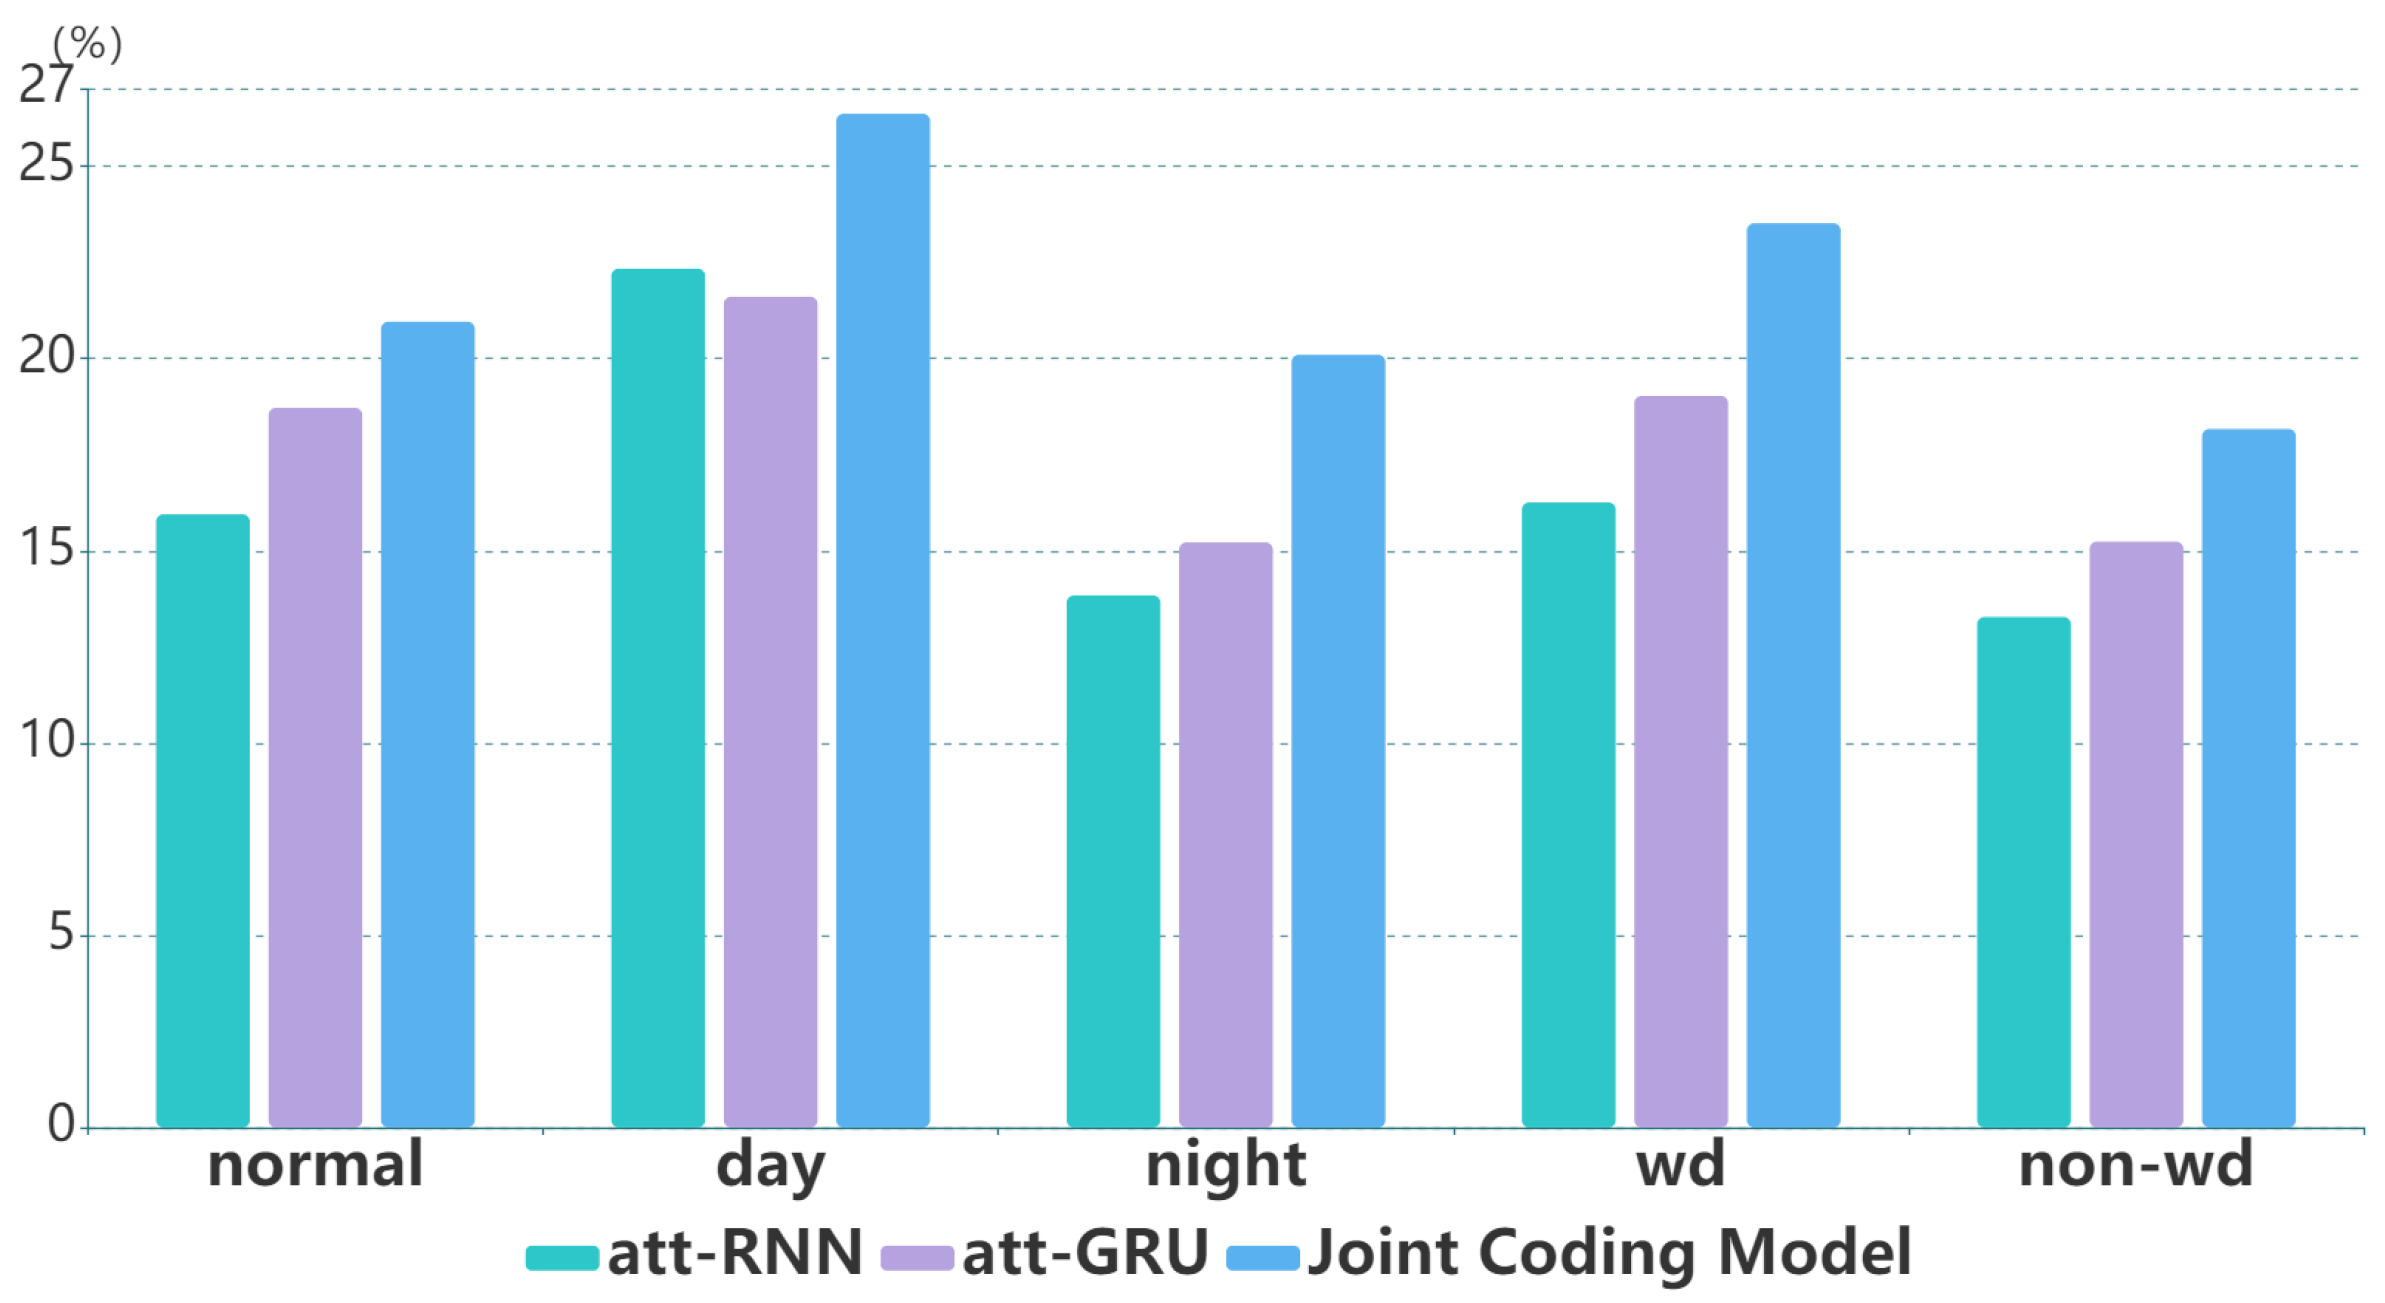
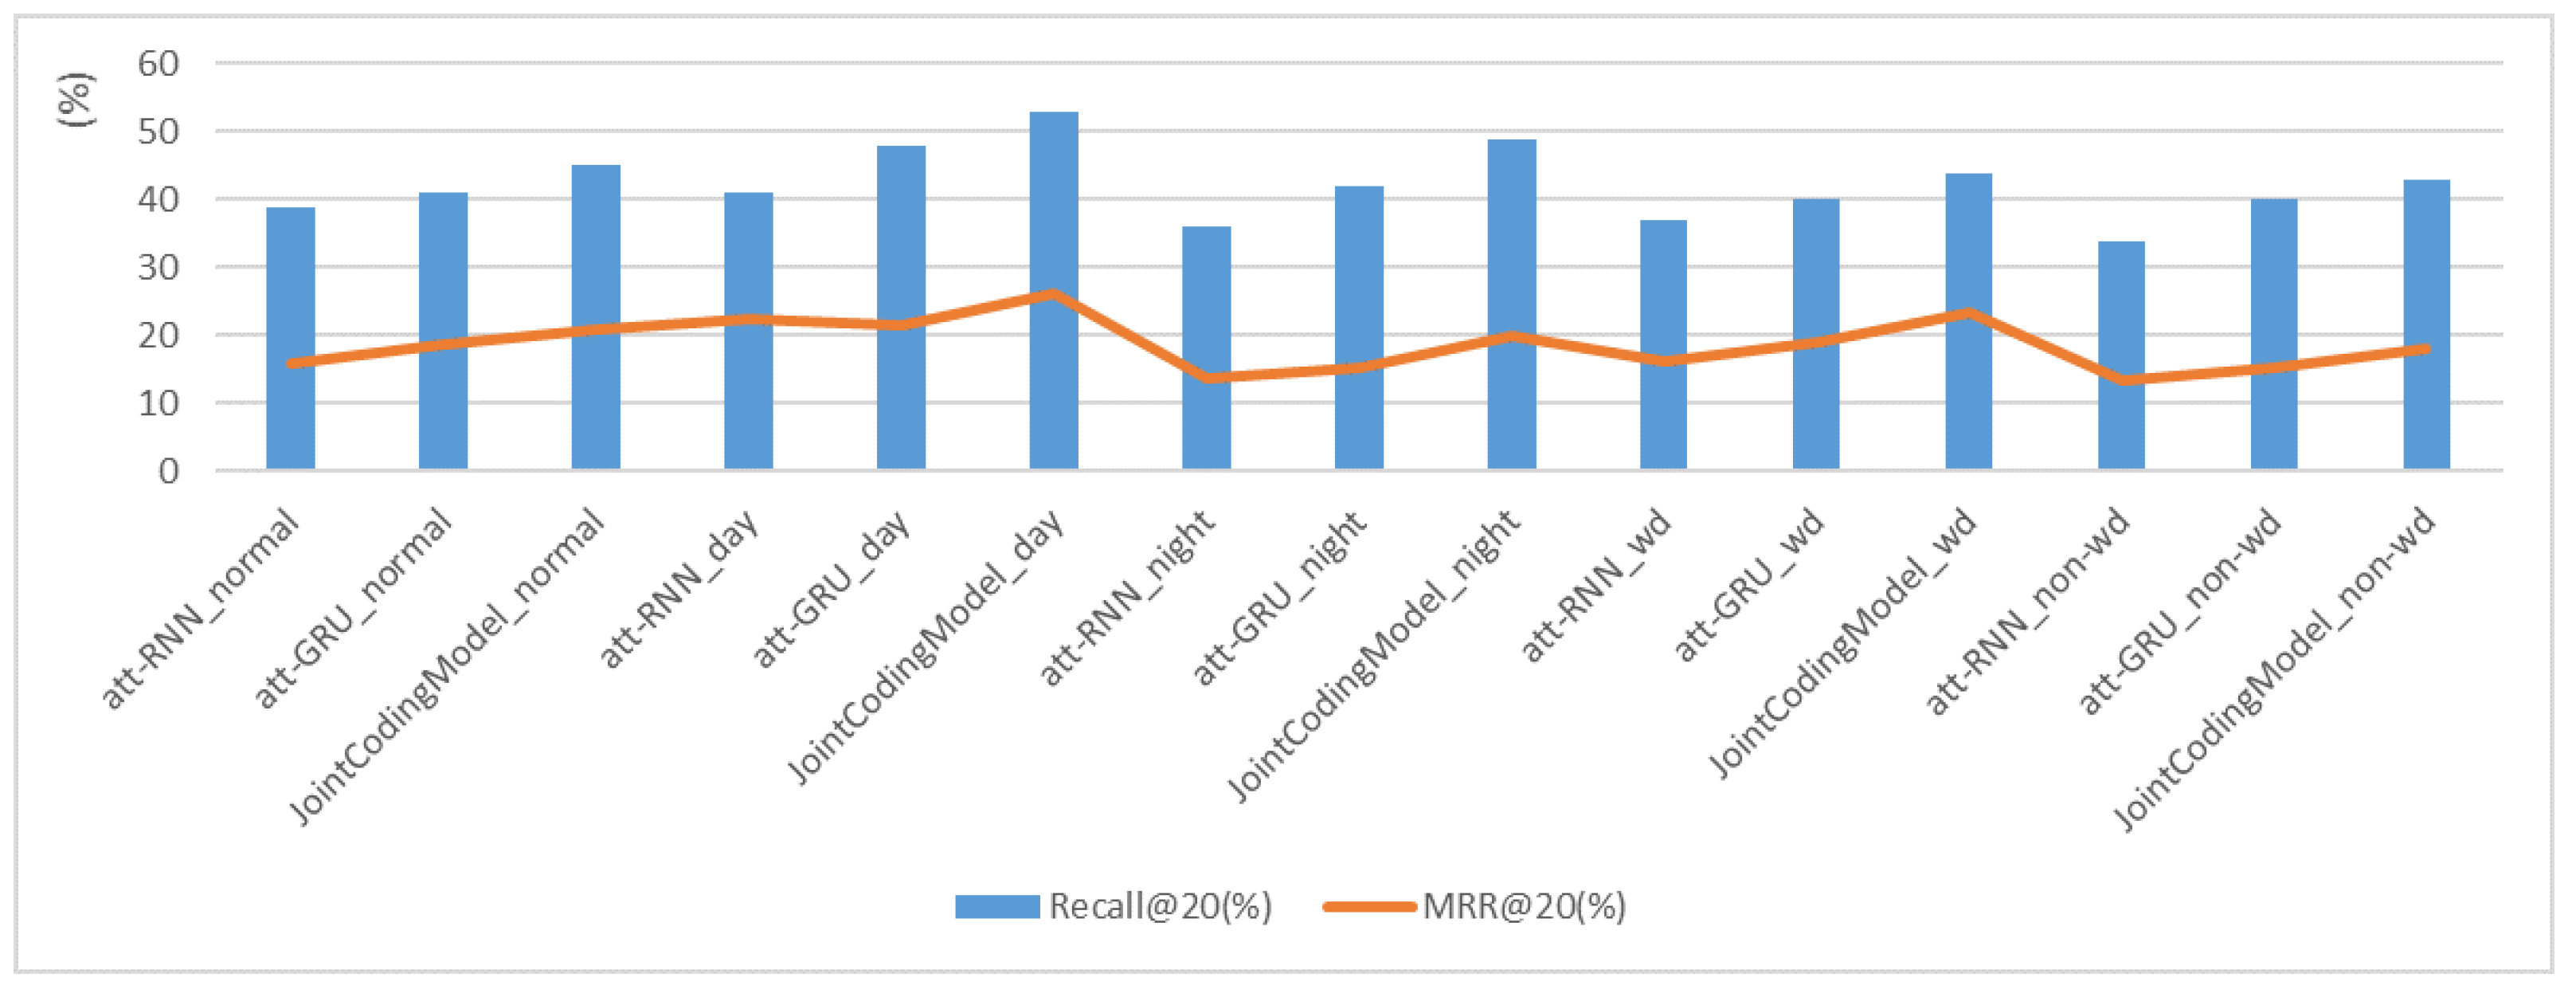
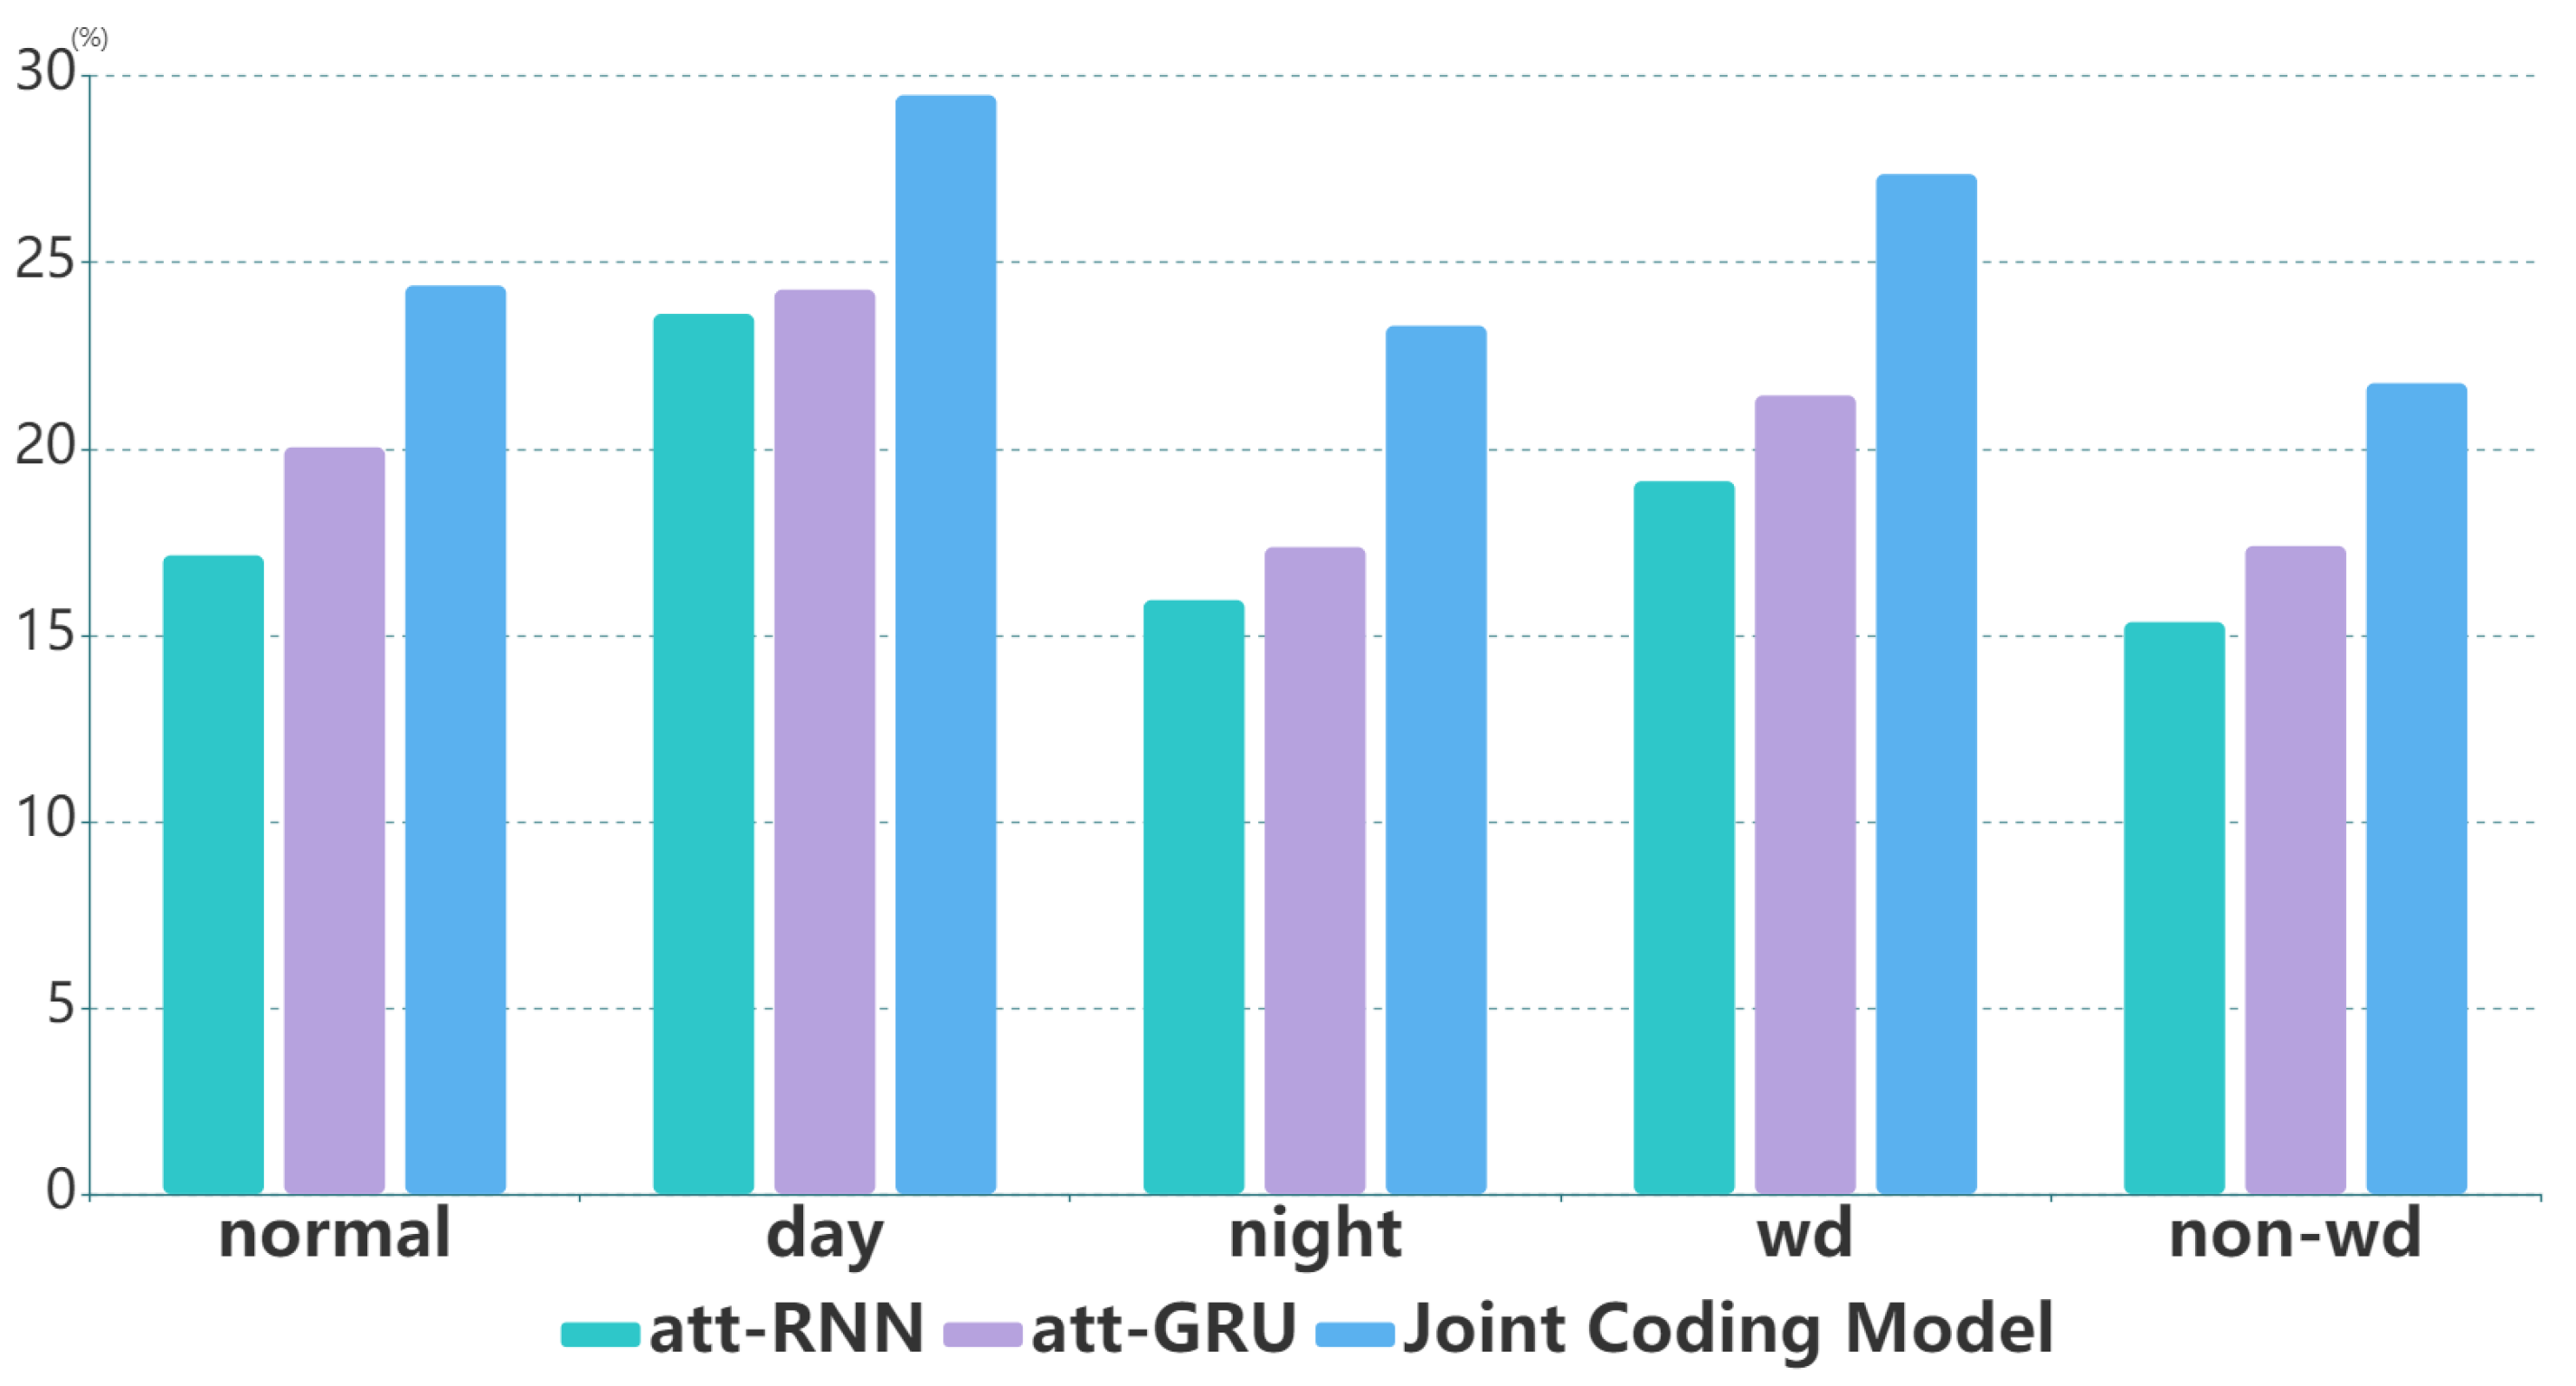
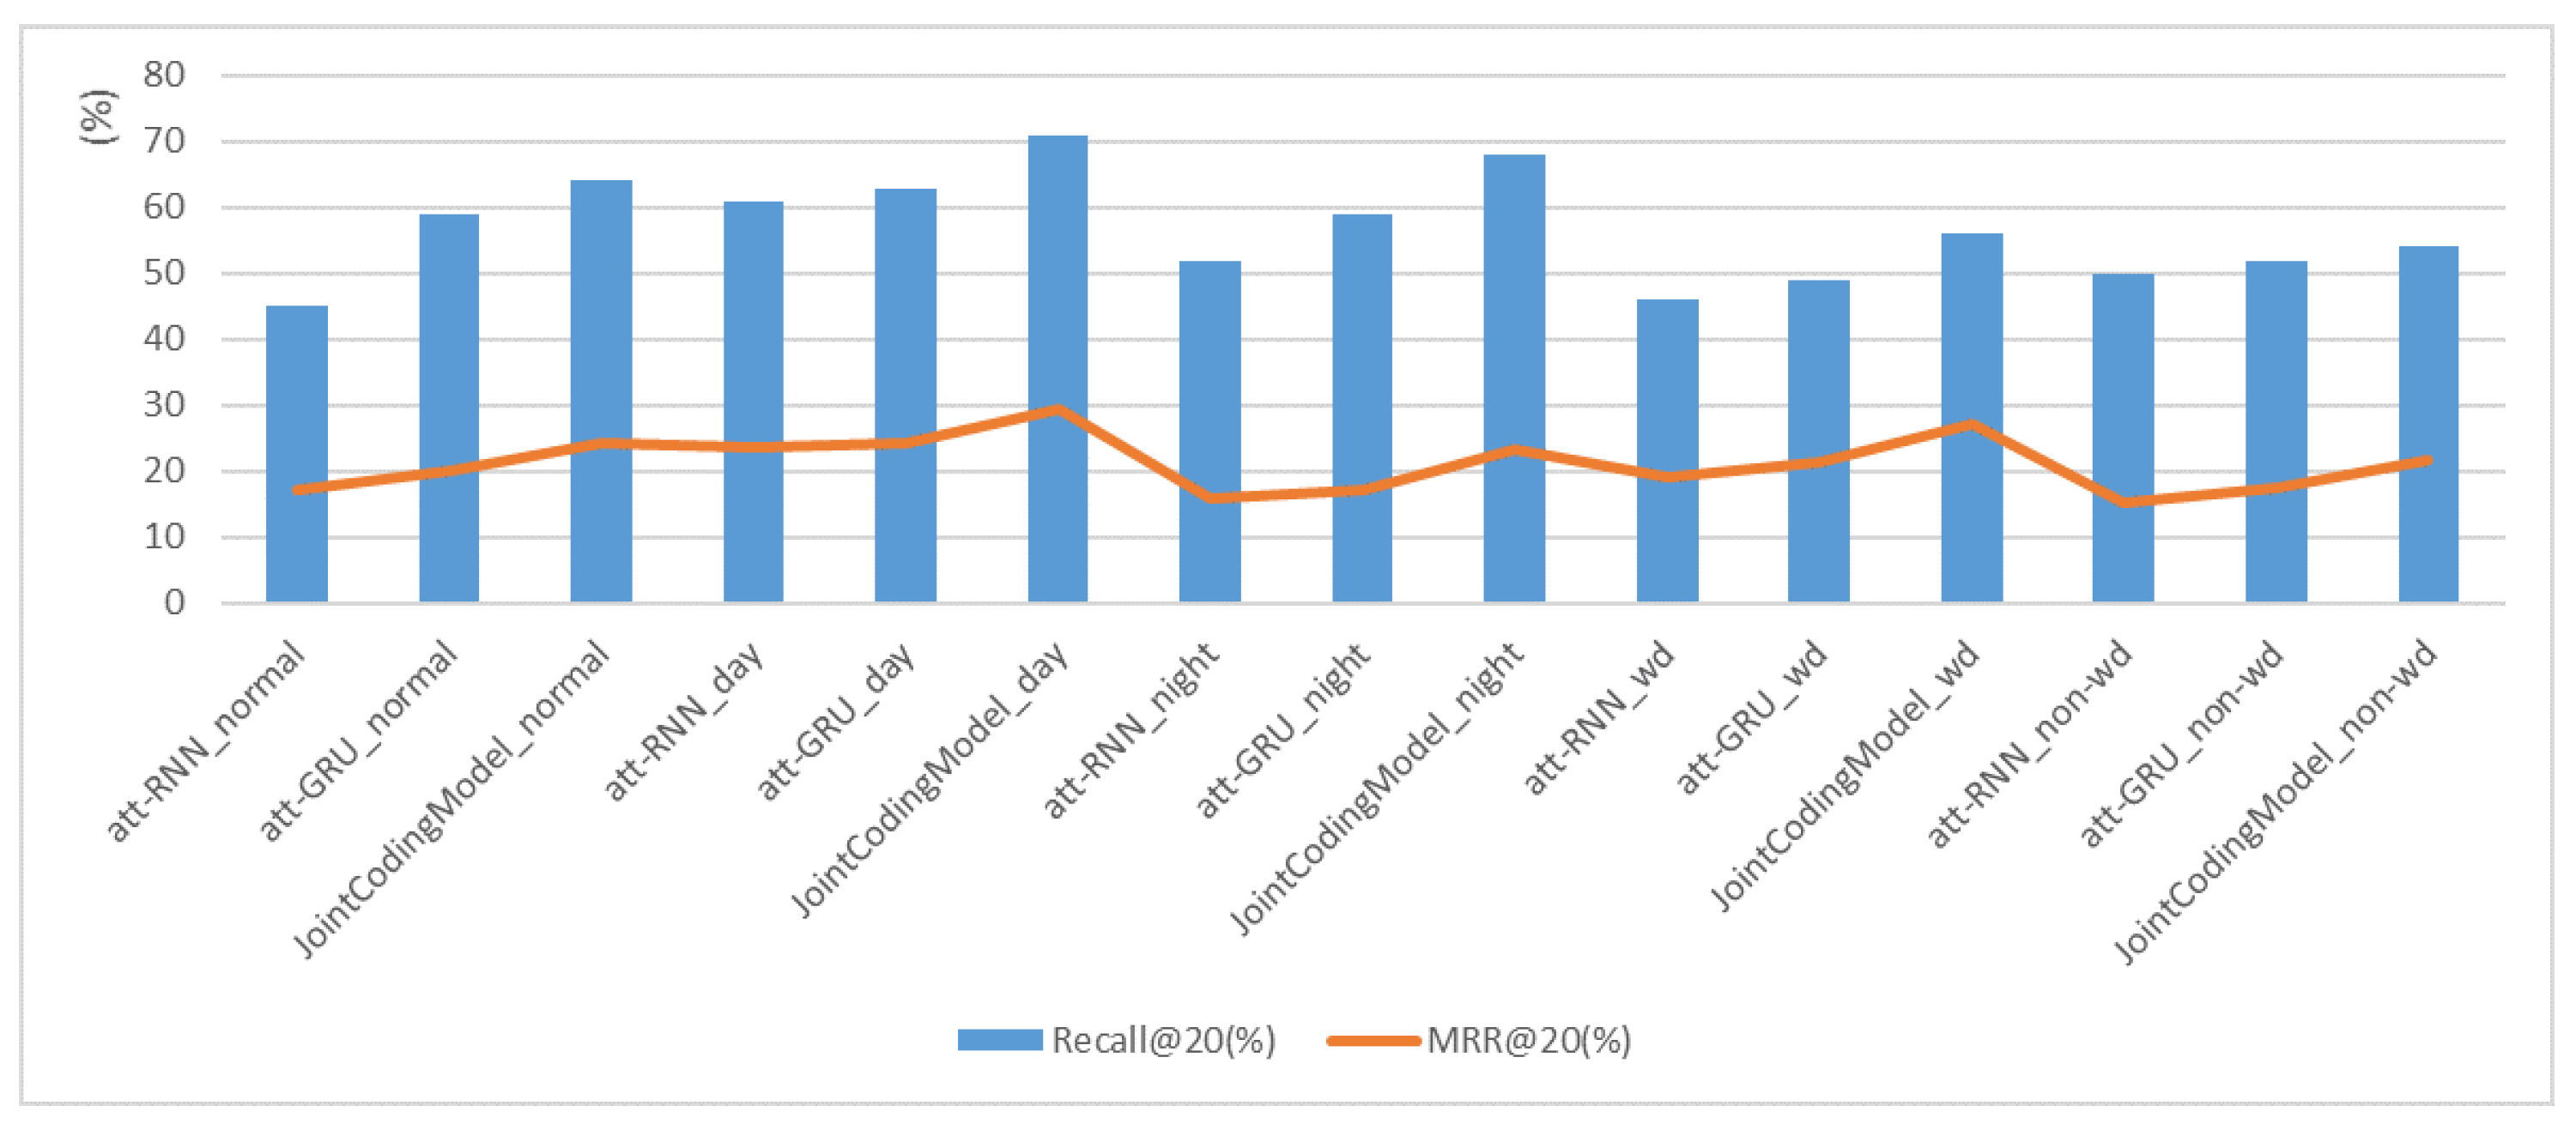
From Figure 4 and Figure 5, it can be found that in all groups, the Recall@20 and MRR@20 of joint coding model are always better than those of att-RNN and att-GRU, which illustrates the effectiveness of the local encoder and the global encoder, and also shows that the joint coding model has excellent performance in the field of monitoring strategy recommendation. Figure 6 shows that Recall@20 and MRR@20 have similar trends.

Figure 4.
The Recall@20 of different groups in experiment 1.

Figure 5.
The MRR@20 of different groups in experiment 1.
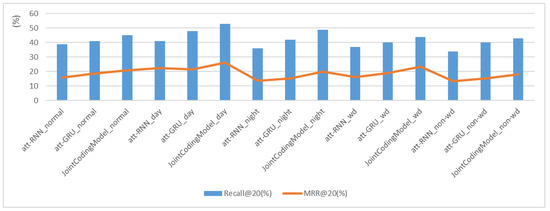
Figure 6.
Trends of Recall@20 and MRR@20 of different dimensional data in experiment 1.
Through experiment 1, it can be found that, benefiting from the summary of the entire sequence by the global encoder and the precise capture of the operation intent by the local encoder, the joint coding model is significantly better than att-RNN and att-GRU in the field of monitoring strategy recommendation.
3.2. Experiment 2
The data set is the difference between experiment 2 and experiment 1. The data set of experiment 2 excludes the data generated by the original monitoring strategy and only retains the logs manually operated by the operator. The experiment environment, grouping, and indicators are the same as experiment 1.
Comparing Table 2, Table 5 shows that the experimental effect on the normal group of experiment 2 is significantly better than that of experiment 1. The calculation of the weight is more accurate in the joint coding model, making it easier to determine which parts of the normal group should be emphasized or ignored in experiment 2. Without considering the time dimension, Recall@20 of att-GRU is 14% higher than that of att-RNN, and Recall@20 of the joint coding model is 19% higher than that of att-RNN. MRR@20 of att-GRU is 3% higher than that of att-RNN, and MRR@20 of the joint coding model is 4% higher than that of att-RNN. This shows that in the data set of experiment 2, the joint coding model is better than att-RNN and att-GRU without considering the time dimension.
Table 5.
Experimental results of the normal group.
Comparing Table 3, Table 6 shows that the experimental effect of the day–night group is significantly better than that of experiment 1. Since the joint coding model is more accurate in judging which part of the day–night group should be emphasized or ignored, its experimental effect is greatly improved. In the day group, Recall@20 of att-GRU is 2% higher than that of att-RNN, and Recall@20 of joint coding model is 8% higher than that of att-GRU. MRR@20 of att-GRU is 1% higher than that of att-RNN, and MRR@20 of the joint coding model is 5% higher than that of att-GRU. In the night group, Recall@20 of att-GRU is 7% higher than that of att-RNN, and Recall@20 of the joint coding model is 9% higher than that of att-GRU. MRR@20 of att-GRU is 2% higher than that of att-RNN, and MRR@20 of the joint coding model is 5% higher than that of att-GRU. This shows that in experiment 2, the joint coding model has better performance than att-RNN and att-GRU considering day and night.
Table 6.
Experimental results of day–night group.
Comparing Table 4, it can be found that the experimental effect of Table 7 in the group that distinguishes between working days and non-working days is significantly better than that of experiment 1. Considering working days and non-working days, Recall@20 of att-GRU in wd group is 3% higher than that of att-RNN, and Recall@20 of the joint coding model is 7% higher than that of att-GRU. Recall@20 of att-GRU in non-wd group is 2% higher than that of att-RNN, and Recall@20 of the joint coding model is 2% higher than that of att-GRU. MRR@20 of att-GRU in wd group is 2% higher than that of att-RNN, and MRR@20 of the joint coding model is 6% higher than that of att-GRU. MRR@20 of att-GRU in the non-wd group is 2% higher than that of att-RNN, and MRR@20 of the joint coding model is 4% higher than that of att-GRU. This proves that the summarization ability of the global encoder and the ability of the local encoder to capture operation intentions still have excellent effects in this experiment. It also shows that the joint coding model is better than att-RNN and att-GRU considering working days and non-working days.
Table 7.
Experimental results of the workday and non-workday group.
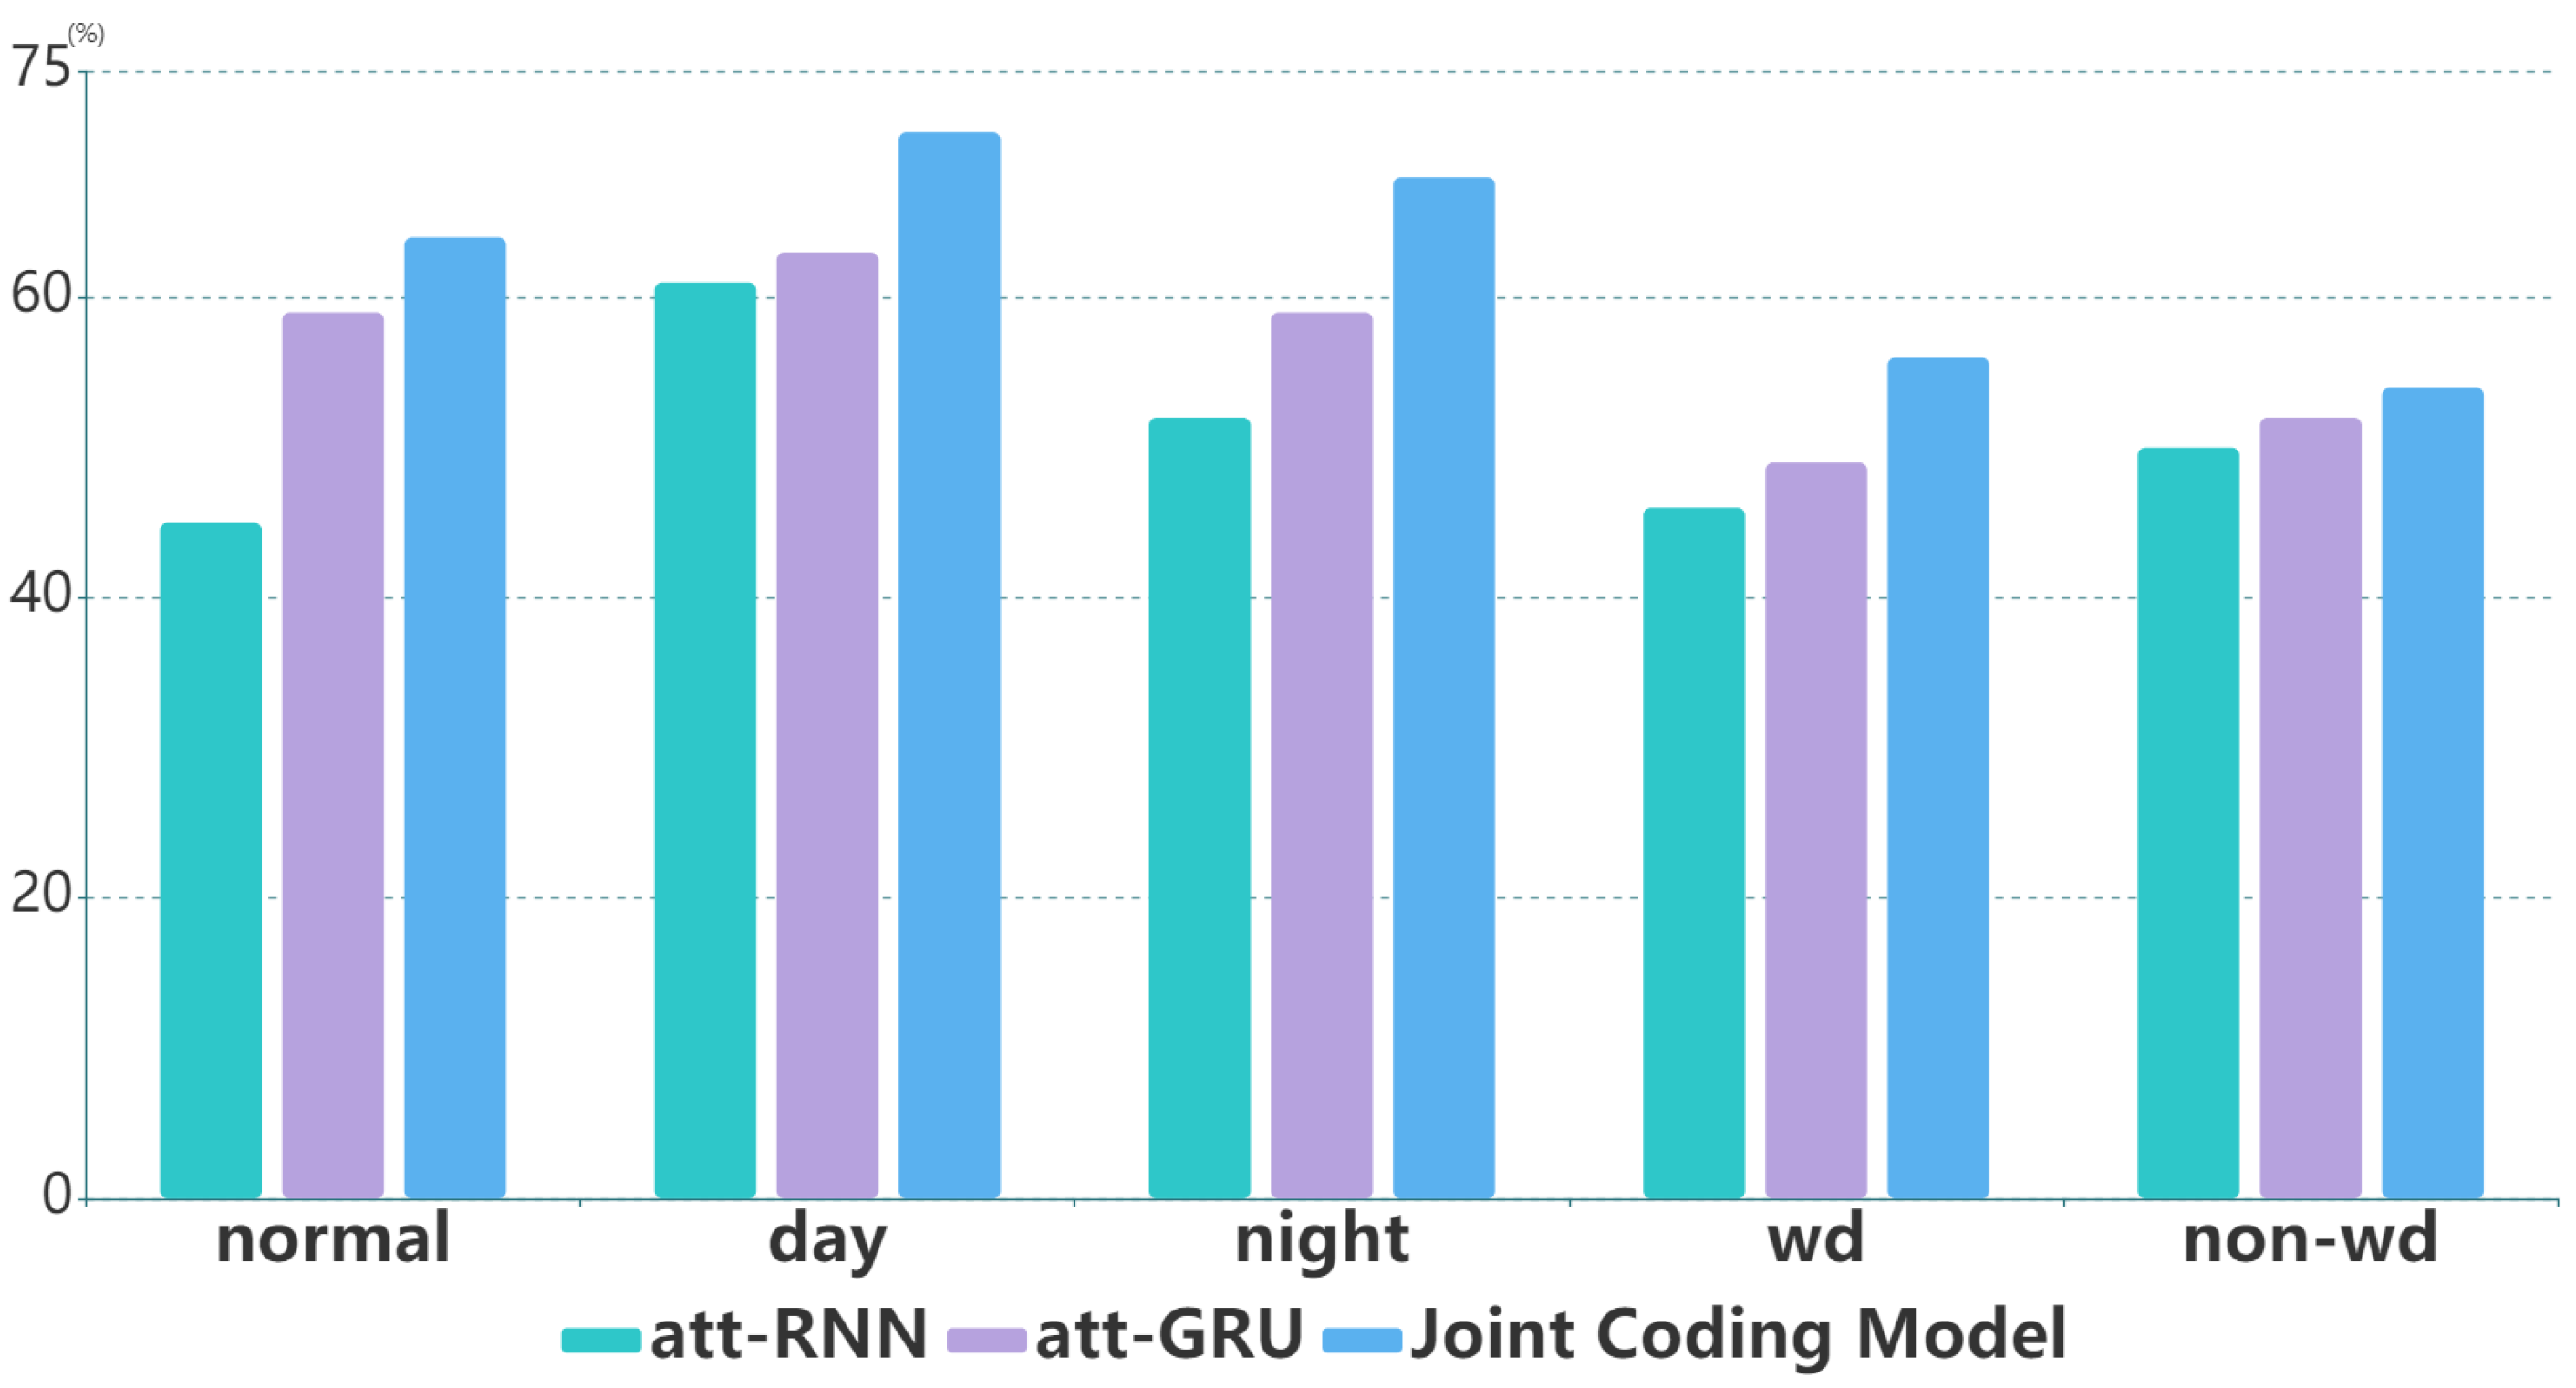
In experiment 2, Figure 7 and Figure 8 show that the benefit from the global encoder and local encoder is that Recall@20 and MRR@20 of the joint coding model are always better than att-RNN and att-GRU. This shows that the joint coding model has excellent performance in the field of monitoring strategy recommendation. Figure 9 shows that Recall@20 and MRR@20 have similar trends.

Figure 7.
Recall@20 of different groups in experiment 2.

Figure 8.
MRR@20 of different groups in experiment 2.

Figure 9.
Trends of Recall@20 and MRR@20 of different dimensional data in experiment 2.
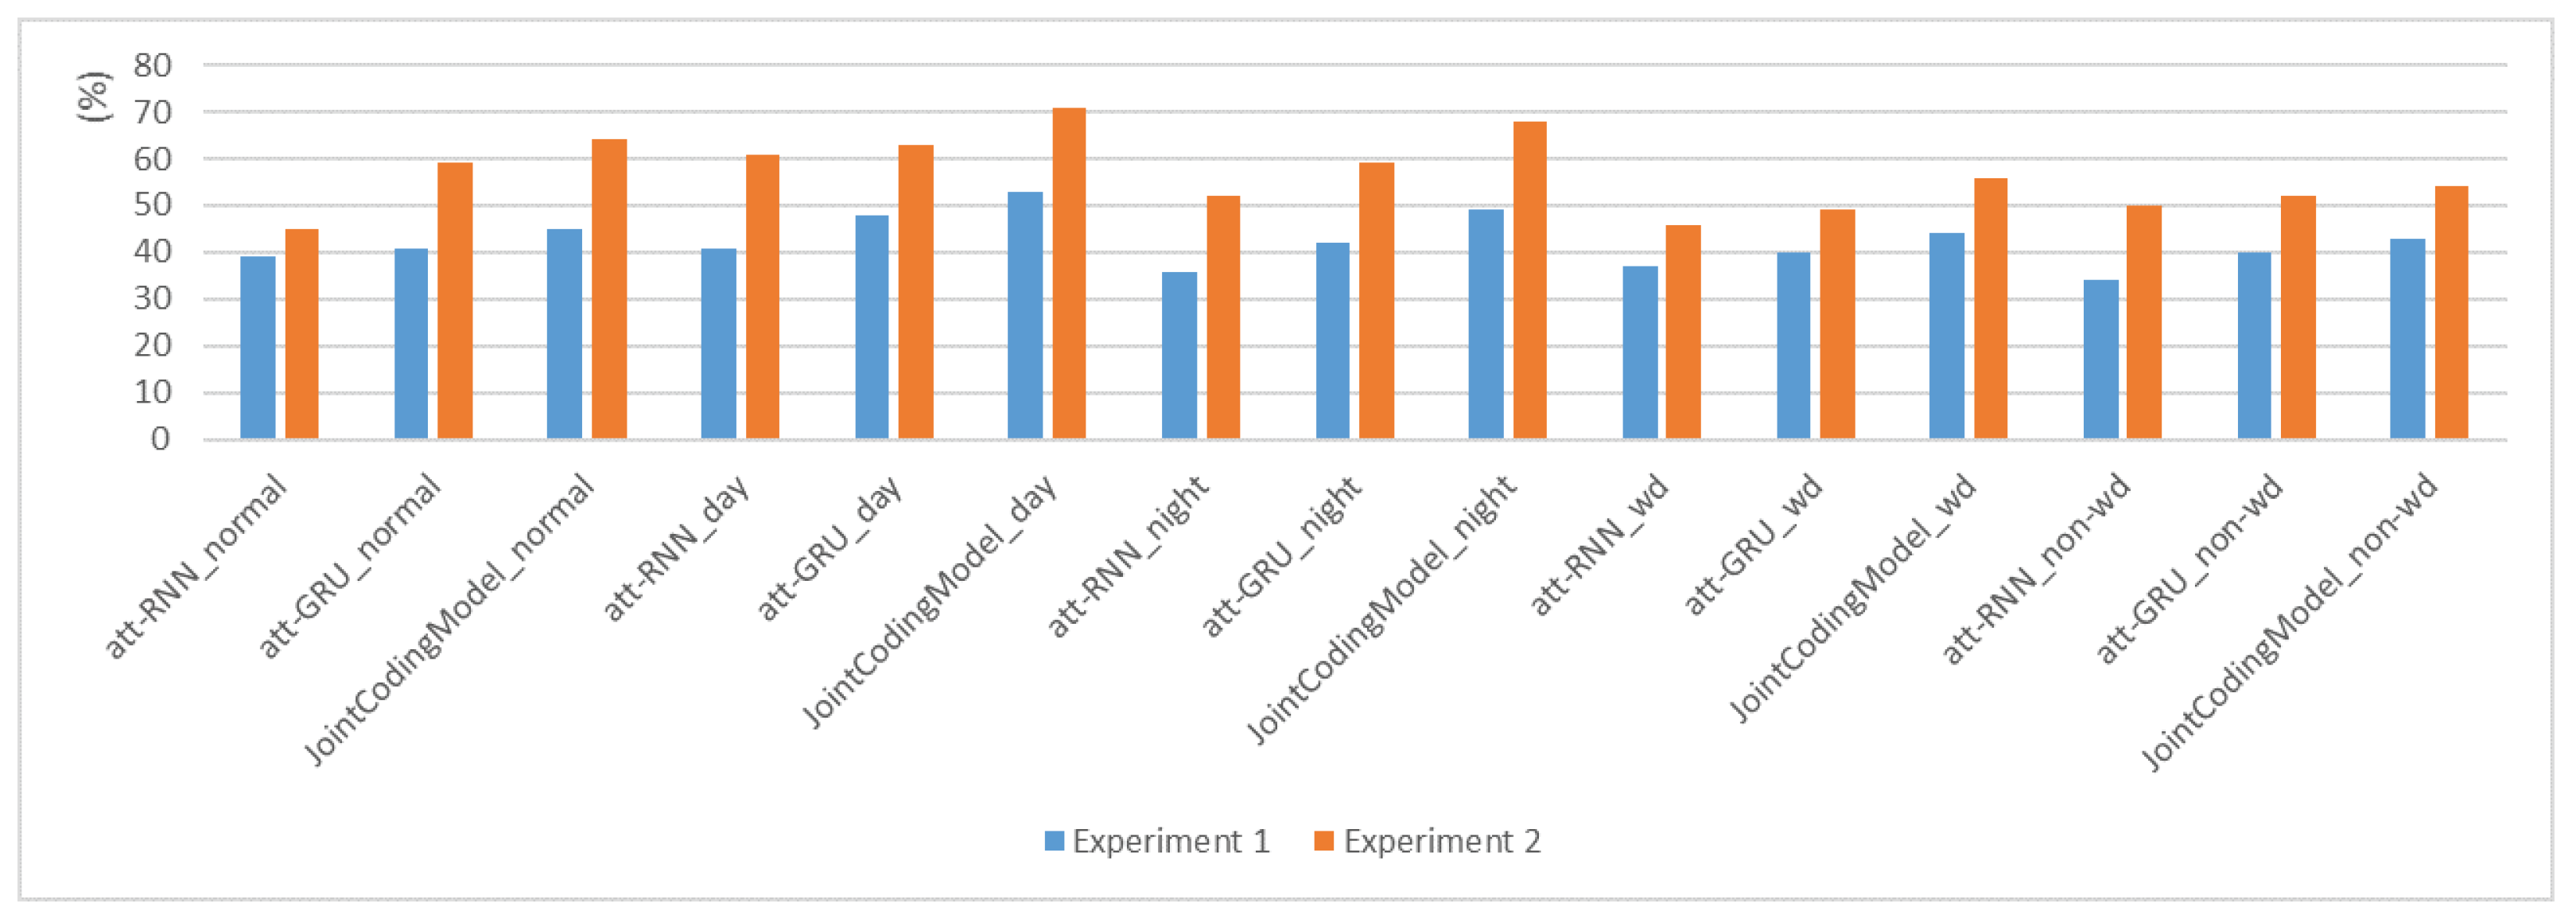
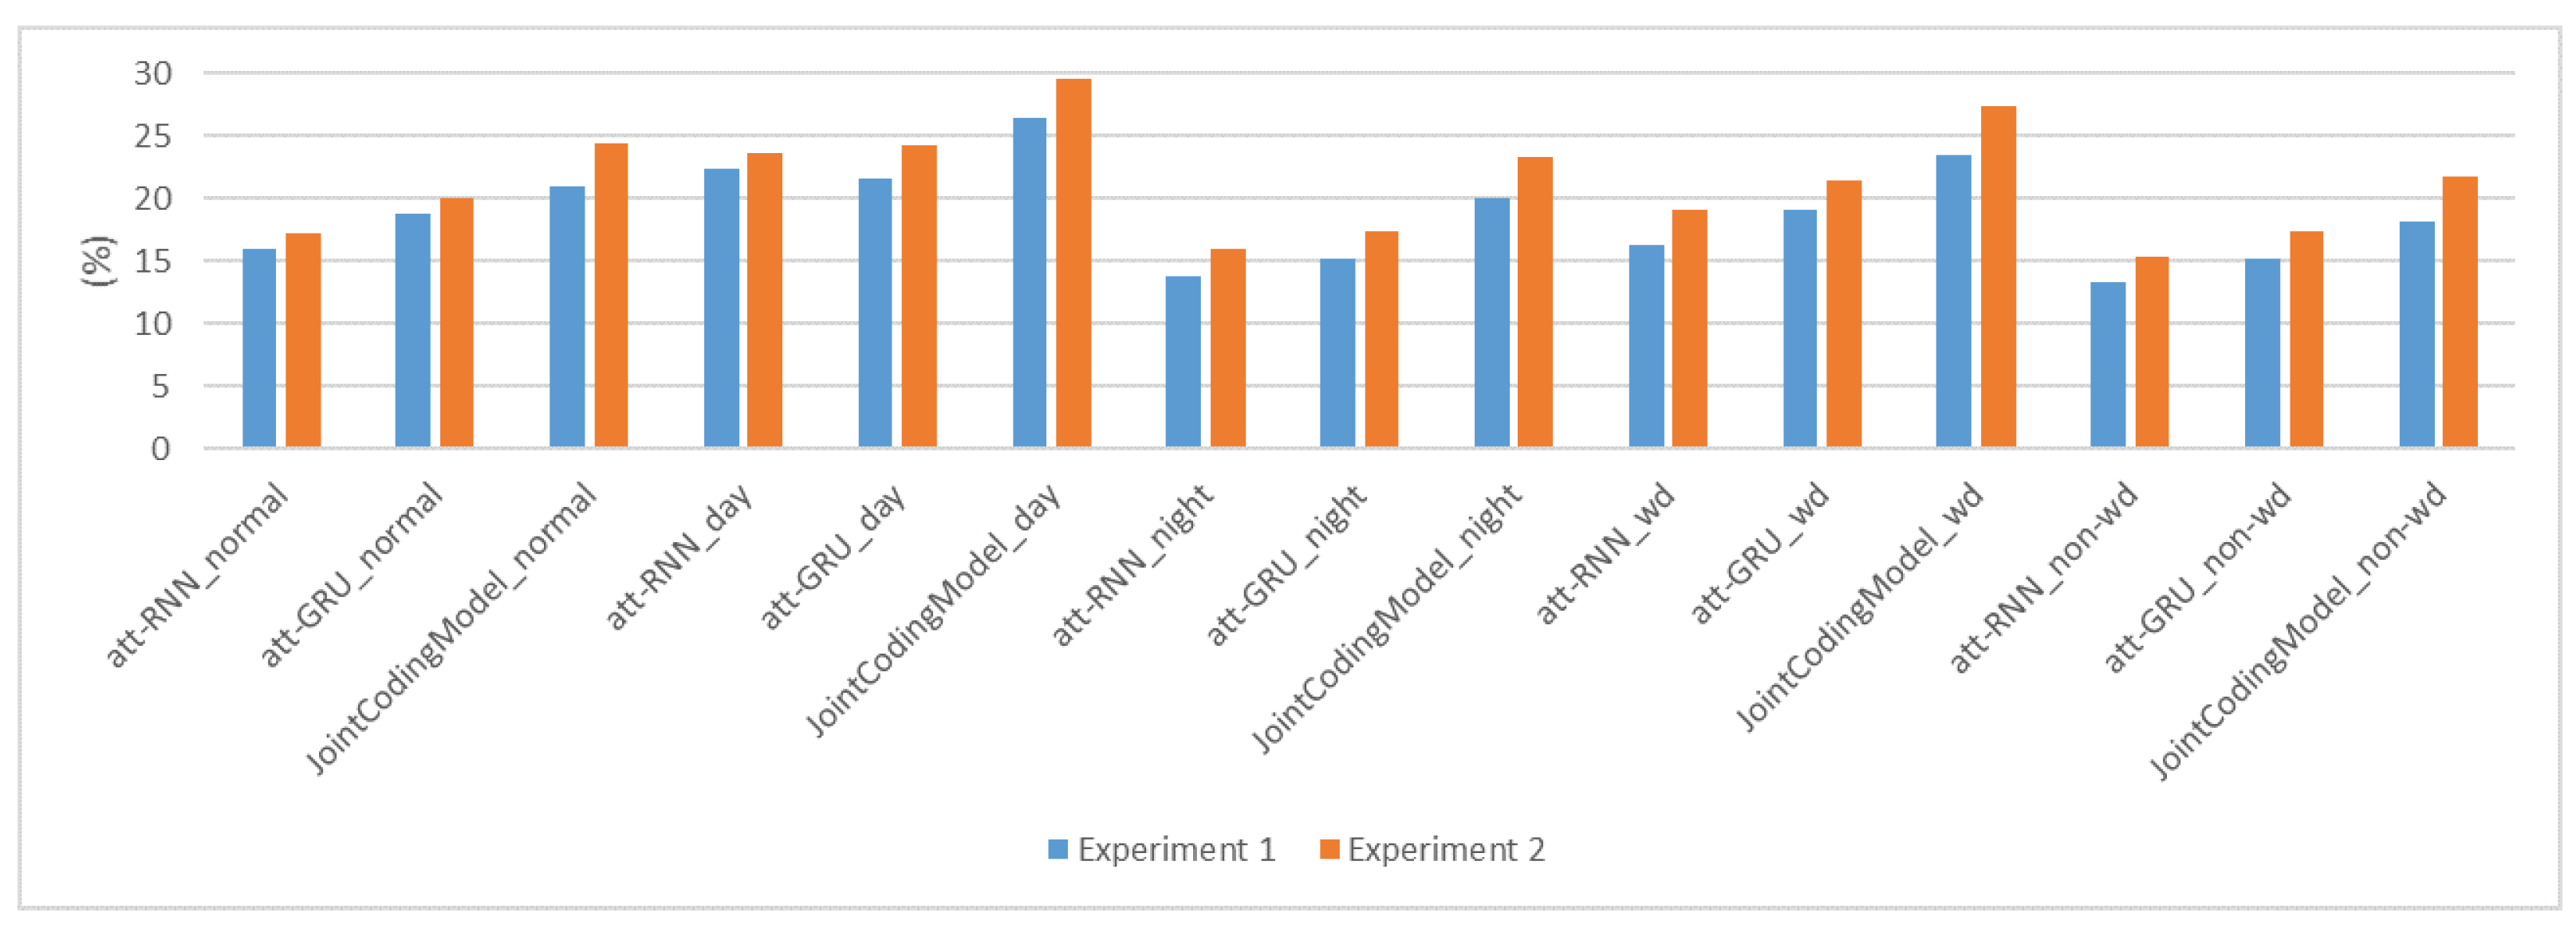
Figure 10 and Figure 11 show that both Recall@20 and MRR@20 of experiment 2 are higher than those of experiment 1. This indicates that the quality of the original monitoring strategy is low and the quality of the generated data is poor, which proves the necessity of OL-JCMSR.

Figure 10.
The results of Recall@20 with different dimensions in experiment 1 and experiment 2.

Figure 11.
The results of MRR@20 with different dimensions in experiment 1 and experiment 2.
4. Conclusions
OL-JCMSR, which contains a global encoder and a local encoder, is applied to the monitoring system. The global encoder is used to summarize the operation sequence, combined with the local encoder to determine the operator’s current intention so as to improve the quality of the monitoring strategy.
In order to verify the effectiveness of the joint coding model in the monitoring system, we conducted 15 sets of control experiments on each of the two data sets. Compared with att-RNN and att-GRU, the joint coding model in experiment 1 improves Recall@20 by 9.4% and 4.6%, respectively, and increases MRR@20 by 5.49% and 3.86%, respectively. In experiment 2, compared with att-RNN and att-GRU, the joint coding model is increased by 11.8% and 6.2% regarding Recall@20, and increased by 7.02% and 5.16% for MRR@20, respectively. This proves the effectiveness of the global encoder for summarizing the entire sequence and the effectiveness of the local encoder for capturing the operation intent. It also illustrates the advantages of OL-JCMSR. The results of experiment 2 are better than those of Experiment 1, which shows that the original monitoring strategy is inferior and proves the necessity of the method used in this paper.
It is also an interesting task to visualize the operation log to judge the risk of the operator’s operation, and it is also the content that we will continue to study in the future. At the same time, we will also verify whether the combination of operation logs and computer vision methods can improve the effect of the experiment.
Supplementary Materials
The following supporting information can be downloaded at: https://github.com/Guoqiang-Sun/OL-JCMSR (accessed on 25 June 2022).
Author Contributions
Conceptualization, G.S. and P.X.; methodology, G.S.; software, M.G. and H.S.; validation, Z.D. and H.S.; investigation, Y.L.; resources, Y.L.; data curation, Y.L. and G.S.; writing—original draft preparation, G.S.; writing—review and editing, Y.L. and B.Z.; project administration, Y.L.; funding acquisition, Y.L. All authors have read and agreed to the published version of the manuscript.
Funding
This work was supported in part by the Key Research and Development Program of China under Grant No. 2020YFC0832600, and in part by Major project of independent innovation in Qingdao under Grant No. 21-1-2-18-xx.
Institutional Review Board Statement
Not applicable.
Informed Consent Statement
Not applicable.
Data Availability Statement
The data used to support the findings of this study are available from the corresponding author upon request.
Acknowledgments
The authors would like to extend their gratitude and acknowledgments to all the participants for their time spent on this study.
Conflicts of Interest
The authors declare that there are no conflicts of interest regarding the publication of this article.
Abbreviations
The following abbreviations are used in this paper:
| SVM | Support Vector Machine |
| OCSVM | One-Class Support Vector Machine |
| OCN | One-Class Neural Networks |
| CNN | Convolutional Neural Network |
| ConvLSTM | Convolutional Long Short-Term Memory |
| att-RNN | Recurrent Neural Network+attention |
| att-GRU | Gate Recurrent Unit+attention |
| wd | Workday |
| non-wd | Non-workday |
References
- Mabrouk, A.B.; Zagrouba, E. Abnormal behavior recognition for intelligent video surveillance systems: A review. Expert Syst. Appl. 2018, 91, 480–491. [Google Scholar] [CrossRef]
- Ben, X.; Gong, C. Coupled Patch Alignment for Matching Cross-View Gaits. IEEE Trans. Image Process. 2019, 28, 3142–3157. [Google Scholar] [CrossRef] [PubMed]
- Ben, X.; Zhang, P. A general tensor representation framework for cross-view gait recognition. Pattern Recognit. 2019, 90, 87–98. [Google Scholar] [CrossRef]
- Ben, X.; Gong, C. Coupled bilinear discriminant projection for cross-view gait recognition. IEEE Trans. Circuits Syst. Video Technol. 2019, 30, 734–747. [Google Scholar] [CrossRef]
- Amin, J.; Anjum, M.A. Convolutional Bi-LSTM Based Human Gait Recognition Using Video Sequences. Comput. Mater. Contin. 2021, 68, 2693–2709. [Google Scholar] [CrossRef]
- Huang, T.; Ben, X. Enhanced Spatial-Temporal Salience for Cross-view Gait Recognition. IEEE Trans. Circuits Syst. Video Technol. 2022. [Google Scholar] [CrossRef]
- Feng, H.; Chang, H. OMNet: Object- Perception Multi-Branch Network for Pedestrian Re-Identification. Big Data Res. 2022, 27, 100302. [Google Scholar]
- Peng, X.; Cao, Y. Mining web access log for the personalization recommendation. In Proceedings of the 2008 International Conference on MultiMedia and Information Technology, Washington, DC, USA, 30–31 December 2008; pp. 172–175. [Google Scholar]
- Yin, C.; Acun, B. Tt-rec: Tensor train compression for deep learning recommendation models. Proc. Mach. Learn. Syst. 2021, 3, 448–462. [Google Scholar]
- Shi, K.; Wang, Y. EKGTF: A knowledge-enhanced model for optimizing social network-based meteorological briefings. Inf. Process. Manag. 2021, 58, 102564. [Google Scholar] [CrossRef]
- Shi, K.; Gong, C. Wide-grained capsule network with sentence-level feature to detect meteorological event in social network. IEEE Trans. Image Process. 2020, 102, 323–332. [Google Scholar] [CrossRef]
- Shi, K.; Lu, H. Automatic generation of meteorological briefing by event knowledge guided summarization model. Knowl. Based Syst. 2020, 192, 105379. [Google Scholar] [CrossRef]
- Zhu, Y.; Zhang, S. Social weather: A review of crowdsourcing-assisted meteorological knowledge services through social cyberspace. Geosci. Data J. 2020, 7, 61–79. [Google Scholar] [CrossRef] [Green Version]
- Schlkopf, B.; Williamson, R. Support vector method for novelty detection. Adv. Neural Inf. Process. Syst. 2000, 1, 582–588. [Google Scholar]
- Xu, D.; Ricci, E. Learning deep representations of appearance and motion for anomalous event detection. Br. Mach. Vis. Conf. 2015, 8, 1–12. [Google Scholar]
- Xu, D.; Yan, Y. Detecting anomalous events in videos by learning deep representations of appearance and motion. Comput. Vis. Image Underst. 2017, 156, 117–127. [Google Scholar] [CrossRef]
- Huang, S.; Huang, D. Learning multimodal deep representations for crowd anomaly event detection. Math. Probl. Eng. 2018, 2018, 6323942. [Google Scholar] [CrossRef] [Green Version]
- Chalapathy, R.; Menon, A.K. Anomaly detection using one-class neural networks. Br. Mach. Vis. Conf. 2018, 1, 1–13. [Google Scholar]
- Tung, F.; Zelek, J.S. Goal-based trajectory analysis for unusual behaviour detection in intelligent surveillance. Image Vis. Comput. 2011, 29, 230–240. [Google Scholar] [CrossRef] [Green Version]
- Cao, T.; Wu, X. Abnormal crowd motion analysis. In Proceedings of the 2009 IEEE International Conference on Robotics and Biomimetics, Guilin, China, 19–23 December 2009; Volume 1, pp. 1709–1714. [Google Scholar]
- Luo, W.; Liu, W. Remembering history with convolutional lstm for anomaly detection. In Proceedings of the 2017 IEEE International Conference on Multimedia and Expo, Hong Kong, China, 10–14 July 2017; Volume 10, pp. 439–444. [Google Scholar]
- Liu, W.; Luo, W. Future frame prediction for anomaly detection—A new baseline. In Proceedings of the IEEE Conference on Computer Vision and Pattern Recognition, Salt Lake City, UT, USA, 18–22 June 2018; Volume 1, pp. 6536–6545. [Google Scholar]
- Xie, Y.; Zhang, S. Abnormal Behavior Recognition in Classroom Pose Estimation of College Students Based on Spatiotemporal Representation Learning. Trait. Signal 2022, 38, 89–95. [Google Scholar] [CrossRef]
- Li, J.; Huang, Q. Variational Abnormal Behavior Detection With Motion Consistency. IEEE Trans. Image Process. 2022, 31, 275–286. [Google Scholar] [CrossRef] [PubMed]
- Li, J.; Ren, P. Neural attentive session-based recommendation. In Proceedings of the 2017 ACM on Conference on Information and Knowledge Management, Singapore, 6–10 November 2017; Volume 1, pp. 1419–1428. [Google Scholar]
Publisher’s Note: MDPI stays neutral with regard to jurisdictional claims in published maps and institutional affiliations. |
© 2022 by the authors. Licensee MDPI, Basel, Switzerland. This article is an open access article distributed under the terms and conditions of the Creative Commons Attribution (CC BY) license (https://creativecommons.org/licenses/by/4.0/).