1. Introduction
Today, thanks to advanced information technologies, almost everyone has access to a large amount of information. Statistical information is largely represented among this information. Probably the most represented currently are statistically evaluated data, mainly in the form of graphs, concerning the COVID-19 pandemic. According to Best [
1] “such statistics are not only intended to inform people, but to shape their attitudes and behavior.” Thus, the aim of statistics is not only to inform but, above all, to understand numerical information obtained in each context. At the same time, statistics seek to provide relevant evidence for the claims of experts in various fields as well as politicians. There is a broad consensus that in an increasingly quantitative world, it is essential to understand, interpret, and act on statistical information [
2]. Thus, statistics play a key role in fulfilling the Istanbul Declaration [
3], which promotes an evidence-based approach to social progress. The OECD recommends involving ordinary citizens in the development of society through appropriate investment in their statistical capacity. As a result of this OECD initiative, the availability of information in the form of statistical files is constantly increasing, which is gradually being made available by government statistical offices as well.
Providers of statistical information are encouraged to use all available technologies to help users understand the data provided [
4]. It follows that to participate fully in society, one needs to be able to interpret statistical information. These are presented in graphs, tables, or verbally, and it is necessary to be able to critically evaluate whether certain conclusions can be justified based on the presented statistical results [
5]. It has long been known that knowledge of statistics is essential in solving certain types of everyday problems [
6] and statistical understanding is an important part of the skills of workers in various sectors e.g., [
7,
8].
It follows from the above that statistics-based information is ubiquitous today. However, according to experts e.g., [
9,
10], citizens’ statistical skills are not at a level where accessible data can be used and interpreted appropriately. This fact is also a challenge for teachers who prepare students for their future role in society. The challenge is to find effective ways to use large sets of data that are commonly available in teaching. This challenge applies to both mathematics and non-mathematics teachers, where students need to understand evidence-based arguments. Curriculum areas, such as geography, citizenship, and sociology, deal with complex contexts where the situation is influenced by several factors and where real data are relevant.
These subjects currently make little use of relevant quantitative information because students are expected to have major difficulty understanding multidimensional data [
5]. The use of real data and their statistical interpretations is more interesting for students, but also for teachers, than working with data that lack a real context [
11]. Based on the results of the research [
12], it is necessary to strengthen the use of real data in school teaching, as teachers mostly use textbook data, which are not always up to date. Greater use of up-to-date data would create a suitable motivational environment for the development of students’ statistical literacy, not only in mathematics teaching. An explosion in the availability of information means that the term “statistical literacy” is currently considered a basic life skill of a fully functioning citizen [
5]. Our goal was to implement the results of pedagogical research into the content and form of the Statistics Seminar and experimentally verify the effectiveness of this new method of teaching, i.e., whether the implementation of a new method of teaching will increase students’ level of statistical literacy. The partial goal was to find out whether the changed design of the seminar will affect the perception of statistics by students.
2. Statistical Literacy
The term literacy is used to describe people’s skill to achieve targeted behavior in a particular area. Increasingly, this concept suggests a wide range of not only factual knowledge and certain abilities but also adequate critical attitudes [
13]. Thus, the definition of the term “statistical literacy” does not look for the minimum set of basic statistical knowledge and skills that a student (person) should master. Rather, it is a matter of defining a set of statistical knowledge and skills that will enable one to use statistical data appropriately in everyday life to shape one’s own attitudes and forms of behavior. At the same time, it should be noted that the concept of statistical literacy is a dynamic concept that changes flexibly with the changing requirements in real life for human statistical competencies. Broers [
14] states that experts had to solve two fundamental problems when trying to define statistical literacy. One is to determine exactly what a statistically literate citizen should know about statistics. The second problem was to determine what other than statistical knowledge was needed to achieve statistical literacy.
According to Wallman [
15], statistical literacy is the skill to understand and critically evaluate the statistical results that permeate our daily lives—along with the skill to appreciate the benefits that statistical thinking can bring in public, private, and professional lives.
Watson [
16] presented a statistical literacy framework consisting of three levels of increasing difficulty:
A basic understanding of probabilistic and statistical terminology;
An understanding of statistical language and concepts when placed in the context of a wider social debate;
The questioning position that can be taken in applying concepts to contradict claims without a proper statistical basis.
Gal [
13] extended the description of statistical literacy to cover two interrelated components:
According to Ben-Zvi and Garfield [
17], statistical literacy includes basic and important skills that can be used to understand statistical information or research results. These skills include the ability to organize data, create and display tables, and work with various data representations. Statistical literacy also includes an understanding of concepts, vocabulary acquisition, and the symbols used in statistics, and it includes the perception of probability as a measure of uncertainty. A person who has achieved statistical literacy has acquired the skill to explain statistical processes and fully interpret statistical results. At the same time, they will develop aspects of statistical thinking, where “statistical thinkers” are able to criticize and evaluate the results of a solved problem or a statistical study [
17].
Watson and Callingham’s analyses [
18,
19] led to the introduction of one basic variable for statistical literacy, which can be described by six levels. The increasing levels reflect more knowledge of statistical procedures, for example, concerning tables, graphs, averages, and probabilities; a better appreciation of the variations and contexts they encounter in tasks; and increased critical thinking in decisions that acknowledge uncertainty. Only at the highest level are students able to apply an understanding of proportional reasoning in performing statistical tasks.
The above attempts to define statistical literacy involve several important ideas. Wallman [
15] emphasized the ability to appreciate, understand, and evaluate the statistical evidence that affects our daily lives. Gal [
13] emphasized the ability to interpret, evaluate, and communicate statistical evidence and provided an initial model that assumes that statistically literate behavior includes both a knowledge component and a dispositional component. Ben-Zvi and Garfield [
17] sought to distinguish statistical literacy from statistical reasoning and statistical thinking in terms of the types of understanding or cognitive outcomes. Watson and Callingham [
18,
19] established a hierarchy within statistical literacy. This indicated the direction in which the gradual development of statistical literacy should go.
The findings of Callingham and Watson [
20] suggest that this hierarchy provides a sound basis for school-level curriculum development. At the same time, their research confirmed that the statistical literacy hierarchy can be used to monitor progress and that students can improve their performance through targeted and appropriate teaching. Overall, a suitable definition of statistical literacy has been found. It is clear from the above that the concept of statistical literacy includes basic and important skills that can be used to understand statistical information or research results. These skills include the ability to organize data, create and display tables, and work with various data representations. Statistical literacy also includes an understanding of concepts, vocabulary, and symbols and includes an understanding of probability as a measure of uncertainty.
4. Description of a New Way of Teaching a Statistics Course
As we have already mentioned, the problem in traditional statistics courses is usually the lack of motivation among students. It is important for students and their performance to be motivated and engaged in learning the subject [
31,
32]. Students’ motivation can also be strengthened by changing the focus of the course [
33]. Based on the above findings, we tried to motivate future humanities teachers to actively develop their own statistical literacy in our research by changing the focus of the seminar on statistics. We focused the statistics course on the application of statistical methods in pedagogical diagnostics. Diagnostic competence is generally considered to be a teacher’s skill to assess the learning and behavior of their students according to predetermined criteria. In addition, diagnostic competence includes the skill to support the learning processes of individual students [
34,
35]. Diagnostic competence can be considered as a “cross-cutting” competence and its level fundamentally affects the level of other competencies of the teacher. The skill to diagnose usually goes hand in hand with the quality of the teacher: they can adapt their teaching to the individual needs of their students [
36,
37]. Diagnostic competence is basically the teacher’s skill to recognize students’ abilities, assumptions, and specific characteristics and, subsequently, to positively influence students’ learning processes and performance [
38,
39].
A diagnostically competent teacher can match the assigned tasks with the knowledge and skills of their students [
40]. This change of focus means focusing the course on the real problems of the teacher, which is important in teaching statistics for non-mathematicians [
41]. According to Roboack, the main goal of the statistics course is for students to develop statistical literacy and understand the basic elements of statistics that can help them critically evaluate data outcomes in their area of interest and in their professional lives. Cobb [
42] noted that most courses can be improved by emphasizing the use of empirical data and the concepts to which the data relate, at the expense of students having fewer statistical theories and fewer “recipes” for solving statistical problems. Thus, students should develop their statistical literacy by doing statistics and not statistical calculations [
43]. Therefore, in our course, we did all the statistical calculations using the generally available Excel program, and thus we tried to eliminate students’ problems with mastering mathematical calculations [
44].
In agreement with the students of the teacher’s study program, we planned a pedagogical experiment within the subject “Statistics Seminar”, which was voluntarily attended by 23 students—future teachers of humanities. The aim of the experiment was a statistical verification of the students’ own diagnostic competencies using statistics methods as future teachers of humanities. In the previous semester, these students had attended a seminar called Pedagogical Diagnostics, in which they acquired the basic diagnostic competencies of a teacher. During the seminar Pedagogical Diagnostics, the students became acquainted with, among other things, the classification sheet of talents [
45], which we used in our planned pedagogical experiment.
At the first meeting of the Statistics Seminar, we asked students to fill in an anonymous questionnaire of their own design—pre-test. The questionnaire contained twelve questions. In creating the concept of the self-assessment questionnaire, we used the concept of Soto-Andrade [
46], who conducted research focused on self-assessment. In his research, Soto-Andrade concluded that self-assessment is one of the possible ways to obtain feedback and thus a basis for improving the learning process. The aim of the questionnaire in our case was to self-assess students’ own statistical literacy and their perception of statistics before completing our proposed model of teaching statistics. Subsequently, according to Wallman [
15], we divided the items (questions) included in the questionnaire into three dimensions:
Dimension A: the ability to interpret and critically evaluate statistical information;
Dimension B: the ability to appreciate the benefits that statistical thinking can bring in public, private, and professional life;
Dimension C: the perception of statistics. Within dimension C, we surveyed the perception of statistics by students.
Questions no. 1, 3, 4, and 10 were included in dimension A, questions no. 2, 5, 6, and 8 were included in dimension B, and questions no. 7, 9, 11, and 12 in dimension C. It is recalled that the answers to the questions were scaled, so students had the opportunity to choose one of the options from a five-point scale from 1 (disagree) to 5 (agree) when answering each question.
Before starting a new, experimental way of teaching a Statistics Seminar, we made the following working hypothesis:
Hypothesis 1 (H1). The proposed innovative way of teaching statistics will increase students’ statistical literacy.
To verify the validity of the research hypothesis, we conducted a pedagogical experiment with students—prospective teachers—which was the basis of the proposed method of teaching statistics. Subsequently, after completing our proposed innovative model of teaching a Statistics Seminar, i.e., with an interval of 13 weeks, we asked the same students to fill out a questionnaire (post-test), which contained the same questions as the pre-test. Subsequently, we verified the validity of the research hypothesis H1 by statistical analysis and comparison of the results of the pre-test and post-test.
A new way of teaching statistics—the procedure.
To acquaint students with the use of several statistical methods and tools in the field of pedagogical diagnostics, we held Statistics Seminar in three basic phases.
In the first phase of the seminar, we focused with students (future teachers) on the implementation of data collection. Data collection took place within the monthly pedagogical practice of those students in the teaching study program who also attended the seminar on statistics. Students had to identify gifted pupils in the form of observation during classes and during breaks within their monthly pedagogical practice. The students, based on personal judgment, selected those pupils they considered gifted.
In the second phase of the seminar, the students again evaluated the students, but this time the evaluation was carried out using the Talent Classification Sheet (TCS). We remind you that TCS allows an indicative assessment of the level of students’ talent in the classroom, regardless of school success. To maintain the anonymity of the pupils, their names were replaced by codes. Students (future teachers) evaluated TCS in the class in which they performed each student’s internship, using twenty-one items, through a five-point scale, with one being the best grade and five the worst. According to this criterion, each student in the class created a ranking of pupils according to TCS, which is also freely available at
https://vudpap.sk/wp-content/uploads/2019/01/vudpap-informacie-Klasifikacny-harok-talentov-v-ZS.pdf (accessed on 27 April 2022).
In the third phase of the seminar, we worked with students to evaluate the data obtained using selected statistical methods. At the same time, we placed great emphasis on the interpretation of the obtained results of statistical data evaluation, because one of the goals of this part of the seminar was to make students aware that developed statistical literacy contributes to increasing their diagnostic competencies, i.e., the use of statistical methods allows them to verify working hypotheses.
In this part of the seminar, we therefore sought an answer to the following research hypothesis:
Hypothesis 2 (H2). Are the diagnostic competencies of all twenty-three students (prospective teachers) developed to the extent that they can objectively assess students’ abilities in two ways: through observation and through the “Talent Classification Sheet”?
In search of the answer to the given question, we challenged the students to, first, graphically represent the obtained evaluations of pupils, which were carried out by students—future teachers in pedagogical practice in 13 classes (
Figure 1). In search of the answer to the given question, we first graphically represented the obtained evaluations of pupils, which were carried out by students—future teachers within the pedagogical practice in 13 classes (
Figure 1). Results—we compared the arithmetic average of the point score of the selected pupils with the average score of other pupils in each class (
Figure 1).
We pointed out to the students that, in
Figure 1, we can see that the “selected pupils”, as expected, achieved a lower score on average in the overall score, calculated according to the Talent Classification Sheet. These results show that future teachers (students, internships) were able to identify more capable pupils in the class based on their observations. However, their assessment was not comprehensive for all selected pupils. We can also see from the graph that in classes C, E, I, and M, the difference between the compared groups of pupils (“selected” and others) is the least significant. Probably, the pupils in these classes did not manage to identify the group of so-called “Selected” pupils.
In the next part of the experiment, in cooperation with the schools where the students’ internships took place, the teachers gave the pupils of the examined classes selected tasks from the intelligence tests. In this case, the higher the number of points obtained meant a better result of the pupil in the intelligence test. Data from intelligence tests were processed by students (trainees), each for “their” class. This is because they calculated, in each class, the average scores obtained by the selected pupils as well as the average scores of the other pupils. Subsequently, the students presented both results graphically. Subsequently, both results were plotted. We remind you that pupils with higher intellectual abilities achieved higher scores in the intelligence test (
Figure 2).
In
Figure 2, we see that in all classes, except those already mentioned in classes C, E, I, and M, as expected, the selected students achieved significantly better scores from intelligence tests than other students.
In the next part, we informed students that to assess the level of their own diagnostic competencies, it is necessary to compare the compiled order of students according to TCS in each class and the order based on the results of intelligence tests. In other words, we compared with the students (future teachers) the rankings they assigned to the pupils in the individual classes based on TCS with the rankings of the pupils according to their score obtained in the tasks from the intelligence tests. Thus, we wondered if there was a relationship between students’ scores in TCS and students’ scores in intelligence tests.
We pointed out to the students that in case of connection verification, we would like to use parametric t-tests and Pearson’s correlation coefficient, while we emphasized the conditions for the use of these statistical methods. We explained to the students that because the above methods can be used only if the assumption of a normal distribution of the statistical set is met, we first verified the hypothesis of a normal distribution of the observed features by the Shapiro–Wilk test. Given that, based on the results obtained by the Shapiro–Wilk test, the assumption of a normal distribution of the observed traits was not met, to verify the relationship between the two traits, we used nonparametric methods between the pupils’ scores in TCS and the scores obtained in the intelligence tests, namely the Spearman rank correlation coefficient R, which, like the Pearson correlation coefficient, takes values from the interval ⟨−1, 1⟩. The students calculated the correlation coefficient in Excel (Real Statistics).
To express the degree of connection between the two features, i.e., between the pupils’ score in TCS and the score obtained in the intelligence tests, we used Spearman’s rank correlation coefficient R, which takes values from the interval ⟨−1, 1⟩. The students calculated the correlation coefficient in Excel. The students clearly listed the calculated values of the Spearman rank correlation coefficient in
Table 1.
Based on the results shown in
Table 1, we, together with students, can state that between the score given to pupils in TCS and the score obtained by students in intelligence tests in individual classes, there is a significant degree of binding in 9 classes (A, B, D, F, G, H, J, K, L). This means that in these classes, students (future teachers) have identified gifted pupils well. There is a moderate or weak correlation dependence in four cases, namely in classes C, E, I, and M. This low value of the rank correlation coefficient R in classes C, E, I, and M confirmed our assumption that not all future teachers are able to reliably assess the above-average level of development of the pupils’ mental abilities and thus identify the gifted or the most capable pupils. Therefore, diagnostic competencies are not sufficiently developed in some future teachers. If we generalize the results in individual classes, then we can state that most future teachers are able to use the Classification of Talents to identify gifted and the most capable pupils in the class.
Finally, together with the students (future teachers), using Spearman’s correlation coefficient, we calculated the degree of agreement between the performance of the observed pupils and their results in the intelligence test (R1) and the degree of agreement between the performance of the observed pupils and their score achieved in TCS (R2). The results are shown in
Table 2. We proceeded in the same way as in the previous case when calculating the coefficient of rank correlation between the mentioned features.
Based on the results shown in
Table 2, students who conducted the above pedagogical experiment in statistics can assess how closely the pupils’ results in the intelligence test are related to their learning outcomes, which are presented by their average achievement (R1). For example, in classes E, F, and H, there is an extremely high degree of agreement between intelligence and benefit, and in the other classes, there is a high degree of agreement. Based on these findings, we discussed with students the possible aspects that arise from this finding for evaluating the quality of work of teachers teaching in the given classes. We also discussed with the students in the seminar how it would be possible to evaluate the pupils’ approach to learning and fulfilling their school responsibilities in other ways. Based on the calculated values of the coefficient R2, it is also possible to compare the degree of agreement between the evaluation of students through TCS and their benefit. The results show that it is in classes C, E, I, and M where students—interns—least reliably identified gifted pupils, and there is also the lowest (medium) degree of agreement between the evaluation of students’ giftedness using TCS and their average benefit. In conclusion, the students were pointed out to the fact that this finding also supports the demonstrable reliability and argumentative power of statistical data processing.
5. Statistical Analysis of Research Results (Comparison of Pre-Test and Post-Test Results)
As we have already mentioned, we were also interested in whether the implementation of a new method of teaching statistics changed students’ self-esteem, not only in dimensions but also in individual issues. The main research hypothesis (H1: The proposed innovative method of teaching statistics will increase students’ statistical literacy…), for this reason, was divided into two working hypotheses H1a and H1b as follows:
Hypothesis 1 (H1a). Students’ self-assessment in the pre-test and post-test in individual dimensions will be different.
Hypothesis 1 (H1b). Students’ answers to the same questions in the pre-test and in the post-test will be different.
As we have already mentioned, we were interested in whether, by conducting pedagogical research within the Statistics Seminar, students changed their attitudes in individual dimensions—and if so, in which dimensions the respondents (students) had statistically significant changes. We first calculated the average scores obtained by the respondents in the individual dimensions in both the pre-test and the post-test (
Table 3).
In
Table 3, we can see that the values of the achieved scores in the individual dimensions in the pre-test and in the post-test are different. We wondered if these differences were also statistically significant. Because the assumption of a normal distribution of observed traits was not met, we used the nonparametric Wilcoxon signed-rank test, which is a nonparametric analogy of a paired parametric t-test, to verify the statistical significance of differences in the level of observed traits.
The observed features in our case were X and Y, where X is the average values of the answers to questions in dim A (i.e., dim B, dim C) before the start of the pedagogical experiment (in the pre-test) and Y is the average values of the answers after its completion (in the post-test).
We tested hypothesis H
0: the distributions of the characters X and Y are the same as the alternative hypothesis H
1, that they are not the same. We implemented the test in the STATISTICA program. After entering the input data, we received the following results in the computer output for each dimension: the value of the test criterion Z of the Wilcoxon one-sample test and the value of the probability
p (
Table 4).
We evaluate the test using a p-value. Because the calculated p-value of probability is a small number in dimensions A and B, we reject the tested hypothesis H0 at the significance level α = 0.01. This means that the implementation of the pedagogical experiment significantly changed the answers of students in dimensions A and B. However, in the case of dimension C, hypothesis H0 cannot be rejected (p = 0.226). This means that in dimension C, the students’ responses did not change significantly, i.e., there was no statistically significant change in self-assessment.
- II.
Validation of the working hypothesis H1b (comparison of answers to individual questions in the pre-test and post-test).
We first calculated the average values of the respondents’ answers to individual questions in both tests (
Figure 3).
From
Figure 3, we can see that some average values of respondents’ answers to individual questions in both tests are different. Again, we were interested in whether these differences between the two tests in the answers to the individual questions are also statistically significant. To verify the validity of the working hypothesis H1a, we used nonparametric test methods, namely the
—independence test for a contingency table of type
.
—using the independence test for the contingency table
k ×
m, we verified whether the answers to each of the 12 questions of the respondent are related to whether the respondent answered the given question in the pre-test or in the post-test. In this case, too, we performed the test using the STATISTICA program. After entering the input data in the computer’s output report, we received a contingency table for each question, the value of the test criterion
test and the value of
p (
Table 5).
Based on the results shown in
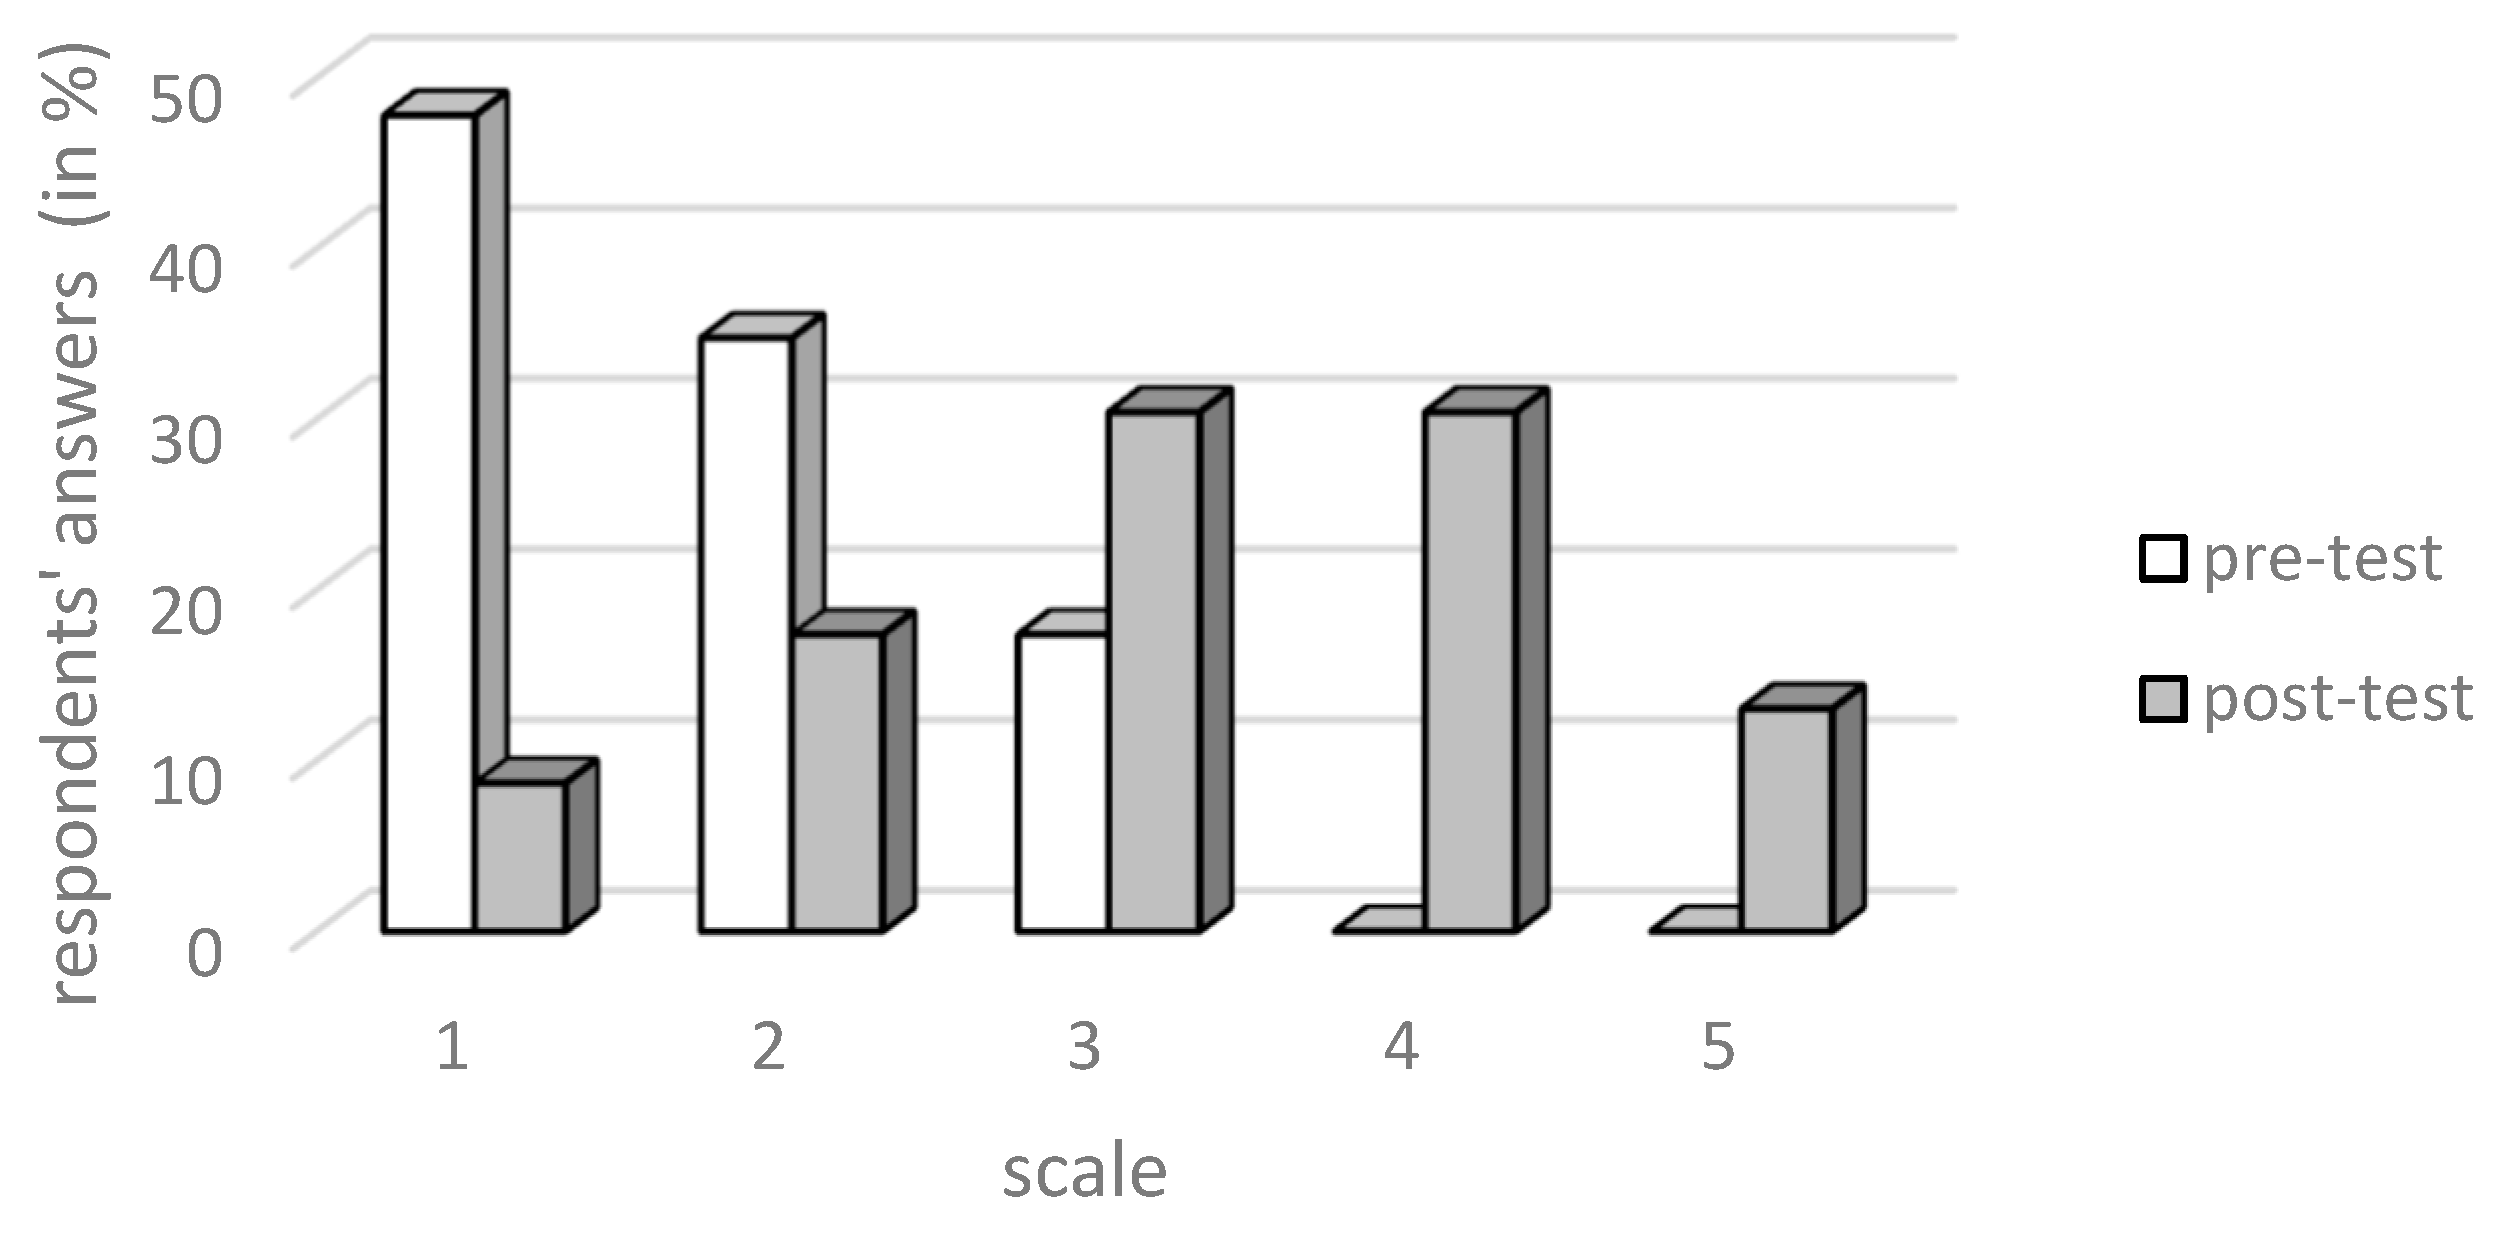
Table 5, we can see that within dimension A, there were statistically significant changes in the answers to questions 1, 4, and 10. A statistically significant difference in the answers to question 1 (I can correctly interpret the pre-test statistical information as in the post-test) is illustrated in
Figure 4.
In
Figure 4, we can see that in the pre-test, up to 75% of students evaluated their ability to interpret statistical information as low, but in the post-test, already 78% of students evaluated this ability positively. There was a similar change in self-assessment in the answers to questions 4 and 10. In the case of comparing the answers of the respondents to question no. 3 (controlling the calculation procedures will increase my ability to evaluate statistical data), in the pre-test and post-test (
Table 5), we state that the difference in the answers is not significant. This means that the students answered the question in both the pre-test and the post-test.
In
Table 5, we can also see that, in dimension B, there were statistically significant changes only in the answers to questions 2 and 8. To compare the results more clearly, we expressed the individual levels of the responses of the respondents from the given scale to question 2 in the pre-test and post-test in percent (
Figure 5).
Based on the results obtained using the
test and from
Figure 5, it follows that the respondents had a notable change in self-evaluation, from a negative to a positive evaluation. While 43% of the respondents answered positively in the pre-test, in the post-test, it was up to 100% who agreed with the statement: I consider the contribution of statistics to everyday life to be significant.
Moreover, based on the results shown in
Table 5, we can state that the answers of the respondents to questions 5 (I am interested in a deeper understanding of statistical procedures) and 6 (I will use the knowledge of statistics in my teaching practice) in the pre-test and post-test did not change significantly statistically—they even remained largely negative. The situation in the case of choosing the answers to question 6 is illustrated in
Figure 6.
Based on the results of the statistical analysis (
Table 5), we can also state that in dimension C there was no statistically significant change in the answers of the respondents in the pre-test and in the post-test to questions 7, 9, and 11. A statistically significant difference in the answers of the respondents to the questions in the pre-test and in the post-test was only found for question 12 (
Figure 7).
In
Figure 7, we can see that in the pre-test, 83% of respondents disagreed with question 12 (I was motivated to study statistics by attending the Statistics course), so in the post-test, only 26% of respondents were negative about this question.
6. Discussion
Based on the results obtained by the statistical analysis of the pre-test and post-test, we can state that based on the average values of the pre-test (
Table 3), respondents in the pre-test rated their statistical skills as low—they answered the individual questions of the pre-test mostly negative (
Figure 3). If we start from the formulation of the questions in the pre-test, we assume that one of the main reasons may be the lack of quality mathematical training. According to Cladera et al. [
47], the lack of a mathematical basis for students is one of the main failures of students in statistical courses.
By comparing the average values of the post-test with the pre-test (
Table 3) and the subsequent statistical analysis, we can see (
Table 4) that there was a significant positive change in students in dimensions A and B, which followed students’ self-assessment in their statistical literacy. The statistical analysis confirmed the increase in students’ level of perception of their own statistical literacy, based on which it can be stated that the statistics course was set in such a way that it demonstrably supported the increase in the level of students’ statistical literacy.
Within dimension A, a statistically significant increased ability to interpret and critically evaluate statistical information after completing the proposed course was also found. The statistical analysis confirmed a positive change in the ability to interpret statistical data, as well as the ability to critically evaluate the submitted statistical information. Both competencies are an essential element of statistical literacy [
48]. After passing the post-test, up to 69% of students said that they understood the basic concept and principles of statistics (question 10). The implementation of mathematical calculations using computer software also contributed to the observed improvement in statistics. This eliminated the barrier for students caused by a negative attitude toward mathematics [
49]. The students themselves expressed both pre-test and post-test that mastering computational procedures has a gentle impact on their statistical skills, which was confirmed by the results of statistical analysis.
Within dimension B, after completing the proposed innovative way of teaching statistics, students evaluated the positive contribution that statistical thinking can bring into one’s public, private, and professional life. Despite the recognition of the importance and need for real-life statistics and their own ability to interpret statistical data (dim A results), students did not show interest in further statistical education (results of the analysis of the answers to question 5, average 2.61). Moreover, the pre-test did not increase their belief in the use of statistics in their teaching practice (answers to question 6). We believe this may be due to their previous failures in mathematics which, according to several studies, have influenced students’ attitudes toward mathematics [
50,
51,
52,
53].
This fact was also reflected in the results of the statistical analysis of the answers to the questions in dimension C, where even after completing the innovative way of teaching statistics, the student’s negative perception of statistics persists. There was no improvement in the perception of statistics, even though our students considered the proposed way of teaching statistics to be very motivating to study statistics (answers to question 12). They continue to believe statistics are only for gifted students, which corresponds to the findings of several studies e.g., [
54,
55].
By analyzing the students’ answers to the individual questions in both tests, we came to several important and interesting conclusions, which are in line with the conclusions of several experts. For example, the use of real data recommended by several researchers (see [
56]) has increased students’ motivation to study different statistical methods. It is experimentally verified that most students tend to believe that statistics are complicated due to complex calculations and irrelevant to their lives [
57,
58,
59]. The implementation of numerical calculations by statistical software reduced the risk of failure in the proposed course. At the same time, they have more time to understand the basic principles of statistics and to interpret the results obtained. On the other hand, the implementation of the experiment has shown that it is not easy, if not directly impossible, to change students’ perception of statistics in general in a brief period. According to [
60], a negative attitude toward statistics reduces students’ motivation to use statistics in their professional lives, which has been confirmed in our research.
Because, as already mentioned, attitudes are, according to Comas et al. [
61], an integral part of learning any educational content, when teaching statistics, we would recommend looking for forms of teaching that would, in addition to teaching a specific statistical curriculum, develop students’ positive attitudes to statistics. In accordance with Garfield, Hogg, Schau, and Whittinghill [
62], we can conclude that the required results in the introductory course in statistics are closely related to the learning, perseverance, and attitudes and beliefs of students.


