1. Introduction
In the first years of university study, various courses classified as Natural Science courses, are taught, including Mathematics, Physics, Chemistry, and Statistics, etc. Statistics is deeply based on the foundations of Mathematics because the discipline derives all its operations from it [
1]. Statistics uses mathematical methods, but on the other hand, it is perceived as a science that has different forms according to the field in which it is used, for example, Biostatistics, Chemometrics, Econometrics, Engineering Statistics, Medical Statistics, Psychological Statistics, Social Statistics, etc. [
1,
2].
The importance of teaching Statistics at a technically oriented university is considered in the training of qualified graduates. Correct planning, assurance, and process improvement as well as research in various areas is required from teachers. Statistical literacy and statistical reasoning are important for understanding business economics, decision-making, production management, environmental impact, etc. Therefore, active control of statistical methods should be an integral part of the knowledge and skills of managers at various levels of management, not only those in the manufacturing plant.
Science courses, including the Statistics course, sometimes raise concerns for students [
3,
4]. The concern can be the gap between the theories presented in lectures and exercises and their practical application in professional life. Students perceive the lack of lectures and the increased ratio of personal responsibility for their learning as unfair and unreasonable [
5]. Some students have low motivation to study these courses [
3]. Their reading comprehension (as self-reported) with an understanding of statistics is not always strong [
6]. In addition, students’ self-confidence is lower; they don’t know what to expect from Statistics courses [
7]. Unmotivated students are often passive during class. They are interested in passing the exam with as little effort as possible, and therefore they are often satisfied with a lower evaluation. Another reason may be students’ doubts about their abilities. They are hesitant as to whether they can learn statistics and whether they can deliver the required performance [
6,
8,
9].
Another concern is a bad experience with the use of online teaching if not all students have appropriate technical equipment. Therefore, it is important to provide online platforms so that students can easily access course materials and correspond and connect with fellow students and the lecturer [
3,
7].
Another concern of the study from the teachers’ side is that elements of active learning require expert knowledge and more effort in the preparation of teaching material [
5]. It is important to include active learning in the curriculum of several courses and to harmonize the assessment methods of several teachers. It is also more precise to answer and follow up on individual questions of students and to choose the right tasks and projects [
6,
7,
8].
Students’ success also depends on their ability to create and manage their work schedule, focus attention, take the right notes on relevant materials, and study effectively. This well-known learning process is described by Usher [
10] as Predict Academic Performance.
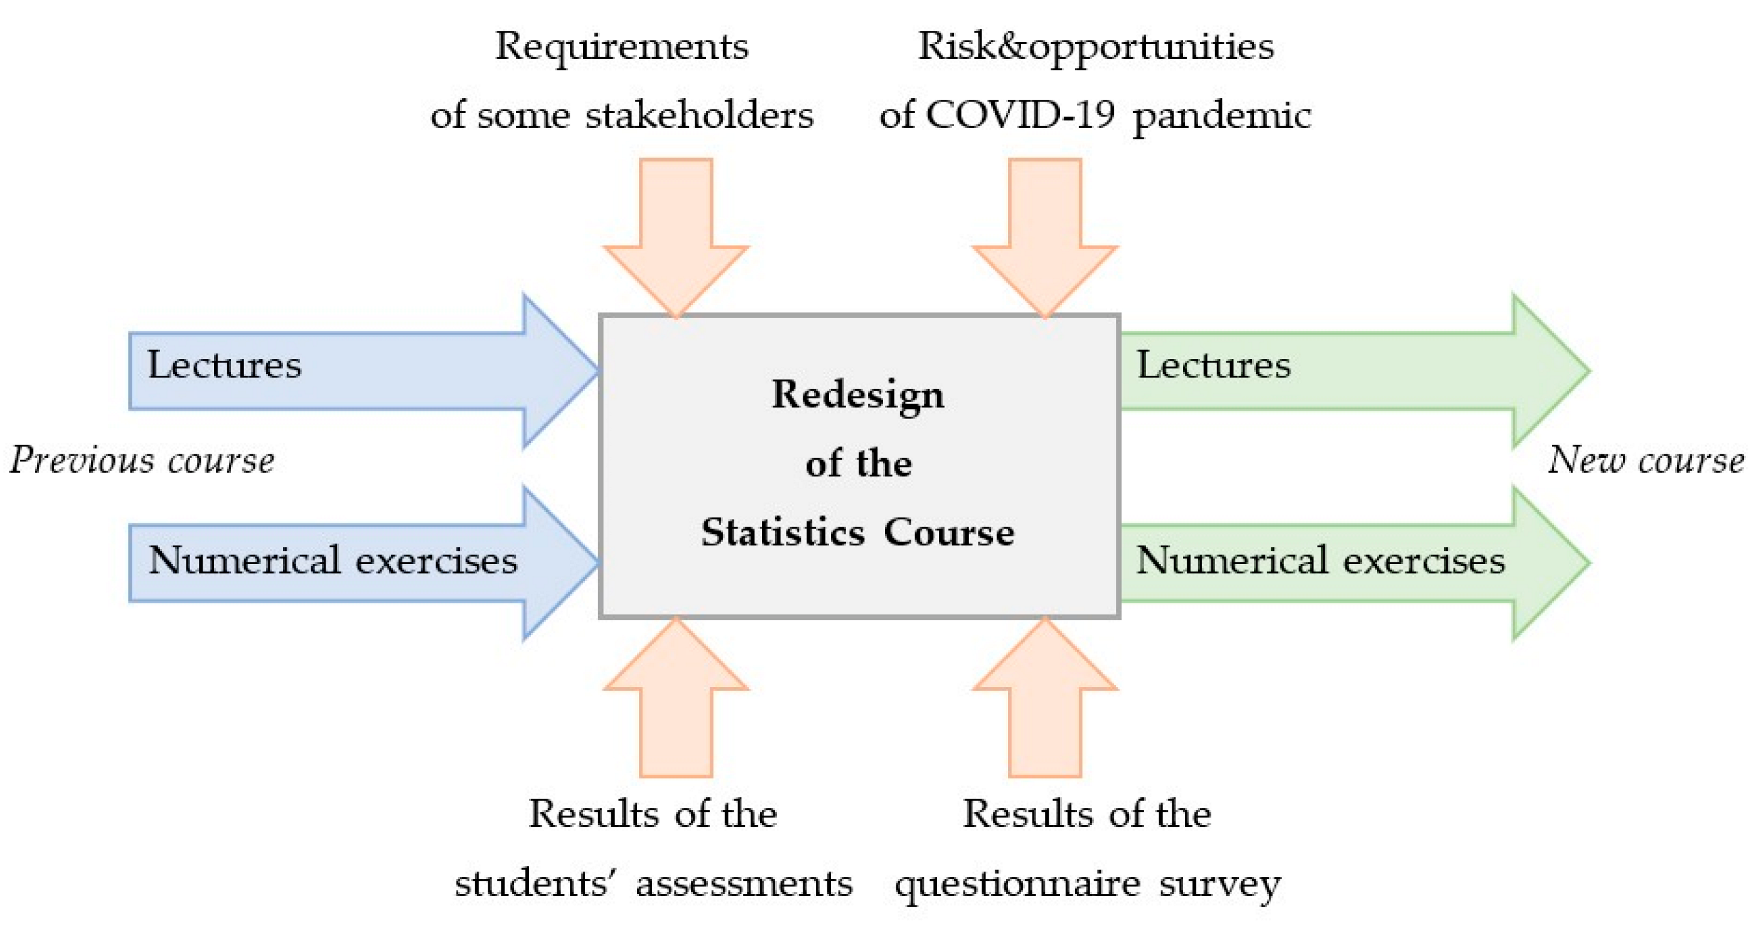
This study describes 12 years of the Statistics course at the Institute of Management and Informatization of Production Processes, including an in-person form of teaching before the COVID-19 pandemic, online teaching during the pandemic, and the gradual return to the in-person form of teaching. It describes the risks and opportunities that its authors have encountered.
This study was inspired by a change in the teaching model of the Mathematics course, where the teachers’ team used elements of active learning from the academic year 2018/2019. This course is taught by a different team of teachers than the Statistics course but comes from the same institute [
11,
12].
The subject of this study is the redesign of the Statistics course to introduce new teaching methods that would motivate students to be more active. A Statistics course with active-learning elements would better suit the current educational requirements of all stakeholders [
13]. Students will be more motivated to learn and master Statistical Methods if they have a better understanding of the practical significance of Statistics. It is important to consider the opinions and experiences of the graduates of this course when redesigning the course.
2. Literature Review
Active learning is a teaching approach that makes students more active participants in the classroom [
14]. The teaching process in universities is appropriate based on the support and development of skills, such as knowledge-gathering, communication between class members and with the lecturer, cooperation, creativity, critical thinking, and ethical behaviour. Active learning occurs when the lecturer stops lecturing and the students work on an issue or task that is supposed to help them understand the concept and discuss it with each other [
10]. Students look for solutions and come up with strategies, and the lecturer guides them by choosing the right questions. Bonwell and Eison [
15,
16], described what it means for students to engage in active learning: “Students must do more than just listen: They must read, write, discuss, or be engaged in solving problems. Most important, to be actively involved, students must engage in such higher-order thinking tasks as analysis, synthesis, and evaluation”.
It also requires an active approach by students to solve tasks and questions at home before class [
17]. Even during the lectures, the lecturer shares knowledge with students based on discussion and questions, solutions of practical examples [
18]. The exercises include creative and individual ways of solving problems, cooperation, and sharing of procedures with subsequent discussion. If the discussed topic allows, it is up to the lecturer to be able to involve even less-motivated students [
19,
20].
The research examining the impact of active-learning methodologies on students’ learning in statistics courses has varied. Some research has yielded mainly positive results but has also had less satisfactory or expected impacts. An overview of the most important research and used methodologies are discussed next.
In connection with the Statistics course, it is necessary to mention mainly the work of Roseth et al. [
21], which presents a handbook for teachers of Statistics, which is focused on the application of cooperative learning in the classroom. In this work, the authors point out that although this is a simple idea, it is not easy to implement the method of cooperative learning.
Corbo and Sasaki, Mantooth, et al., Roseth, et al. Watson, Bateiha, et al., Conway, et al., and Loveland, Garfield, et al. in their works divide their Statistics courses into two sections (for example control and experimental classes) [
3,
17,
21,
22,
23,
24,
25,
26]. In the works of Conway et al. [
24] and of Loveland [
25], teaching is presented exclusively by methods based on lectures, and in the other section, teaching is done predominantly by active-learning methods. These included group work, practical data-collection activities, and teacher assistance with a minimum number of lectures. Loveland [
25] examined, whether students developed more conceptually, procedurally, or both by using active educational methods. Statistical reasoning should be the goal of statistical teaching. Conway et al. [
24] explained the influence of Statistical Reasoning Learning Environment (SRLE) principles on students’ statistical reasoning in the southeastern region of the United States. The authors used two different measurement tools, the Statistics Teaching Inventory (STI), and the Comprehensive Assessment of Outcomes (CAOS). SRLE principles have the potential to increase by students’ statistical reasoning. The use of effective teaching methods, with added technology, upgraded curricula, and assessments can improve students’ reasoning and thinking [
21,
26]. The article by Kalaian and Kasim [
27] at nine research studies comparing students’ academic achievements in an active small group, with learning in a traditional groups states that, “evidence-based research supports the effectiveness of small-group learning methods and achieves better students’ performance in statistics”. Bateiha et al. [
23], conducted a class at a regional university in the southeastern United States, with a teacher-centered, lecture-based class, and a student-centered active-learning class was created.
Corbo, et al., Watson, Pfaff and Weinberg, Andersson and Kroisandt, Nowacki, Anderson and Sungur, Cummiskey, et al., and Denton in their works defined nontraditional methods used in teaching Statistics [
3,
22,
28,
29,
30,
31,
32,
33]. Corbo and Sasaki [
3] used two collaborative methods and one cooperative method at a federal Brazilian public institution. The experimental class was done with three methods: Think–Pair–Share, Jigsaw, and Peer Instruction. Of the three learning methods, students preferred using Jigsaw method. The experimental class had an improvement of 15.06% between the first and second tests compared to the control class, which remained stable. The use of the three methods increased students’ motivation and supported their involvement and social skills development. Watson [
22] used a collaborative method called Interdisciplinary Activity for one topic of practical work of Statistics. Students rated the exercise as interesting, linking the practical task of Palaeontology and Statistics. Other research has shown no significant impact on students’ understanding of Statistics when the subject was taught by using active-learning techniques [
28]. Nowacki [
30], based on professional competence, significantly increased the attitude and evaluation of students, in the problem-based statistical course. Denton [
33] introduced a reflective learning journal in class, where reflective writing can help students cope with anxiety.
Mantooth et al. [
17] carried out a study of teaching with changes in the arrangement of classrooms for an entry-level Statistics course at a university in the southeastern United States. The benefits of technology-enhanced learning classrooms were not significant. The expectations that students would perceive their technology-enhanced learning environment positively were not confirmed. However, students rated physical space as important for learning.
In the works of Shinaberger, Kayaduman, Andersson and Kroisandt, Green, et al., Winquist and Carlson, Carlson and Winquist, and Leão, et al., a flipped classroom was used [
4,
7,
29,
34,
35,
36,
37]. Kayaduman in his work [
7] examined four interactions on the statistics course Probability and Statistics at the Department of Computers Engineering in Igdir, Turkey. The Student–Content interaction was evaluated favourably mainly due to pre-recorded videos that the lecturer made available online (among other online forms of materials). The Student–Instructor interaction was favourably evaluated by students due to various forms of communication, wherein students felt positive support and a relationship with the instructor. In the Student–Student interaction, students expressed that they were supportive of the group. The Student–Interface interaction was critical, as students had to communicate with the interface, not just the shared content. Andersson and Kroisandt [
29], at the Frankfurt University of Applied Sciences (FRA-UAS) in the online Statistics course, used various active-learning components. Their application brought positive encouragement in solving tasks every week. Students who participate in web conferences were better prepared than those who did not.
Negative results also appeared in the form of difficulties in studying the subject. Green et al. [
34] describe the creation of a course community (CC) for the implementation of active-learning materials at a large university in southeastern United States. It is a guide and training for lectures to improve knowledge and pedagogical skills. Winquist and Carlson [
35] in their work described how students who learned Statistics in the flipped classroom did not display significantly different results on assessments during the courses, but that students in the flipped classroom showed a better understanding of Statistics. In another article [
36], a group of students who experienced active learning stated that they had more confidence in their ability to perform and understand Statistics.
Sulistyo [
14] describes the implementation of the Guided Discovery Learning Method (GDL) in Electrical Engineering at the Islamic University of Nahdlatul Ulama, in Jepara city, Indonesia. The pre-test and post-test results were two times higher after using the GDL method. Vignola et al. [
38], Lovekamp et al. [
39], and Lateh [
40] implemented project-based learning in an Engineering Statistics course; it was a pedagogical approach that involves active learning directed at investigating and solving complex, real-world problems.
Pettis et al. and González et al. [
41,
42] in their works implemented whole blocks of courses, which included active-learning methods in modules at Alabama State University. The first part focused on the theoretical and conceptual ideas of the discussed methods, and the second part contained practical experimentation by using simulation experiments. Ruggieri [
43] presents the procedure and group project implemented at the College of the Holy Cross in the United States. This article describes the exact procedure, evaluation, and benefits of project work for students.
Based on a review of the literature, it is possible to point out six principles that provide a framework for monitoring effective teaching practices in Statistics, referred to as Statistical Reasoning Learning Environments (SRLE) [
21,
24,
26]. These six principles are as follows.
Focus on developing central statistical ideas rather than on presenting a set of tools and procedures.
Promote classroom discourse that includes statistical arguments and sustained exchanges that focus on significant statistical ideas.
Use assessments to learn what students know and to monitor the development of their statistical learning as well as evaluate instructional plans and progress.
Integrate the use of appropriate technological tools that allow students to test their conjectures, explore and analyse data, and develop their statistical reasoning.
Use real and motivating datasets to engage students in making and testing conjectures.
Use classroom activities to support the development of students’ reasoning.
The description of SRLE is a socio-constructivist approach to instruction. The SRLE is closely linked to teaching principles and practices that promote student engagement and classroom discussion between students and the lectors, and professional teaching standards to support teaching [
24]. Lectors who align their curricula with in-depth educational goals, use technology to build conceptual understanding and use assessment as a learning tool are more likely to support statistical reasoning and thinking [
26].
The aim of the review is not only to describe in detail the individual methods of active learning but also to point out studies containing various elements, and strategies of this form of learning, which have brought different results in the teaching of Statistics.
3. Motivation and Creation
The presented literature review shows that many university teachers of the Statistics course deal with the possibilities of using active learning. Some studies have confirmed that teaching with the elements of active learning is better than the traditional form of teaching without it. Elements of active learning help students develop soft skills [
36]. They will need them to solve various problems in their future professional lives. The changing of employers’ requirements for graduates point to the development of soft skills. Development of soft skills has been identified as one of the challenges for technically oriented universities. In order to meet this challenge, it is not necessary to include new subjects in the curriculum, but to ensure that soft skills are developed within the framework of existing subjects. This requirement needs lecturers with extensive competencies for the given area. Several literary sources confirm that soft skills need to be developed during the entire course of study [
44,
45]. The nature of the subject of statistics gives room for their development.
The share of job offers that prioritize hard skills (professional knowledge and skills) among job applicants is significantly decreasing. Employers are gradually replacing the requirements for hard skills with requirements for soft skills, such as the ability to analyse and solve problems (logical thinking), good presentation and communication skills, the ability to work as a team, and others. In most cases, these skills are irreplaceable with advanced automation and informatization. Soft skills cannot be taught as hard skills. They can be improved and partially trained. In the past, they were only complementary, but nowadays the situation on the labour market has changed. The lack of suitable employees has made employers realize that they can teach the necessary hard skills, but some of the required soft skills (e.g., responsible attitude to work, ability to think analytically, etc.) are much more difficult to teach [
13,
46].
For graduates to find a good job, and to be comprehensively prepared for the requirements of the labour market, it is advisable to change the traditional way of teaching methods, which mainly emphasized the development of hard skills. Therefore, it is necessary to intensively incorporate new elements and methods that support the development of social and emotional skills—“soft skills”—into the teaching process, precisely in view of the constantly changing conditions in the labour market [
44,
45,
47].
Today, young people, representatives of the so-called Generation Z, are educated at universities. This is a generation of people who have grown up in an era of rapid digitalisation and computerisation, which has had an impact on their current skills and abilities. On the one hand, this era has had a positive effect on their ability to use modern technologies, but on the other hand, the large amount of available information of varying quality did not automatically teach them how to systematise and properly use this information, or how to think critically. Under the influence of the intensive use of modern technologies, their ability to communicate with each other, create contacts, and work in a team has also suffered. All these specific characteristics of today’s young generation must be taken into account by teachers when shaping and planning the process of their education. Their prerequisites, needs, and also their actual abilities and the demands placed on them are completely different from Generations X and Y, who studied at universities before them [
13,
46,
48,
49].
The Statistics course is an important and mandatory part of most Bachelor’s study programs, including studies that do not include a technical focus. Published studies show that if the Statistics theory is connected to real-world examples, Statistics becomes more comprehensible and interesting for many students.
5. Characteristics of the Statistics Course
This study relates to the Statistics course taught at the Institute of Management and Informatization of Production Processes. Students take a Statistics course during the first year of the Bachelor’s degree as compulsory course within the curricula of four study programs:
automation and process control of raw materials extraction and processing;
informatization of raw materials extraction and processing;
quality management of raw materials extraction and processing; and
management of processes.
In the 12 years under review, the representation of the numbers of students in individual study programs has varied. The design of the current Statistics course has been in use since the 2009/2010 academic year. It is divided into six sequential modules: Introduction to Statistics; Theory of Probability; Descriptive Statistics; Inferential Statistics; Regression and Correlation Analysis; and Time Series Analysis. The lectures, exercises, semester projects, and continuous final and overall assessment are described in more detail in the following subsections.
5.1. The Lectures
The lecture takes place in a schedule of three hours per week in a traditional lecture hall with bolted stadium seating. At the beginning of the semester, a list of topics covered in the course, a textbook from the lecturer with the topics covered, and a list of additional recommended study materials for each topic instructor will be presented. The lecture is traditional. The lecturer gives a lecture while the students listen and take notes (
Figure 2). In case of non-participation, students can study the topic independently from the provided literature provided.
The lecturer involves the students in the teaching process by asking questions during the lecture when the topic allows. It is good feedback for the lecturer about the students’ activity. He knows about the clarity of the topic for students, and whether it is necessary to return.
At the end of the lecture, the lecturer uses the board work block. The lecturer presents a practical example of the discussed topic. The students can view it, make post-it notes, and discuss the topic covered. Similar examples are solved by the students during the exercises and in student projects, which each student must develop and defend during the semester.
5.2. The Numerical Exercises
The numerical exercises have a range of three hours per week in a traditional flat classroom with sled desks and computers. The instructor presents the full schedule of exercises to the students at the beginning of the semester. For each topic, they can prepare in advance from the lecture, textbook, or supplementary study materials, the list of which is in the textbook for each chapter covered.
The students have the opportunity to test the theoretical facts from the lecture and independently solve practical examples during each exercise. The content of the exercises always refers to the topic explicitly covered in the previous lecture. Suitable activities are used to connect information from lectures with practical experience in order to facilitate the acquisition of new knowledge and skills.
At the beginning of each exercise, the students complete short tests which have both open-ended and closed questions. The questions relate to the topics from the previous lecture and exercise. The instructor can determine whether the students have understood the topic in this way. The occurrence of unanswered questions or questions with incorrect answers is important feedback for the instructor. A test with a low grade can be corrected by the student.
The instructor will provide students with examples with real data in each exercise. The examples are so extensive that the students can calculate them directly in the exercise. They can understand the used statistical procedures and methods, as well as draw overall conclusions based on the solution.
The instructor acts as a facilitator of discussions and helps students solve problems by solving the examples. Students work either individually or in pairs, depending on the number of students, in the course. By solving problems, students can better understand the topic and consult what they don’t fully understand. The instructor will check correct solutions and conclusions for each student at the end of the exercise.
The students solve the examples by using a spreadsheet. Its advantage is that it makes calculations easier for students, but at the same time leaves them enough space to understand and learn the procedures of the methods discussed (
Figure 3). The possibilities of the graphical display of the results are sufficient for the topics covered of Descriptive Statistics and Inductive Statistics.
The students who could not complete the example during the exercises could complete it at home, either individually or by contacting someone in the group. Working in small groups helps students build collaborative problem-solving skills, encourages discussion, and allows them to learn from each other. The students can also solve any problems related to the example with the instructor during the set consulting hours.
The use of real data in the practical examples solved contributes to a better understanding of the topic discussed. Datasets from practice help students develop reasoning, evaluation, and problem-solving skills.
5.3. The Semester Project
Project-based learning is used by the instructor during the semester as part of the students’ independent work. Each student must develop and defend two projects. The students use real data from practice in their projects. It helps students understand and learn how to think statistically. The projects are different for each student in every study group (
Figure 4). Sometimes students may have the same topic but with different input data. In that case, students can join teams in a home environment. Working together in a small group to solve projects allows students to develop teamwork and improve their communication and organization skills.
The instructor will inform the students in advance of the date of presentation and defense of semester projects. Students present the project in front of their classmates and the instructor. They interpret the used statistical methods and the obtained results. The classmates may ask questions, discuss the methods used, and analyse the process of solving the project. It is a great benefit for all students. They see the use of statistical methods on different real-life data.
Project-based learning helps students become familiar with the different procedures and methods, thus clarifying and strengthening their understanding. It forces them to think more thoroughly about the structure of a project and practice their skill to write a problem-solving document. That is also excellent preparation for writing a Bachelor’s thesis.
The points that the student must obtain in the midterm assessment (
Section 5.4) are evaluated for each semester’s project. Incomplete or incorrect projects can be revised and re-defended by students.
5.4. The Continuous, Final, and Overall Course Assessment
The continuous assessment (30 points) and the final assessment (70 points) together create the overall assessment of the Statistics course (100 points).
The continuous assessment includes eight tests of two points each and two semester’s projects of seven points each. The students must pass all continuous assessments and receive a minimum of sixteen points to receive course credit. The structure of the assessment should guide the students toward regular learning. This contributes to the consolidation of the acquired knowledge continuously during the semester, not once before the final assessment–exam.
The final exam has a theoretical part (40 points) and a practical part, which consists of solving two examples of 15 points. The student passes the examination when he fulfills the requirement to obtain at least 36 points out of 70 points.
5.5. The Changes in Statistics Course Caused by the COVID-19 Pandemic
The COVID-19 pandemic has affected and influenced all spheres of society, not only education. After its outbreak and spread in Slovakia in March 2020, it affected the educational activities carried out also in the Statistics course. The face-to-face teaching was abruptly discontinued after the first two weeks of a pandemic. The teachers had to continue teaching in home-office conditions. Without any preparation and adaptation to the new situation, the teachers began to look for ways to continue communication with students, knowing that this situation would not last. At first, communication was conducted through emails. The teachers sent study materials, tutorials, examples, assignments, and projects in electronic form to students’ e-mail addresses. The students used e-mail to submit worked-out examples, and assignments, communicate and consult with teachers, as well as with each other. It was a rather cumbersome and inefficient form of teaching.
The experience with online learning was minimal until the pandemic. Teachers, mostly individually and uncoordinatedly searched for methods, forms, and tools with which to replace the almost 100% attendance method of their teaching. Some elements of the online form of education were partially used by the teachers in the combined teaching method for part-time students. However, the online form was only a supplement rather than a supporting part of the learning process. The teachers communicated with each other and exchanged their experiences with various applications and tools enabling online communication. Gradually they started using platforms and professional tools developed for this kind of activity.
The exercises were the first to change, where face-to-face communication was most lacking. The use of meetings using the Webex platform by Cisco significantly helped students to replace the attendance teaching method. The instructor replaced the tests originally filled out in the traditional printed form. He started using the tests prepared in Microsoft Forms (
Figure 5). The students shared their screen if they had a problem with the solution of example. Other students were also able to participate in the discussion about the problem. The students also shared their screens at the instructors’ invitation to review their procedure of the example solution.
In the last third of the summer semester, lectures, consultations, as well as project defences were carried out through online meetings. Similarly, the final exam of the Statistics course was conducted online by the lecturer.
Before the COVID-19 pandemic, the final exam was conducted in a traditional classroom with computers for several students at the same time. The theoretical part of the exam included written answers to five theoretical questions. Each student had different, randomly selected questions to avoid possible copying of answers. The students used a spreadsheet to solve two examples. The entire final assessment took a maximum of 120 min. The lecturer had the opportunity to guide students if they had difficulty understanding the presented questions or examples. At the end of the exam, the written answers and examples were reviewed by the lecturer. He awarded the points for the exam in the presence of the student. This transparent final assessment procedure also provided feedback to all students, and the shortcomings were identified.
During the pandemic, the entire final evaluation moved to the online space. The lecturer replaced the written answers with a test with 40 questions from all the topics covered. The test is prepared in Microsoft Forms and takes 35 min. This application displays to individual students both the questions and the offered answers to the closed questions in random order. This reduces the risk of write-offs. The practical part of the final assessment has changed in that each student individually solves their two randomly selected examples for a maximum of 60 min, sharing their screen with the lecturer in Microsoft Teams. The lecturer can guide the student in solving the examples, but not in completing the test.
In the following semesters, the online teaching continued, already supported by the university’s purchase of official licenses not only for the online platform Webex by Cisco Meetings but also for Microsoft Teams.
Online learning has brought new opportunities for both teachers and students. They perceived it very positively in the given situation [
50,
51]. These included:
the use of not only traditional textbooks, but also online resources such as videos, which can provide a more efficient learning experience;
the possibility of attendance of classes through online meetings, which is important for students who do not come from the city where the university is located, have an individual study plan, e.g., because they come from another country (for example from Ukraine);
reducing of the financial costs due to online meetings as opposed to the need for regular travel to attend of classes;
improved student attendance, due to the possibility to join online classes from any location; and
an opportunity to learn from others by sharing a screen with a solved example to all meeting participants, which is better than individual consultation in front of one computer in a classroom.
At the same time, teachers and students also discovered various risks, some of which they are still dealing with today. These included:
watching the screen for a long time and concentrating on the topics discussed brings attention loss;
prolonged sitting leading to poor posture, lack of exercise, and related health problems;
the need for high-quality internet connectivity for all participants in online learning, as well as for their computers, especially for students;
lack of physical meeting and communication between students and also between teachers and students brings a sense of isolation;
lack of skills in the use of online forms of learning and related technologies; and
the variety of online learning platforms used for various courses or inside the same course.
Thanks to the abatement of the COVID-19 pandemic in Slovakia at the beginning of 2022, a gradual return to in-person teaching was possible, with compliance of the epidemiological measures in force. Some of the risks associated with online teaching at the end of the pandemic were eliminated.
6. Results
The responses to research questions RQ1 (Is there a significant difference in the assessment of the selected Natural Science foundation courses at our institute?), RQ2 (What is the trend in the assessment of our Statistics course?), and RQ3 (Is there a need for a change in the format of our Statistics course instruction?) is presented in this section.
6.1. The Results of the Student Assessments in Statistics Course and Mathematics Course
The data from continuous and final assessments from the Mathematics course and the Statistics course from the MAIS for the last 12 years. The data of students studying any of the study programs guaranteed by the Institute of Control and Informatization of Production Processes were processed.
This research used only the overall assessment of students who participated in at least the first continuous assessment of the Mathematics course. Not all of them received enough points to participate in the final assessment—the exam.
Table 1 also shows the percentage of the successful students which ranges from 14.29% to 80.00%. The minimum mean overall assessment of the students who successfully completed this course is 58.19 points. The maximum mean overall assessment is 73.50 points.
Students have the Mathematics course included in the first semester of Bachelor’s studies. Furthermore, in the second semester, students have the Statistics course. The students could take this course even if they have not successfully completed the Mathematics course. As can be seen from the data presented in
Table 2, the percentage of success in the overall assessment varied from 61.54% to 95.74% during the 12 years of study. The minimum mean overall assessment is 58.84 points, and the maximum mean overall assessment is 72.00 points.
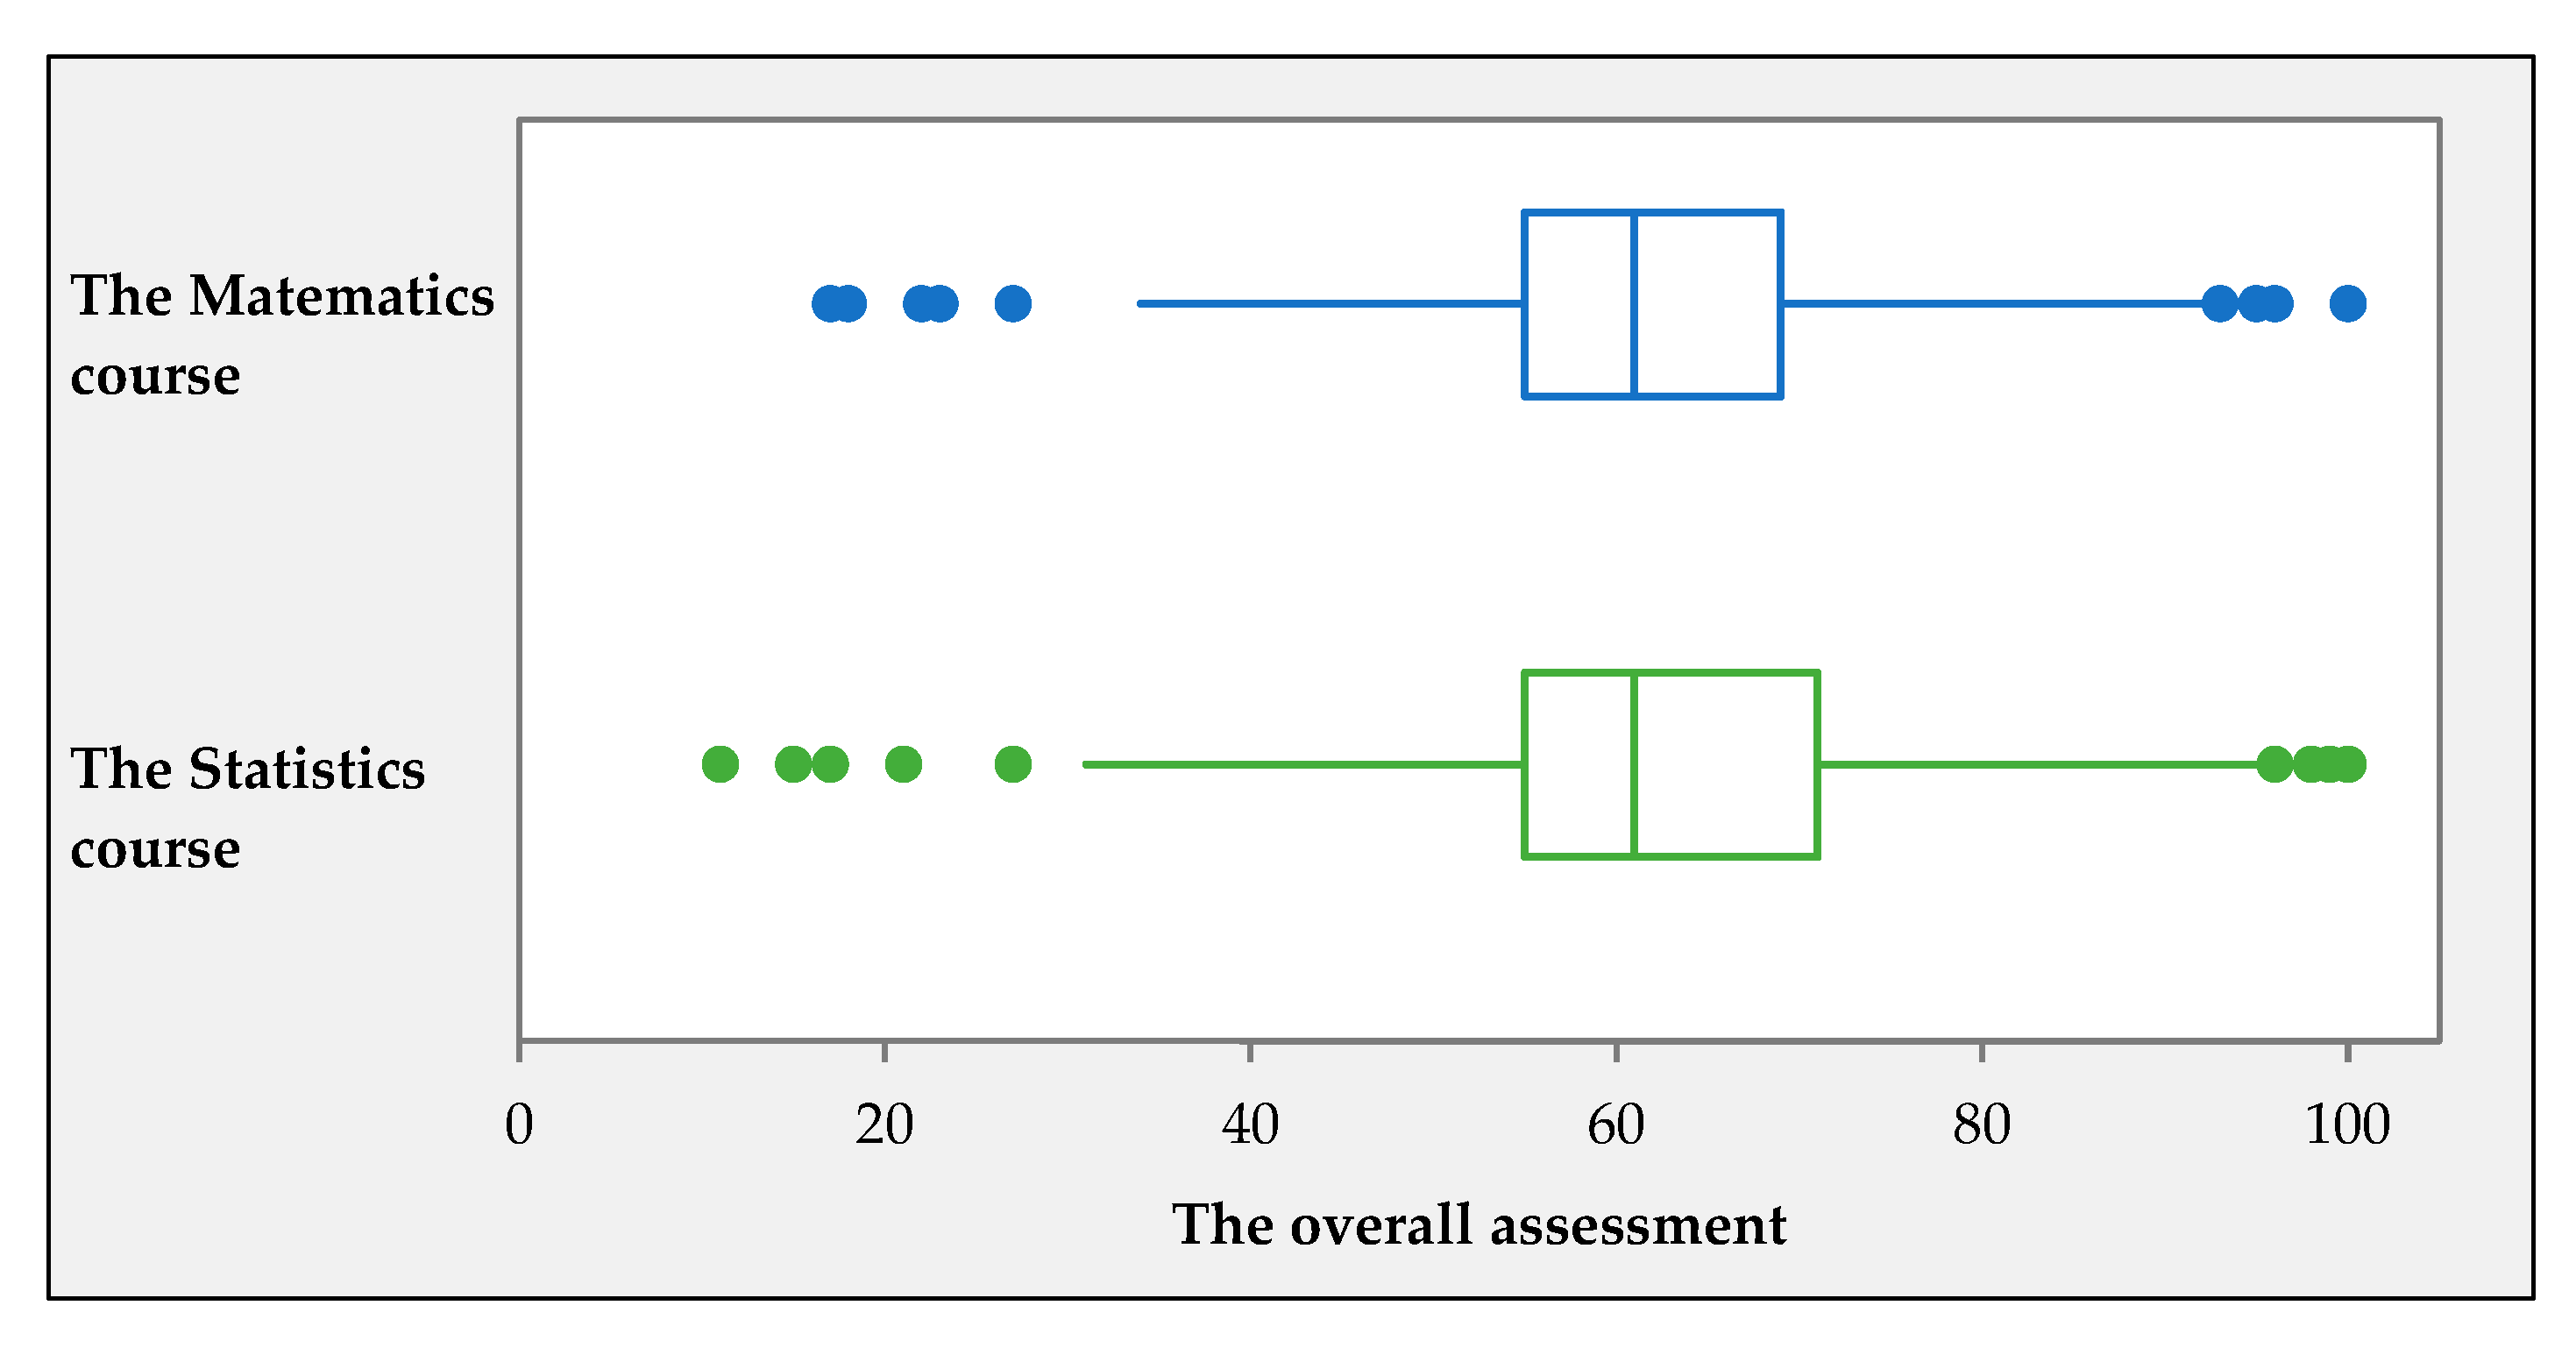
Figure 6 shows histograms of the frequencies of the overall assessment of the compared courses. Immediately, their very similar shape is already apparent. The similarity of the assessments of courses confirms the box plots shown in
Figure 7.
Anderson–Darling’s test of the overall assessments of the courses did not confirm their normal distribution. Therefore, the null hypothesis of a statistically insignificant difference between the medians of the overall assessments of the Mathematics course and the Statistics course at the 0.05 level of significance as tested by the Mann–Whitney test. Based on the p value of 0.75, there is no reason to reject the tested null hypothesis.
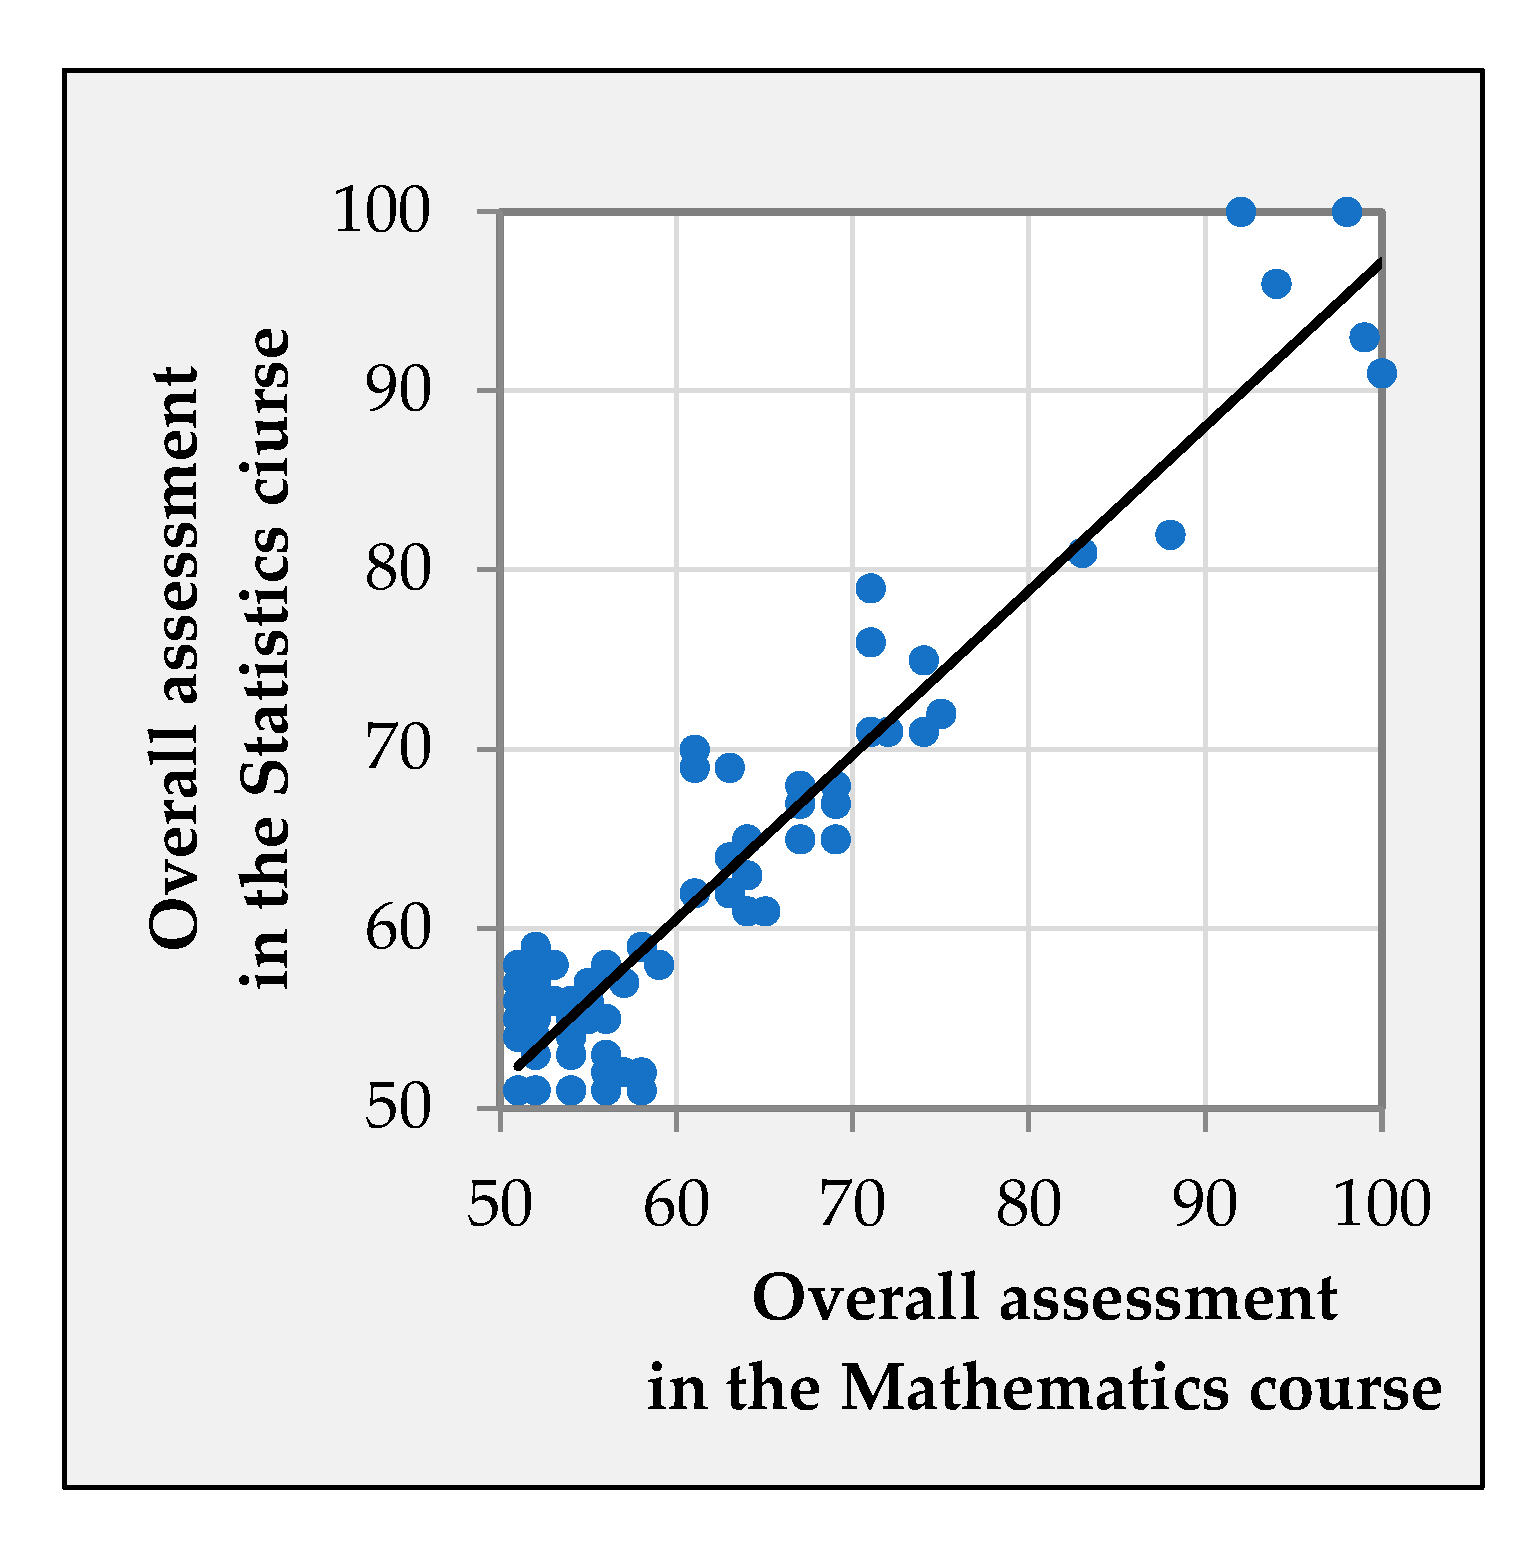
The relationship between the overall assessments in the Mathematics course and the Statistics course is shown in
Figure 8. The graph shows the overall assessments of all students who successfully completed both courses and the students did not always complete the courses in the same academic year (
Table 3). The dependence of the overall assessments (
OA) expresses a first-degree polynomial of the form
The coefficient of determination R2 for this polynomial is 0.89.
An overview of the number of students’ overall assessments in the two courses under study is in
Table 4. Letters A, B, C, D, E, and FX express the overall assessments. These letters stand for the following six classification grades:
A (91–100 points) means excellent, outstanding work;
B (81–90 points) means very good, competent work;
C (71–80 points) means good, reasonably satisfactory work;
D (61–70 points) means satisfactory, less acceptable work;
E (60–51points) means sufficient, minimally acceptable work; and
FX (under 50 points) means insufficient, inadequate work.
Table 4 does not include assessments of the students who did not receive course credit and could not participate in the final exams. The highest agreement in the assessments obtained is for E letters in both courses, as can be seen in
Table 4.
Figure 9 shows the number of identical overall assessments obtained from the two courses at each classification grade expressed by letters A, B, C, D, E, and FX. For a third-degree polynomial of the form
the coefficient of determination R
2 is 0.99, where
ICG means identical classification grade.
In the first academic year of Bachelor’s study, 38.12% of the students successfully completed both of the studied courses. In the second year of study, 7.72% of students passed both repeated courses (
Table 3). Only 5.20% of the students who successfully completed the Mathematics course in the first year also successfully completed the repeated Statistics course in the second year. Similarly, 9.40% of the students who successfully completed the Statistics course in the first year managed to successfully complete the repeated Mathematics course in the second year. As many as 30.94% students, who took the Mathematics course in the first year and did not complete it successfully, did not take the Statistics course at all. Only 2.97% of the students (marked as “Blank” in
Table 3) who successfully completed the Statistics course in the first year, as well as 0.50% of the students (marked as “Blank” in
Table 3) who successfully completed the repeated Statistics course in the second year, did not complete the Mathematics course.
From the data on the success rate of the students on the three possible end-of-course assessment terms (Ordinary, First Remedial, and Second Remedial) presented in
Table 5, it is evident that 23.46% of the students successfully completed the Mathematics course, as well as the Statistics course on the ordinary date. A total of 13.58% of the students who completed the Mathematics course needed the remedial date to complete the Statistics course, and 2.22% of the students needed the second remedial date to complete the Statistics course. Only 3.70% of the students who successfully completed the Mathematics course did not continue in the Statistics course. The proportion of students who completed the Mathematics course during the remedial term but succeeded in the Statistics course during the ordinary term is 7.16%. 5.19% of students passed both courses during the remedial term and only 0.99% needed a second remedial term.
Table 5 shows that the successful completion of the Mathematics course in the regular term is 42.96% which is 6.42% more than that of the Statistics course. Therefore, the participation of students in the remedial term for the Statistics course is 20.24% higher than in the same term for the Mathematics course. For the second remedial term, the difference is 19.51%.
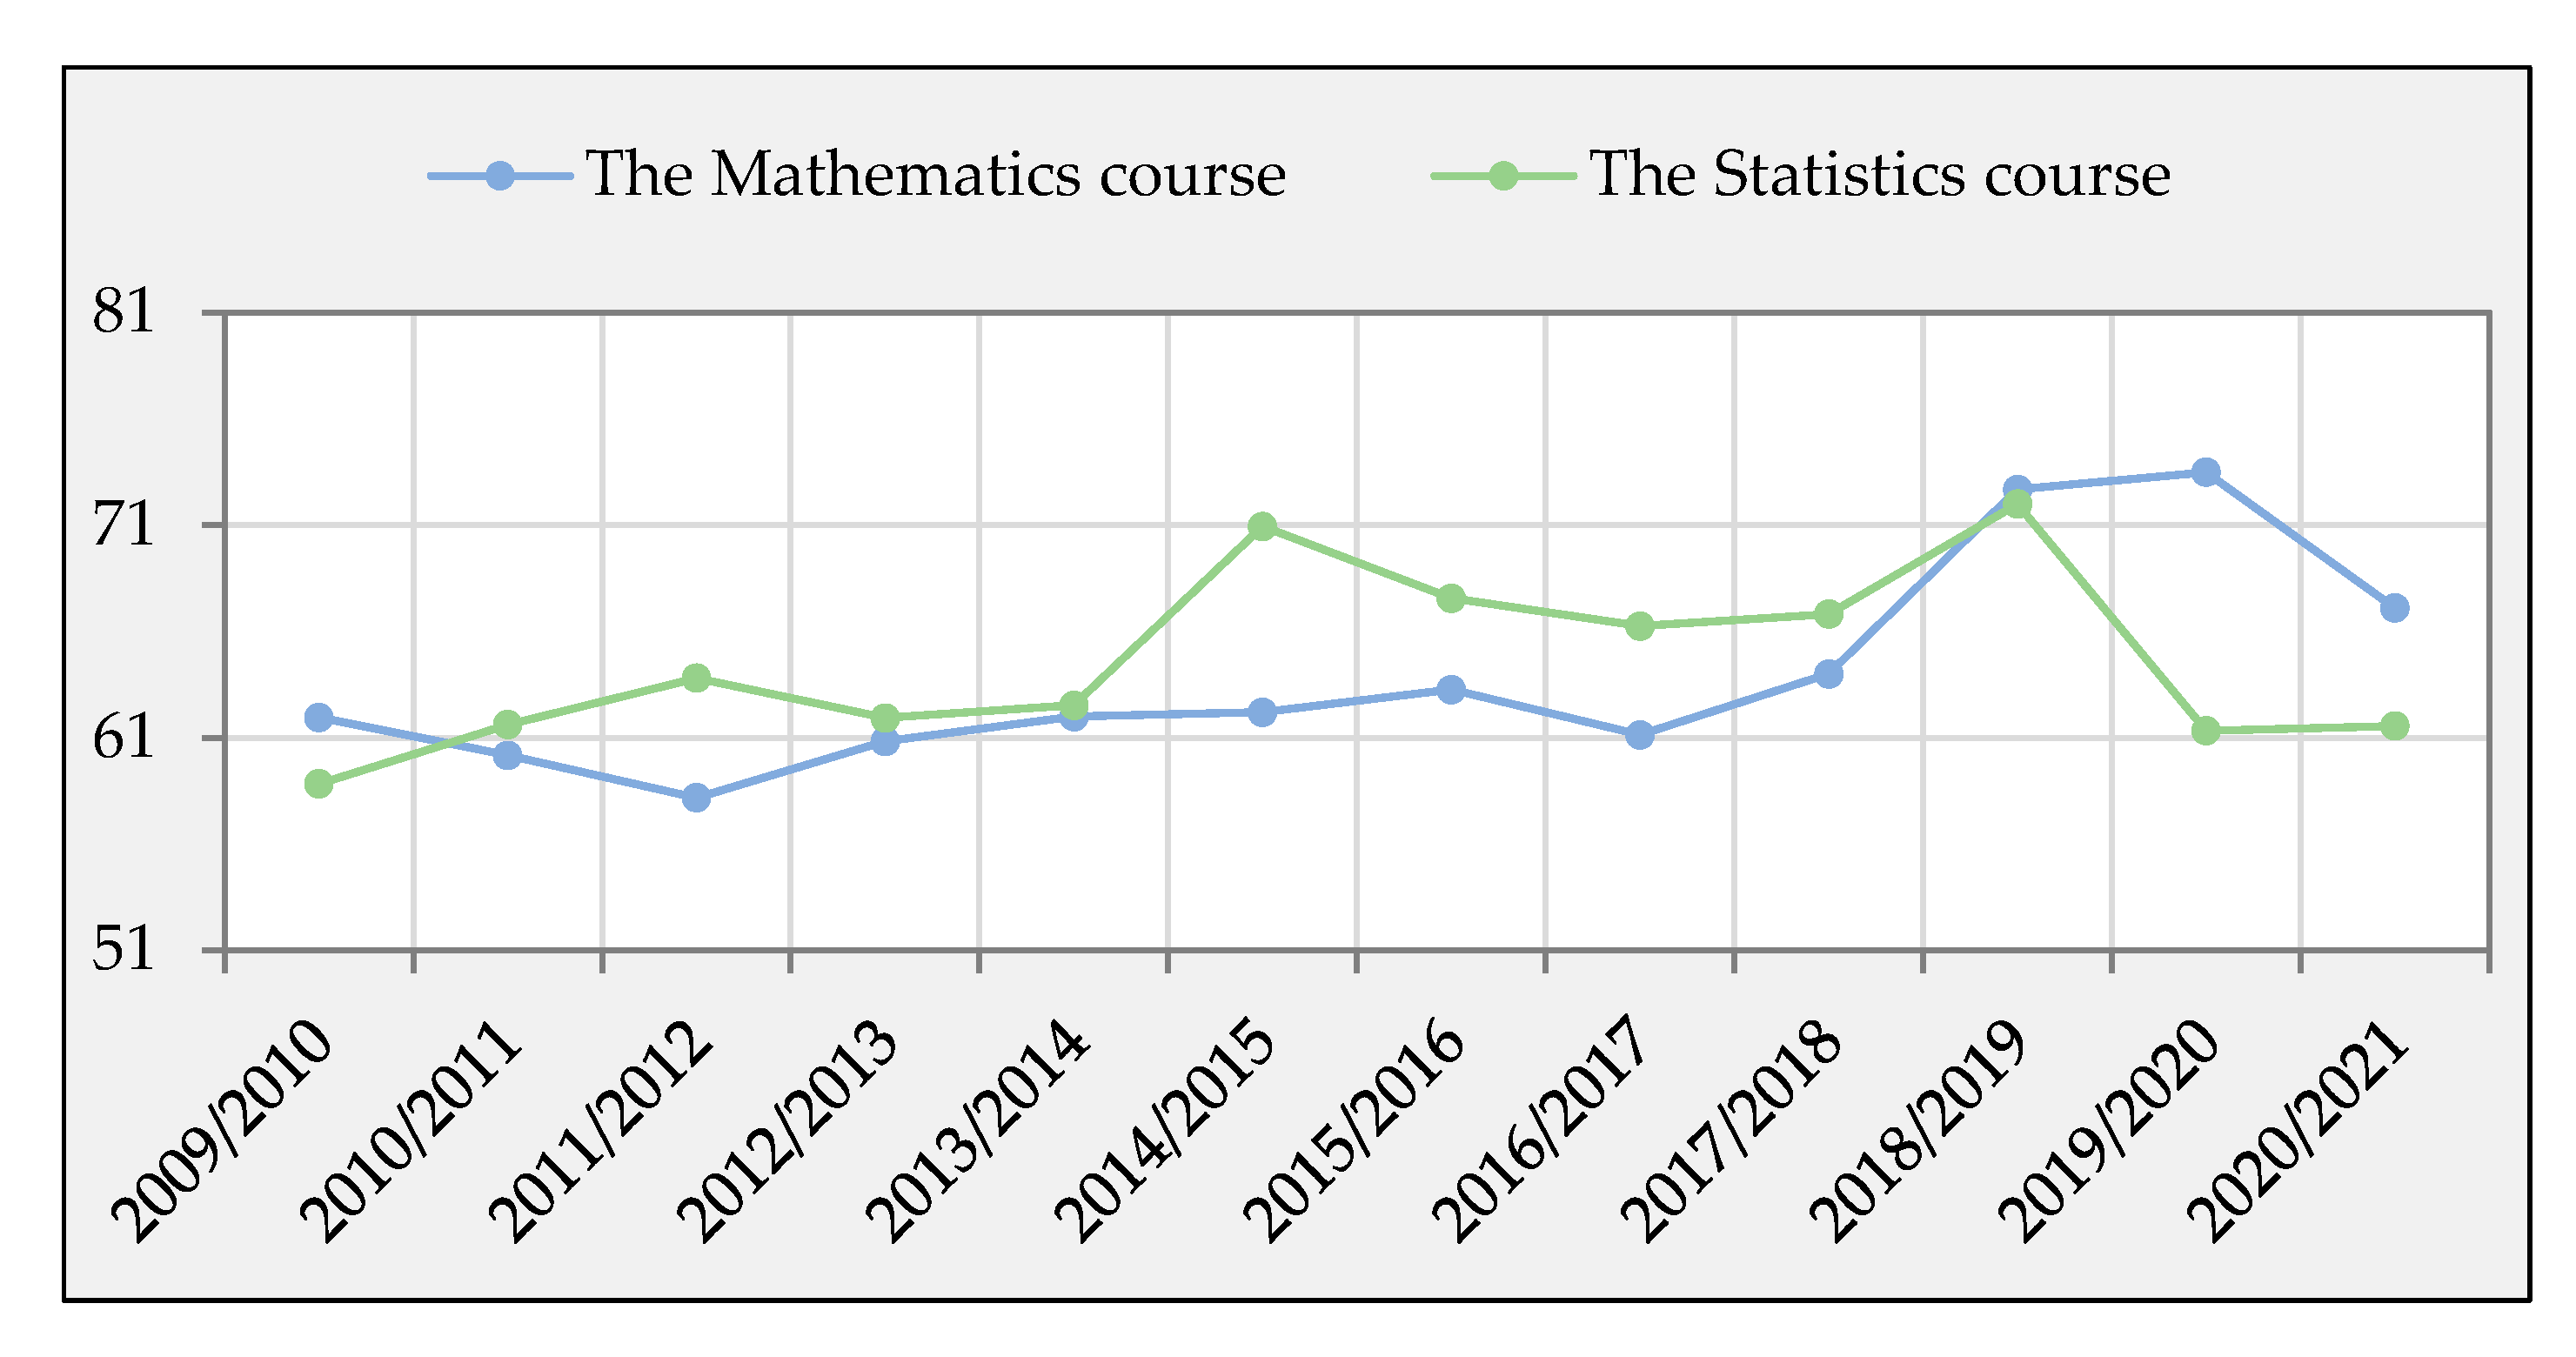
The evolution of the average overall assessment from both courses over the 12 years (
Table 2) is shown in
Figure 10. From the graph, in the academic years 2010/2011–2017/2018, the overall grade from the Statistics course was higher than that from the Mathematics course. The increase in the overall assessment of the Mathematics course has occurred in the last three years. At the same time, there has also been a decrease in the overall assessment of the Statistics course in the last two years.
The conclusions from the above analysis are as follows.
there are no statistically significant differences between the overall assessments of the Mathematics course and Statistics course (RQ1);
the number of terms used by students in the Statistics course is higher than in the Mathematics course (RQ1);
the overall assessments in the Mathematics course have increased over the last three academic years (RQ2); and
over the last two years there has been a 10-point drop in the Statistics course overall assessment (RQ2).
It is possible to speculate that the faster mastery of the Mathematics course may be due to the use of more active learning elements in that course. The high percentage of use of remedial terms in the Statistics course is probably due to the lack of continuous preparation of students during the semester.
6.2. The Results of the Questionnaire Survey of Graduates’ Statistics Course
A questionnaire survey was conducted by the teachers among students who had taken a statistics course at the end of the summer semester. It focused on the evaluation of the course content and learning activities. The respondents were students at the Institute of Control and Informatization of Production Processes for the last five years. The questionnaire had several parts. The first part contained personal data such as gender, year of study, and nationality of the student. The second part of the questionnaire was focused on the general evaluation of the selected mathematics-based subjects. The core of the questionnaire were questions related to the lectures and exercises of the course. The questions focused at evaluating the content, structure, and form of the course, as well as possibilities for its improvement. Students answered the questions by choosing from the options offered either alternatively or selectively. A verbal Likert-type 4-point scale without a “neither” mid-point was used (certainly yes, yes, no, certainly no) for questions eliciting students’ attitudes and opinions.
The online questionnaire survey used Microsoft Forms and was anonymous. It was attended by 72.35% of the total number of students who graduated in that period. Many important conclusions emerged from the responses obtained. They are in the following parts of the article.
Students rate the scopes of the Statistics course and the Mathematics course as challenging (
Figure 11).
The perceived difficulty of the Statistics course (94.59%) exceeds the perceived difficulty of the Mathematics course (81.08%) by 13.51%. A total of 64.86% of students think so when asked whether the knowledge of the Mathematics course is necessary to pass the Statistics course. Most students (86.49%) think that the scope of the Statistics course is more challenging compared to other courses taken. At the same time, 81.08% of students report that they have used the knowledge gained from the Statistics course in other courses in their study. This question cannot be answered by first-year students who could not assess the use of knowledge from the Statistics course in other, not yet completed courses.
8. Discussion
The current university Statistics course develops students’ hard and soft skills. It teaches students to use various methods of descriptive and inductive statistics, analyse data, interpret the obtained results, and formulate conclusions. At the same time, it develops students’ logical thinking, their ability to analyse and solve problems, their ability to work in a team, and it supports their use of information and communication technologies, as well as students’ presentation skills. These findings were confirmed by the results of a questionnaire survey done by authors. The same results were reached by Khan et al. [
5]. They emphasize that the systematic use of active-learning elements increased student engagement. The students developed skills that were not directly related to the course curriculum (communication, teamwork, creativity, and critical thinking).
Some active-learning elements (interactive lectures, short cases, board work block, project-based learning, collaborative work, and cooperative work [
3,
12,
15]) are used by teachers in lectures and exercises. Teacher training in this area is essential for the effective use of active-learning elements in courses. The same problem is pointed out by Corbo and Sasaki in their research [
3]. In the future, it would be advisable to introduce active learning elements in other follow-up courses at our institute. Authors in studies [
6,
7,
8] point out the synergistic effect of incorporating active learning in more courses. On the other hand, there is a need to properly balance the use of active-learning elements with traditional learning. Donohue and Richards [
8] point to student dissatisfaction when too much emphasis is placed on student teamwork and the role of the teacher is lost.
The results published by Donohue and Richards in [
8,
9] show that there was resistance when dividing the class into pre-assigned teams, as judged by the observed non-participation of some students and through feedback. Students preferred to choose their own team to work with rather than when they were assigned. Some students reported that they preferred to work independently. Students in the group were not always “time efficient”, had different workloads and did not have the same level of knowledge [
6,
8]. Considering our survey results, in which graduates request a strengthening of group work, the redesign of the course proposes the introduction of alternative groups and individual work. The composition of the groups will vary from topic to topic. The composition of the groups will be decided by the students with the teacher. Shinaberger [
4] shows that students’ absences during active learning in class resulted in larger gaps in learning. Streaming of our face-to-face lectures and exercises will help to solve the above problem.
The redesign of the course brings further strengthening and extension of active learning elements (the question-and-answer technique, minute papers, short videos, detailed tests, and collection of solved, unsolved examples). Some of the materials for the statistics course have already been produced during the COVID-19 pandemic. Others will be completed by the start of the new course. The new study materials and methods take time for teachers to complete. The high academic workload of teachers is a major problem in the implementation of new methods and technologies [
5].
Kayaduman states that good preparation for numerical exercises boosts students’ confidence [
7]. Students can then spend more time interpreting the results obtained than on the calculations themselves. This is our reason for introducing new tests on the current topic discussed at the beginning of the numerical exercises. The other aim is to develop and introduce detailed tests for each lecture. These would thoroughly test students’ final assessment readiness. Students could take the detailed tests multiple times, with no penalty, as exam preparation. Shinaberger describes using quizzes to verify student engagement in home study [
4].
One of the practical requirements is the active use of a spreadsheet. The experience gained in various companies, where students work on practical real-world tasks for the Bachelor’s thesis, shows, that it is a basic tool for analysing operational data. Knowledge of specific statistical packages is only required in some of these companies. Managing them is easy for graduates, who can perform statistical analyses in a spreadsheet. In addition, graduates of the Statistics course can use software tools for scientific calculations and data analysis (Matlab, R project for statistical computing, statistical software Minitab, etc. in other courses).
In recent years, the number of foreign students, who have a mother language other than Slovak, has increased exponentially at the Institute of Control and Informatization of Production Processes. Students register for the study of individual study programs taught in the Slovak language. Therefore, especially in the first semester of study, they have a problem understanding the topics covered. The possibility of watching videos repeatedly could therefore solve the problem of insufficient knowledge of the Slovak language. The number of students studying according to individual study plans is also increasing, as they cannot regularly attend lectures and exercises. The opportunity to watch short video lectures at a time that suits them would also help these students. Also in Donohue and Richard’s work [
8], there was a problem with foreign students having trouble understanding the lectures. The lecture videos and cooperative learning helped reduce this problem.
Teaching during the COVID-19 pandemic has brought some risks, but also opportunities. Teachers and students acquired new skills and competencies (Cisco Webex, MS Teams). Similar experiences were published by Pócsová et al. in their study [
11]. Students’ time management, systematics, ability to give and receive constructive criticism, and to develop critical thinking have improved. Some of these opportunities and elements mentioned above, have been considered by teacher teams for the redesign of the course (online meetings, streaming lectures, etc.). Many risks in changing to a full-time form of teaching have disappeared. Of the remaining ones, the most important is the risk of teachers using different online platforms for different courses, or even within a single course. Should a new pandemic emerge, teachers would be better prepared to handle it.
9. Conclusions
This article focuses on the redesign of the Statistics course taught at the Institute of Control and Informatization of Production Processes. One of the limitations of this study is the fact that the research was conducted only at this institute. It identifies and generalizes the requirements of some stakeholders (students, teachers, university, and employers). The article analyses and compares the results of the overall student assessments from the Mathematics course and the Statistics course. It identifies and explores the opinions of graduates of the course by using an anonymous questionnaire survey. The study reflects on teachers’ and students’ experiences with online teaching during the COVID-19 pandemic. The article builds on positive experiences by using active-learning elements in the Mathematics course.
The authors of the article asked three research questions (RQ1–RQ3). From the processed data from MAIS, it was found that there was no statistically significant difference in the overall assessments of students in the Mathematics course and the Statistics course (RQ1). Students perform comparably in both courses. Since the 2010/2011 academic year, the overall assessment in the Statistics course has been several points higher than the overall assessment in the Mathematics course. Over the last 2 years there has been a 10-point drop in the Statistics course assessment (RQ2). On the other hand, the Mathematics course rating has improved in the last three years. The difference between the courses observed can also be seen in the number of remedial and second remedial of term assessments.
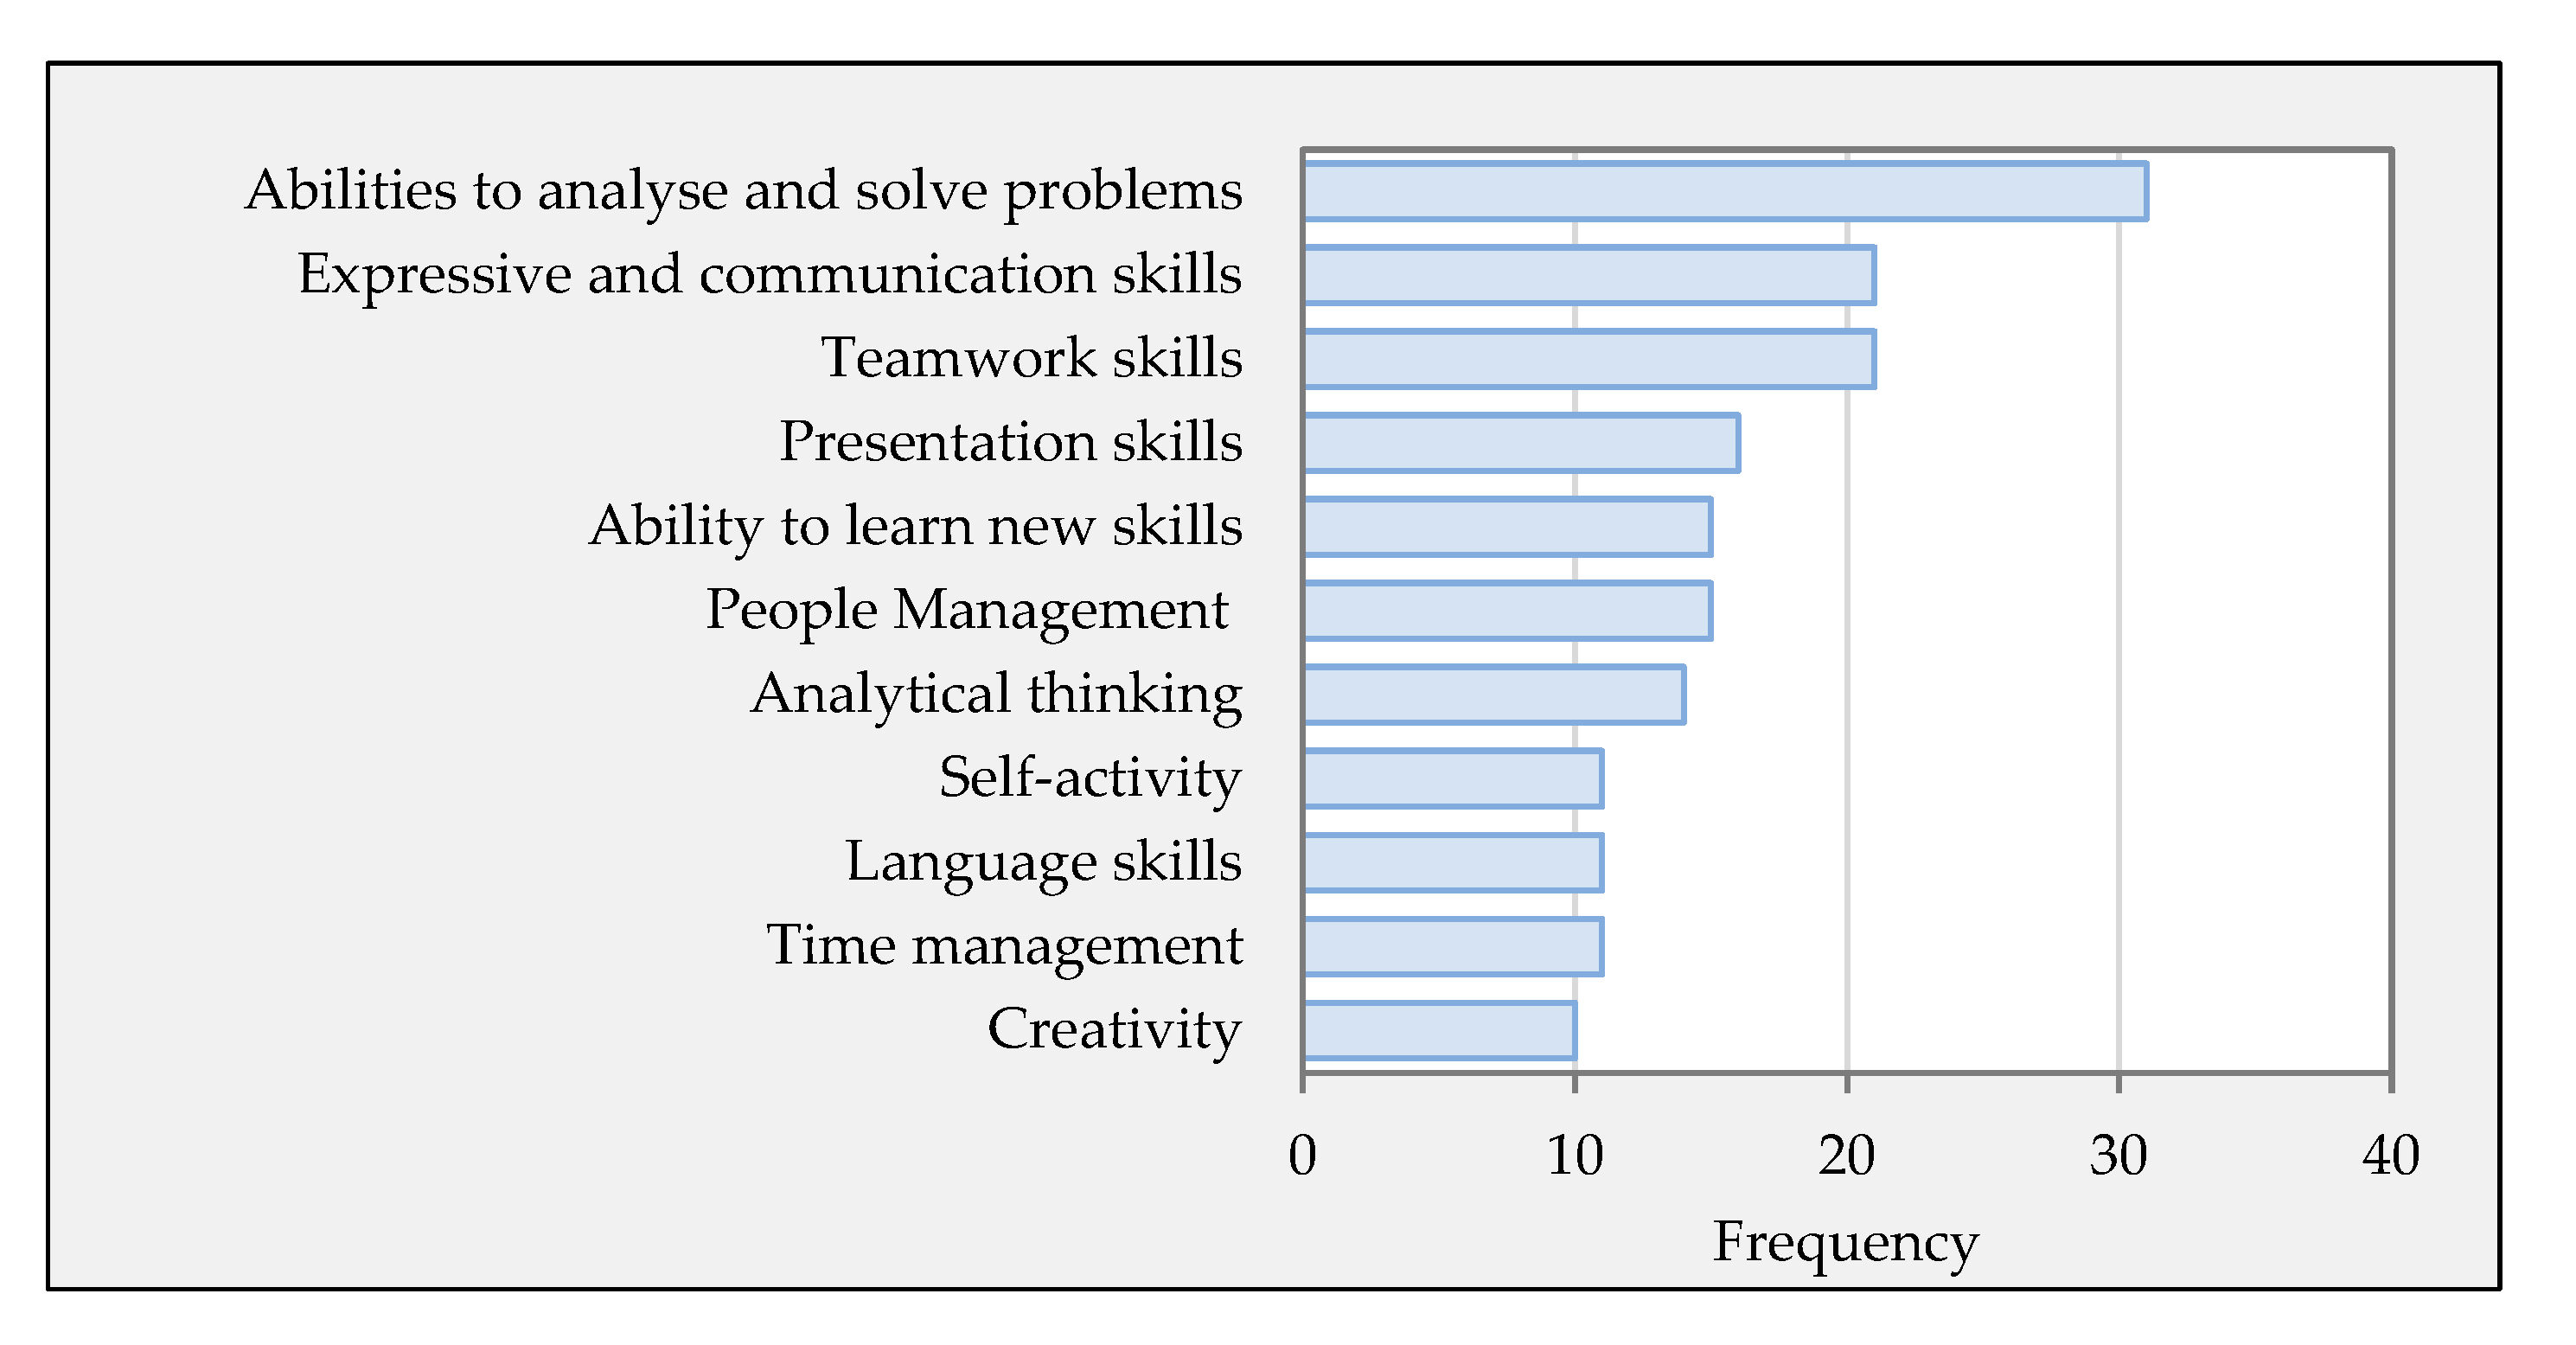
A questionnaire survey of the graduates of the course over five years showed that 81.08% of the graduates were satisfied with the lectures, and up to 97.30% were satisfied with the numerical exercises. The questionnaire survey confirmed that the current form of implementation of the Statistics course develops hard and soft skills. It contributed mainly to develop abilities to analyze and solve problems, develop expressive, communication, and teamwork skills as well as the presentation skills of students. Individual work in solving the problems is not considered by the students to be a form of work that would contribute to improvement (64.96%). The improvements would be made through the use of group-solving of multiple examples (75.68%), self-assessment after an exercise (72.97%), checking students’ readiness for the exercise at the beginning of the exercise (62.16%), and self-study before the exercise (59.46%).
Based on the responses to RQ1 and RQ2, as well as the results from the questionnaire survey, a change in the Statistics course (RQ3) was desired. The redesign of the Statistics course was mainly inspired by the requirements of the practice, the requirements of the graduates of the course, as well as the development of new learning technologies. An effort was made to enhance the development of soft skills (teamwork, presentation skills, critical thinking skills of students, etc.) and to reduce students’ concerns about the difficulty of completing the course.
The presented redesign of the Statistics course can also be applied at other institutes working in similar conditions (course curriculum and assessment, technical equipment, ICT resources, etc.). The redesign can be especially inspiring for universities of technical orientation.
From the literature review and the experience of the teaching team of the Statistics course at the Institute of Control and Informatization of Production Processes consider that the elements of active learning are useful. These teaching elements contribute to soft-skill development and a better understanding of the statistical methods by students. A better understanding of the statistical methods contributes to better use by graduates in their professional life.
Future research should also integrate other courses implemented at this institute that use elements of active learning. Its aim would be to comprehensively assess the impact of these elements on the learning process of the graduates. This requires one to design a questionnaire to ascertain students’ attitudes and expectations of the courses. A further need is to conduct a non-anonymous questionnaire survey at the beginning and end of these courses. Then it is necessary to compare students’ expectations with their overall assessments of the given course. A final step would be implementation of the results of future research into the continual improvement cycle.


