
A Coupled Mathematical Model of the Dissemination Route of Short-Term Fund-Raising Fraud


Abstract
:1. Introduction
2. Materials and Methods
2.1. Population Dynamics
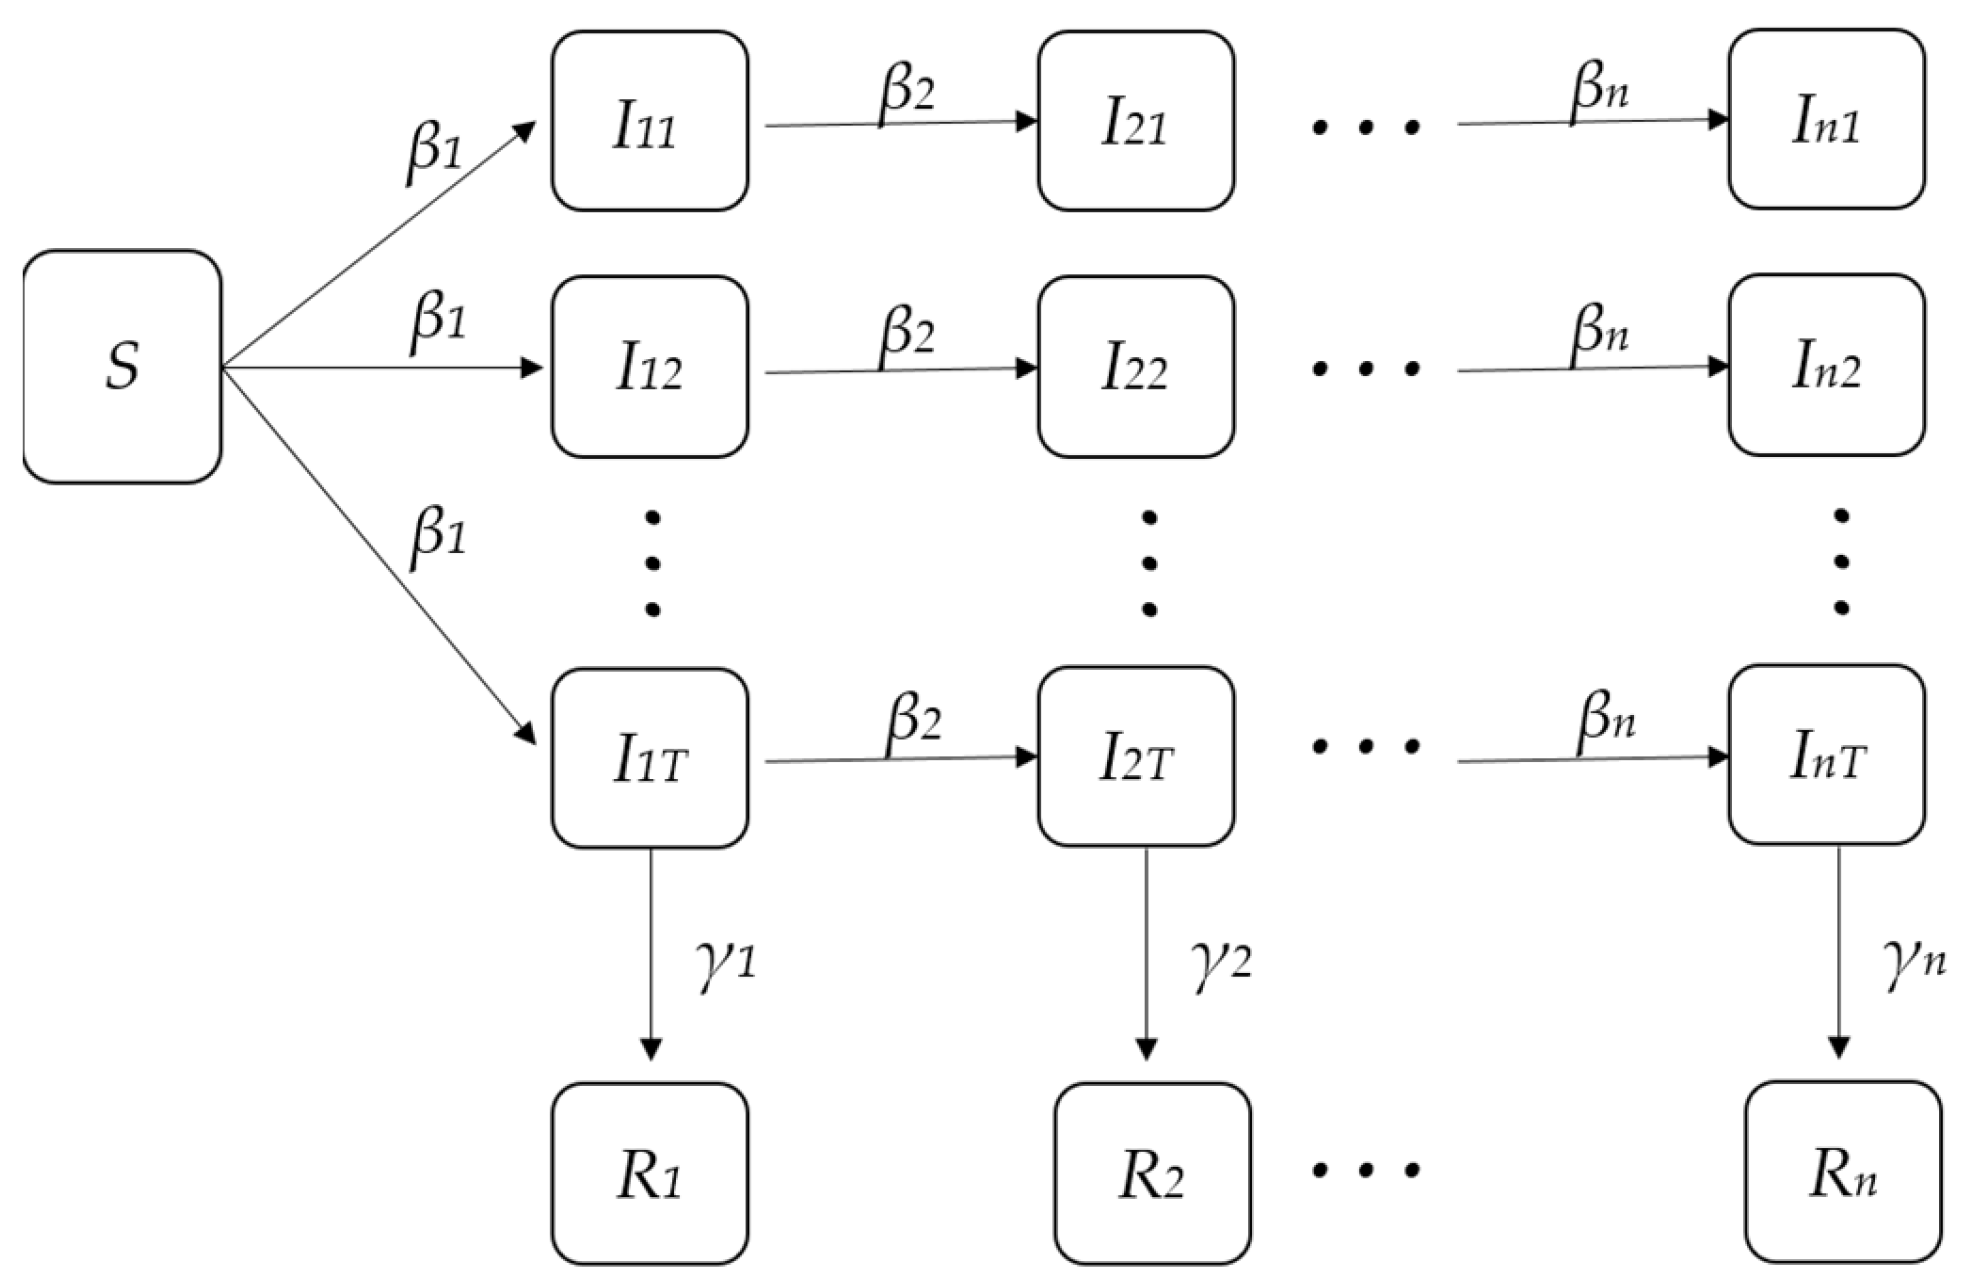
2.1.1. SIR Model
- Regardless of dynamic factors such as birth, death, and mobility, the population always maintains a constant, that is, N(t) ≡ C.
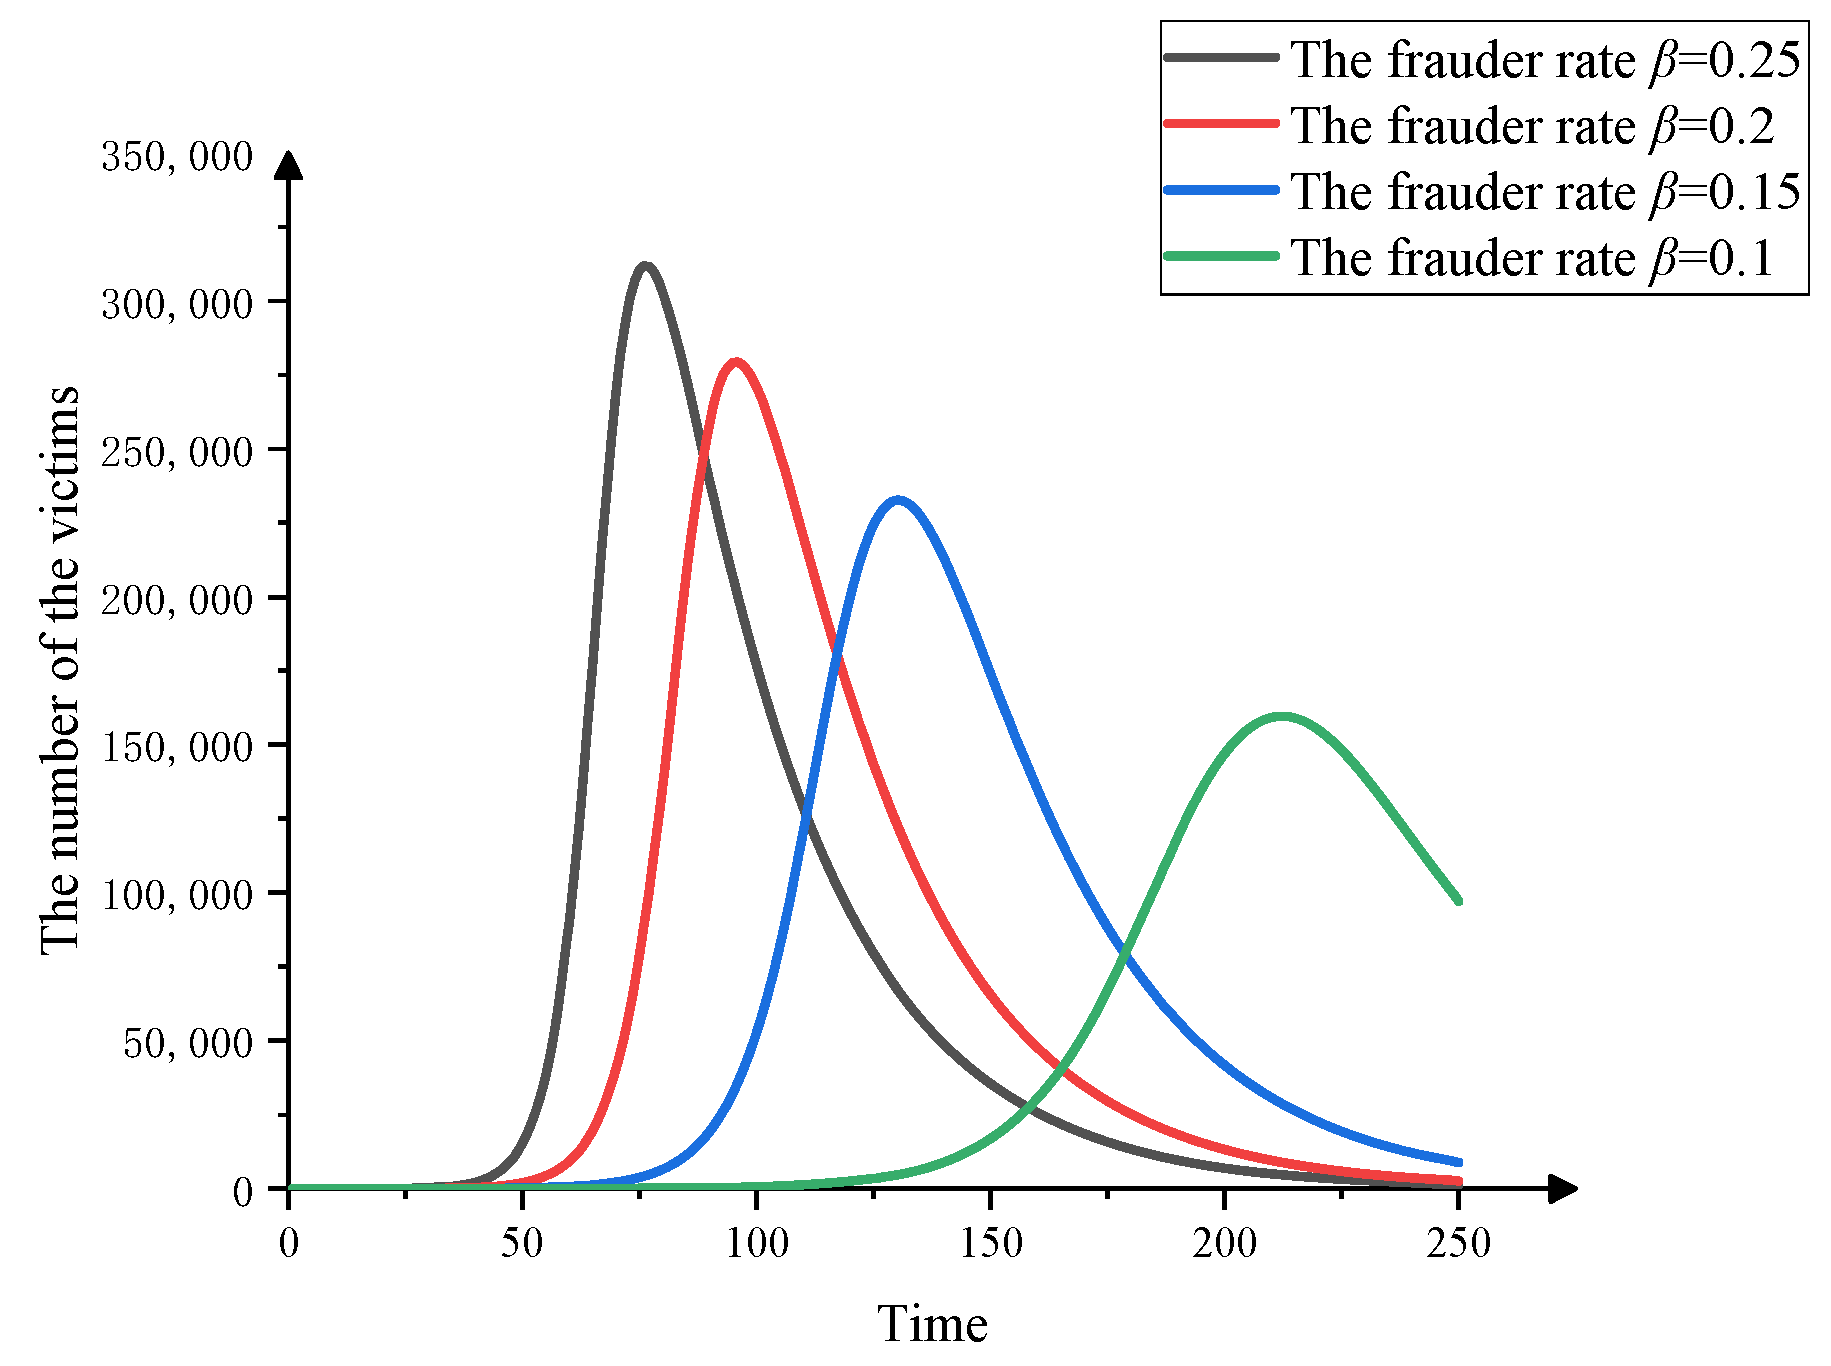
- Once a victim comes into contact with the susceptibles, the fraud must have a certain infectivity. It is assumed that in unit time t, the number of susceptibles that a victim can infect is proportional to the total number of susceptibles S(t) in this environment, and the proportional coefficient is β. Thus, the number of people infected by all victims in unit time t is βS(t)I(t).
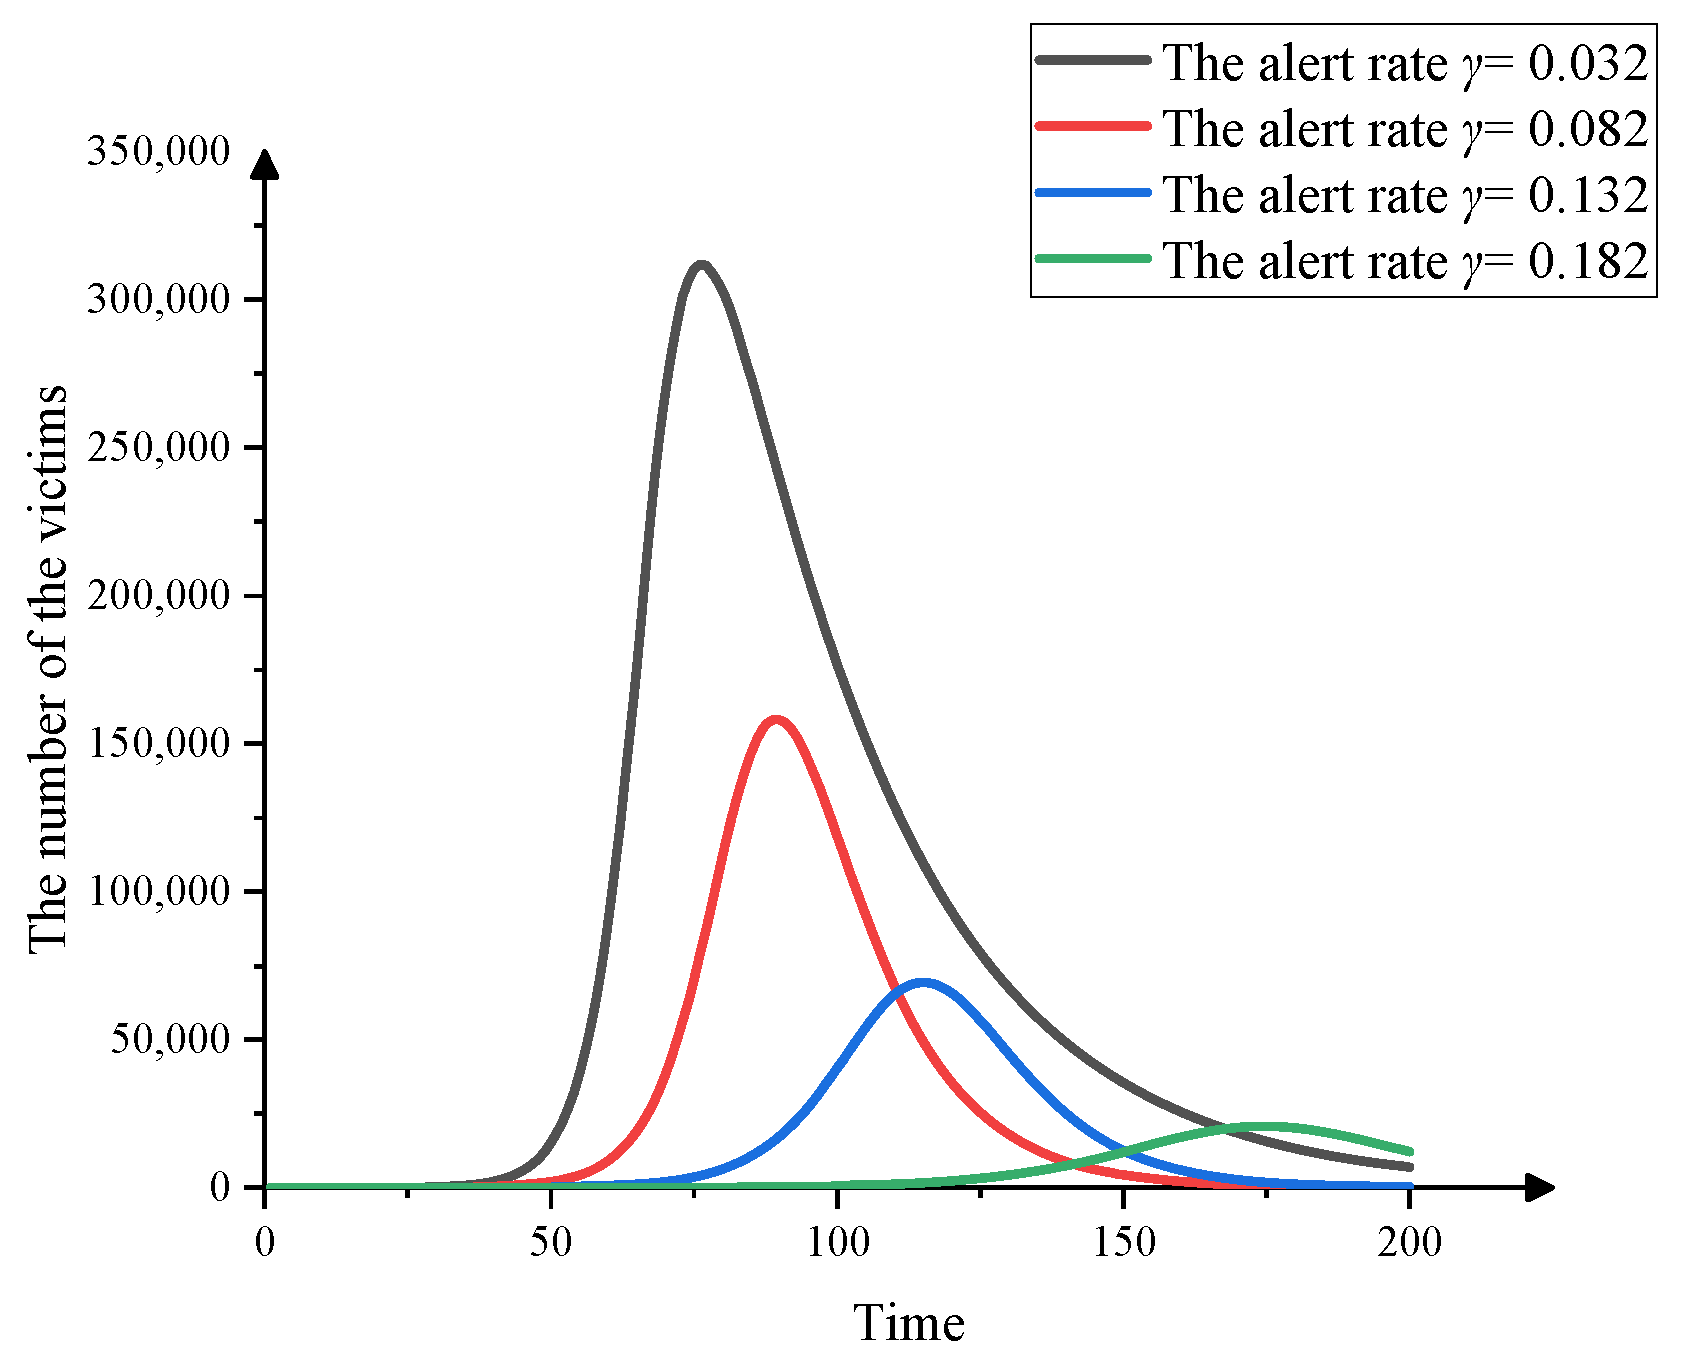
- At time t, the number of alerts removed from victims in unit time is directly proportional to the number of victims, and the proportion coefficient is γ. The number of alerts removed per unit time is γI(t).
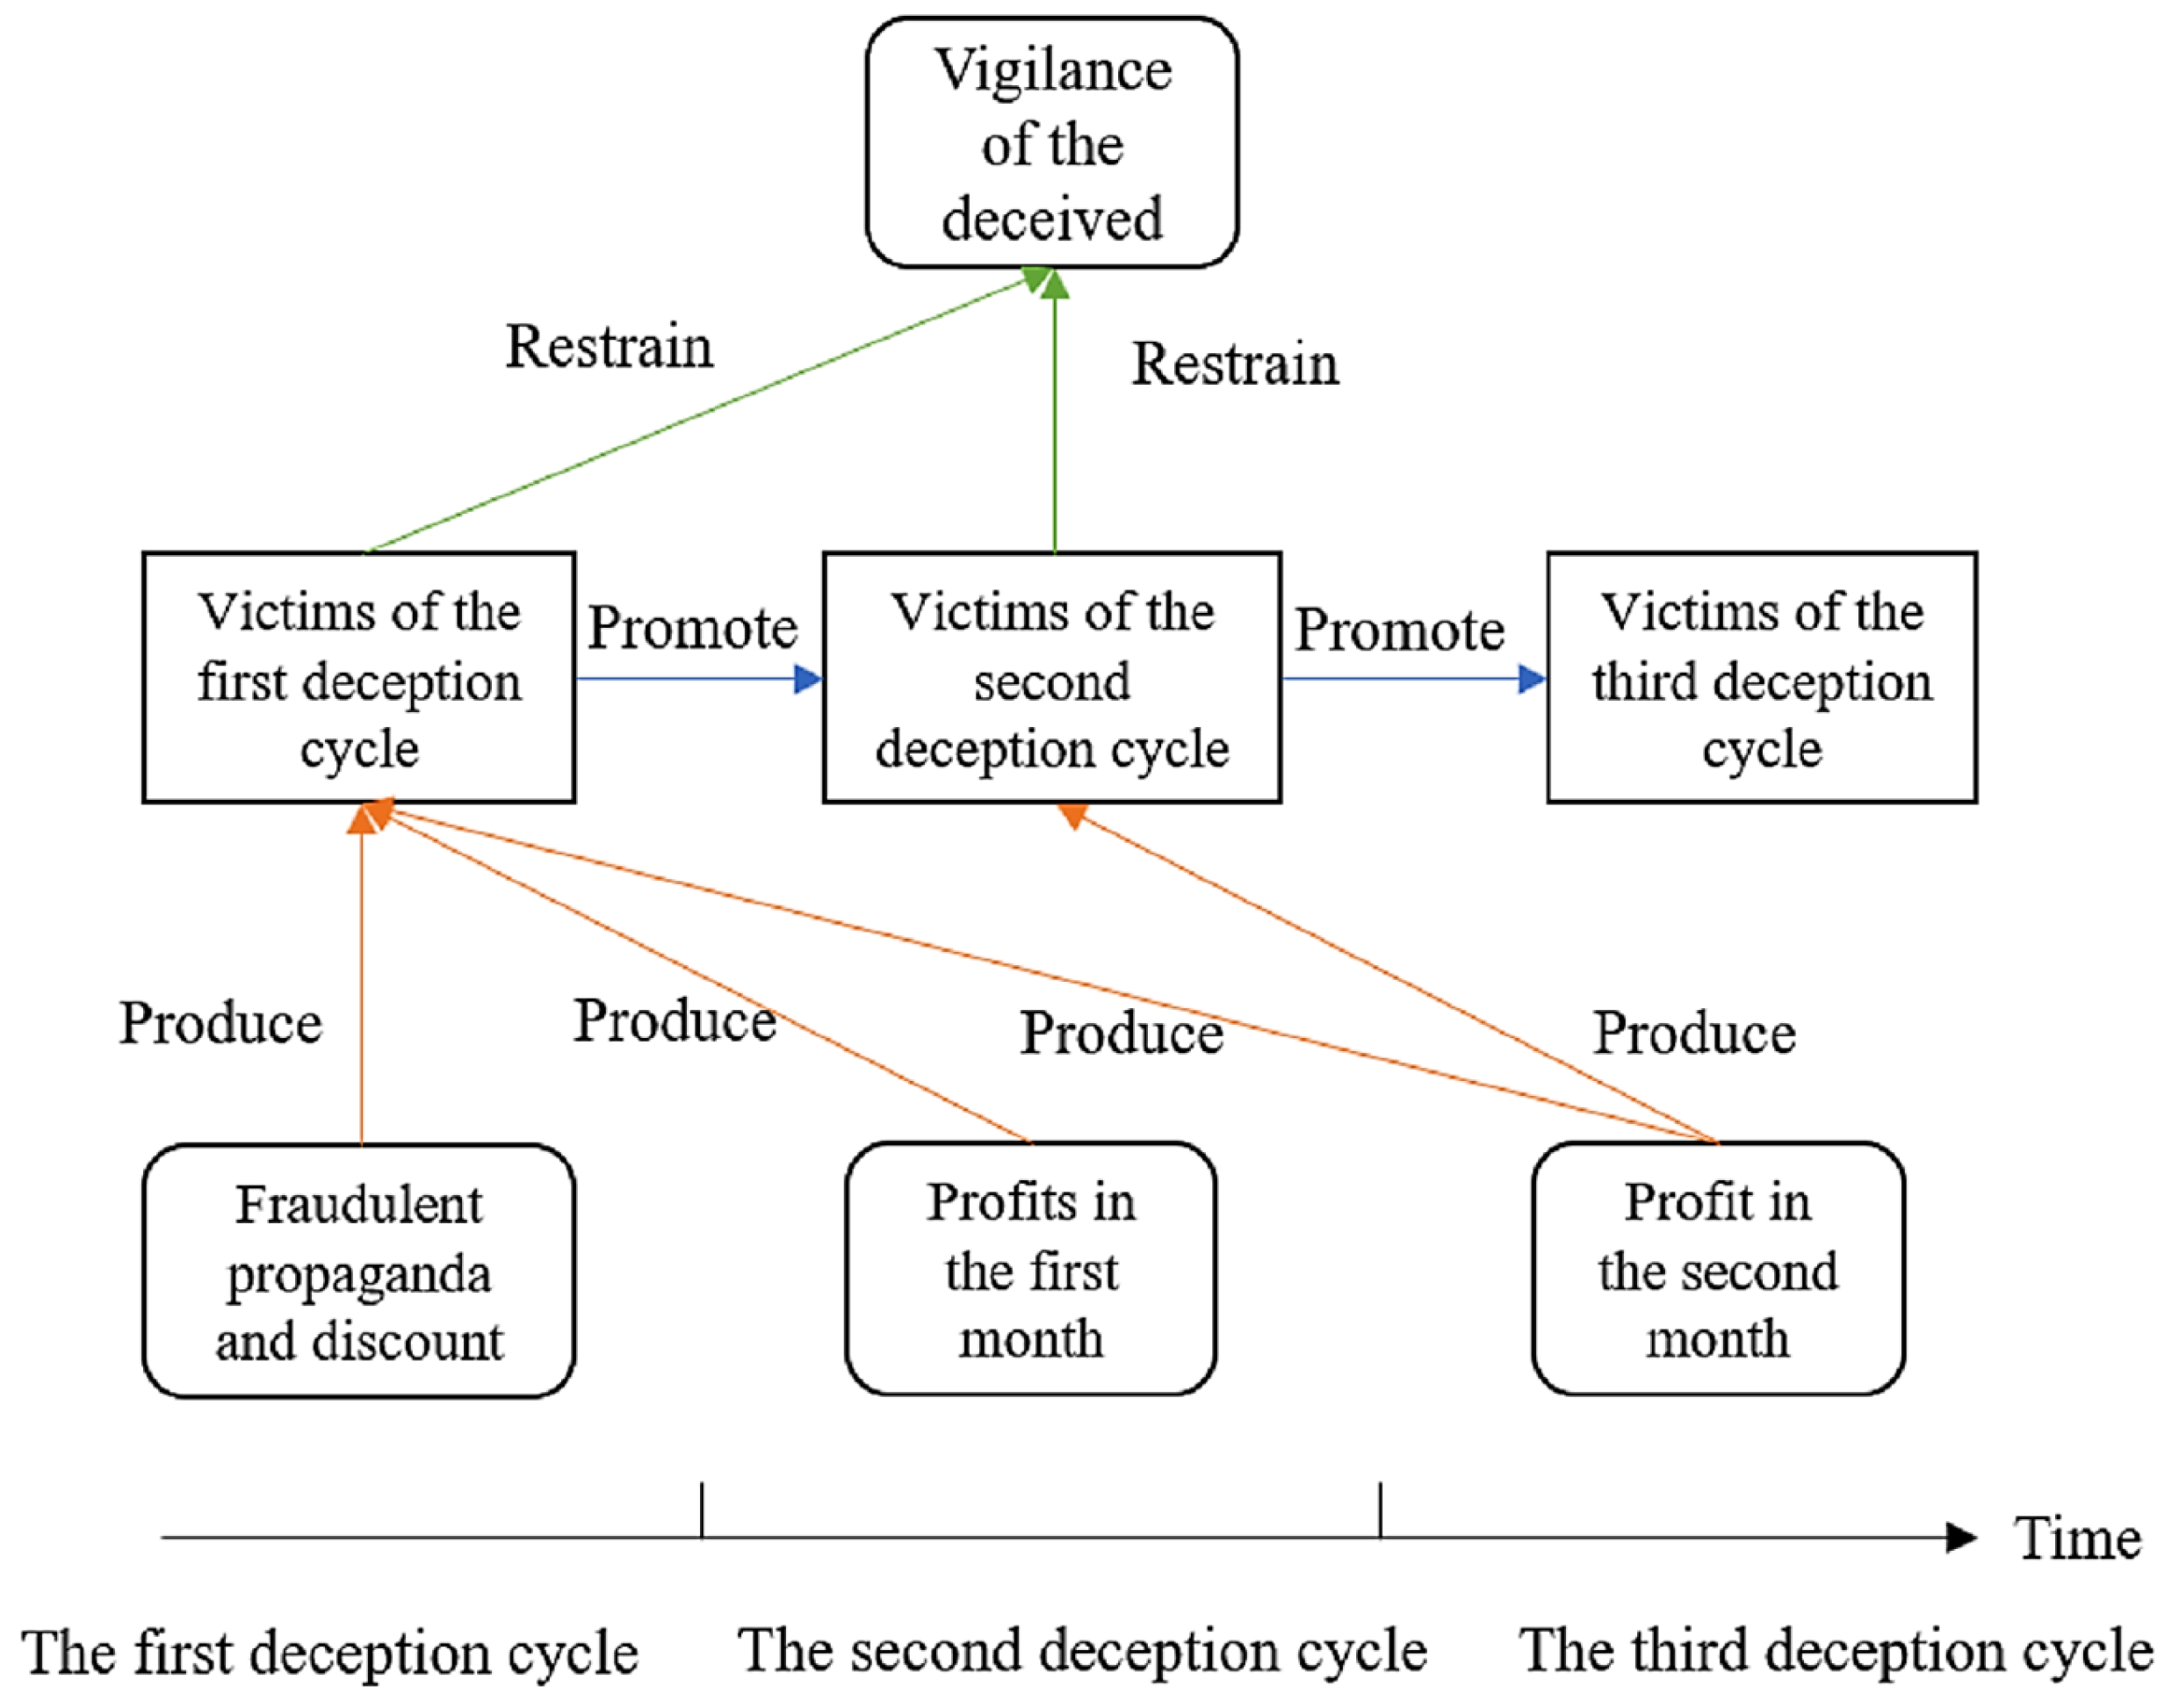
2.1.2. Capital Flow and Profit of the Fraud
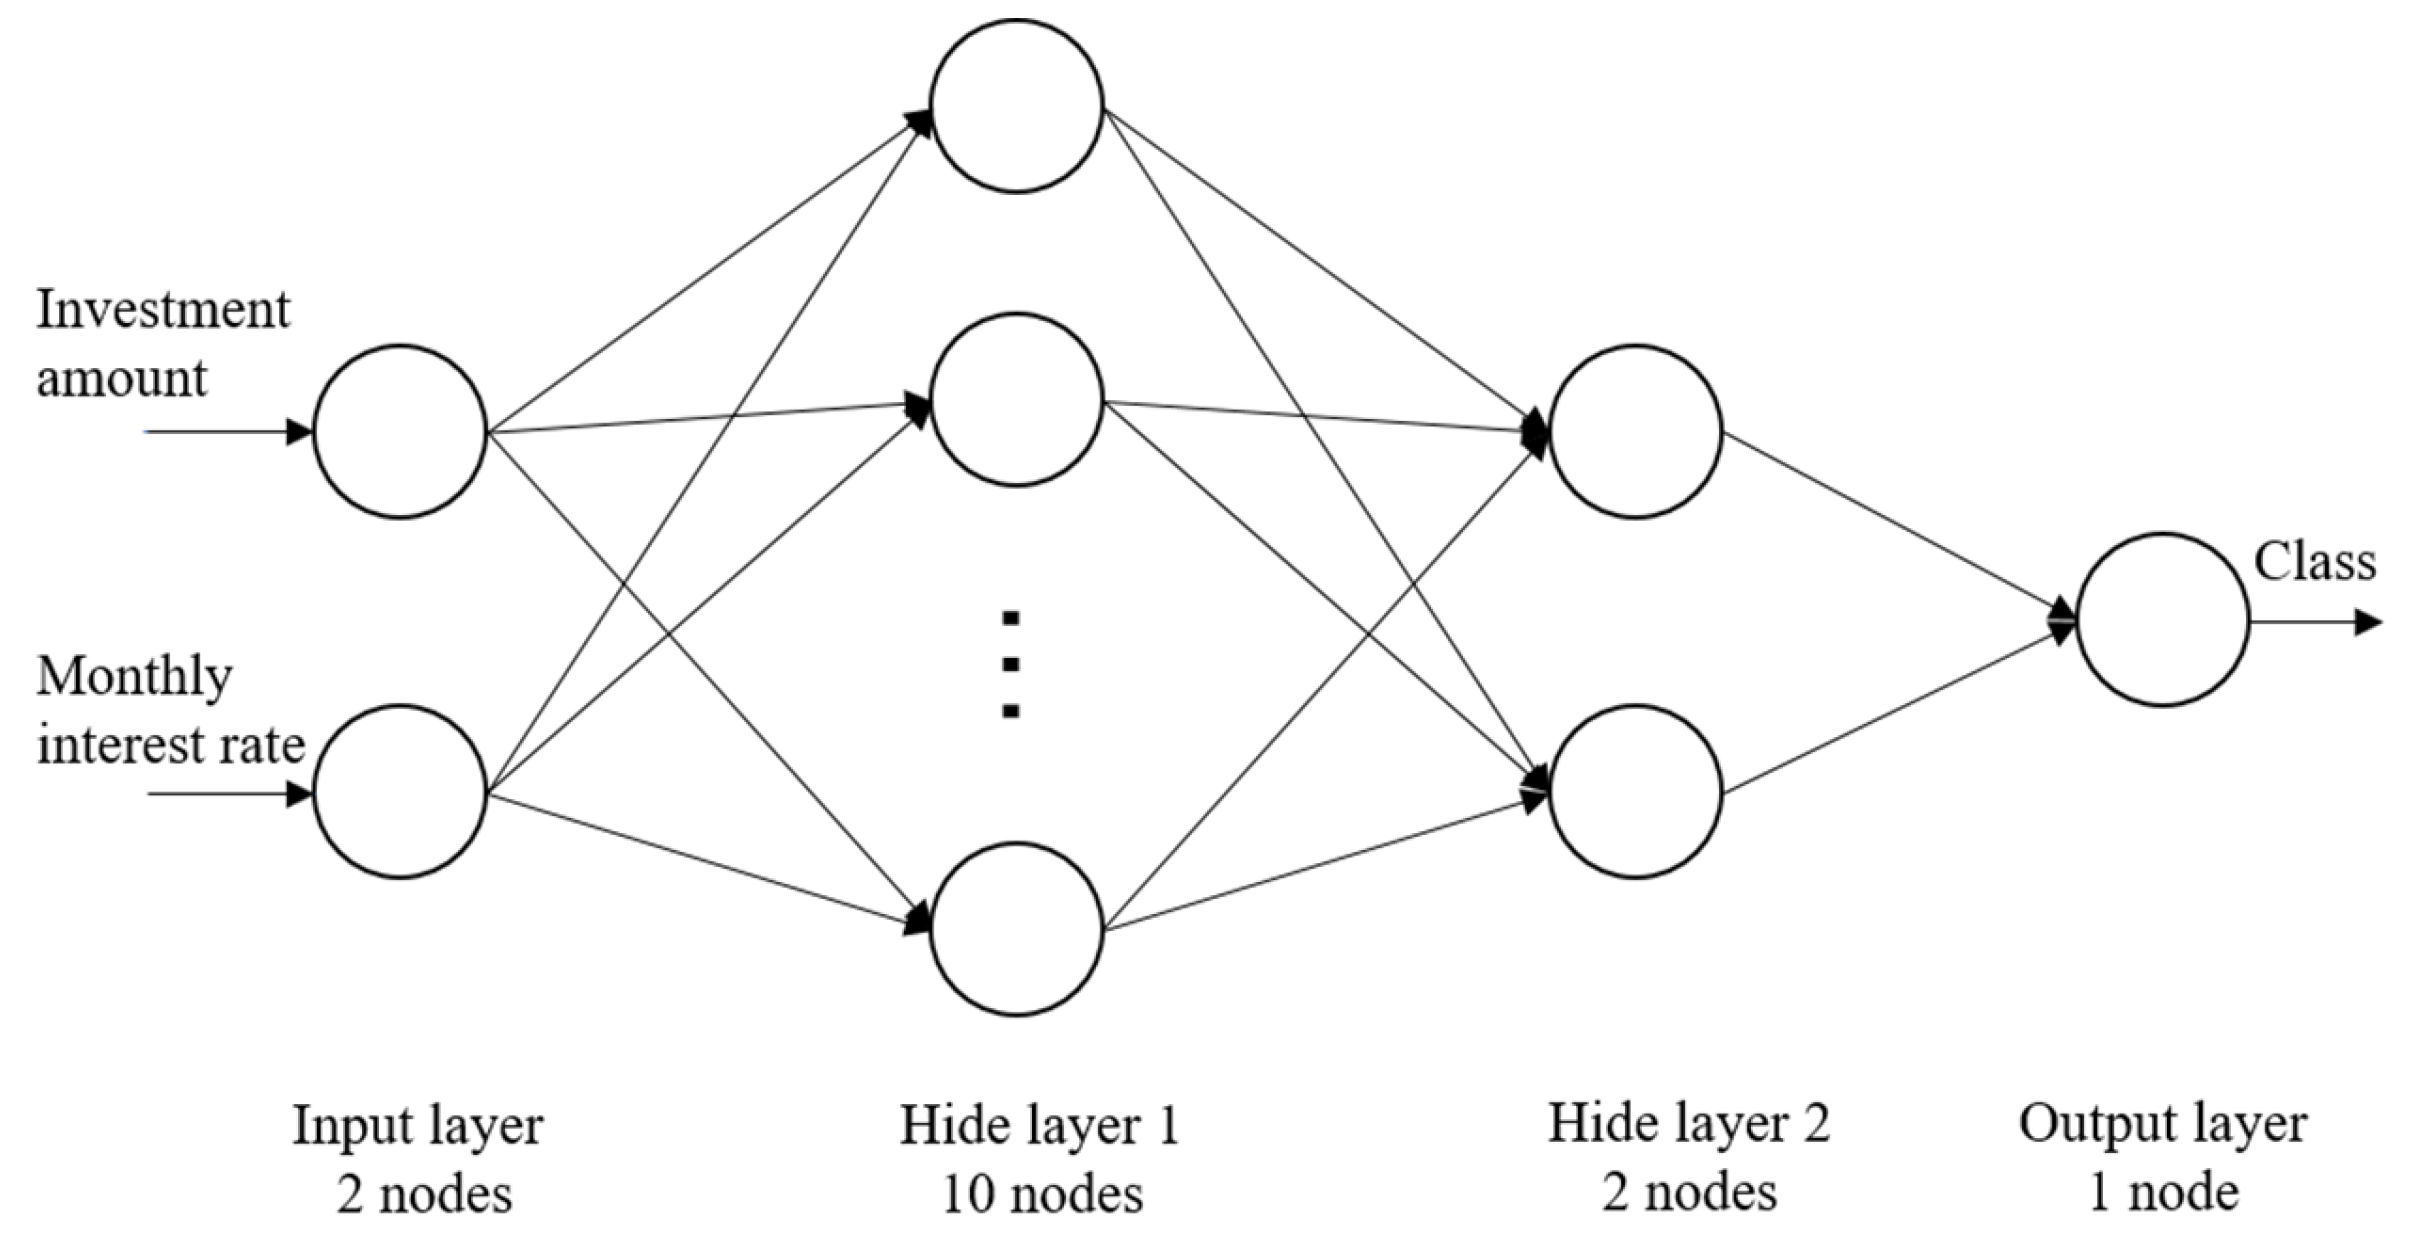
2.2. BP Neural Network
2.3. The Fault Tree and Bayesian Network
2.3.1. Basic Principles of the Fault Tree
2.3.2. Basic Principles of Bayesian Network
2.3.3. Importance Calculation
2.4. Description of the Survey
3. Results and Discussions
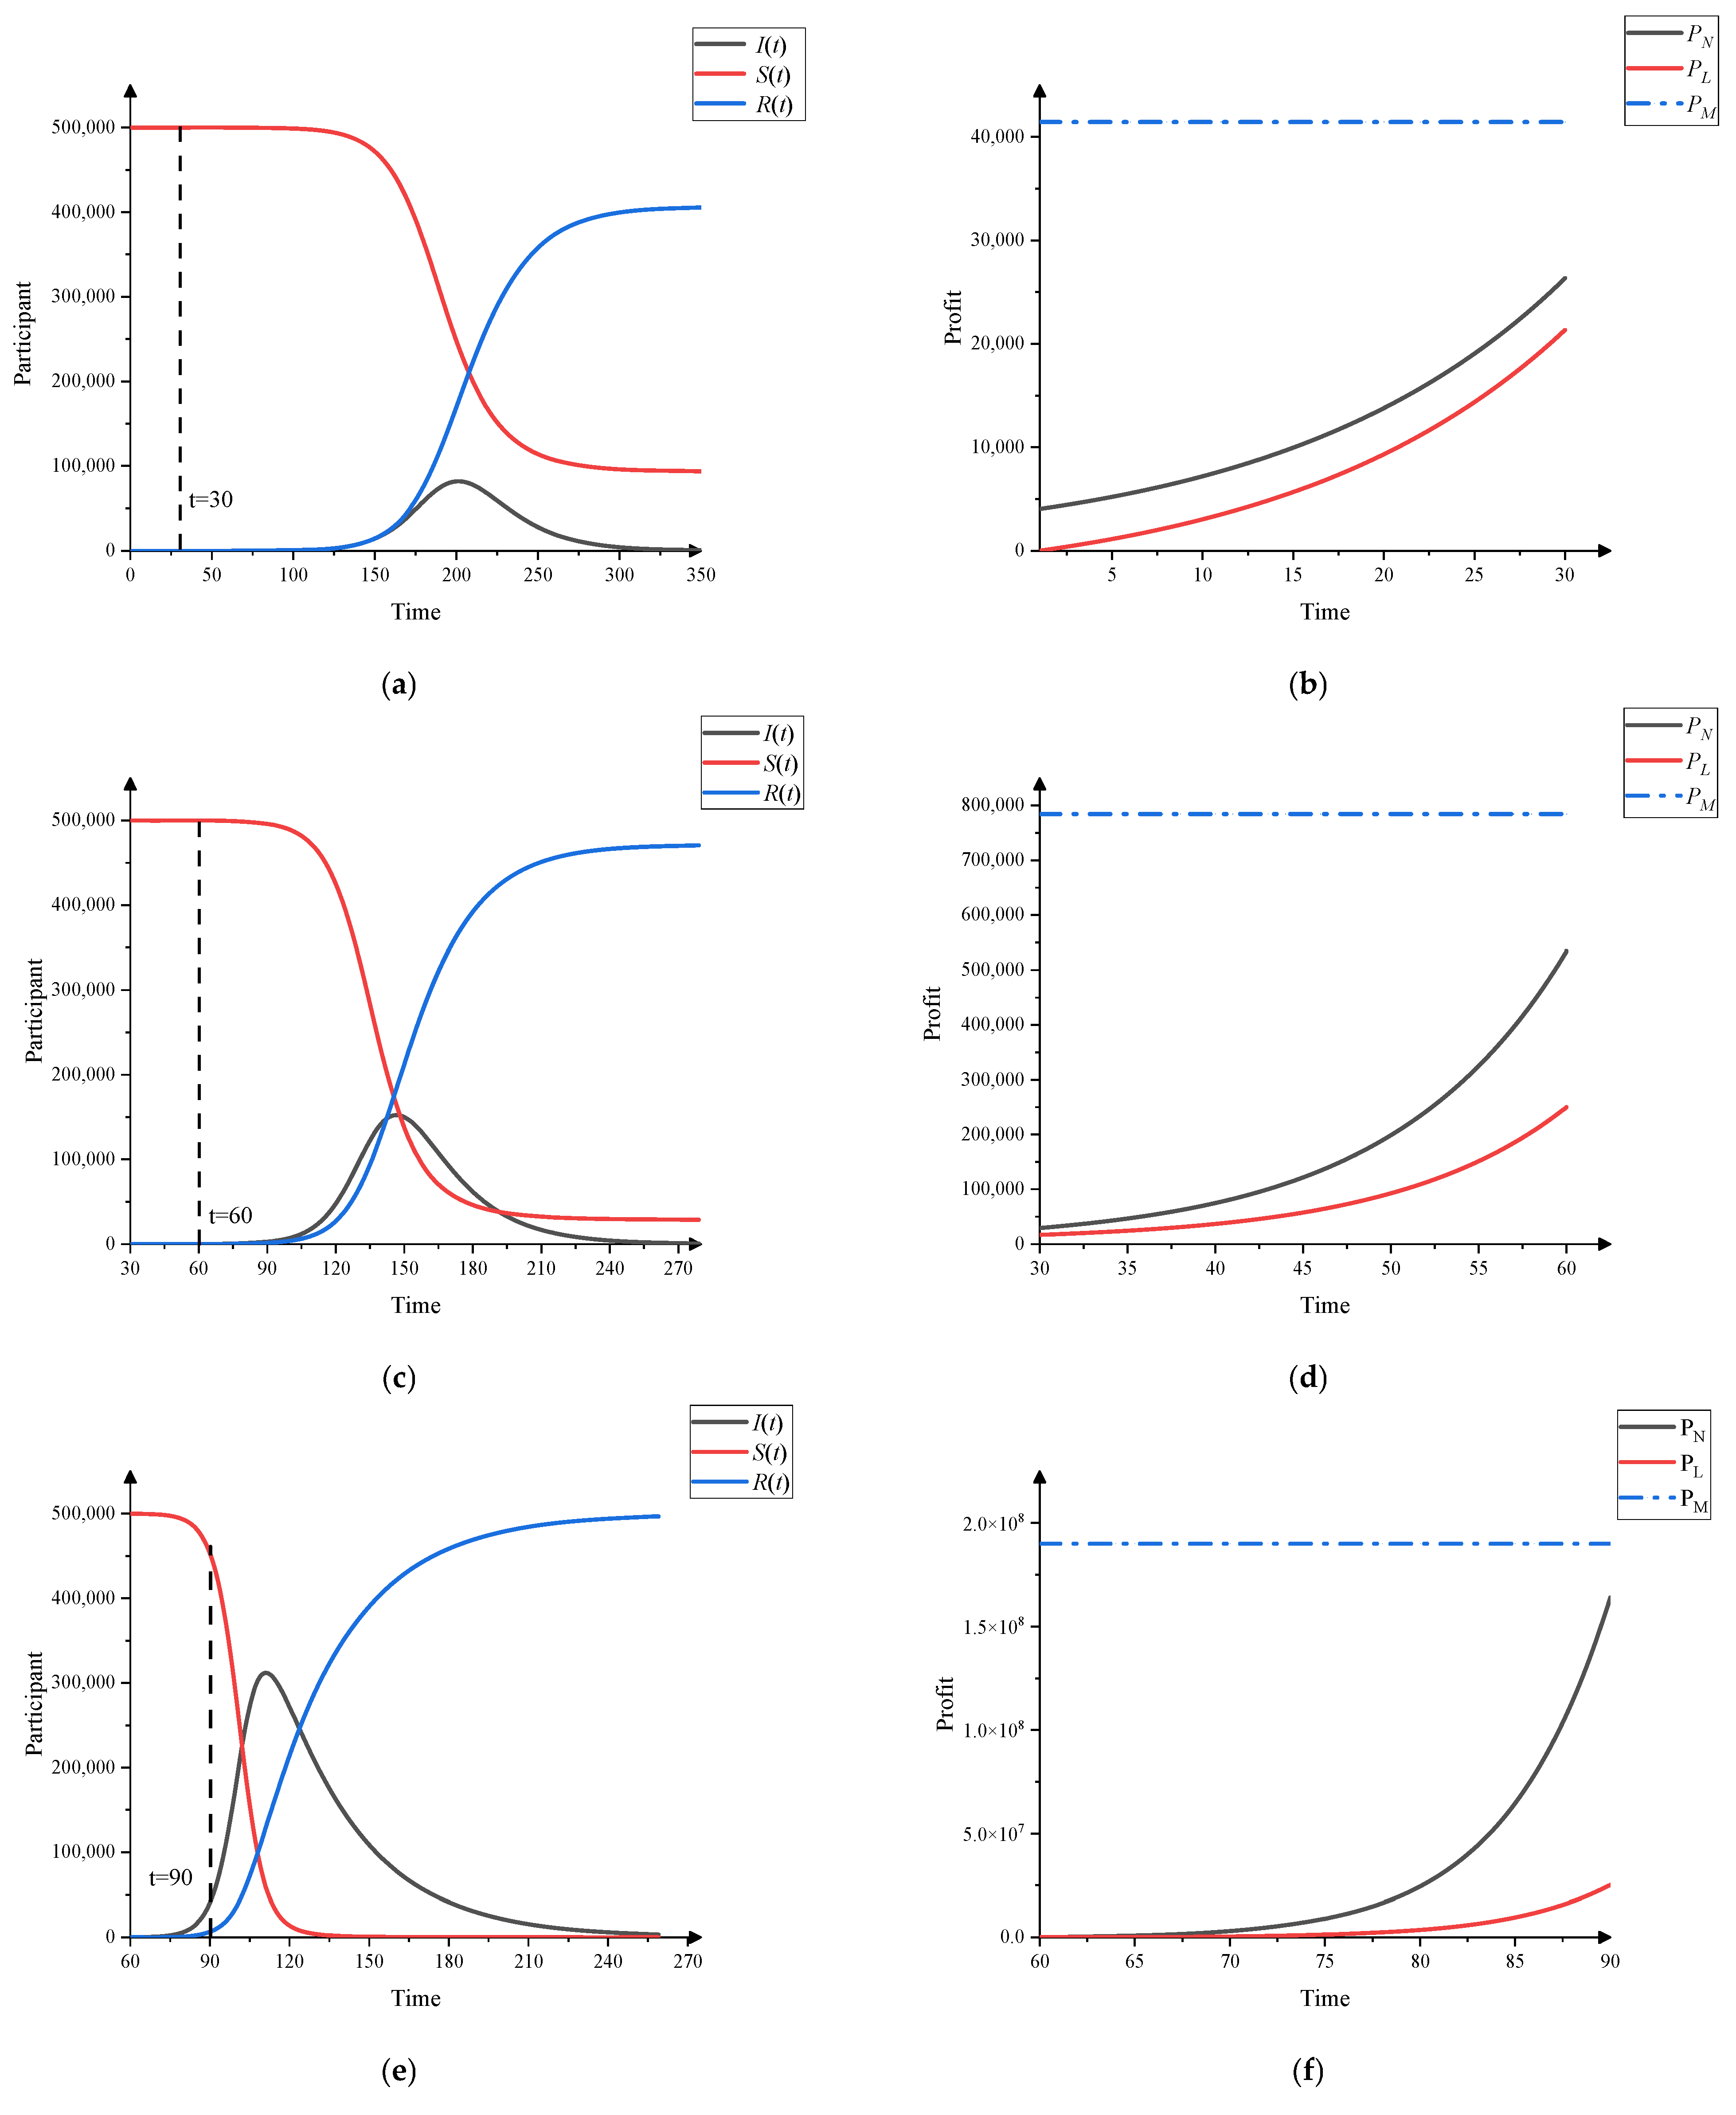
3.1. Dissemination Simulation of Fraud
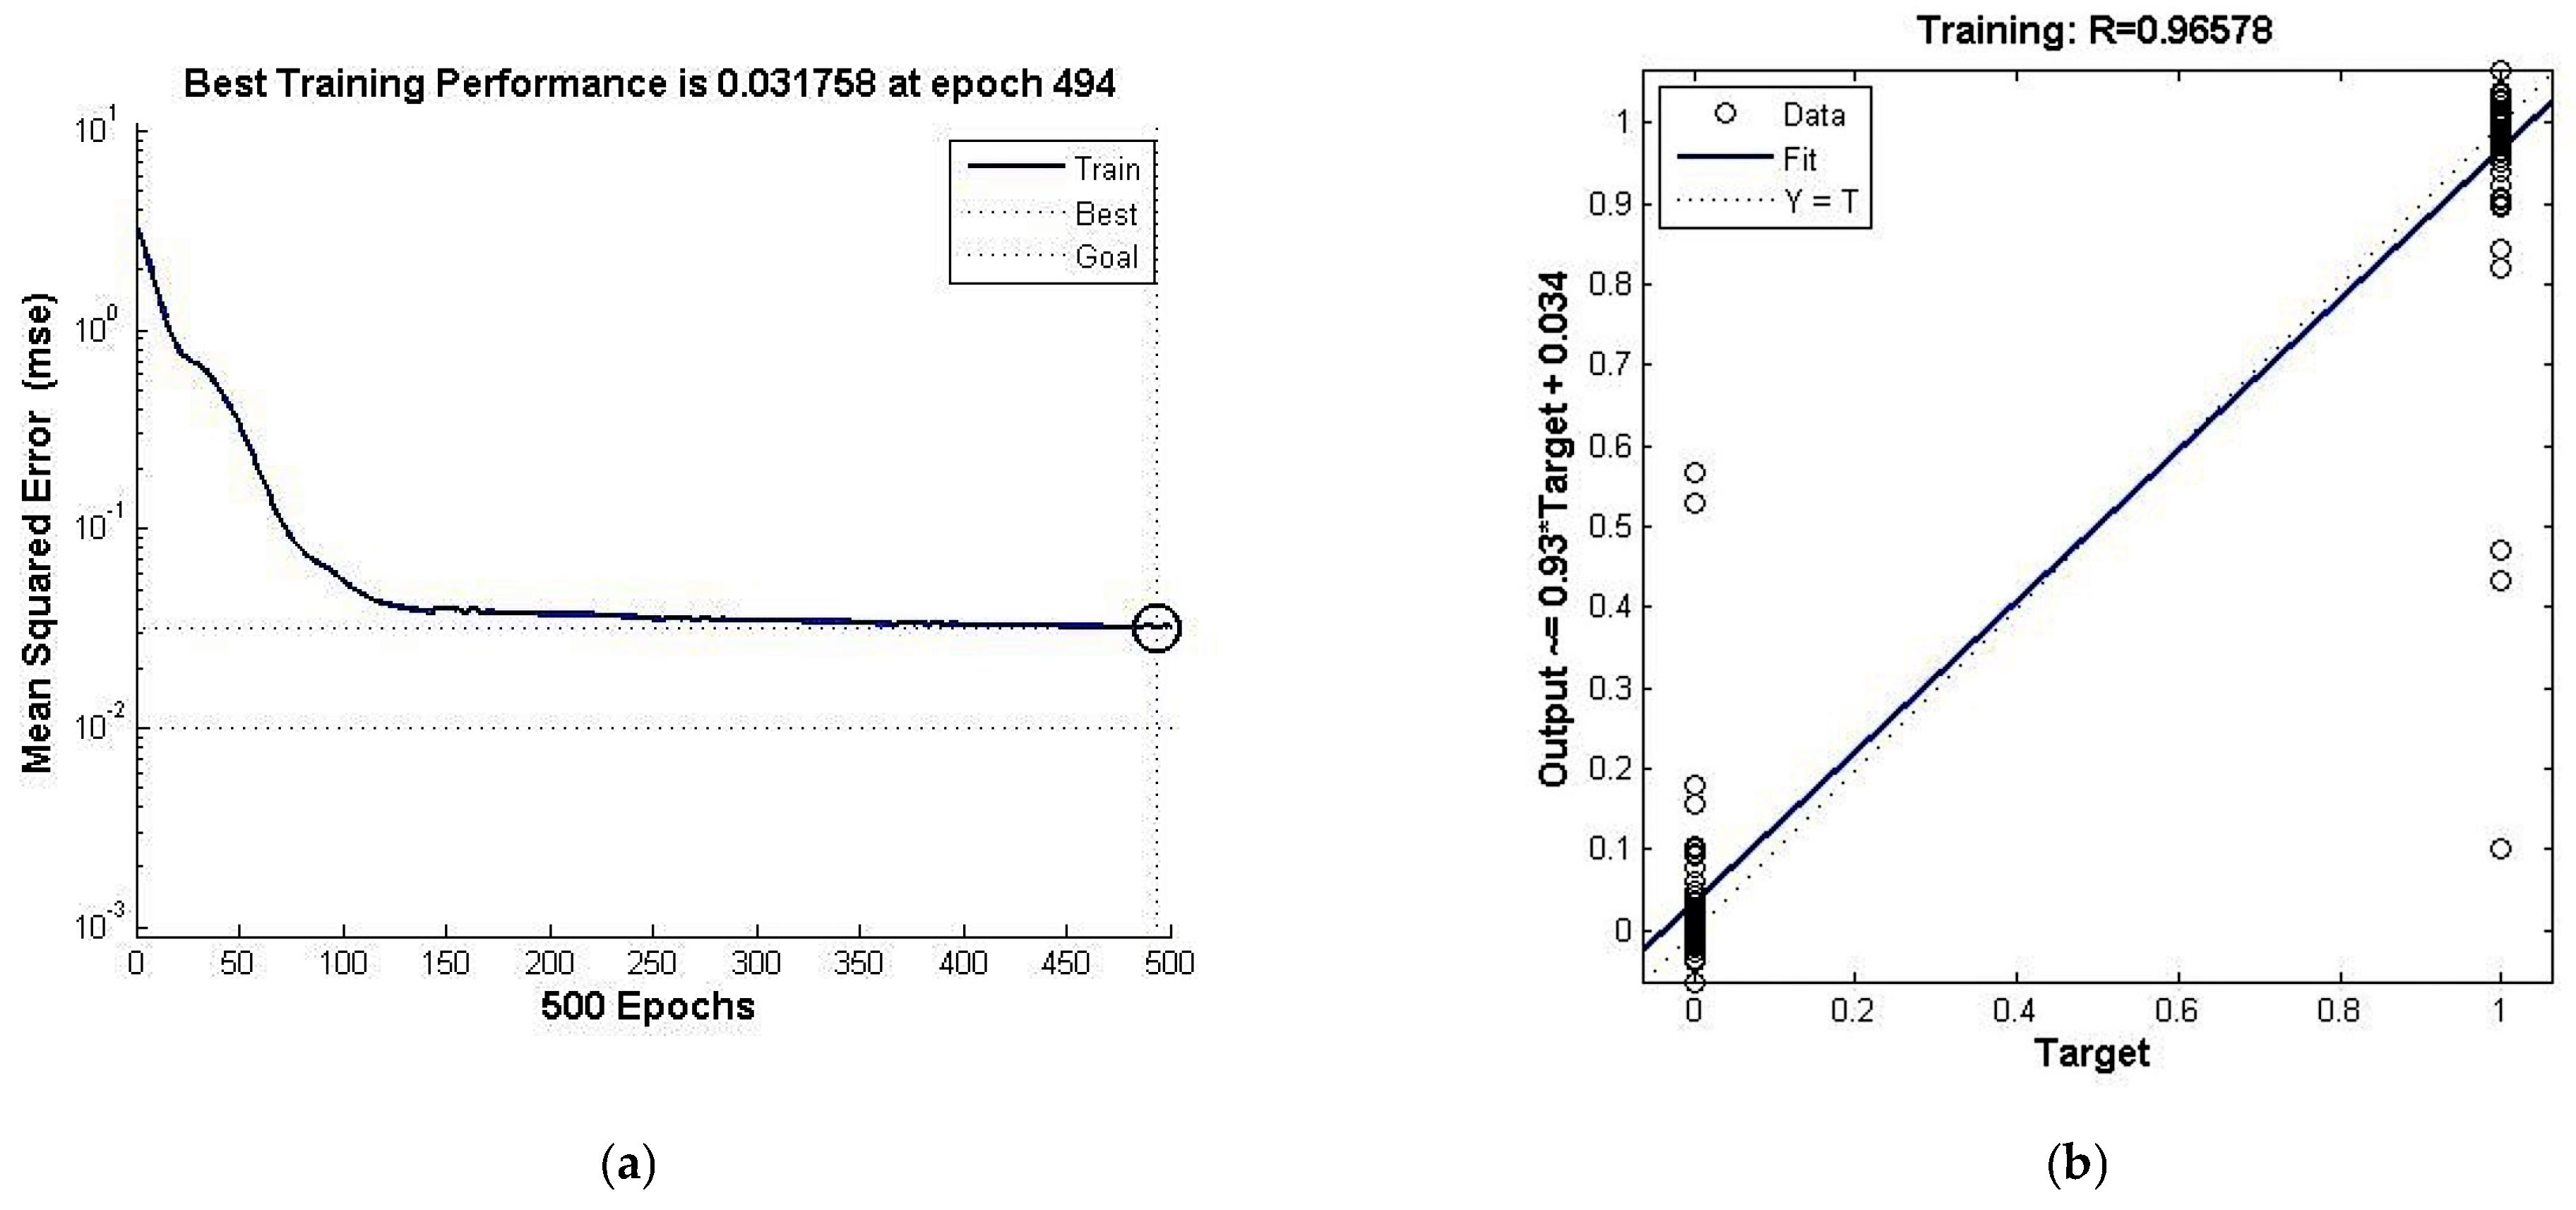
3.2. BP Neural Network Analysis
3.2.1. BP Neural Network Identification Analysis
3.2.2. The Influence of BP Neural Network Parameters
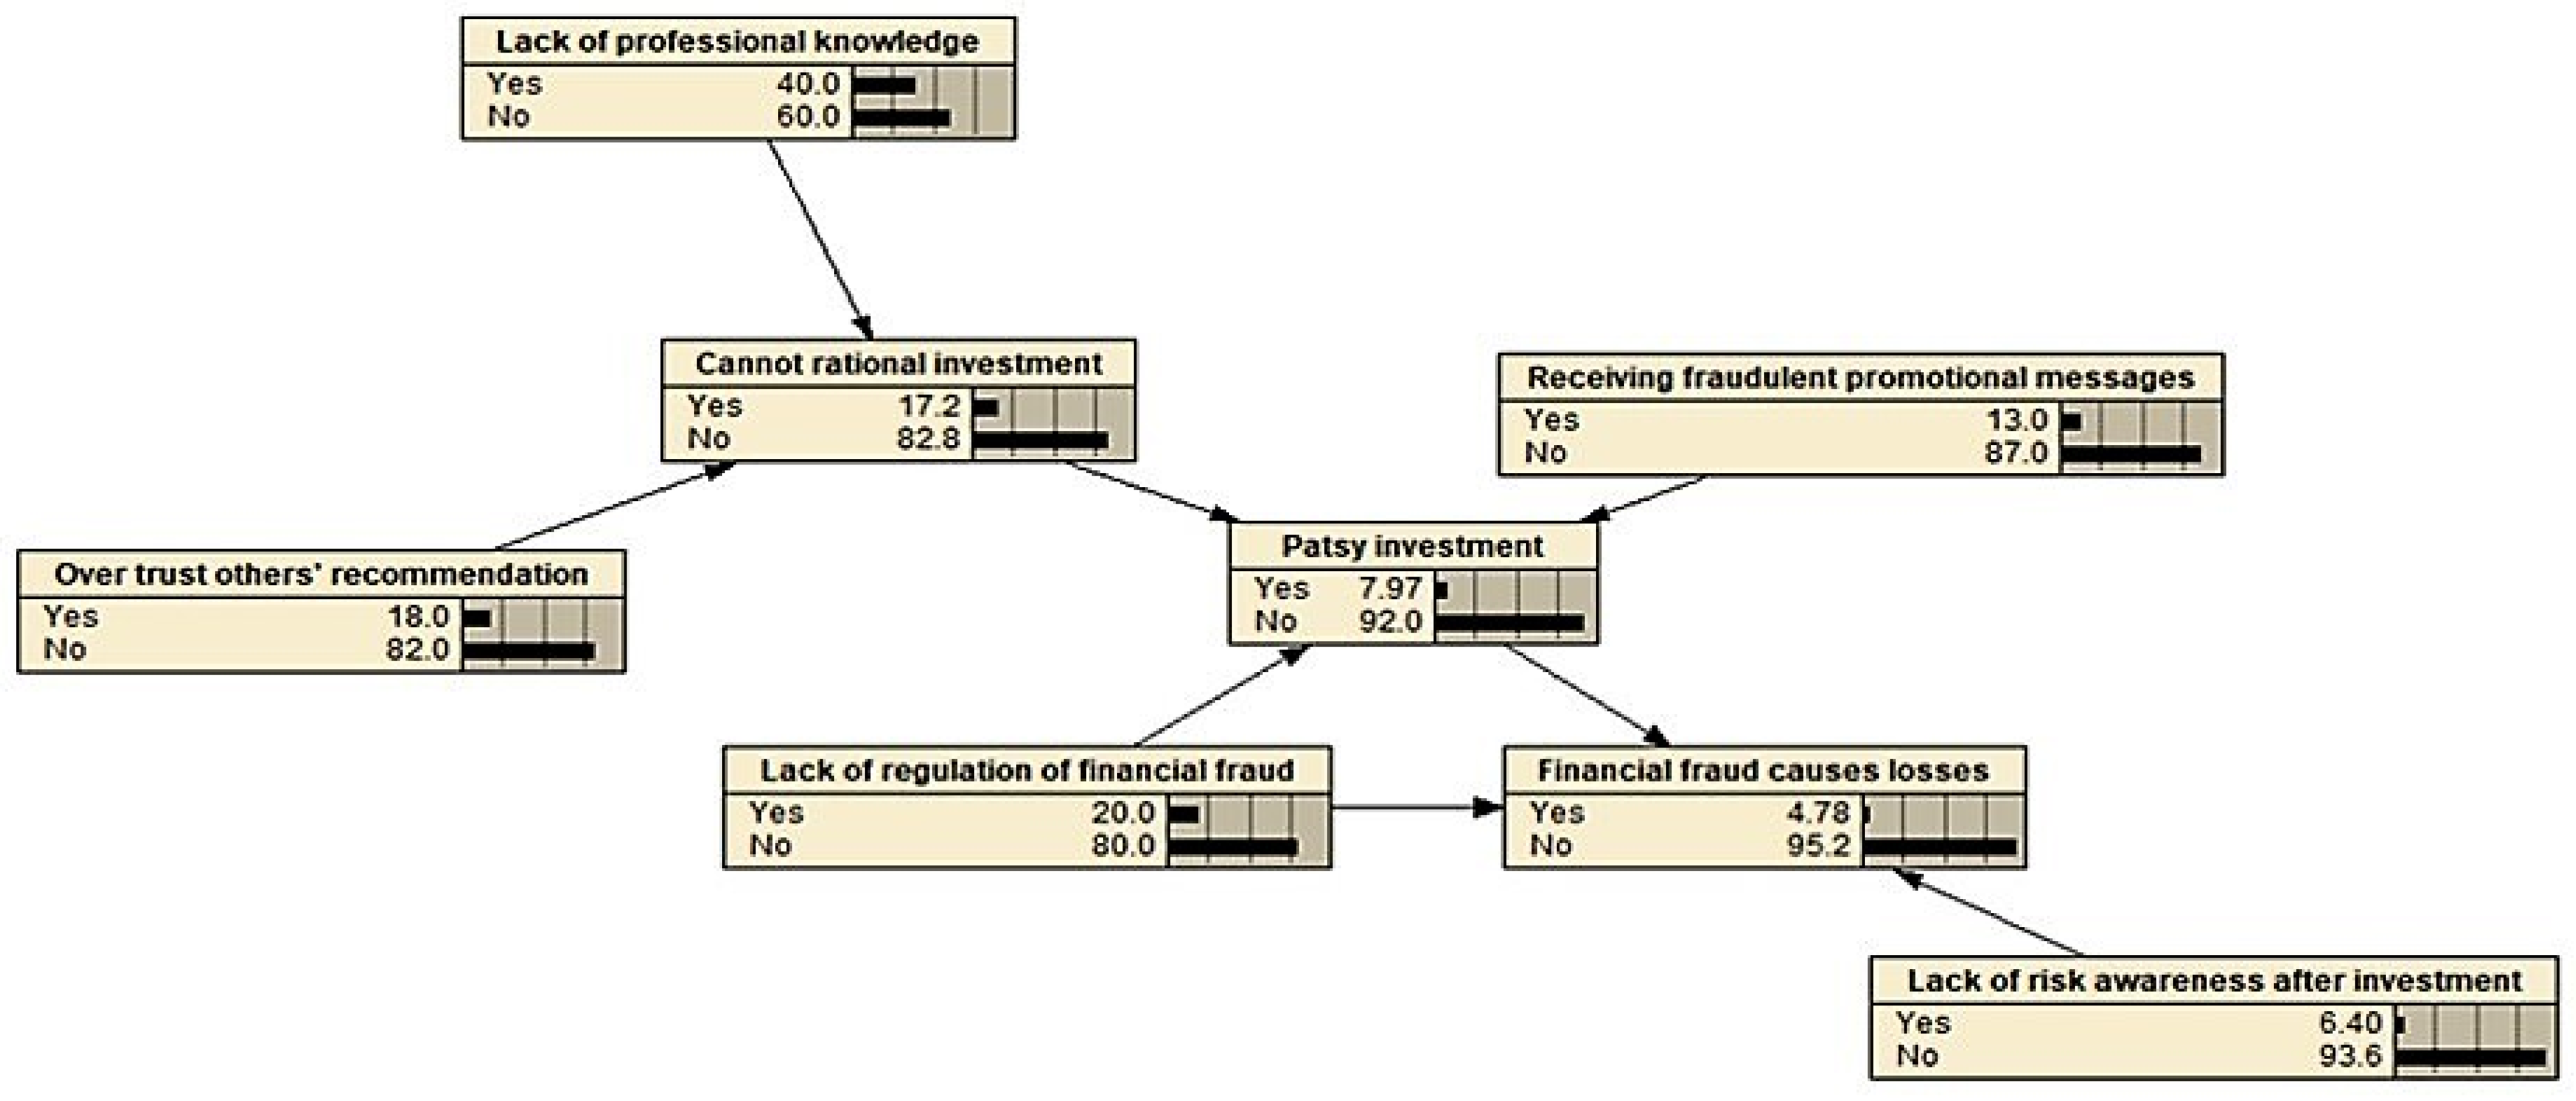
3.3. Comprehensive Analysis of Fault Tree and Bayesian Network
3.3.1. Probability Calculation of Fault Tree and Bayesian Network
3.3.2. Importance Analysis of Basic Events
3.4. Impact Analysis of Safety Measures
3.4.1. The Effect of Fraud Rate on Fraud Dissemination
3.4.2. Alert Rate Effect on the Spread of the Fraud
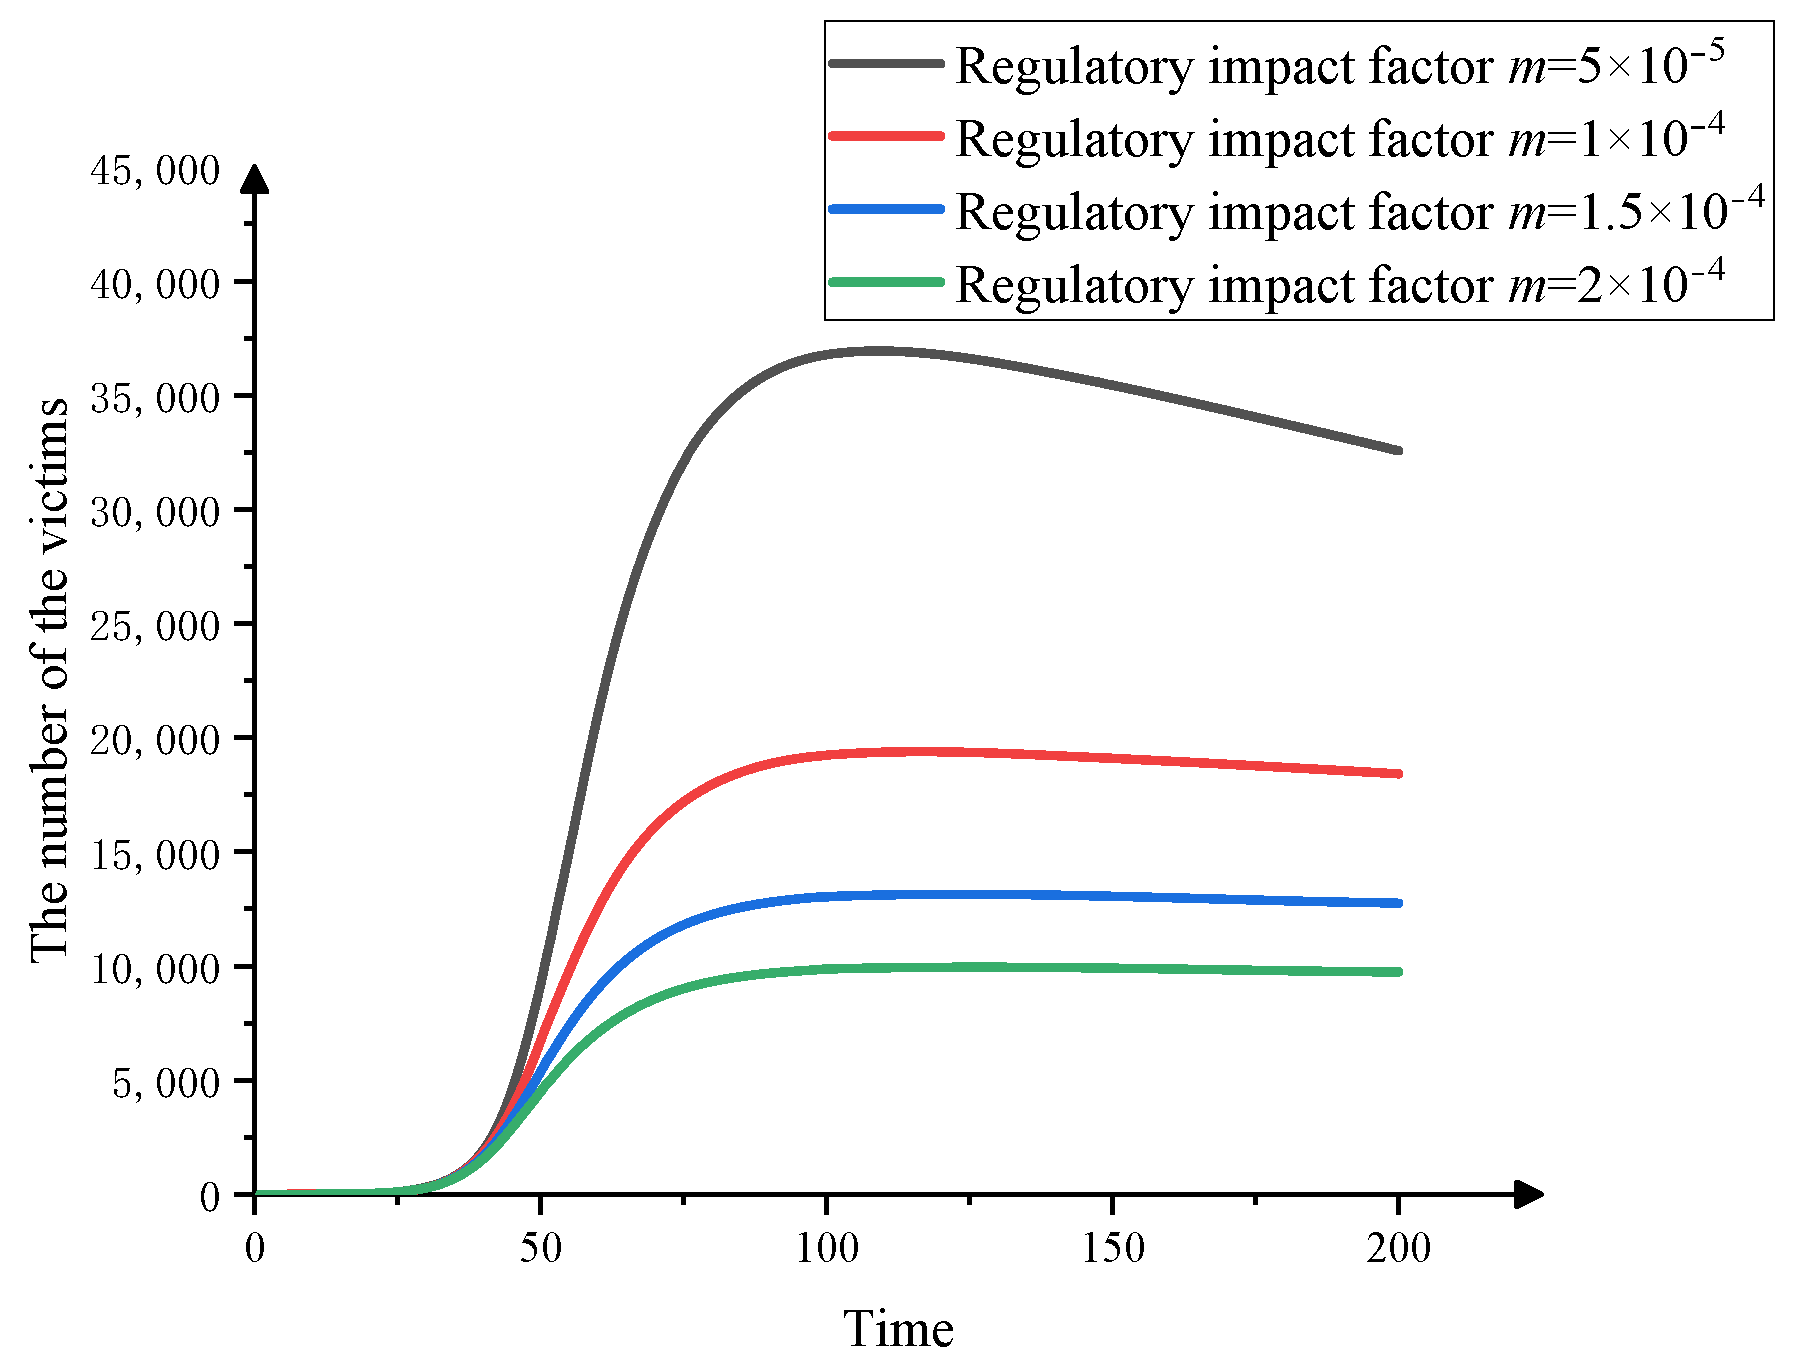
3.4.3. The Effect of Fraud Supervision on Fraud Dissemination
4. Conclusions
- (1)
- Numerical simulation of short-term fund-raising fraud based on the SIR model
- (2)
- Recognition of fraud data based on BP neural network
- (3)
- System analysis based on fault tree and Bayesian networks
- (4)
- Impact of safety measures
Author Contributions
Funding
Institutional Review Board Statement
Informed Consent Statement
Data Availability Statement
Acknowledgments
Conflicts of Interest
Appendix A

| Questionnaire | |
|---|---|
| 1 | Age |
| A. 21–30 years old B. 31–40 years old C. 41–50 years old D. 41–50 years old E. Above 50 years old | |
| 2 | Gender |
| A. Female B. Male | |
| 3 | Education level |
| A. Primary school B. Junior high school C. Senior high school D. University E. Master F. Doctor | |
| 4 | Would you like to participate in the investment? (such as funds, stocks, real estate, bonds, precious metals, etc.) |
| A. Yes B. No | |
| 5 | Have you received messages of investment promotion with high investment and high profit? |
| A. Yes B. No | |
| 6 | How do you make investment decisions? |
| A. Independent choice B. Others suggest | |
| 7 | Would you invest in products with the following monthly interest rates? |
| A. 1% B. 5% C. 10% D. 20% E. 40% | |
| 8 | Do you have professional investment knowledge when investing in financial products? |
| A. Yes B. No | |
| 9 | Have you received any warning from fraud prevention agencies? |
| A. Yes B. No | |
| 10 | How much money do you choose to invest in financial products for the first time? (Please give an amount from the range below) |
| A. 2000–4000 B. 4000–6000 C. Above 6000 | |
| 11 | Would you withdraw your investment within the first month? |
| A. Yes B. No | |
| 12 | Would you continue to invest in the following wealth management products after receiving the first month’s investment income? |
| A. Yes B. No | |
| 13 | How much money do you choose to invest in financial products for the second time? (Please give an amount from the range below) |
| A. 6000–8000 B. 8000–10,000 C. Above 10,000 | |
| 14 | Would you withdraw your investment within the second month? |
| A. Yes B. No | |
| 15 | Would you continue to invest in the following wealth management products after receiving the investment income of the second month? |
| A. Yes B. No | |
| 16 | How much money do you choose to invest in financial products for the third time? (Please give an amount from the range below) |
| A. 10,000–12,000 B. 12,000–14,000 C. Above 14,000 | |
| 17 | Would you withdraw your investment within the third month? |
| A. Yes B. No |
Appendix B
| Variables | Total (n = 1032) | Losses Caused (n = 258.25%) | No Losses Caused (n = 774.75%) | χ2 | p |
|---|---|---|---|---|---|
| Age | |||||
| 21–30 years old | 103 (9.9) | 31 (3) | 72 (6.9) | 2.763 | 0.167 |
| 31–40 years old | 412 (39.9) | 97 (9.3) | 315 (30.5) | ||
| 41–50 years old | 468 (45.3) | 105 (10.1) | 363 (35.1) | ||
| Above 50 years old | 49 (4.7) | 12 (1.1) | 37 (3.6) | ||
| Gender | |||||
| Female | 412 (39.9) | 91 (8.8) | 321 (31.1) | 3.103 | 0.077 |
| Male | 620 (60.1) | 167 (16.1) | 453 (43.8) | ||
| Education level | |||||
| Primary school | 62 (6) | 16 (1.5) | 46 (4.4) | 0.028 | 0.273 |
| Junior high school | 206 (19.9) | 51 (4.9) | 155 (15) | ||
| Senior high school | 124 (12) | 31 (3) | 93 (9) | ||
| University | 616 (59.6) | 154 (14.9) | 462 (44.7) | ||
| Master | 20 ((1.9) | 5 (0.4) | 15 (1.4) | ||
| Doctor | 4 (0.3) | 1 (0.1) | 3 (0.2) | ||
| Participate in the investment | |||||
| Yes | 825 (79.9) | 207 (20) | 618 (59.9) | 0.018 | 0.4 |
| No | 207 (20) | 51 (4.9) | 156 (15.1) | ||
| Receive messages of investment | |||||
| Yes | 145 (14) | 131 (12.6) | 14 (1.4) | 384.189 | 0.56 |
| No | 887 (85.9) | 127 (12.3) | 760 (73.6) | ||
| Make investment decisions | |||||
| Independent choice | 186 (18) | 53 (5.1) | 133 (12.8) | 1.478 | 0.433 |
| Others suggest | 846 (81.9) | 205 (19.8) | 641 (62.1) | ||
| Monthly interest rates | |||||
| 1% | 31 (3) | 8 (0.7) | 23 (2.2) | 0.044 | 0.152 |
| 5% | 154 (14.9) | 39 (3.7) | 115 (11.1) | ||
| 10% | 208 (20.1) | 52 (5) | 156 (15.1) | ||
| 20% | 516 (50) | 129 (12.5) | 387 (37.5) | ||
| 40% | 123 (11.9) | 30 (2.9) | 93 (9) | ||
| Lack of professional investment knowledge | |||||
| Yes | 413 (40) | 103 (9.9) | 310 (30) | 0.001 | 0.086 |
| No | 619 (59.9) | 155 (15) | 464 (44.9) | ||
| Receive warning from fraud prevention agencies | |||||
| Yes | 213 (20.6) | 54 (5.2) | 159 (15.4) | 0.004 | 0.396 |
| No | 819 (79.3) | 206 (19.9) | 613 (59.3) | ||
| Amount of the first investment | |||||
| 2000–4000 | 920 (89.1) | 230 (22.2) | 690 (66.8) | 4.14 | 0.512 |
| 4000–6000 | 112 (10.8) | 38 (3.6) | 74 (7.1) | ||
| Above 6000 | 0 | 0 | 0 | ||
| Withdraw your investment within the first month | |||||
| Yes | 66 (6.3) | 17 (1.6) | 49 (4.7) | 0.022 | 0.544 |
| No | 966 (93.6) | 241 (23.3) | 725 (70.2) | ||
| Continue to invest in products after receiving investment income | |||||
| Yes | 170 (16.4) | 43 (4.1) | 127 (12.3) | 0.009 | 0.445 |
| No | 862 (83.5) | 215 (20.8) | 647 (62.6) | ||
| Amount of the second investment | |||||
| 6000–8000 | 620 (60) | 158 (15.3) | 462 (44.7) | 0.194 | 0.297 |
| 8000–10,000 | 412 (39.9) | 100 (9.6) | 312 (30.2) | ||
| Above 10,000 | 0 | 0 | 0 | ||
| Withdraw your investment within the second month | |||||
| Yes | 58 (5.6) | 15 (1.4) | 43 (4.1) | 0.024 | 0.55 |
| No | 974 (94.3) | 243 (23.5) | 731 (70.8) | ||
| Continue to invest products after receiving investment income again | |||||
| Yes | 258 (25) | 62 (6) | 196 (19) | 0.172 | 0.33 |
| No | 774 (75) | 196 (19) | 578 (56) | ||
| Amount of the third investment | |||||
| 10,000–12,000 | 151 (15.3) | 38 (3.6) | 113 (10.9) | 0.035 | 0.429 |
| 12,000–14,000 | 835 (80.9) | 208 (20.1) | 627 (60.7) | ||
| Above 14,000 | 46 (4.4) | 12 (1.1) | 34 (3.2) | ||
| Withdraw your investment within the third month | |||||
| Yes | 33 (3.2) | 0 | 33 (3.2) | 11.363 | 0.564 |
| No | 999 (96.8) | 258 (25) | 741 (71.8) | ||
Appendix C
| Related Parameters | βi | Ci | γi | A |
|---|---|---|---|---|
| i = 1 | 0.131 | 3020 | 0.064 | 20% |
| i = 2 | 0.164 | 8100 | 0.055 | 20% |
| i = 3 | 0.25 | 13,200 | 0.032 | 20% |
| Number | Investment Amount (CNY) | Monthly Interest Rate | Class | Number | Investment Amount | Monthly Interest Rate | Class |
|---|---|---|---|---|---|---|---|
| 1 | 2201 | 40% | 1 | … | … | … | … |
| 2 | 3551 | 40% | 1 | 604 | 3326 | 10% | 2 |
| 3 | 3634 | 40% | 1 | 605 | 2893 | 10% | 2 |
| 4 | 2450 | 40% | 1 | 606 | 3753 | 10% | 1 |
| 5 | 3144 | 40% | 1 | 607 | 3200 | 10% | 2 |
| 6 | 3594 | 40% | 1 | 608 | 2957 | 10% | 2 |
| 7 | 3379 | 1% | 2 | 609 | 3119 | 10% | 2 |
| 8 | 2324 | 1% | 2 | 610 | 2925 | 10% | 2 |
| 9 | 3384 | 1% | 2 | 612 | 2822 | 10% | 2 |
| 10 | 3658 | 1% | 2 | 613 | 2952 | 20% | 2 |
| 11 | 2759 | 1% | 2 | 614 | 3692 | 20% | 1 |
| 12 | 2043 | 5% | 2 | 615 | 2229 | 20% | 2 |
| 13 | 3346 | 5% | 2 | 616 | 3788 | 20% | 1 |
| 14 | 3366 | 5% | 2 | 617 | 2367 | 20% | 2 |
| 15 | 2918 | 5% | 2 | 618 | 3581 | 20% | 1 |
| … | … | … | … | 619 | 3834 | 20% | 1 |
| Number | Investment Amount (CNY) | Monthly Interest Rate | Class | Number | Investment Amount | Monthly Interest Rate | Class |
|---|---|---|---|---|---|---|---|
| 1 | 3290 | 20% | 1 | … | … | … | … |
| 2 | 2168 | 20% | 2 | 399 | 2066 | 20% | 2 |
| 3 | 2952 | 20% | 2 | 400 | 3492 | 20% | 1 |
| 4 | 3670 | 20% | 1 | 401 | 2768 | 20% | 2 |
| 5 | 3144 | 20% | 2 | 402 | 2562 | 20% | 2 |
| 6 | 2270 | 20% | 2 | 403 | 3302 | 20% | 2 |
| 7 | 2785 | 20% | 2 | 404 | 2886 | 20% | 2 |
| 8 | 2270 | 20% | 2 | 405 | 2029 | 20% | 2 |
| 9 | 2155 | 20% | 2 | 406 | 2133 | 20% | 2 |
| 10 | 3180 | 20% | 2 | 407 | 2430 | 20% | 2 |
| 11 | 3501 | 20% | 1 | 408 | 2912 | 20% | 2 |
| 12 | 3578 | 20% | 1 | 409 | 2556 | 20% | 2 |
| 13 | 2193 | 20% | 2 | 410 | 3547 | 20% | 1 |
| 14 | 2505 | 20% | 2 | 411 | 2241 | 20% | 2 |
| 15 | 3831 | 20% | 1 | 412 | 3999 | 20% | 1 |
| … | … | … | … | 413 | 2518 | 20% | 2 |
| Event Number | Event Name | Event Probability |
|---|---|---|
| X1 | Receiving fraudulent promotional messages | 0.13 |
| X2 | Lack of professional knowledge | 0.4 |
| X3 | Over trust others’ recommendation | 0.18 |
| X4 | Lack of regulation of financial fraud | 0.8 |
| X5 | Lack of risk awareness after investment | 0.064 |
| X3 | X2 | Yes | No |
|---|---|---|---|
| Yes | Yes | 29% | 71% |
| Yes | No | 18% | 82% |
| No | Yes | 40% | 60% |
| No | No | 0 | 100% |
| M2 | X4 | X1 | Yes | No |
|---|---|---|---|---|
| Yes | Yes | Yes | 18.3% | 81.7% |
| Yes | Yes | No | 20.9% | 79.1% |
| Yes | No | Yes | 17.3% | 82.7% |
| Yes | No | No | 21.7% | 78.3% |
| No | Yes | Yes | 16.5% | 83.5% |
| No | Yes | No | 20% | 80% |
| No | No | Yes | 13% | 87% |
| No | No | No | 0 | 100% |
| M1 | X5 | X4 | Yes | No |
|---|---|---|---|---|
| Yes | Yes | Yes | 14.1% | 85.9% |
| Yes | Yes | No | 18% | 82% |
| Yes | No | Yes | 11.2% | 88.8% |
| Yes | No | No | 16% | 84% |
| No | Yes | Yes | 13.2% | 86.8% |
| No | Yes | No | 20% | 60% |
| No | No | Yes | 6.4% | 93.6% |
| No | No | No | 0 | 100% |
References
- Bartoletti, M.; Pes, B.; Serusi, S. Data Mining for Detecting Bitcoin Ponzi Schemes. In Proceedings of the 2018 Crypto Valley Conference on Blockchain Technology (CVCBT), Zug, Switzerland, 20–22 June 2018; pp. 75–84. [Google Scholar] [CrossRef] [Green Version]
- Yu, W.Q.; Zhang, Y.M.; Li, Z.Y.; Niu, W. Type analysis and identification method of Ethereum Ponzi scheme. J. Chongqing Univ. 2020, 43, 111–120. [Google Scholar] [CrossRef]
- Zhou, Y.C. Research on Bitcoin Ponzi Scheme Detection Based on Data Mining Technology. Master’s Thesis, Guangdong University of Technology, Guangzhou, China, 2020. [Google Scholar] [CrossRef]
- Zhang, Y.M.; Lou, Y.C. Ponzi scheme contract detection method based on deep neural network. Comput. Sci. 2021, 48, 273–279. [Google Scholar] [CrossRef]
- Bayraktar, E.; Cohen, A.; Nellis, A. A Macroeconomic SIR Model for COVID-19. Mathematics 2021, 9, 1901. [Google Scholar] [CrossRef]
- Liu, C.; Han, R.; Huang, X.Y.; Yang, H.Y.; Liu, X.Y. The Internet pyramid selling SIR propagation model. J. Chongqing Univ. Technol. 2021, 35, 161–167. [Google Scholar]
- Klafft, M. Peer to Peer Lending: Auctioning Microcredits over the Internet; Social Science Electronic Publishing: Rochester, NY, USA, 2008; Available online: https://ssrn.com/abstract=1352383 (accessed on 1 April 2022).
- Vasek, M.; Moore, T. Analyzing the Bitcoin Ponzi Scheme Ecosystem; Springer: Berlin/Heidelberg, Germany, 2019; pp. 101–112. [Google Scholar] [CrossRef]
- Slattery, P.D. Square Pegs in a Round Hole: SEC Regulation of Online Peer-to-Peer Lending and the CFPB Alternative. Yale J. Regul. 2013, 30, 6. Available online: https://digitalcommons.law.yale.edu/cgi/viewcontent.cgi?article=1369&context=yjreg&httpsredir=1&referer= (accessed on 1 April 2022).
- Fan, J.X. Research on Countermeasures to Prevent Online Financial Fraud Crime. Master’s Thesis, Jiangxi University of Finance and Economics, Nanchang, China, 2017. Available online: https://kns.cnki.net/kcms/detail/detail.aspx?FileName=1017206147.nh&DbName=CMFD2018 (accessed on 1 April 2022).
- Fan, X. Investigation Report on Baoding Citizens Encountering Financial Fraud. Master’s Thesis, Hebei University of Finance and Economics, Shijiazhuang, China, 2017. Available online: https://kns.cnki.net/kcms/detail/detail.aspx?FileName=1017020187.nh&DbName=CMFD2018 (accessed on 1 April 2022).
- Kermack, W.; McKendrick, A. Contributions to the mathematical theory of epidemics—I. Bull. Math. Biol. 1991, 53, 33–55. [Google Scholar] [CrossRef] [PubMed]
- Jayatilaka, R.; Patel, R.; Brar, M.; Tang, Y.; Jisrawi, N.; Chishtie, F.; Drozd, J.; Valluri, S. A mathematical model of COVID-19 transmission. Mater. Today Proc. 2022, 54, 101–112. [Google Scholar] [CrossRef]
- Razaque, A.; Rizvi, S.; Khan, M.J.; Almiani, M.; Al Rahayfeh, A. State-of-art review of information diffusion models and their impact on social network vulnerabilities. J. King Saud Univ. Comput. Inf. Sci. 2022, 34, 1275–1294. [Google Scholar] [CrossRef]
- Ma, X.; Deng, W.; Qiao, W.; Lan, H. A methodology to quantify the risk propagation of hazardous events for ship grounding accidents based on directed CN. Reliab. Eng. Syst. Saf. 2022, 221, 108334. [Google Scholar] [CrossRef]
- Gong, J.; Williams, M.A.; McAfee, R.P. Fraud Cycles. J. Inst. Theor. Econ. 2016, 172, 544–572. [Google Scholar] [CrossRef]
- Wang, Y.; Stuart, T.; Li, J. Fraud and Innovation. Adm. Sci. Q. 2021, 66, 267–297. [Google Scholar] [CrossRef]
- Bhattacharya, U. The optimal design of Ponzi schemes in finite economies. J. Financ. Intermediation 2003, 12, 2–24. [Google Scholar] [CrossRef]
- Xu, L.; Wang, J.; Xu, D.; Xu, L. Integrating Individual Factors to Construct Recognition Models of Consumer Fraud Victimization. Int. J. Environ. Res. Public Healh 2022, 19, 461. [Google Scholar] [CrossRef] [PubMed]
- Cuijie, Z. Research of expression recognition base on optimized BP neural network. In Proceedings of the 2009 16th International Conference on Industrial Engineering and Engineering Management, Beijing, China, 21–23 October 2009; pp. 1803–1806. [Google Scholar] [CrossRef]
- Lu, Y.; Li, Z.; Zhao, X.; Lv, S.; Wang, X.; Wang, K.; Ni, H. Recognition of Rice Sheath Blight Based on a Backpropagation Neural Network. Electronics 2021, 10, 2907. [Google Scholar] [CrossRef]
- Wang, Y.; Chen, C.; Yan, X. Structure and weight optimization of neural network based on CPA-MLR and its application in naphtha dry point soft sensor. Neural Comput. Appl. 2013, 22, 75–82. [Google Scholar] [CrossRef]
- Ronza, A.; Félez, S.; Darbra, R.M.; Carol, S.; Vílchez, J.; Casal, J. Predicting the frequency of accidents in port areas by developing event trees from historical analysis. J. Loss Prev. Process Ind. 2003, 16, 551–560. [Google Scholar] [CrossRef]
- Fang, M.; Zhang, Y.; Zhu, M.; Chen, S. Cause Mechanism of Metro Collapse Accident Based on Risk Coupling. Int. J. Environ. Res. Public Health 2022, 19, 2102. [Google Scholar] [CrossRef] [PubMed]
- Özbay, C.; Özbay, T.; Yiğitoğlu, A.G.; Bayburt, M. Probabilistic risk assessment of radiotherapy application. Radioprotection 2022, 57, 33–40. [Google Scholar] [CrossRef]
- Barua, S.; Gao, X.; Pasman, H.; Mannan, M.S. Bayesian network based dynamic operational risk assessment. J. Loss Prev. Process Ind. 2016, 41, 399–410. [Google Scholar] [CrossRef]
- Lalika, L.; Kitali, A.E.; Haule, H.J.; Kidando, E.; Sando, T.; Alluri, P. What are the leading causes of fatal and severe injury crashes involving older pedestrian? Evidence from Bayesian network model. J. Saf. Res. 2022, 80, 281–292. [Google Scholar] [CrossRef]
- Hunte, J.L.; Neil, M.; Fenton, N.E. A causal Bayesian network approach for consumer product safety and risk assessment. J. Saf. Res. 2022, 80, 198–214. [Google Scholar] [CrossRef] [PubMed]
- Mahadevan, S.; Zhang, R.; Smith, N. Bayesian networks for system reliability reassessment. Struct. Saf. 2001, 23, 231–251. [Google Scholar] [CrossRef]
- Liu, Y.; Ma, X.; Qiao, W.; Luo, H.; He, P. Human Factor Risk Modeling for Shipyard Operation by Mapping Fuzzy Fault Tree into Bayesian Network. Int. J. Environ. Res. Public Health 2022, 19, 297. [Google Scholar] [CrossRef] [PubMed]
- Xin, S.; Zhang, L.; Jin, X.; Zhang, Q. Reconstruction of the fault tree based on accident evolution. Process Saf. Environ. Prot. 2019, 121, 307–311. [Google Scholar] [CrossRef]
- Wei, C.R.; Sun, J.H.; Zhang, J.P. Qualitative analysis of accident tree and its application in mine safety evaluation. Industrial Saf. Environ. Prot. 2009, 35, 39–41. Available online: https://kns.cnki.net/kcms/detail/detail.aspx?FileName=GYAF200909017&DbName=CJFQ2009 (accessed on 1 April 2022).
- Li, Y.X.; Sun, J.H.; Wei, C.R. Research and discussion on solving method of importance degree of the accident tree structure. China Saf. Sci. Technol. 2012, 8, 107–110. Available online: https://kns.cnki.net/kcms/detail/detail.aspx?FileName=LDBK201205021&DbName=CJFQ2012 (accessed on 1 April 2022).
- Zaib, A.; Yin, J.; Khan, R.U. Determining Role of Human Factors in Maritime Transportation Accidents by Fuzzy Fault Tree Analysis (FFTA). J. Mar. Sci. Eng. 2022, 10, 381. [Google Scholar] [CrossRef]
- Xi, J.; Zhao, Y.; Ding, T.; Tian, J.; Li, L. Analysis Model of Risk Factors of Urban Bus Operation Based on FTA-CLR. Adv. Civ. Eng. 2021, 2021, 6657786. [Google Scholar] [CrossRef]
- Xin, S.; Zhu, X.; Liu, S.; Guo, J. Research on Fault Tree Reconstruction Based on Contingency. Processes 2022, 10, 427. [Google Scholar] [CrossRef]
- Sheng, B.; Deng, C.; Wang, Y.H.; Tang, L.H. System Analysis by Mapping a Fault-tree into a Bayesian-network. IOP Conf. Ser. Mater. Sci. Eng. 2018, 362, 012025. [Google Scholar] [CrossRef]
- Del-Valle, M.V.; López-Morales, H.; Andrés, M.L.; Yerro-Avincetto, M.; Trudo, R.G.; Urquijo, S.; Canet-Juric, L. Intolerance of COVID-19-related uncertainty and depressive and anxiety symptoms during the pandemic: A longitudinal study in Argentina. J. Anxiety Disord. 2022, 86, 102531. [Google Scholar] [CrossRef] [PubMed]
- McHugh, M.L. The Chi-square test of independence. Biochem. Med. 2013, 23, 143–149. [Google Scholar] [CrossRef] [PubMed] [Green Version]
- Zang, X. Review and Identification of Evidence in Internet Financial Crimes-A Case study of Ezubao. Law Soc. 2021, 24–26. [Google Scholar] [CrossRef]
- He, K.; Zhang, X.; Ren, S.; Sun, J. Delving deep into rectifiers: Surpassing human-level performance on imagenet classification. In Proceedings of the 2015 IEEE International Conference on Computer Vision (ICCV), Santiago, Chile, 7–13 December 2015; pp. 1026–1034. [Google Scholar]
- Huo, L.; Wang, L.; Song, N.; Ma, C.; He, B. Rumor spreading model considering the activity of spreaders in the homogeneous network. Phys. A Stat. Mech. Appl. 2017, 468, 855–865. [Google Scholar] [CrossRef]


| Number | Output | Class | Number | Output | Class | ||
|---|---|---|---|---|---|---|---|
| 2 | 1 | 2 | 1 | ||||
| 1 | 0.6811 | 0.3189 | 2 | … | … | … | … |
| 2 | 1.0002 | −0.0002 | 2 | 399 | 1.0103 | -0.0103 | 2 |
| 3 | 0.8709 | 0.1291 | 2 | 400 | −0.0361 | 1.0361 | 1 |
| 4 | 0.0208 | 0.9792 | 1 | 401 | 1.0482 | −0.0482 | 2 |
| 5 | 0.943 | 0.057 | 2 | 402 | 1.0132 | −0.0132 | 2 |
| 6 | 0.9951 | 0.0049 | 2 | 403 | 0.5894 | 0.4106 | 2 |
| 7 | 1.0499 | −0.0449 | 2 | 404 | 0.972 | 0.028 | 2 |
| 8 | 0.9951 | −0.0012 | 2 | 405 | 1.0154 | −0.0154 | 2 |
| 9 | 1.0012 | −0.0336 | 2 | 406 | 1.003 | −0.003 | 2 |
| 10 | 1.0336 | −0.0336 | 2 | 407 | 0.9968 | 0.0032 | 2 |
| 11 | −0.032 | 1.032 | 1 | 408 | 0.9363 | 0.0637 | 2 |
| 12 | 0.0051 | 0.9949 | 1 | 409 | 1.0121 | −0.0121 | 2 |
| 13 | 0.9985 | 0.0015 | 2 | 410 | −0.0081 | 1.0081 | 1 |
| 14 | 1.0038 | −0.0038 | 2 | 411 | 0.9961 | 0.0039 | 2 |
| 15 | 0.0056 | 0.9944 | 1 | 412 | −0.0137 | 1.0137 | 1 |
| … | … | … | … | 413 | 1.0056 | −0.0056 | 2 |
| Regression Statistics | |||||
|---|---|---|---|---|---|
| Multiple R | R Square | Adjusted R Square | Standard error | ||
| 0.979 | 0.959 | 0.959 | 0.09934 | ||
| Analysis of variance | |||||
| SS | df | MS | F | Significance F | |
| Regression analysis | 13.53 | 1 | 13.53 | 1370.903 | 0.00 |
| Residual error | 0.572 | 58 | 0.01 | ||
| Total | 14.102 | 59 | |||
| Coefficient | |||||
| Coefficients | Standard error | t | p-value | ||
| Intercept | 0.034 | 0.018 | 1.355 | 0.181 | |
| Output data | 0.959 | 0.026 | 37.026 | 0.00 |
| Event Number | Event Name | Event Probability | |
|---|---|---|---|
| Bayesian Network | Fault Tree | ||
| M1 | Patsy investment | 0.172 | 0.508 |
| M2 | Cannot rational investment | 0.0797 | 0.053 |
| T | Financial fraud causes losses | 0.0498 | 0.0027 |
Publisher’s Note: MDPI stays neutral with regard to jurisdictional claims in published maps and institutional affiliations. |
© 2022 by the authors. Licensee MDPI, Basel, Switzerland. This article is an open access article distributed under the terms and conditions of the Creative Commons Attribution (CC BY) license (https://creativecommons.org/licenses/by/4.0/).
Share and Cite
Yang, S.; Su, K.; Wang, B.; Xu, Z. A Coupled Mathematical Model of the Dissemination Route of Short-Term Fund-Raising Fraud. Mathematics 2022, 10, 1709. https://doi.org/10.3390/math10101709
Yang S, Su K, Wang B, Xu Z. A Coupled Mathematical Model of the Dissemination Route of Short-Term Fund-Raising Fraud. Mathematics. 2022; 10(10):1709. https://doi.org/10.3390/math10101709
Chicago/Turabian StyleYang, Shan, Kaijun Su, Bing Wang, and Zitong Xu. 2022. "A Coupled Mathematical Model of the Dissemination Route of Short-Term Fund-Raising Fraud" Mathematics 10, no. 10: 1709. https://doi.org/10.3390/math10101709
APA StyleYang, S., Su, K., Wang, B., & Xu, Z. (2022). A Coupled Mathematical Model of the Dissemination Route of Short-Term Fund-Raising Fraud. Mathematics, 10(10), 1709. https://doi.org/10.3390/math10101709