
A New Case-Mix Classification Method for Medical Insurance Payment


Abstract
:1. Introduction
2. Methodology
2.1. Case-Mix Decision Tree
2.2. The MEDT Algorithms
| Algorithm 1 The MEDT algorithm. |
|
3. Simulation Study
4. Application
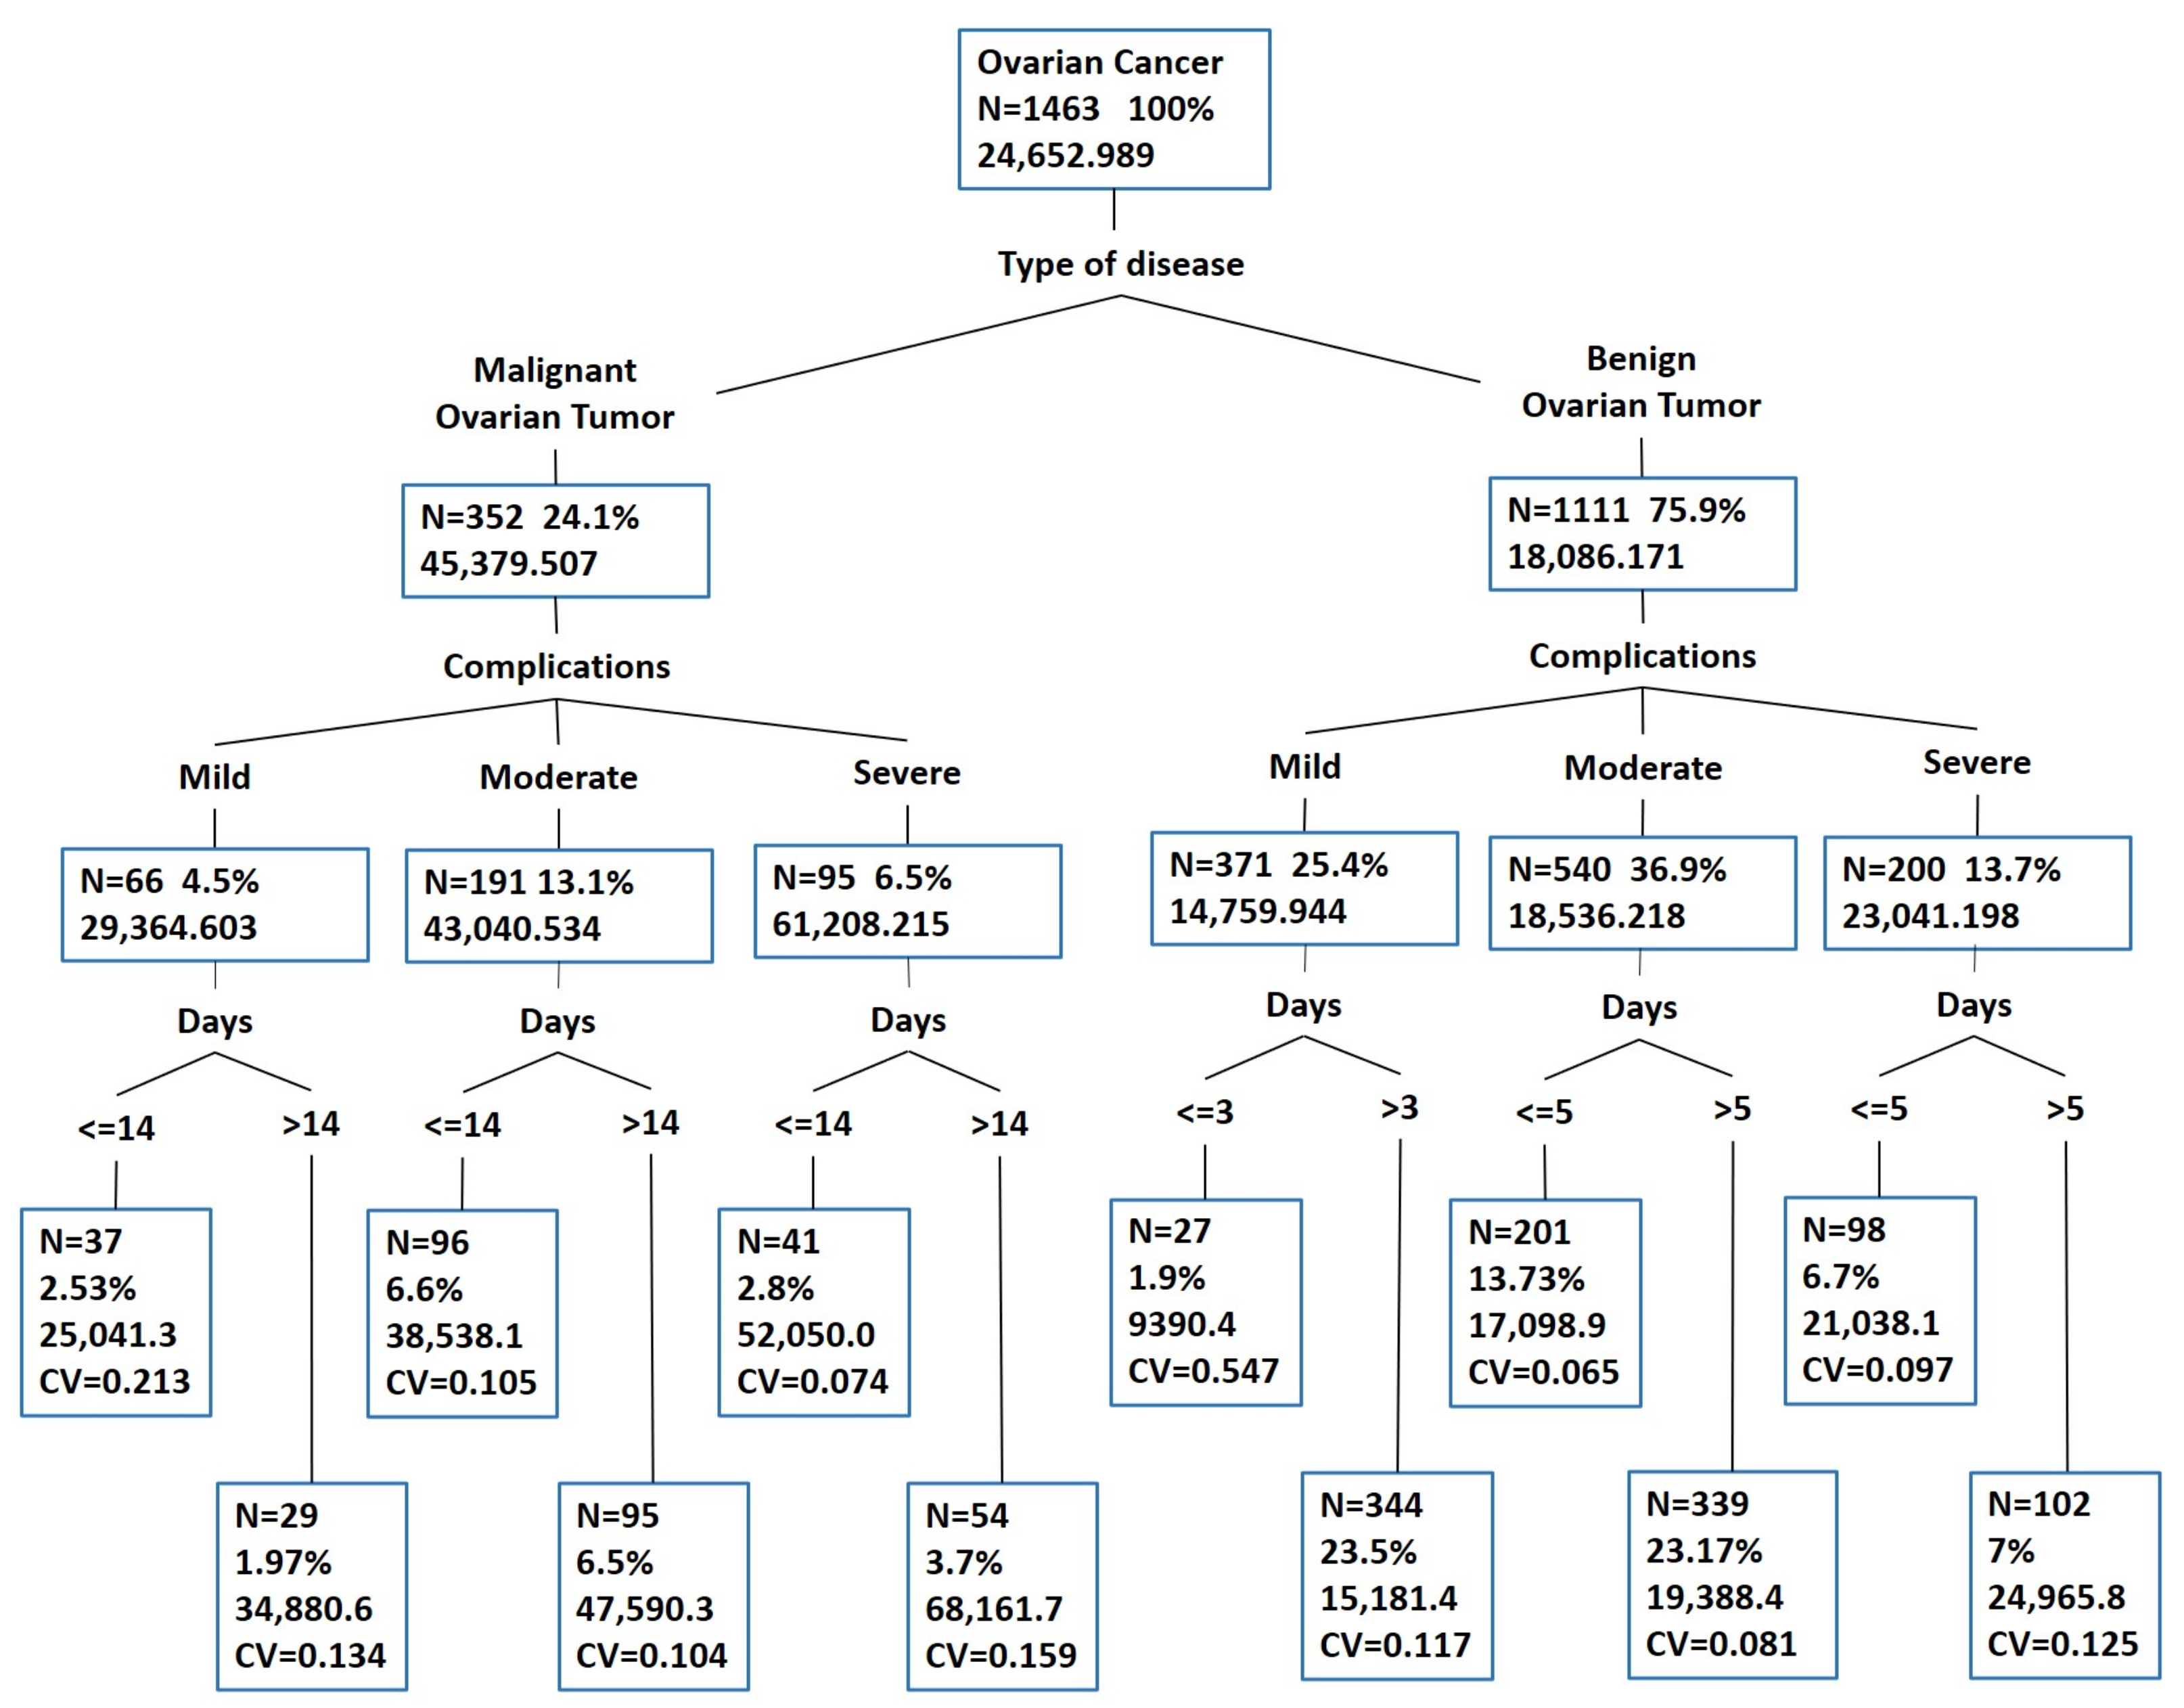
4.1. Ovarian Cancer Case-Mix Pricing
4.2. Result Comparison
5. Conclusions
Author Contributions
Funding
Institutional Review Board Statement
Informed Consent Statement
Data Availability Statement
Conflicts of Interest
References
- Fetter, R.B. Diagnosis related groups: Understanding hospital performance. Interfaces 1991, 21, 6–26. [Google Scholar] [CrossRef]
- Tatchell, M. Measuring hospital output: A review of the service mix and case mix approaches. Soc. Sci. Med. 1983, 17, 871–883. [Google Scholar] [CrossRef]
- Zindel, S.; Stock, S.; Müller, D.; Stollenwerk, B. A multi-perspective cost-effectiveness analysis comparing rivaroxaban with enoxaparin sodium for thromboprophylaxis after total hip and knee replacement in the German healthcare setting. BMC Health Serv. Res. 2012, 12, 1–14. [Google Scholar] [CrossRef] [PubMed]
- Pilla, J.; Hindle, D. Adapting DRGs: The British, Canadian and Australian experiences. Health Inf. Manag. 1994, 24, 87–93. [Google Scholar] [CrossRef]
- Duff, J. Financing to foster community health care: A comparative analysis of Singapore, Europe, North America and Australia. Curr. Sociol. 2001, 49, 135–154. [Google Scholar] [CrossRef]
- Qian, M.; Zhang, X.; Chen, Y.; Xu, S.; Ying, X. The pilot of a new patient classification-based payment system in China: The impact on costs, length of stay and quality. Soc. Sci. Med. 2021, 289, 114415. [Google Scholar] [CrossRef]
- Thorpe, K.E. The use of regression analysis to determine hospital payment: The case of Medicare’s indirect teaching adjustment. Inquiry 1988, 25, 219–231. [Google Scholar]
- Wu, S.W.; Pan, Q.; Chen, T. Research on diagnosis-related group grouping of inpatient medical expenditure in colorectal cancer patients based on a decision tree model. World J. Clin. Cases 2020, 8, 2484. [Google Scholar] [CrossRef]
- Grubinger, T.; Kobel, C.; Pfeiffer, K.P. Regression tree construction by bootstrap: Model search for DRG-systems applied to Austrian health-data. BMC Med. Inform. Decis. Mak. 2010, 10, 1–11. [Google Scholar] [CrossRef] [Green Version]
- Zeng, Y.; He, A.J.; Lin, P.; Sun, Z.; Fang, Y. Developing case-mix standards with the Diagnosis-related Groups for payment reforms and hospital management in China: A case study in Xiamen city. Int. J. Healthc. 2016, 2, 102–110. [Google Scholar] [CrossRef]
- Luo, A.J.; Chang, W.F.; Xin, Z.R.; Ling, H.; Li, J.J.; Dai, P.P.; Deng, X.T.; Zhang, L.; Li, S.G. Diagnosis related group grouping study of senile cataract patients based on E-CHAID algorithm. Int. J. Ophthalmol. 2018, 11, 308. [Google Scholar] [PubMed]
- Domingos, P. Knowledge discovery via multiple models. Intell. Data Anal. 1998, 2, 187–202. [Google Scholar] [CrossRef]
- Miglio, R.; Soffritti, G. The comparison between classification trees through proximity measures. Comput. Stat. Data Anal. 2004, 45, 577–593. [Google Scholar] [CrossRef]
- Weinberg, A.I.; Last, M. Selecting a representative decision tree from an ensemble of decision-tree models for fast big data classification. J. Big Data 2019, 6, 1–17. [Google Scholar] [CrossRef]
- Wang, Y.; Wang, D.; Geng, N.; Wang, Y.; Yin, Y.; Jin, Y. Stacking-based ensemble learning of decision trees for interpretable prostate cancer detection. Appl. Soft Comput. 2019, 77, 188–204. [Google Scholar] [CrossRef]
- Breiman, L. Bagging predictors. Mach. Learn. 1996, 24, 123–140. [Google Scholar] [CrossRef] [Green Version]
- Freund, Y.; Schapire, R.E. Experiments with a New Boosting Algorithm. In Proceedings of the Thirteenth International Conference on International Conference on Machine Learning, ICML’96, Bari, Italy, 3–6 July 1996; Morgan Kaufmann Publishers Inc.: San Francisco, CA, USA, 1996; pp. 148–156. [Google Scholar]
- Wolpert, D.H. Stacked generalization. Neural Netw. 1992, 5, 241–259. [Google Scholar] [CrossRef]
- Buntine, W.L. A Theory of Learning Classification Rules. Ph.D. Thesis, University of Technology Sydney, Sydney, Australia, 1990. [Google Scholar]
- Malakar, S.; Ghosh, M.; Bhowmik, S.; Sarkar, R.; Nasipuri, M. A GA based hierarchical feature selection approach for handwritten word recognition. Neural Comput. Appl. 2020, 32, 2533–2552. [Google Scholar] [CrossRef]
- Bezdan, T.; Zivkovic, M.; Bacanin, N.; Chhabra, A.; Suresh, M. Feature Selection by Hybrid Brain Storm Optimization Algorithm for COVID-19 Classification. J. Comput. Biol. 2022. [Google Scholar] [CrossRef]
- Loh, W.Y. Classification and regression trees. Wiley Interdiscip. Rev. Data Min. Knowl. Discov. 2011, 1, 14–23. [Google Scholar] [CrossRef]
- Horn, S.D.; Bulkley, G.; Sharkey, P.D.; Chambers, A.F.; Horn, R.A.; Schramm, C.J. Interhospital differences in severity of illness: Problems for prospective payment based on diagnosis-related groups (DRGs). N. Engl. J. Med. 1985, 313, 20–24. [Google Scholar] [CrossRef]
- Larsen, D.R.; Speckman, P.L. Multivariate regression trees for analysis of abundance data. Biometrics 2004, 60, 543–549. [Google Scholar] [CrossRef] [PubMed]
- Breiman, L.; Friedman, J.H.; Olshen, R.A.; Stone, C.J. Classification and Regression Trees; Routledge: London, UK, 2017. [Google Scholar]
- Breiman, L. Stacked regressions. Mach. Learn. 1996, 24, 49–64. [Google Scholar] [CrossRef] [Green Version]
- Liu, Y.; Li, Z.; Xiong, H.; Gao, X.; Wu, J. Understanding of Internal Clustering Validation Measures. In Proceedings of the 2010 IEEE International Conference on Data Mining, ICDM ‘10, Sydney, Australia, 13–17 December 2010; IEEE Computer Society: Washington, DC, USA, 2010; pp. 911–916. [Google Scholar]
- Derrac, J.; García, S.; Molina, D.; Herrera, F. A practical tutorial on the use of nonparametric statistical tests as a methodology for comparing evolutionary and swarm intelligence algorithms. Swarm Evol. Comput. 2011, 1, 3–18. [Google Scholar] [CrossRef]
- Palmer, G.; Reid, B. Evaluation of the performance of diagnosis-related groups and similar casemix systems: Methodological issues. Health Serv. Manag. Res. 2001, 14, 71–81. [Google Scholar] [CrossRef]


| Sample Size | Method | Case 1 | Case 2 | Case 3 | ||||||
|---|---|---|---|---|---|---|---|---|---|---|
| ↑CHI | ↑SC | ↓DBI | ↑CHI | ↑SC | ↓DBI | ↑CHI | ↑SC | ↓DBI | ||
| n = 1000 | CART | 1783.74 | 0.277 | 1.684 | 1609.37 | 0.295 | 1.689 | 1581.08 | 0.281 | 2.289 |
| CHAID | 3097.96 | 0.301 | 1.057 | 2725.09 | 0.352 | 1.276 | 2619.39 | 0.316 | 1.506 | |
| MEDT | 3952.43 | 0.324 | 0.874 | 5272.37 | 0.406 | 0.778 | 19,871.80 | 0.401 | 0.847 | |
| n = 2000 | CART | 7583.60 | 0.297 | 0.966 | 9912.24 | 0.370 | 0.795 | 34,370.56 | 0.384 | 0.926 |
| CHAID | 7276.01 | 0.258 | 1.102 | 9923.66 | 0.385 | 0.790 | 32,971.43 | 0.357 | 0.943 | |
| MEDT | 7661.63 | 0.306 | 0.887 | 10,832.49 | 0.396 | 0.787 | 36,730.13 | 0.392 | 0.887 | |
| n = 4000 | CART | 13,438.99 | 0.231 | 1.000 | 17,391.05 | 0.356 | 0.821 | 66,442.05 | 0.358 | 0.944 |
| CHAID | 11,200.51 | 0.205 | 1.144 | 16,943.58 | 0.315 | 0.839 | 64,435.67 | 0.342 | 0.968 | |
| MEDT | 13,958.65 | 0.235 | 0.998 | 17,741.68 | 0.362 | 0.823 | 62,113.32 | 0.327 | 1.045 | |
| Case | Method | Sample Size n = 600 | Sample Size n = 1000 | ||||||
|---|---|---|---|---|---|---|---|---|---|
| ↓MSE | ↑CHI | ↑SC | ↓DBI | ↓MSE | ↑CHI | ↑SC | ↓DBI | ||
| 1 | COM | 2.316 | 1382.482 | 0.316 | 1.431 | 0.968 | 3927.834 | 0.310 | 0.902 |
| MEDT | 2.962 | 1426.453 | 0.325 | 1.320 | 1.678 | 4036.061 | 0.328 | 0.871 | |
| 2 | COM | 5.020 | 1063.674 | 0.312 | 2.007 | 1.618 | 4862.284 | 0.387 | 0.873 |
| MEDT | 5.203 | 1134.813 | 0.348 | 1.418 | 1.657 | 5183.331 | 0.399 | 0.788 | |
| 3 | COM | 11.475 | 2535.366 | 0.352 | 3.438 | 0.825 | 18,002.940 | 0.372 | 0.864 |
| MEDT | 9.749 | 2761.902 | 0.371 | 2.614 | 0.937 | 20,018.810 | 0.406 | 0.841 | |
| Group No. | Type of Disease | Complications | Days | Count | CV | Min | Median | Max | Mean | Case-Mix Payment Standard | Current Payment Standard |
|---|---|---|---|---|---|---|---|---|---|---|---|
| Group 1 | Benign Ovarian Tumor | Mild | ≤5 | 147 | 0.231 | 3452.47 | 14,314.67 | 15,495.05 | 13,286.17 | 9500 | 13,600 |
| Group 2 | >5 | 224 | 0.112 | 9467.55 | 15,806.24 | 23,471.09 | 15,727.11 | 11,000 | |||
| Group 3 | Moderate | ≤5 | 201 | 0.065 | 10,981.86 | 17,061.75 | 19,057.06 | 17,098.90 | 12,000 | ||
| Group 4 | >5 | 339 | 0.081 | 15,413.35 | 19,230.08 | 22,875.98 | 19,388.43 | 13,500 | |||
| Group 5 | Severe | ≤5 | 98 | 0.097 | 19,136.34 | 20,461.66 | 29,659.75 | 21,038.08 | 14,500 | ||
| Group 6 | >5 | 102 | 0.125 | 18,626.54 | 23,955.20 | 40,278.63 | 24,965.77 | 17,500 | |||
| Group 7 | Malignant Ovarian Tumor | Mild | ≤14 | 37 | 0.213 | 9053.98 | 25,853.78 | 31,157.53 | 25,041.25 | 17,500 | 36,000 |
| Group 8 | >14 | 29 | 0.134 | 24,817.40 | 34,108.85 | 44,585.13 | 34,880.60 | 24,500 | |||
| Group 9 | Moderate | ≤14 | 96 | 0.105 | 30,882.45 | 38,835.37 | 45,868.13 | 38,538.12 | 27,000 | ||
| Group 10 | >14 | 95 | 0.104 | 37,742.73 | 47,933.21 | 55,573.83 | 47,590.34 | 33,500 | |||
| Group 11 | Severe | ≤14 | 41 | 0.074 | 46,459.94 | 51,553.91 | 61,221.50 | 52,050.01 | 36,500 | ||
| Group 12 | >14 | 54 | 0.159 | 55,342.24 | 64,866.38 | 96,908.88 | 68,161.66 | 47,500 | |||
| Average of CV | 0.125 | Total | 36,067,322 | 25,249,000 | 27,781,600 | ||||||
| Degree of declining | 9.12% | ||||||||||
| Case-Mix Method | Number of Groups | Average of CV | RIV |
|---|---|---|---|
| CART | 9 | 0.132 | 90.99% |
| CHAID | 13 | 0.140 | 87.95% |
| MEDT | 12 | 0.125 | 93.90% |
Publisher’s Note: MDPI stays neutral with regard to jurisdictional claims in published maps and institutional affiliations. |
© 2022 by the authors. Licensee MDPI, Basel, Switzerland. This article is an open access article distributed under the terms and conditions of the Creative Commons Attribution (CC BY) license (https://creativecommons.org/licenses/by/4.0/).
Share and Cite
Liu, H.; Tan, J.; Jon, K.; Zhu, W. A New Case-Mix Classification Method for Medical Insurance Payment. Mathematics 2022, 10, 1640. https://doi.org/10.3390/math10101640
Liu H, Tan J, Jon K, Zhu W. A New Case-Mix Classification Method for Medical Insurance Payment. Mathematics. 2022; 10(10):1640. https://doi.org/10.3390/math10101640
Chicago/Turabian StyleLiu, Hongliang, Jinpeng Tan, Kyongson Jon, and Wensheng Zhu. 2022. "A New Case-Mix Classification Method for Medical Insurance Payment" Mathematics 10, no. 10: 1640. https://doi.org/10.3390/math10101640
APA StyleLiu, H., Tan, J., Jon, K., & Zhu, W. (2022). A New Case-Mix Classification Method for Medical Insurance Payment. Mathematics, 10(10), 1640. https://doi.org/10.3390/math10101640