Article

Urinary Extracellular Vesicles and Salt-Losing Tubulopathies: A Proteomic Approach

1
School of Medicine and Surgery, University Milan Bicocca, 20900 Monza, Italy
2
Laboratory of Medical Genetics, Fondazione IRCCS Ca’ Granda Hospital, 20162 Milan, Italy
*
Author to whom correspondence should be addressed.
Proteomes 2020, 8(2), 9; https://doi.org/10.3390/proteomes8020009
Submission received: 28 February 2020 / Revised: 17 April 2020 / Accepted: 8 May 2020 / Published: 9 May 2020
(This article belongs to the Special Issue Human Proteomics)

Abstract

:
Renal tubular cells release urinary extracellular vesicles (uEV) that are considered a promising source of molecular markers for renal dysfunction and injury. We investigated uEV proteomes of patients with hereditary salt-losing tubulopathies (SLTs), focusing on those caused by Gitelman and Bartter (BS) syndromes, to provide potential markers for differential diagnosis. Second morning urine was collected from patients with genetically proven SLTs and uEV were isolated by the ultracentrifugation-based protocol. The uEV proteome was run through a diagonal bidimensional electrophoresis (16BAC/SDS-PAGE), to improve hydrophobic protein resolution. Sixteen differential spots from the proteome of two variants (BS2 and BS3) were analysed by nLC-ESI-MS/MS after in-gel tryptic digestion. A total of 167 protein species were identified from 7 BS2 spots and 9 BS3 spot. Most of these proteins were membrane-associated proteins, in particular transmembrane proteins, and were related to typical renal functions. The differential content of some uEV was then validated by immunoblotting. Our work suggests that uEV proteomics represents a promising strategy for the identification of differential SLT proteins. This could play a role in understanding the pathophysiological disease mechanisms and may support the recognition of different syndromes.

Graphical Abstract

1. Introduction

Gitelman syndrome (GS) and Bartter syndrome (BS) are rare inherited salt-losing tubulopathies (SLT) characterized by hypokalaemic, hypochloraemic metabolic alkalosis [1,2]. They are marked by lower sodium chloride reabsorption of the distal nephron, which results in extracellular volume contraction and increased activity of the renin angiotensin aldosterone system [3]. They are caused by mutations in at least seven genes, involved in sodium/fluid reabsorption, in the thick ascending limb of the loop of Henle and/or the distal convoluted tubule [2,4]. Different classifications have been proposed based on clinical symptoms and/or on the underlying genetic cause. Currently, genetic testing is the main diagnostic tool in use for all known genes responsible for GS and BS, however it is expensive and time-consuming. Moreover, in some patients, genetic screening is not readily available or disease-attributable mutations cannot be found [5]. In addition, a poor phenotype-genotype relationship has been reported. This is likely due to the interaction with other cotransporters and different degrees of compensation through alternative pathways [6].
In particular, given their phenotypic (i.e., clinical and biochemical) similarity, it is sometimes challenging differentiate between GS and BS type 3 (BS3) and between BS type 1 (BS1) and BS Type 2 (BS2). GS and BS3 may be clinically indistinguishable, especially in the absence of a certain genetic diagnosis [7,8]. Furthermore, cases of BS2 have been reported with milder phenotypes resembling BS1 [9,10]. Such diagnostic ambiguity can lead to inappropriate treatment choices and ultimately affect patients’ health [11].
In a previously published paper [12], we showed the diagnostic potential of urinary extracellular vesicles (uEV) in the recognition of SLT. In fact, the molecular composition of this nanosized particles is reported to depend upon the type, and even status, of the producer cell [13]: uEV membranes contain all of the major renal transport proteins belonging to apical and basolateral proteins from all nephron segments, and are believed to reflect their activity in the kidney [14]. In particular, it was shown that it is possible to discriminate GS and BS1 patients from other SLT, based on differential abundance of the thiazide-sensitive sodium chloride cotransporter (NCC) and of the furosemide-sensitive sodium-potassium-chloride cotransporter (NKCC2) within uEV of patients, by western blotting [12,15].
This work highlights further differences in membrane protein composition among uEV from patients affected by tubulopathies, using an unconventional proteomic analysis. In fact, we applied a proteomic approach based on diagonal bi-dimensional electrophoresis (16BAC/SDS-PAGE), able to improve hydrophobic protein resolution, followed by LC-ESI-MS/MS analysis of some selected differential spots, after in-gel tryptic digestion. Finally, we proposed a preliminary panel of proteins whose differential content in patient uEV may allow discrimination among the different SLT.

2. Materials and Methods

2.1. Materials

Milli-Q water was used for all solutions. Benzyldimethyl-n-hexadecylammonium Chloride (16-BAC), Bicinchoninic acid (BCA) protein assay, acetic acid, isopropyl alcohol, methanol, bovine serum albumin (BSA), N-cyclohexyl-3-aminopropanesulfonic acid (CAPS), ammonium bicarbonate (NH4HCO3), dithiothreitol (DTT), iodoacetamide (IAA), acetonitrile (ACN), formic acid (FA) and pyronin-Y were supplied from SIGMA Chemical Co. (St. Louis, MO, USA); glycerol was from Merck (Darmstadt, Germany). Coomassie Blue R205 and urea were from Bio-Rad (California, USA). Hybond-enhanced chemiluminescence (ECL) nitrocellulose membrane was from GE (Little Chalfont, Buckinghamshire, UK). NuPAGE® SDS-PAGE Gel Electrophoresis System components (mini-gels, running and loading buffer, molecular weight markers and gel protein stainings) were supplied by Life Technologies (Paisley, Renfrewshire, UK). Protease inhibitor cocktail (Complete) was from Roche (Monza, Italy). Anti-NCC- AB118003, anti-annexin A2 (ANXA2), code AB41803, anti-carbonic anhydrase 2 (CA2), code AB382559 polyclonal antibodies (pAb), anti-vacuolar-type ATPase B subunit 1 (VATB1), clone 3B11, code AB118003, anti-sodium/proton exchange regulatory cofactor NHE-RF1 (NHERF1), code AB88238, anti-Tumour Susceptibility Gene 101 (TSG101) and anti-Motility-related protein 1 (CD9) monoclonal antibodies were from Abcam (Cambridge, UK); anti-NKCC2, code HPA018107, pAb was from SIGMA Chemical Co. (St. Louis, MO, USA). Anti-Ammonium transporter Rh type C (RHCG), code H00051458-M06, and anti-GAIP interacting protein, C terminus (GIPC2) mAb were from NovusBio (Centennial, CO, USA). Anti-Flotillin 1 (FLOT1) mAb was purchased from Transduction Laboratories (Lexington, KY, USA) and anti-aquaporin 2 (AQP2) mAb from Cell Signaling Technology (Beverly, MA, USA). Species-specific secondary peroxidase conjugated antibodies and ECL reagents were from Pierce (Rockford, IL, USA).

2.2. Patients

The patients included in this study are from the same cohort already characterized in [12]: Table 1 shows the cases that were selected for the proteome analysis reported in the present paper (Table 1).
The patients were studied and followed up at San Leopoldo Mandic Hospital (Merate, Italy). They all had normotensive and chronic ionic disturbances of tubular/uncertain origin. Laboratory tests displayed alterations suggestive for SLTs, such as hypokalaemia, hypo-/hypercalciuria, normo-/hypomagnesaemia and metabolic alkalosis. No proteinuria was detected in the collected samples. Molecular diagnosis, performed by the Laboratory of Medical Genetics of Fondazione IRCCS Ca’ Granda Maggiore Policlinico Hospital (Milan), disclosed significant mutations of pertinent genes in the homozygous or compound heterozygous state (Table 1).

2.3. Urine Collection and Exosome Isolation

Urine collection, uEV isolation and characterization were performed as described [12]. Briefly, second morning urine samples (~30–50 mL) were collected according to the Human Kidney and Urine Proteome Project guidelines (HKUPP, http:www.hkupp.org). After sediment removal (10 min at 1.000 g, 4 °C), anti-proteases were added to the urine (Complete, Roche) and stored at −80 °C. An aliquot of the collected urine samples was submitted to routine chemical-physical examination and creatinine assay (Jaffé method, Roche) [12].
uEV were prepared from the stored urine samples by differential centrifugation [12,16]. Briefly, thawed urines were centrifuged at 17.000× g for 15 min and at 200.000× g for 70 min: crude uEV pellets were washed in phosphate buffered saline (PBS) solution (200.000× g for 70 min), resuspended in PBS containing protease inhibitors and stored at −80 °C until use.

2.4. Electrophoresis and Western Blotting Analysis

2.4.1. Benzyldimethyl-n-Hexadecylammonium Chloride/Sodium Dodecyl Sulfate Polyacrylamide Gel Electrophoresis (16-BAC/SDS-PAGE)

The 16-BAC/SDS-PAGE protocol was performed according to [17]. Briefly, we prepared 7.5% separation and 4% stacking gel using 1-mm spaced glass plates (ATTO Corporation, Tokio, Japan). uEV samples were mixed with 16-BAC /PAGE 2X loading buffer (7.5 M urea, 250 mM 16-BAC, 10% glycerol, 75 mM DTT, 5% pyronin-Y), heated at 60 °C for 5 minutes, and loaded into wells. Electrophoresis was conducted in acid electrode buffer (2.5 mM 16-BAC, 150 mM glycine, and 50 mM phosphoric acid) at 20 mA/gel. After the separation, uEV proteins were fixed in isopropyl alcohol /acetic acid/H2O solution (3.5/1/5.5 v/v) by changing the solution every 10 minutes and this was performed for a total of 6 times. Subsequently, the gel was stained in Coomassie Blue R205 (0.15% in fix solution) overnight whilst being agitated. After destaining with fix solution, gel was equilibrated in 100 mM Tris-HCl (pH 6.8), three washing for ten minutes each. Sample lanes were excised and incubated with NuPAGE loading buffer 3X/150 mM DTT, for 5 minutes, before loading onto 1 mm 4–12% NuPAGE gels (IPG well) for second dimension separation (NuPAGE Electrophoresis System, Life Technologies, Paisley, Renfrewshire, UK). Proteins were separated in MOPS SDS-Running buffer and were stained by SYPRO™ Ruby Protein Gel Stain (for analytical gels, loaded with 20 µg of uEV proteins) or SimplyBlue Safe Stain (for preparative gels, loaded with 40 µg of uEV proteins) (Life Technologies), following manufacturer’s instructions. In gels to be used for spot excision, pools of uEV from 3 or 4 individuals for each condition were used, mixing equal amount of proteins for each subject. This was done in order to minimize the effect of biologic variability and to obtain a clear visualization on the gels. Gel images were acquired by a CCD camera equipped with a UV or white light transilluminator (LAS4000, GE).

2.4.2. Western Blotting Analysis

Equal amount of uEV proteins were separated using 4−12% NuPAGE in MOPS SDS buffer (Life Technologies), as described [12,16], and transferred to nitrocellulose membranes using a “tank” electrophoretic transfer apparatus (Hoefer) in CAPS transfer buffer (10 mM CAPS pH 11, 10% Methanol). The filters were saturated with 5% free-fat milk/0.2% Tween 20 in PBS solution, and then incubated with the primary antibodies followed by peroxidase-conjugated secondary antibodies. Protein signals were developed using enhanced chemiluminescence detection (SuperSignal West-Dura/Femto ECL, Pierce) by the LAS4000 CCD camera (GE). Densitometric analysis was performed by ImageQuant TL software (GE Healthcare).

2.5. Mass Spectrometry and Protein Identification

All the spots were excised and stored at 4 °C. The spots of interest were subjected to in-gel protein digestion as already described ([16] I. Briefly, the gel slices were washed twice with a mixture of 25 mM NH4HCO3/ACN (1:1; v/v) for 15 min. Proteins were reduced by 10 mM DTT, 45 min at 56 °C, and then alkylated by 55 mM IAA, 30 min in dark. Gel slices were then washed using 25 mM NH4HCO3/50% acetonitrile for three times. After dehydration with ACN, the proteins were in-gel digested by modified porcine trypsin (Promega, Madison, WI, USA; 12.5 ng mL−1 in 25 mM NH4HCO3) at 37 °C overnight. The obtained peptide solutions were then diluted in 0.1% TFA and desalted using Ziptip™-C18 (Millipore, Burlington, MA, USA) following manufacturer’s instructions.
Protein identification was performed on a Dionex UltiMate 3000 rapid separation (RS) LC nanosystem (Thermo Scientific, Germany) coupled with Impact HDTM UHR-qToF system (Bruker Daltonics, Bremen, DE). After injection, peptide samples were desalted and concentrated onto a 2 cm precolumn (Dionex, Acclaim PepMap 100 C18, cartridge, 300 mm ID5 mm, 5 mm), and separated by a 200 min-multistep gradient (mobile phase 80% acetonitrile/0.08% FA) on the analytical 50 cm nanocolumn (Dionex, 0.075 mm ID, Acclaim PepMap100, C18, 2 mm) with a flow rate of 300 nl/min. The mass spectrometer was operated in DDA (Data Dependent Acquisition Mode), with automatic switching between full scan MS and MS/MS acquisition. N2 was used as a gas for CID (collision induced dissociation) fragmentation. The software automatically selected the number of precursor ions in order to fit into a fixed cycle time: the time between two subsequent MS acquisitions was 5 s. The charge of precursor ions ranged between +2 and +5, and precursor peaks above 1575 counts, in 300–1221 and 1225–2200 m/z window, were selected. IDAS (Intensity Dependent Acquisition Speed) and RT2 (RealTime Re-Think) functionalities were applied. A specific lock-mass (1221.9906 m/z) and a calibration segment of 10 mM sodium-formate cluster solution before the beginning of the gradient were applied in order to achieve an improvement of mass accuracy. The obtained chromatograms were elaborated by Compass DataAnalysisTM, v.4.0 Sp4 (Bruker Daltonics, Hamburg, Germany). The resulting mass lists were processed using an in-house Mascot search engine (v.2.4.0), through Mascot Daemon, considering the human Swissprot database (accessed May 2017, 555.594 total entries) as reference database. We set trypsin as enzyme and carbamidomethyl (C) as fixed modification in the search parameters. Mass tolerance for all identifications was generally fixed at 20 ppm for the precursor ions and 0.05 Da for the product ions. We applied automatic decoy database search and a built-in Percolator algorithm to calculate the probabilities of posterior error for each peptide-spectrum match and to rescore search results with a unique significance threshold. Global false discovery rate < 1% was considered to filter the data and we considered identified only proteins with at least one unique identical peptide sequence (p-value < 0.05) to be positively identified.

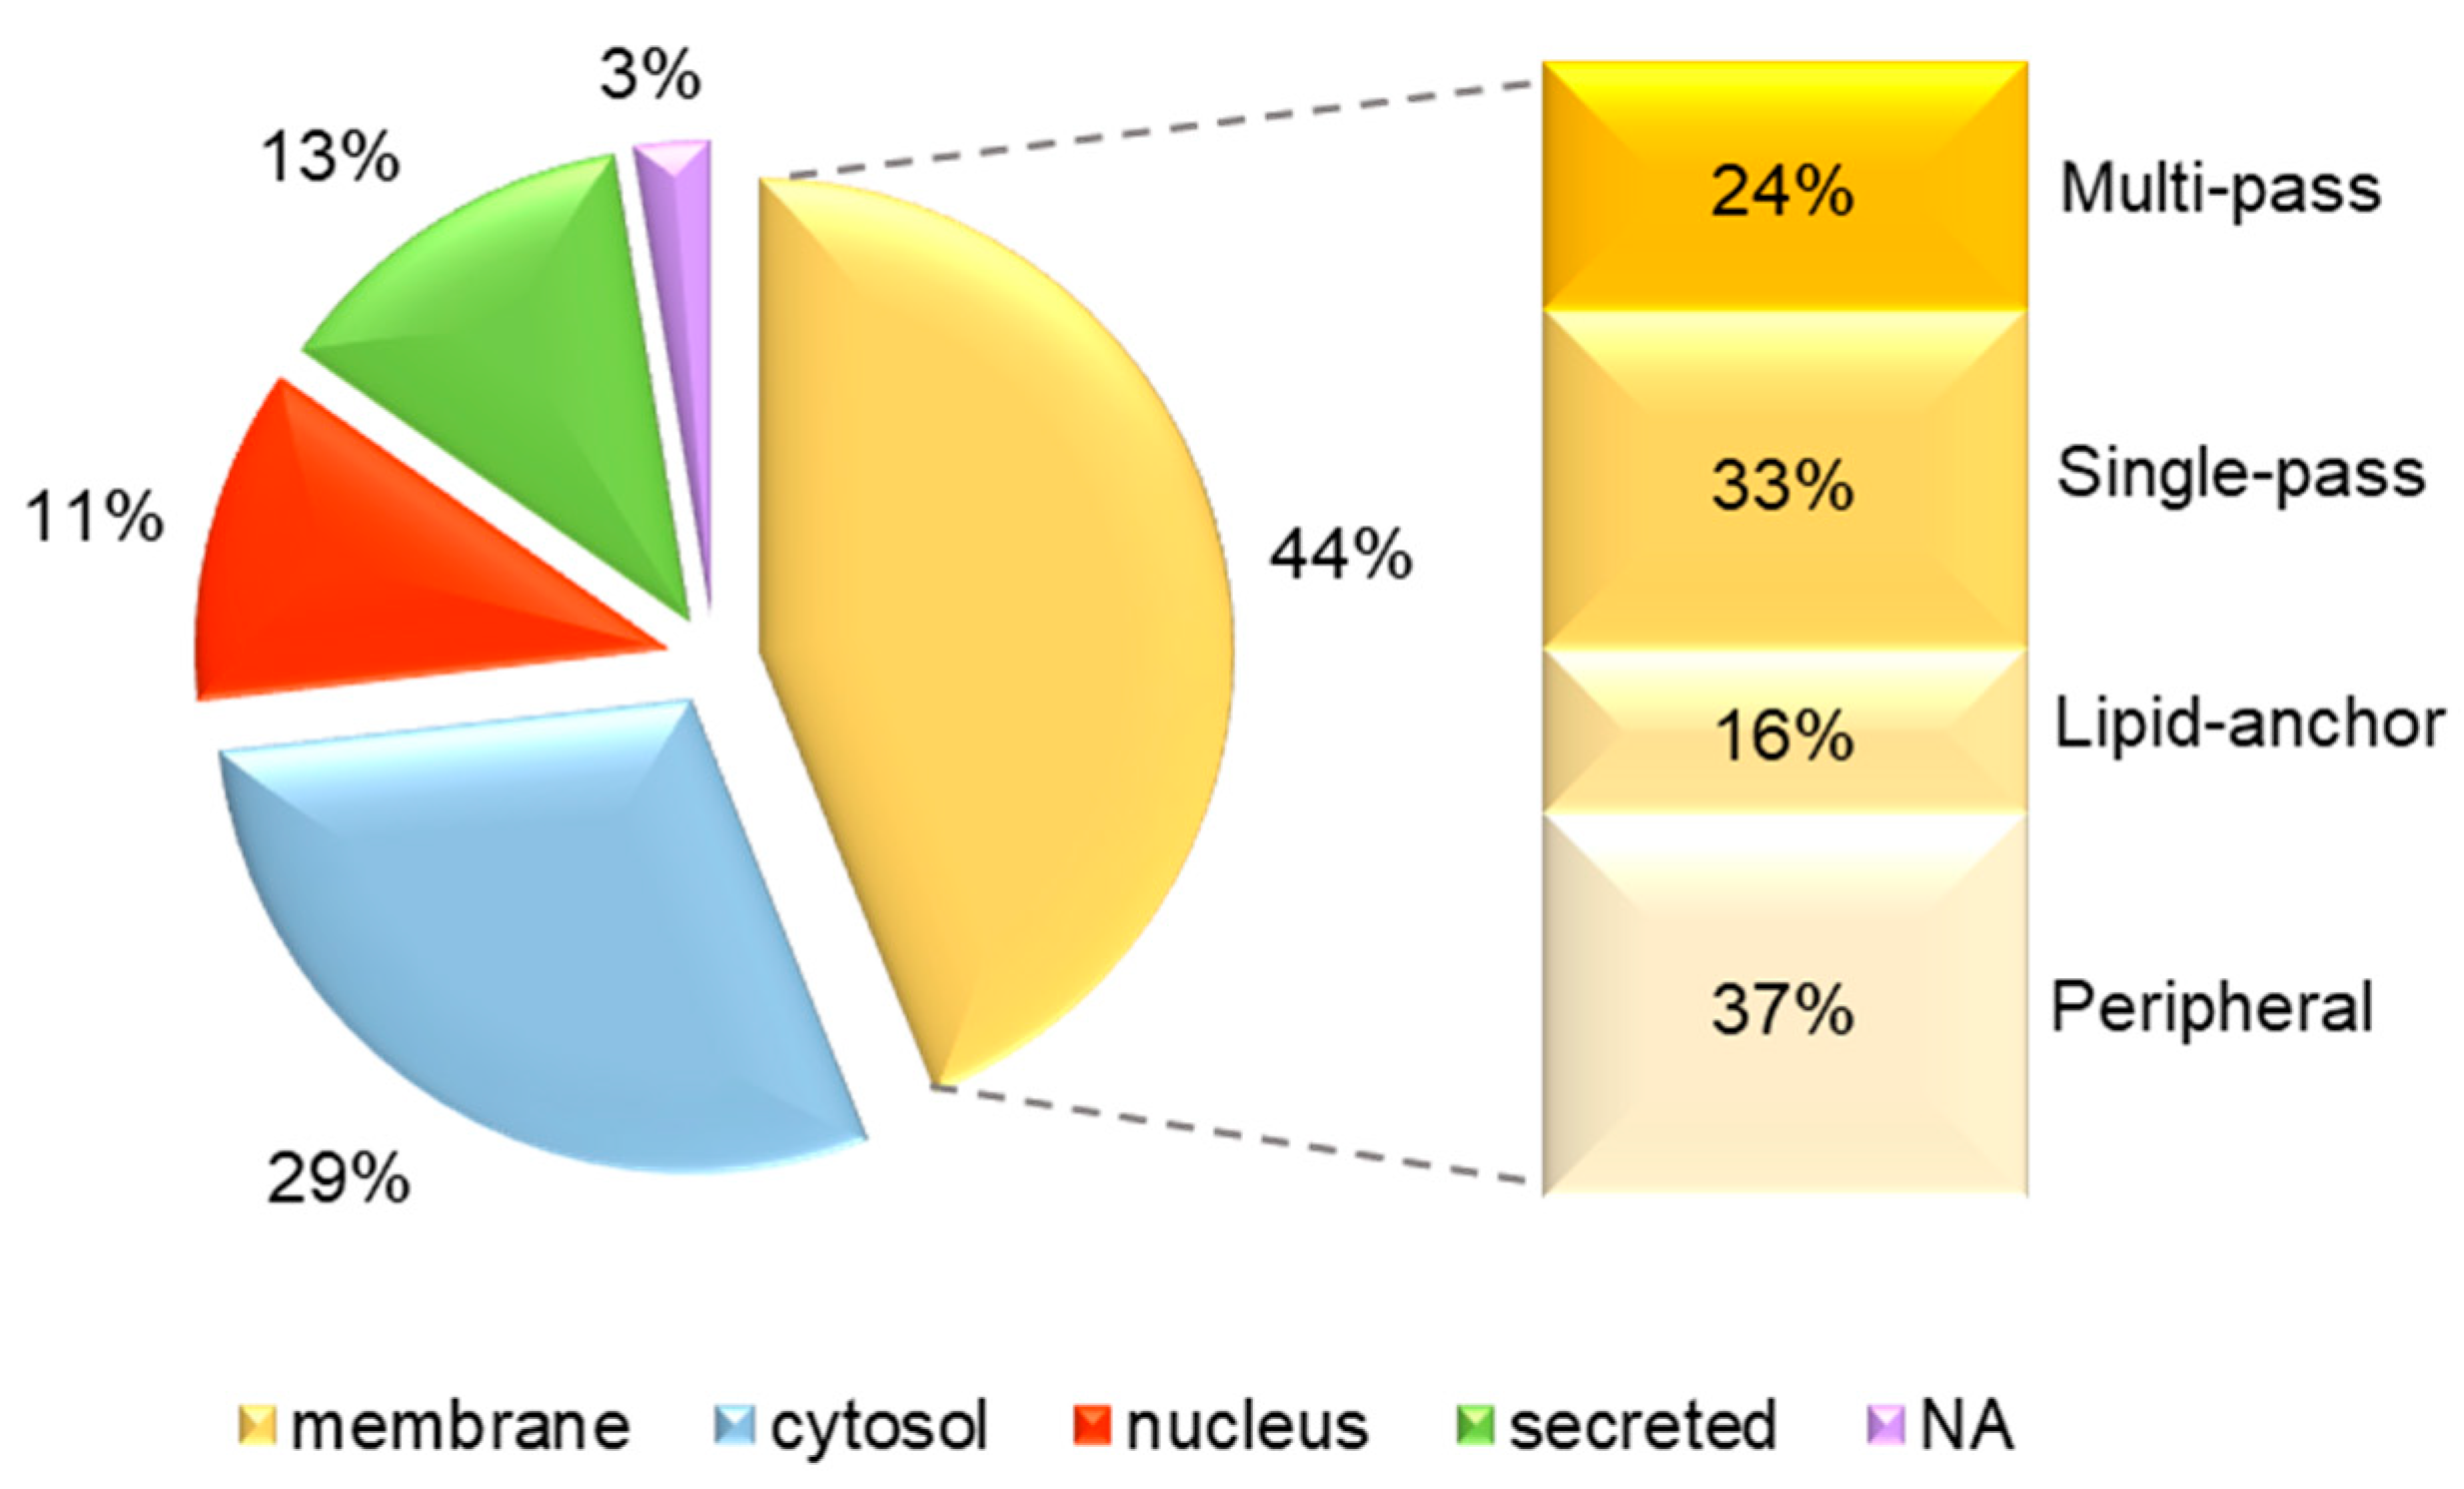
2.6. Bioinformatic Analysis

Gene ontology (GO) analysis was performed using UniprotKB (http://www.uniprot.org/uniprot/) database, considering the molecular function. The subcellular localization of the identified proteins was assigned by UniprotKB (http://www.uniprot.org/uniprot/), LocDB (www.rostlab.org/services/locDB/) and the Human Protein Atlas (www.proteinatlas.org) databases. Tissue specificity was evaluated comparing the lists of the identified proteins with the human tissue specific proteome, based on transcriptomics analysis provided by the Human Protein Atlas (www.proteinatlas.org) [18,19]. We also considered the “expression protein score” across all major organs and tissue types in the human body (www.proteinatlas.org).

2.7. Statistical Analysis

Differences in the abundance level of the uEV proteins obtained by WB were evaluated by the non-parametric Kruskal-Wallis test (two-sided, α = 0.05), coupled with a post-hoc Dunn’s multiple comparison. We targeted specific two by two comparisons by the non-parametric Mann-Whitney test (one-tail, α = 0.05). All the statistical analysis was performed by GraphPad Prism. We performed a multivariate analysis using the web tool ClustVis (https://biit.cs.ut.ee/clustvis/) [20]. We chose “correlation” to measure the clustering distance and “average” as linkage criterion.

3. Results

3.1. uEV Characterization

Proteomic analysis of uEV requires first to correctly characterize the vesicles. We prepared uEV from urine samples of patients enrolled in our previous study on SLT [12]. As shown in Supplementary Materials, Figure S1, uEV proteins display a typical electrophoretic profile, different from that of the urine of origin and the supernatant after ultracentrifugation. In particular, they show enrichment of uromodulin, the most abundant urinary glycoprotein, and depletion of albumin (Figure S1a). Samples of uEV of patients showed quite similar protein pattern in the different SLT and healthy subjects.
Moreover, uEV markers, such as FLOT1, TSG101, CD9 (ubiquitary exosomal markers) and AQP2 (specific for urine) [21] were highly, and rather uniformly, enriched in the vesicle fractions of the different subjects, while their signals were nearly undetectable in total urine and in the supernatant after ultracentrifugation (Figure S1b).
uEV prepared by the same protocol in our lab were characterized by electron microscopy and results were shown in a previous paper of our group [16]. Finally, the isolation protocol was further validated by nanoparticle tracking analysis (NTA) performed on uEV obtained from healthy subjects in the pediatric age group (data not shown), confirming that the size distribution is typical of uEV [22], with the peak of the most represented vesicle population positioned within the range of 101–200 nm in diameter.

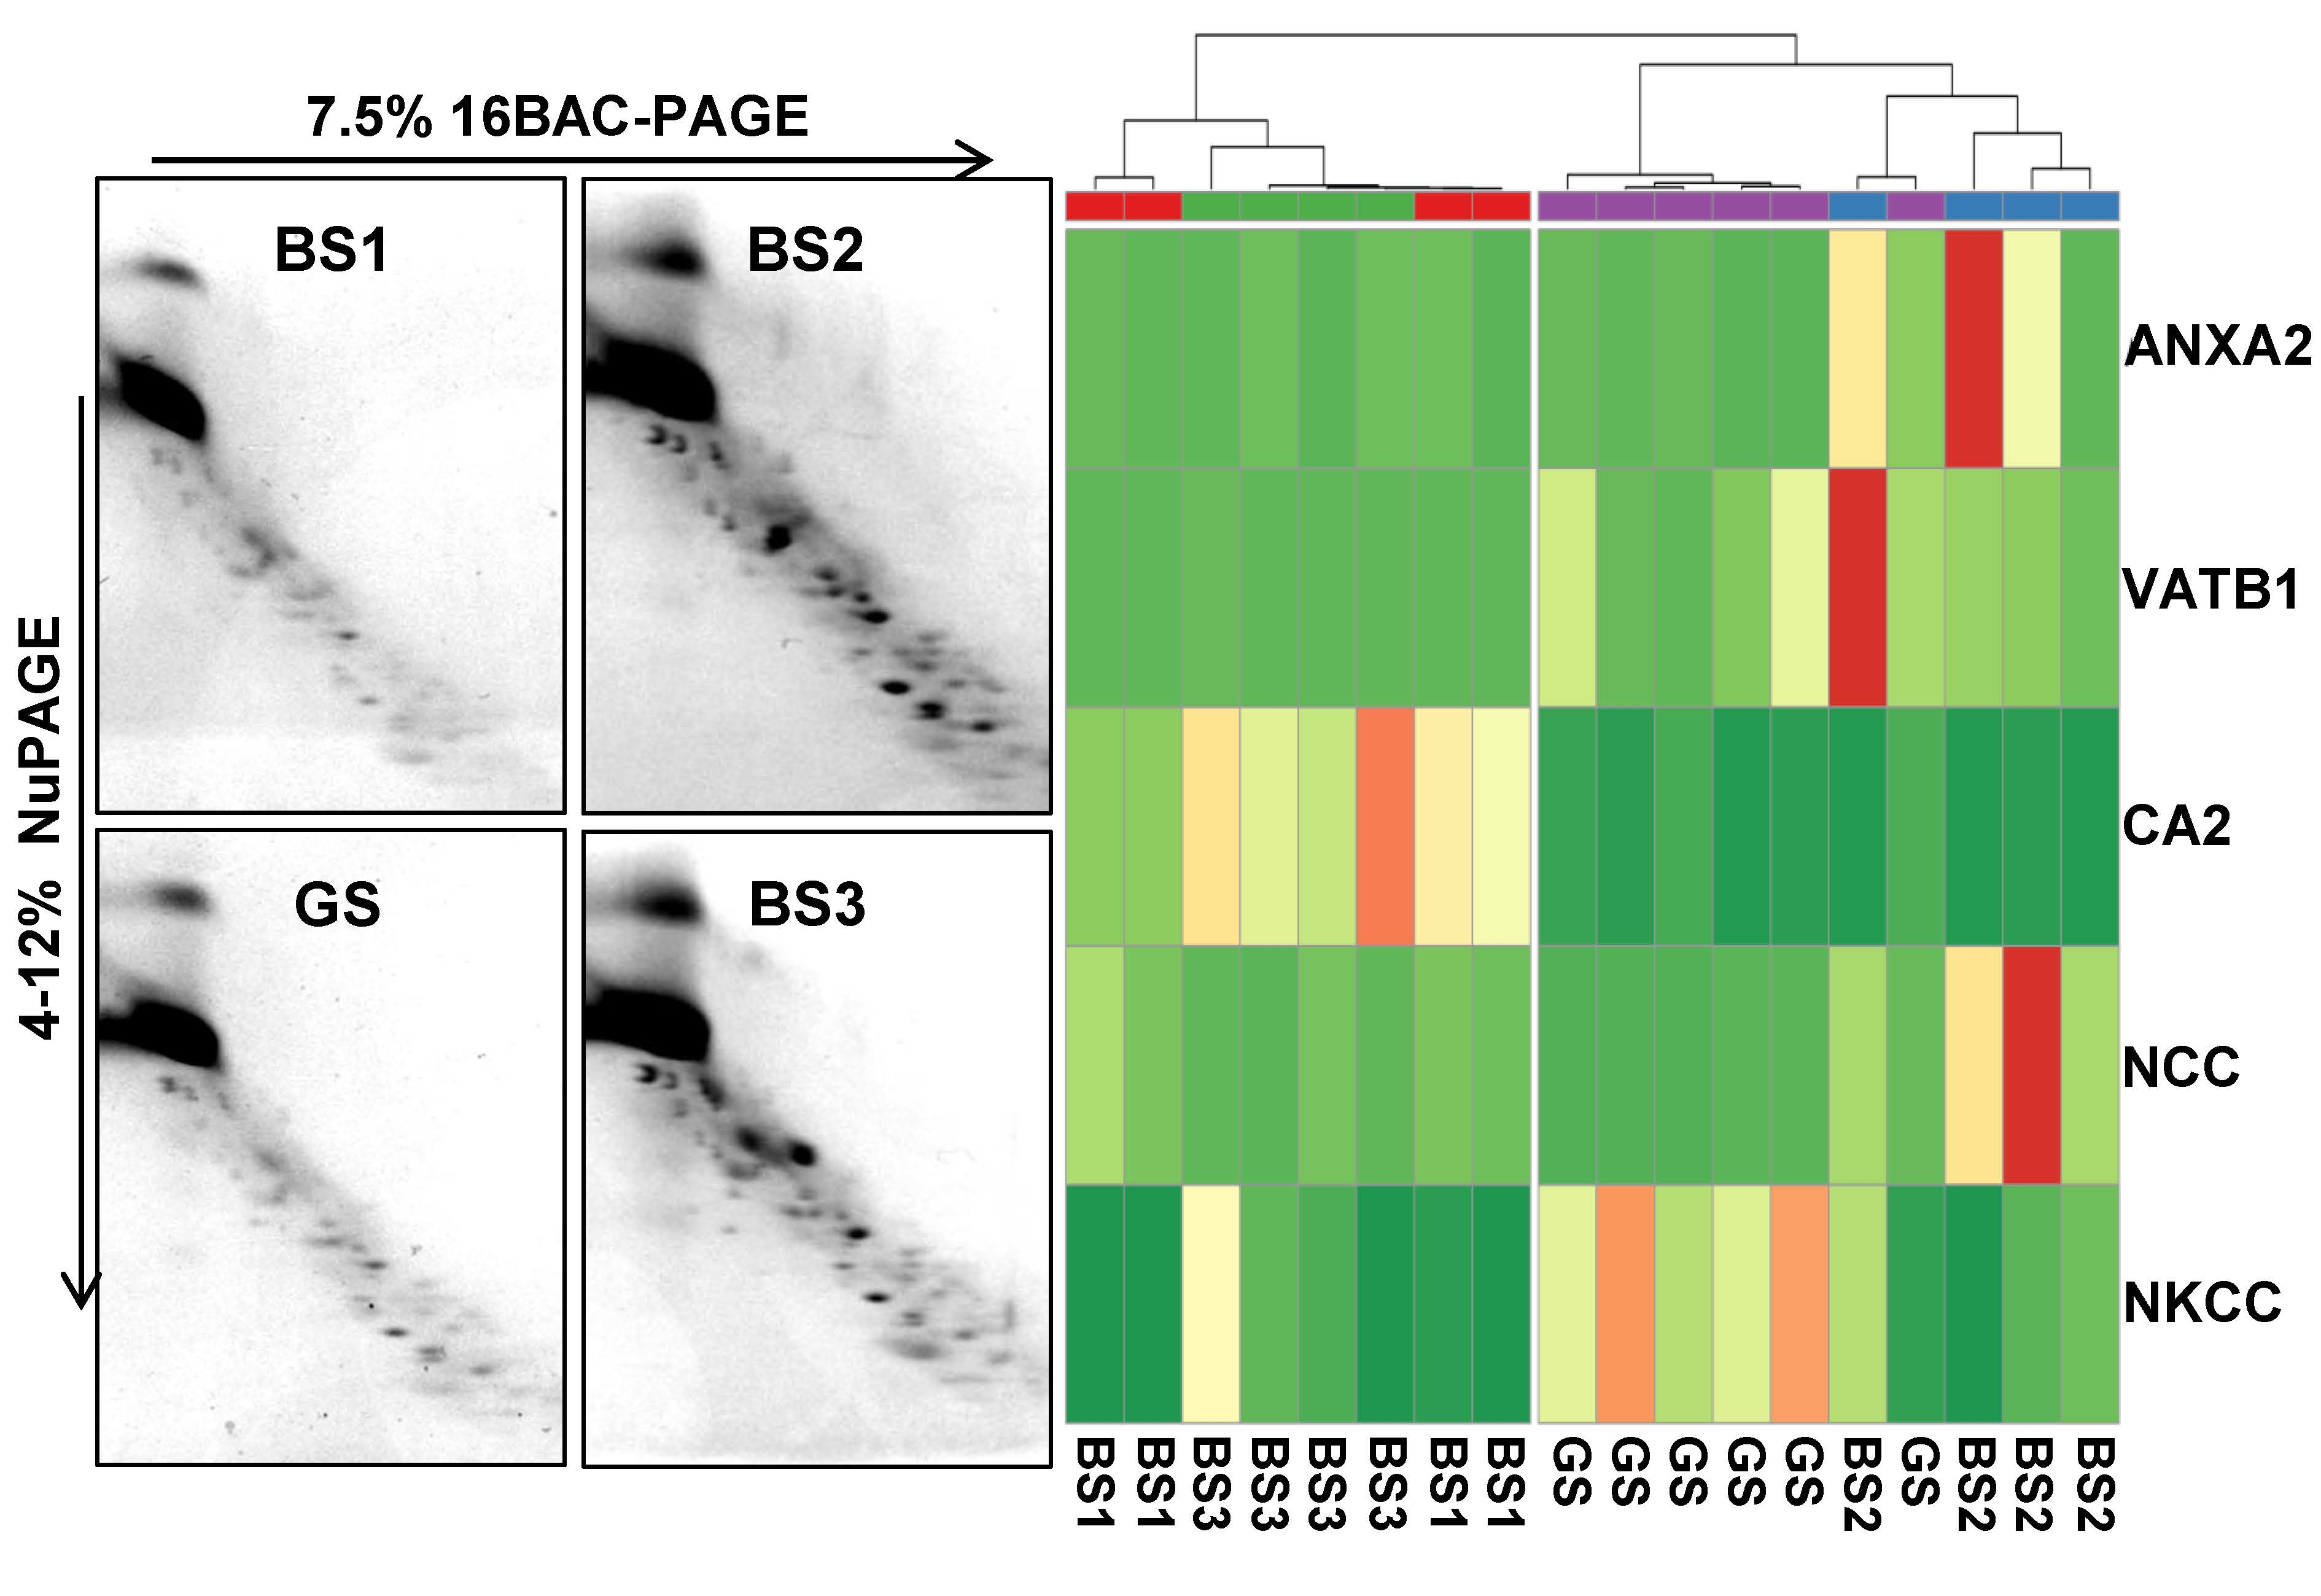
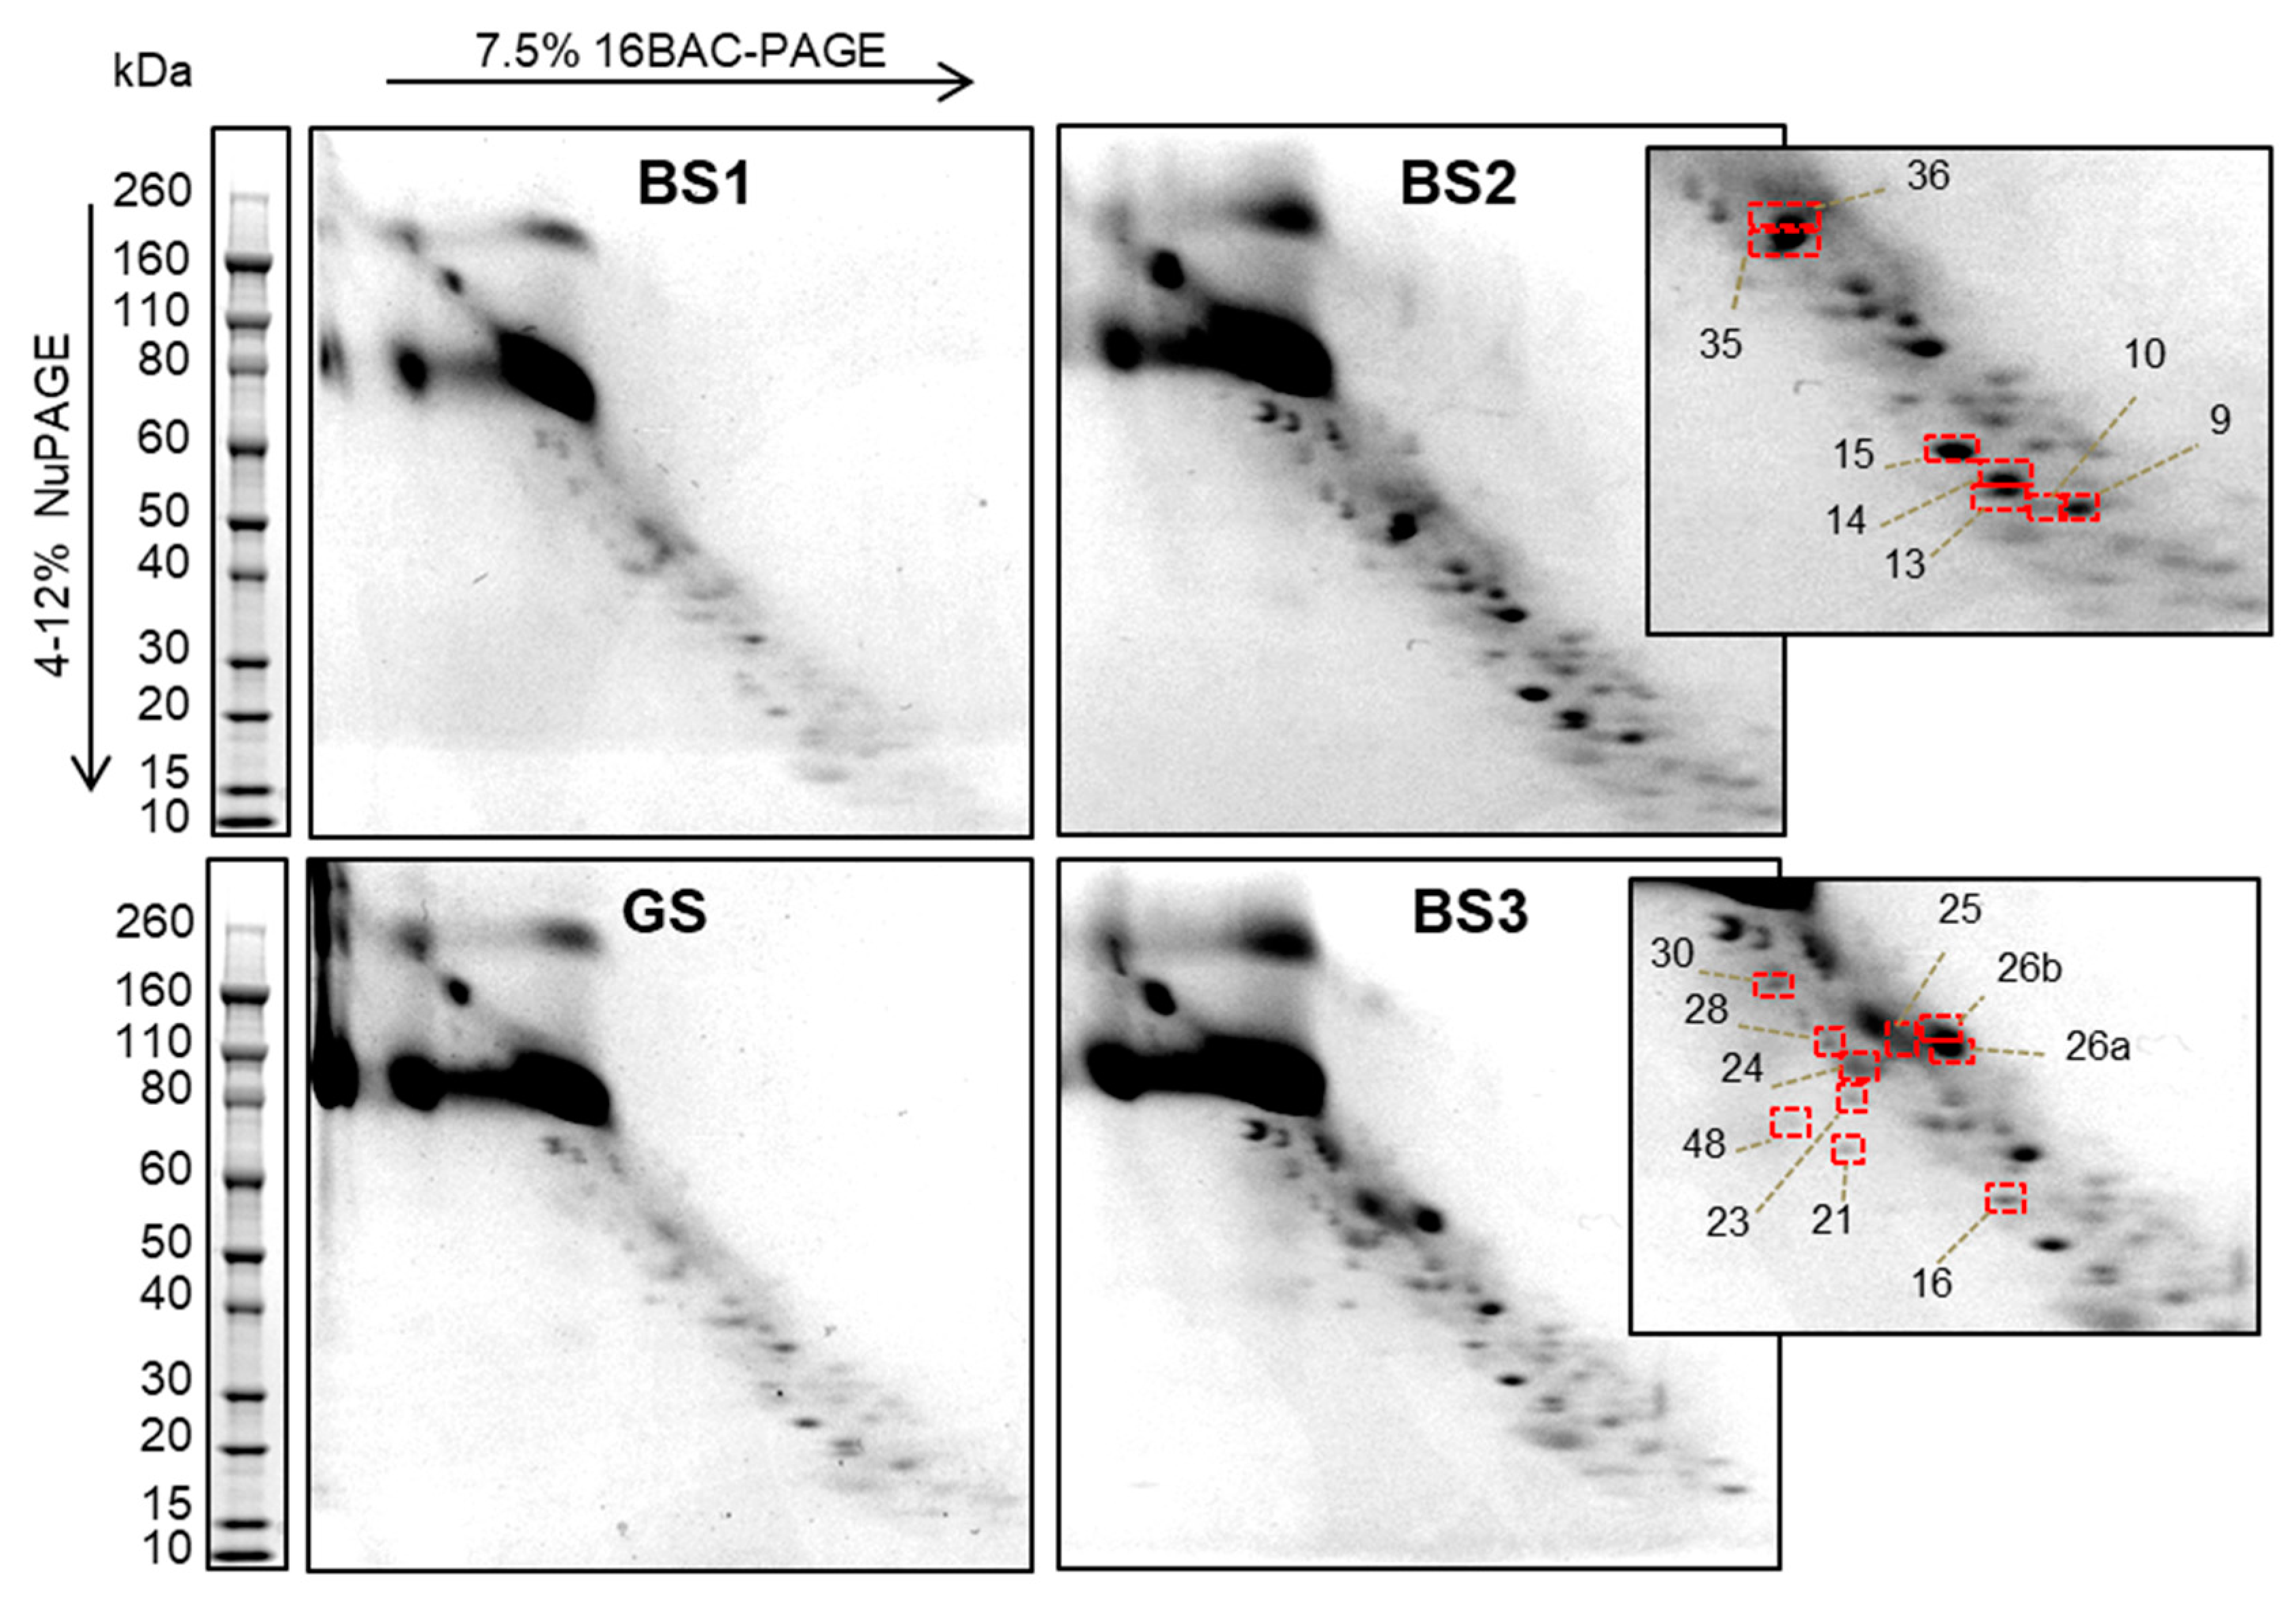
3.2. Two-Dimensional 16-BAC/SDS Polyacrylamide Gel Electrophoresis Separation of uEV Proteins

Two-Dimensional 16-BAC/SDS-PAGE requires a large amount of proteins (at least 40 µg for each sample), which it is hard to obtain from patient uEV, especially in a paediatric clinical setting (due to limited urine volume). Moreover, uEV contain only 2–3% of total urine proteins [23]. In addition, SLT patient urine is known to be quite diluted. The use of the highly sensitive protein staining, SyproRuby, allowed us to use half of the material (20 µg) to detect protein signals and to test the reproducibility of this electrophoretic technique. Examples are shown in Figure S2. For technical reproducibility, the same uEV sample was analysed twice, at different times, and gave similar profiles. Moreover, when analysing biological replicates (for three healthy patients) protein profiles were observed to be similar. Since those results were reproducible, we proceeded to analyse uEV pools from patients with the same SLT (see Figure 1). Moreover, pooling samples from biological replicates reduced biological variability and improved spot visualisation on the gel. The images of the gels show that most spots align along the diagonal, as expected. However, a few spots appear shifted from the diagonal. They likely represent hydrophobic proteins that show a different electrophoretic mobility in first and second dimension [17]. Since a critical point in the differential diagnosis of hereditary tubulopathies is the discrimination between BS1 and BS2 and between BS3 and GS, we selected spots by focusing on the comparison between protein profiles of uEV of the BS1 vs. BS2, and BS3 vs. GS pools (Figure S3). We picked 7 spots in the BS2 gel and 9 in the BS3 (Tables S2 and S3). Such selected spots—marked in red in fig 1 insert—were excised from gels of uEV pools BS2 and BS3 and were then analysed after in-gel tryptic digestion followed by nLC-ESI-MS/MS in order to identify the underlying protein species.

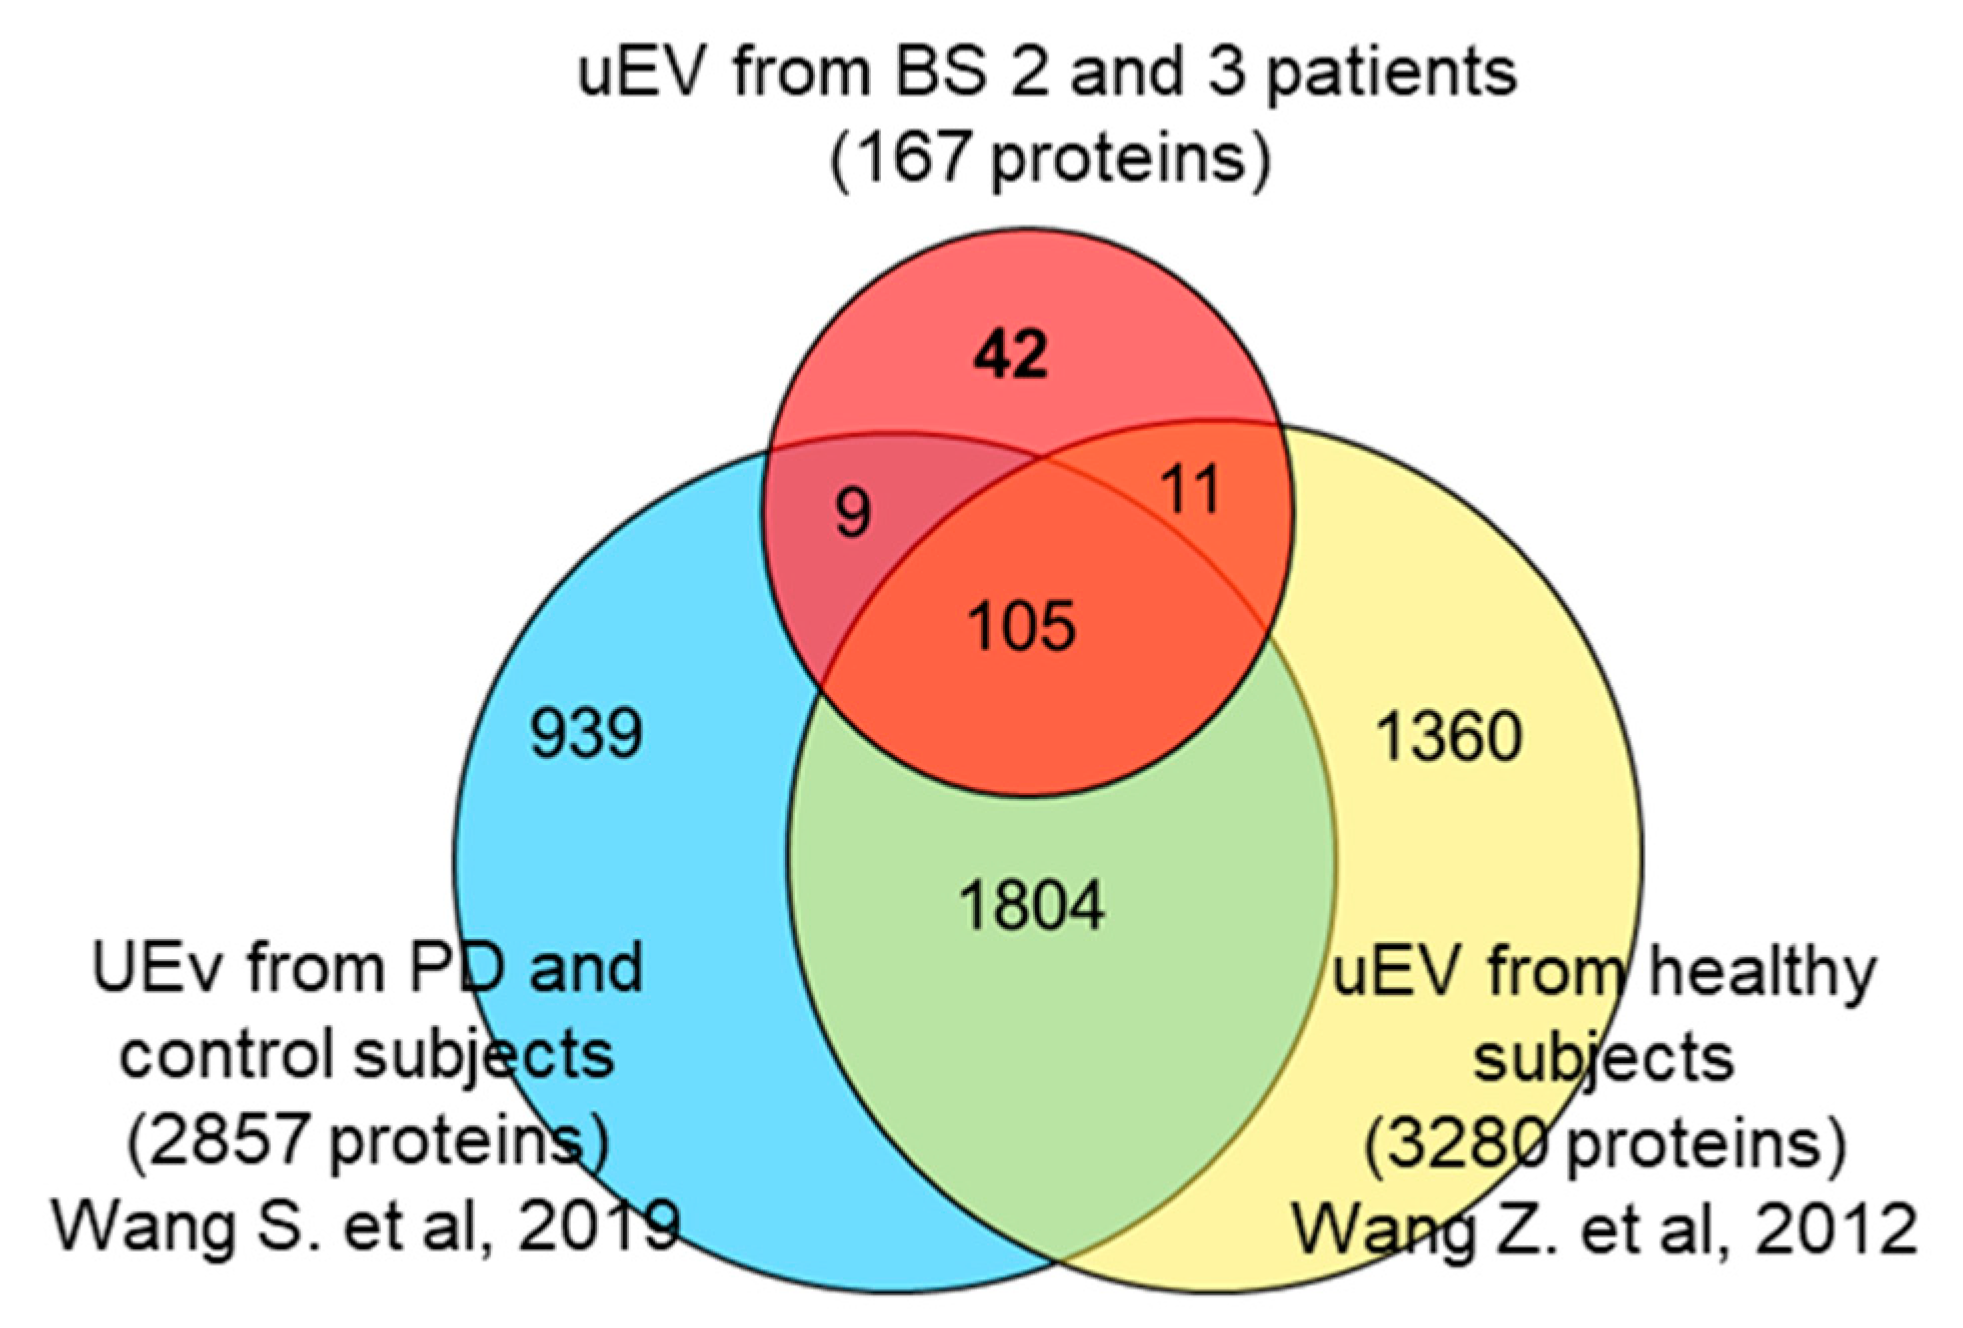
3.3. Identification of uEV Proteins

MS analysis identified 167 different protein species, 19 of which in both BS2 and BS3 uEV (Table 2 and Table S1). The lists of proteins identified in each spot are reported in Tables S2 and S3). Keratins were excluded as they are common contaminants in LC-MS/MS data. Moreover, we decided to not include peptides derived from uromodulin. Proteins that were recovered in more than one spot were counted only once. Even if only a few spots were analysed, we can consider them as roughly representative of the whole uEV proteomes separated by the diagonal electrophoresis, because they were chosen without pre-determined criteria except the differential intensity between two patient groups. The results show that the most represented subcellular location is membrane (44%) (Table S4): inside this group, the transmembrane proteins (single pass + multi pass) are the most abundant, presenting more than 55% (Figure 2). This suggests that the 16-BAC/SDS-PAGE is also able to enrich for membrane proteins in the case of uEV, which, to our knowledge, have never been analysed by this method.
It is worth noting that when comparing our protein list with the fullest set of healthy subject uEV proteins (3280 entries), published by Wang Z. et al. [24] and the more recent one by Wang S. et al. (2873 entries) [25], 42 proteins were not shared with those datasets (Figure 3), and were identified only in our samples (underlined in Table 2). Fourteen of them (33%) were membrane proteins, and interestingly, they are all integral transmembrane proteins (50% multi-pass and 43% single-pass) except for a peripheral one.
The list of identified proteins (Table 2 and Table S1) provides a preliminary reservoir for the detection of differences in the proteome of uEV among SLTs. Further analysis of these proteins might help elucidating the mechanisms of SLT physiopathology. Among the identified proteins, we could find many typical exosome proteins, such as those involved in biogenesis or structural processes. In particular, TSG101 (tumor susceptibility gene 101), Flotillin 1 (FLOT1) and the Vacuolar Protein Sorting-associated proteins 4 A and B were identified. Moreover, many typical renal proteins, such as Aquaporin-2 (AQP2), Dipeptidase-1 and Carbonic Anhydrase 2 (CA2), as well as some proteins belonging to the Annexin family, such as Annexin-A7 (ANXA7) and Annexin-A11 (ANXA11) were found. Importantly, several key membrane proteins specifically involved in tubular activity i.e., channels and membrane transporters were identified, such as the Solute carrier family 26 member 10 (S2610) and the Ammonium transporter Rh type C (RHCG).

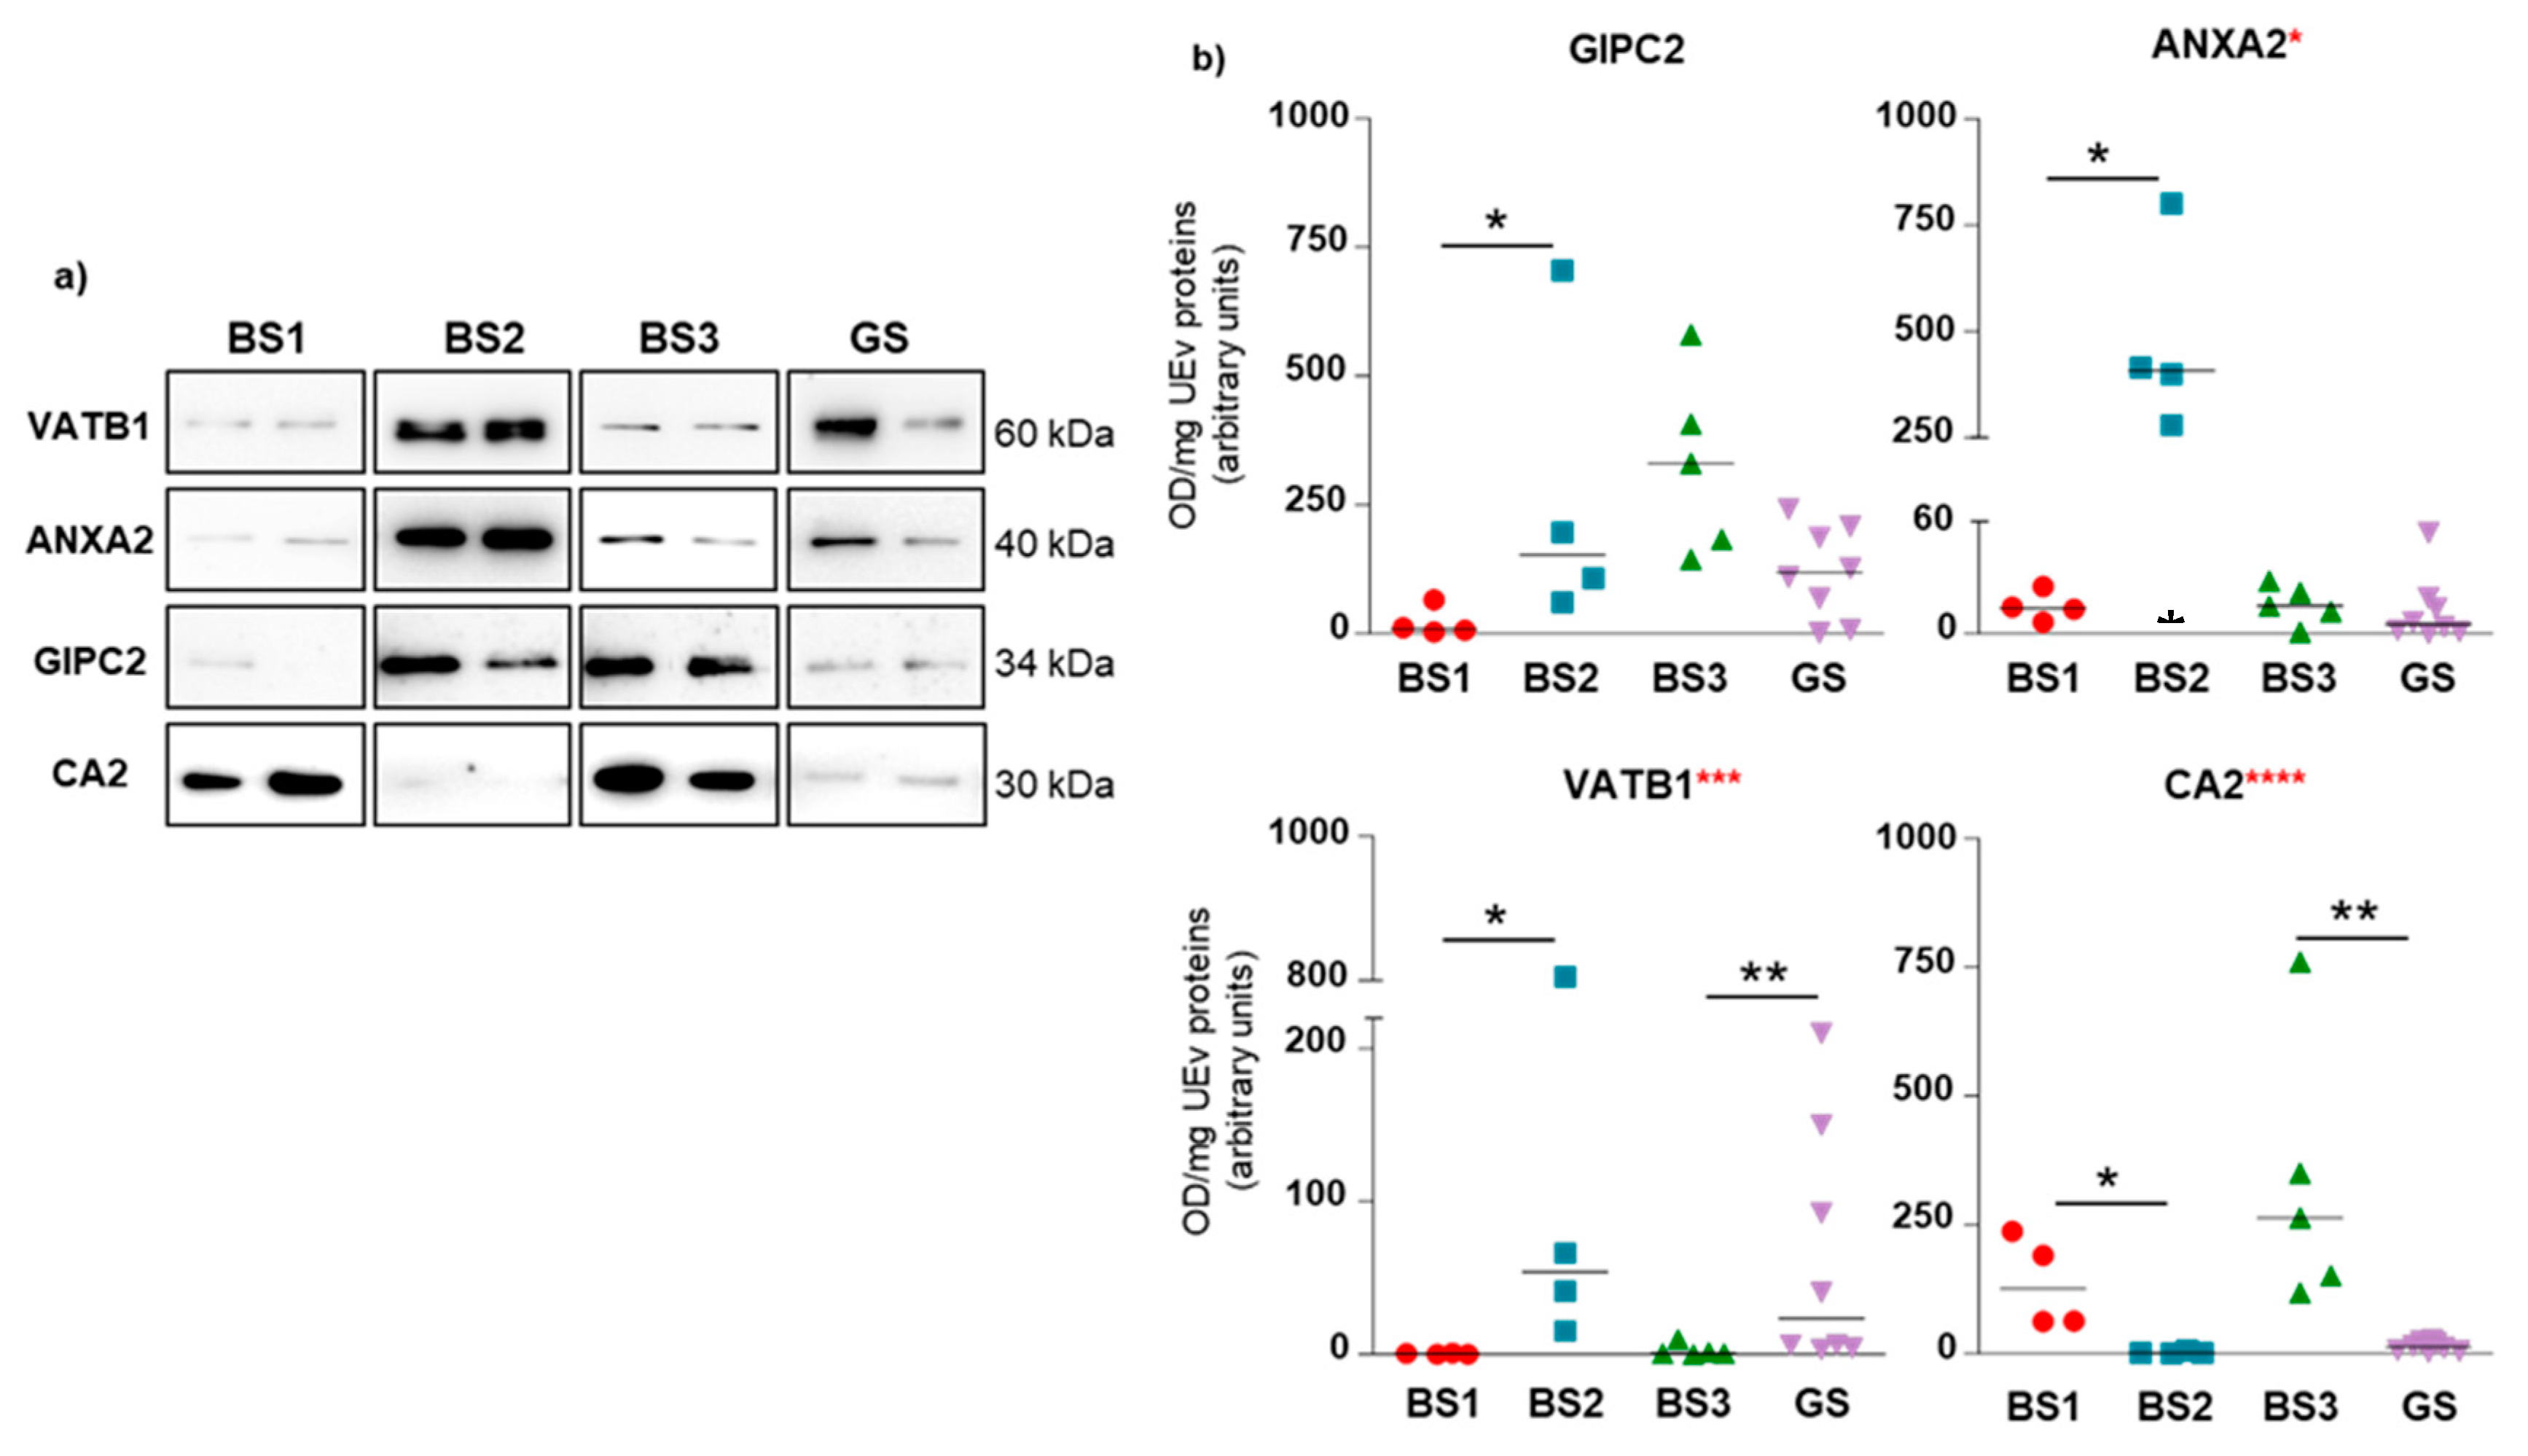
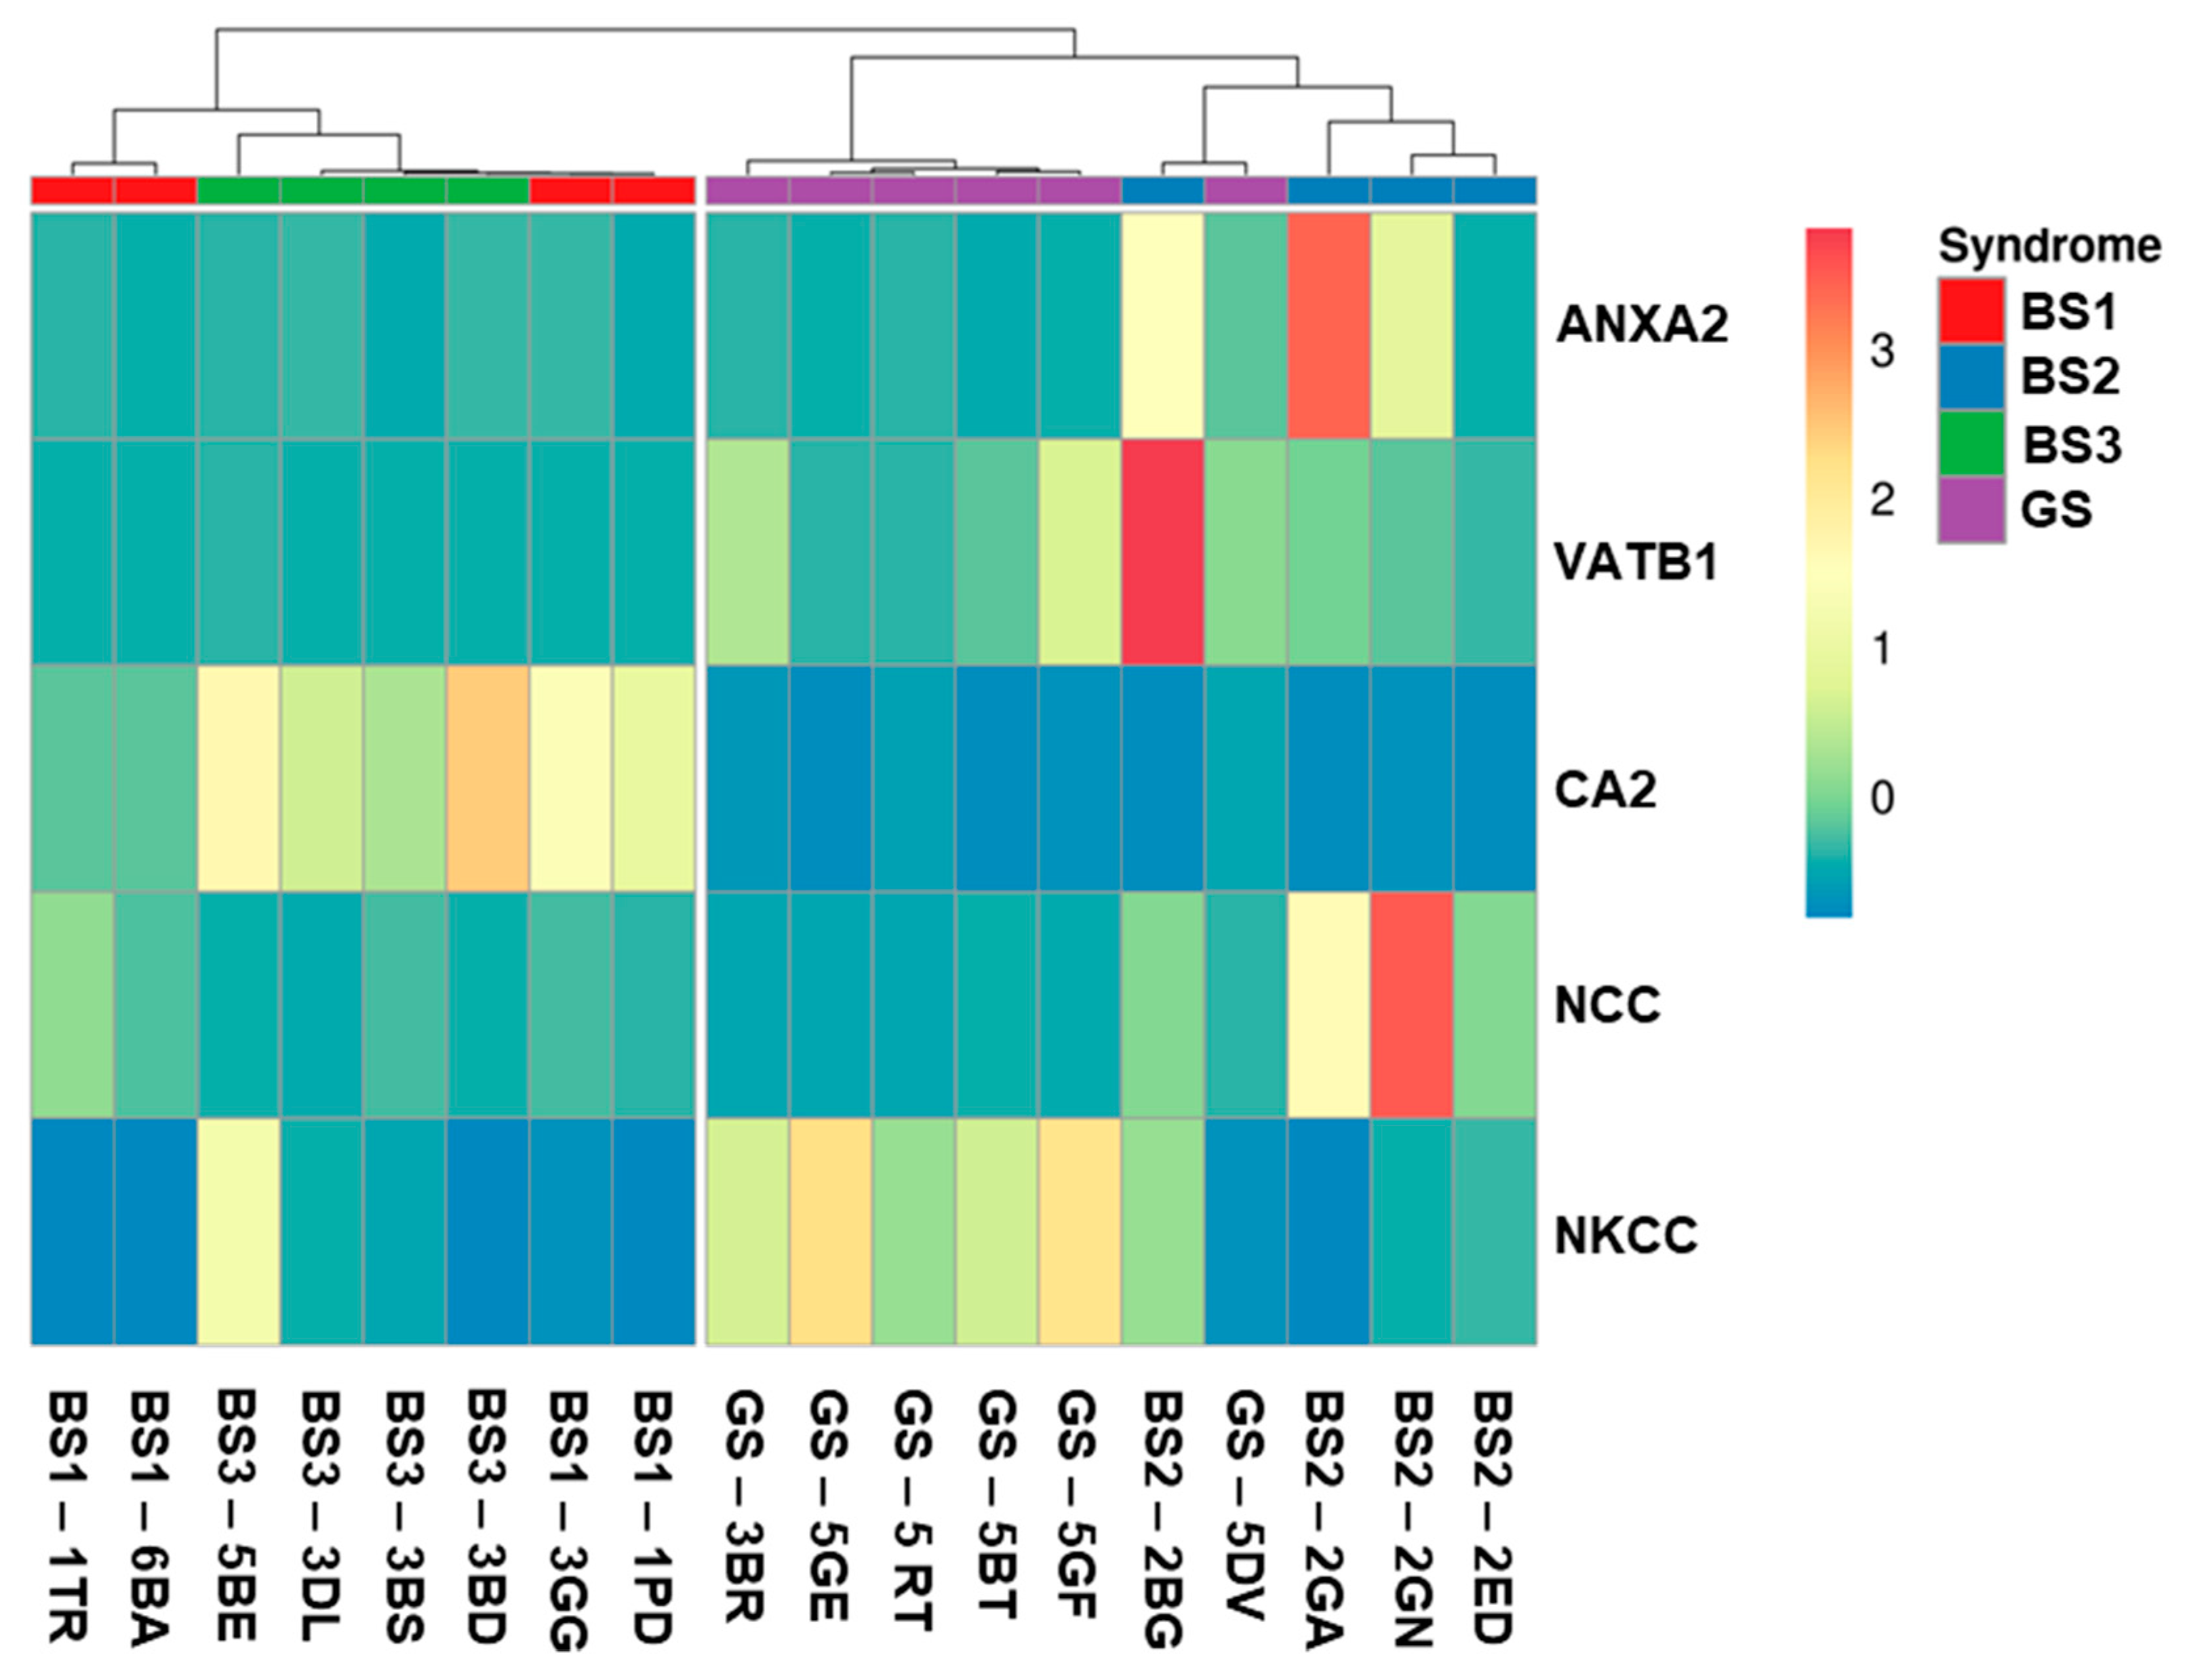
3.4. Western Blotting of Differential uEV Proteins

Starting from the list of the identified proteins (Table 2), we selected some proteins and checked their differential uEV content using western blot analysis on single cases of each tubulopathy (4 for BS1, 4 for BS2, 5 for BS3 and 8 for GS patients). The choice of the proteins to be validated was guided by the following criteria: (i) identified only in one pool (Table 2); (ii) medium-high expression score in the kidney by Human Protein Atlas; (iii) implication in tubular transport processes. Using these criteria, we decided to evaluate uEV abundance of GIPC2, CA2, vacuolar-type ATPase B subunit 1 (VATB1), Na/H exchange regulatory cofactor NHE-RF1 (NHERF1) and RHCG. Moreover, we investigated the protein level of Annexin A2 (ANXA2), although it was not present in the gel spots, due to its involvement in the trafficking of several transmembrane channels or/and transporters at renal tubular level, such as NKCC2, the defective protein in BS1 [23]. The results are shown for GIPC2, CA2, VATB1, and ANXA2. NHERF1 and RHCG WB did not produce any useful data.
The results of WB and densitometric analysis of the bands are summarized in Figure 4 (original western blotting images are provided in supplementary Figure S3). The data show that GIPC2 was found to be increased in BS2 uEV with respect to BS1; CA2 was more abundant in BS3 and BS1, compared to GS and BS2; also VATB1, being identified in 2 BS3 spots, had a differential level between the two couples BS1-BS2 and BS3-GS. Finally, ANXA2 was observed to be much more abundant in the uEV of BS2 cases with respect to those obtained from BS1. These findings suggest that the combined levels of the above proteins in uEV may allow the recognition of Gitelman syndrome and of the Bartter variants.
The issue of correctly normalising uEV protein content remains a hotly debated topic [21,22,23]. To normalize the uEV protein content we used both FLOT1, considered a “housekeeping” EV protein, and creatinine. The results of this further normalisation are shown in supplementary Figure S3 and agree with the reported data.
After performing a multivariate analysis, we were able to provide an expression pattern as a heatmap representation (Figure 5). The best results were obtained including the relative uEV abundance of CA2, VATB1, ANXA2, along with NCC and NKCC2. For this reason, only patients for whom we had all these protein values were included in the heatmap. By using this protein panel, BS1 and BS3 cluster separately from GS and BS2, this allows a clear discrimination between BS1 and BS2 and between BS3 and GS.

4. Discussion

To our knowledge, this is the first study applying the 16-BAC/SDS-PAGE analysis to uEV. This choice is particularly suited to samples in which the ratio between membrane and soluble proteins is expected to be rather high due to the nanosize of the EV [26]. Actually, traditional 2-DE has many drawbacks in the separation of proteins with hydrophobic features [27,28]. In fact, they do not solubilize efficiently in the isoelectrofocusing (IEF) lysis buffer, which lacks strong ionic detergents, and can precipitate on the IPG strips, preventing them to be visualized on the second dimension gels. The diagonal bi-dimensional electrophoresis was proposed as a valid alternative. A recent publication, evaluating several protocols for the separation of plasma membrane protein (PMPs), reports that the number of identified PMPs (after density-gradient ultracentrifugation) was five-fold higher when 16-BAC/SDS-PAGE was used instead of 2DE [29]. In our case, the percentage of membrane proteins (plasma and organellar membranes) identified in the selected spots was 44%. Moreover, the integral transmembrane proteins represent 57% of the membrane proteins. Even if we analysed only a few spots, we believe that these results may be representative of all the uEV proteome. It has to be considered that, in general, the total coverage can never be assured for any proteome [30,31]. This is demonstrated by only partial overlapping of the identified proteins in several studies of the same models and as well as in uEV from healthy subjects, and these differences depend mainly upon the sample preparation and analysis protocols [24,25]. A recent study compared the uEV proteomes published in 4 different papers: each dataset contained between 1000 and 3500 identified proteins, yet only a minority of the proteins (238 proteins) were common to all studies [32].
It is noteworthy that several transporters and channels and their co-factors are among the identified proteins, such as AQP2, vacuolar-ATPases, Sodium/potassium-transporting ATPase, Solute carrier family 26 member 5 (Prestin) and S2610, Solute carrier family 12 member 3 (NCC), Sodium leak channel non-selective protein, NHERF1, Protein tweety homolog 3 (hTTY3). All these proteins are known to be enriched in renal cells, in particular in tubular epithelial types (www.proteinatlas.org). Some of them are involved in maintaining the body’s hydro-saline or acid base balance.
Our study focused on the comparisons between BS1 and BS2, and between GS and BS3, with the aim to provide a possible proteomic alternative to differentiate SLT. We chose and evaluated some proteins by western blot analysis and investigated whether they displayed differential abundances in uEV of the affected patients. These proteins are all involved in the transport of molecules across the plasma membrane of renal cells, as regulators of channel and/or transporter activity, or as direct modulators of acid-base balance.
CA2 is an enzyme located in the proximal tubule, loop of Henle, and intercalated cells in the collecting duct of the kidney [33]. It plays an important role in acid-base transport and salt reabsorption in the proximal convoluted tubule, where interplay among CA2, pendrin and cotransporter NCC was highlighted [34]. Moreover, mutations of CA2 gene per se cause mixed renal tubular acidosis, with osteopetrosis and mental retardation [35]. In addition, a very recent paper suggests that the use of Acetazolamide, a carbonic-anhydrase inhibitor, in combination with standard therapy in children with BS may counteract the metabolic alkalosis [36]. This report suggests a role for carbonic-anhydrase in the complex mechanisms underlying BS pathophysiology.
GIPC2 belongs to the GIPC family, proteins that contain a PDZ domain, functional to their specific interaction with transmembrane proteins [37]. Moreover, in pancreatic cancer cell lines GIPC regulates cellular trafficking pathways by modulating the secretion, biogenesis, and molecular composition of exosomes [38]. GIPC proteins were found concentrated in endocytic compartments of renal proximal tubule cells [39]. In particular, GIPC2 has a high expression protein score in kidney, especially in renal tubules (www.proteinatlas.org).
VATB1 represents the kidney isoform of the vacuolar-type ATPases [40] and is localized to the distal nephron [41]. It is involved in the intracellular pH regulation, by actively secreting protons into urine and heterozygous mutations have recently been reported in patients with some forms of renal tubular acidosis [42]. Furthermore, its alteration may cause neurosensory deafness, characteristic of Bartter variant 4 [43,44].
In relation to the annexin family, we identified two members (ANXA11 and ANXA7) in BS3 spots, but we investigated the uEV level of ANXA2, given that it has been demonstrated to co-distribute with NKCC2 to promote its apical translocation and surface expression [45].
The combined uEV levels of these proteins, together with the abundance of NCC and NKCC2 proteins, whose specific deficiency is the hallmark of GS and BS1, seem to discriminate among the four syndromes, and, in particular, between the two pairs of syndromes (GS/BS3, and BS1/BS2), which may present with overlapping clinical phenotypes. We are aware that the number of the patients is limited, but some of the syndromes are very rare. Moreover, we could rely on a well-characterized, although small, cohort where nearly all the mutations were identified and the clinical phenotypes were rather homogeneous. However, these results suggest that a specific uEV signature may characterize each condition.
Finally, it can be questioned whether the abundance of proteins in uEV reflect their actual level in the kidney. This requirement may be necessary if uEV are truly to serve as a “liquid biopsy.” This matter was discussed in a recent paper [46], demonstrating that this is not the case, at least for kidney-specific proteins and in healthy samples, and is further commented in [47]. As the authors suggest, the lack of correlation may derive from the method chosen by the authors to isolate uEV (precipitation with polyethylene glycol) combined with the high variability in the uEV abundance of the kidney-specific proteins often reported in healthy samples. It has to be underlined that authors normalised the loading amount of uEV to urinary creatinine, rather than normalising the expression of the various proteins to a marker of EV number (e.g., expression of CD63). In order to fully answer the question posed in their study they should have also looked at the relationship between protein expressions normalised to a marker of EV number. Moreover, the authors conclude that a relationship between kidney and uEV protein abundance may become apparent only in pathological samples because disease may upset normal regulation and cause a generalized and prolonged change in protein abundance that is reflected in uEV [39]. This may be exaggerated when the disease has a genetic origin, as in our case. Furthermore, the proteins with differential uEV contents among the syndromes may be involved in the putative mechanisms of adaptation/compensation that tubular cells implement in response to the primary genetic defect. This is especially true if we consider those proteins that modulate acid-base balance in relation to a common SLT symptom such as alkalosis. Of course, this small pilot study is not compelling enough to claim formal cause-to effect relationship, but it provides important proof of concept for the use of uEV profiles as a non-invasive tool for the initial rule out/in of suspect tubulopathies.
There is still much to learn about proteins that are involved in the expression and activity of the mutated transporters. Since there is still a subgroup of patients in whom no mutation can be found in the genes that are currently known to cause SLT, a deeper investigation of uEV proteome in these syndromes could lead to the discovery of dysregulated species and it could possibly generate targets for future treatments [2,6].

5. Conclusions

In conclusion, this paper highlights the role of the proteomic analysis on the uEV in tubulopathies suggesting the presence of a proteomic signature specific for each syndrome. In addition, the evaluation of the uEV content of a protein panel composed by the three selected potential biomarkers (CA2, VATB1 and ANXA2), added to NCC and NKCC2, provides proof of concept that differences in the proteome of uEV can be used to differentiate between different tubulopathies.

Supplementary Materials

The following are available online at https://www.mdpi.com/2227-7382/8/2/9/s1. Table S1: List of the proteins identified in the differential spots of 16-BAC/SDS-PAGE of uEV pool of Bartter Syndrome type 2 and 3 patients. Table S2: List of proteins identified in each analysed spot of BS2 uEV pool. Table S3: List of proteins identified in each analysed spot of BS3 uEV pool. Table S4: List of membrane proteins in our dataset. Figure S1: uEV characterization. Figure S2: Reproducibility of uEV protein profiles by 2D diagonal electrophoresis (biological and technical replicates). Figure S3: Maps of the spot identified in the diagonal electrophoresis gel of BS2 and BS3 uEV pools. Figure S4: Original western blotting images of the proteins of interest in all the analysed samples. Figure S5: Normalization of uEV protein content by FLOT1 and urinary creatinine.

Author Contributions

Conceptualization, F.R., F.M. and M.P.; methodology, F.R. and C.C.; validation, F.R.; investigation, L.P., F.R. and C.C.; data curation, F.R., C.C.; writing-original draft preparation, M.P.; writing, M.P., F.R. and L.P.; supervision, F.M. All authors have read and agreed to the published version of the manuscript.

Funding

This research received no external funding.

Acknowledgments

This study was supported by the University funds “2015-ATE-0404” and “2014-ATE-0089”. We wish to thank Silvana Tedeschi and Marie Louise Syren for the genetic counselling, Davide Cerra and Samuele Corbetta for technical assistance, Andrew Smith for English revision. Finally, we remember once again the late Alberto Bettinelli, without whom this work would never have been possible.

Conflicts of Interest

The authors declare no conflict of interest.

References

  1. Seyberth, H.W.; Weber, S.; Kömhoff, M. Bartter’s and Gitelman’s syndrome. Curr. Opin. Pediatr. 2017, 29, 179–186. [Google Scholar] [CrossRef]
  2. Besouw, M.T.P.; Kleta, R.; Bockenhauer, D. Bartter and Gitelman syndromes: Questions of class. Pediatr. Nephrol. 2019. [Google Scholar] [CrossRef] [PubMed] [Green Version]
  3. Koulouridis, E.; Koulouridis, I. Molecular pathophysiology of Bartter’s and Gitelman’s syndromes. World J. Pediatr. 2015, 11, 113–125. [Google Scholar] [CrossRef] [PubMed]
  4. Salih, M.; Bovée, D.M.; van der Lubbe, N.; Danser, A.H.J.; Zietse, R.; Feelders, R.A.; Hoorn, E.J. Increased Urinary Extracellular Vesicle Sodium Transporters in Cushing Syndrome with Hypertension. J. Clin. Endocrinol. Metab. 2018, 103, 2583–2591. [Google Scholar] [CrossRef] [PubMed] [Green Version]
  5. Riveira-Munoz, E.; Chang, Q.; Godefroid, N.; Hoenderop, J.G.; Bindels, R.J.; Dahan, K.; Devuyst, O. Transcriptional and functional analyses of SLC12A3 mutations: New clues for the pathogenesis of Gitelman syndrome. J. Am. Soc. Nephrol. 2007, 18, 1271–1283. [Google Scholar] [CrossRef] [Green Version]
  6. Cunha, T.D.S.; Heilberg, I.P. Bartter syndrome: Causes, diagnosis, and treatment. Int. J. Nephrol. Renovasc. Dis. 2018, 11, 291–301. [Google Scholar] [CrossRef] [Green Version]
  7. Matsunoshita, N.; Nozu, K.; Shono, A.; Nozu, Y.; Fu, X.J.; Morisada, N.; Kamiyoshi, N.; Ohtsubo, H.; Ninchoji, T.; Minamikawa, S.; et al. Differential diagnosis of Bartter syndrome, Gitelman syndrome, and pseudo-Bartter/Gitelman syndrome based on clinical characteristics. Genet. Med. 2016, 18, 180–188. [Google Scholar] [CrossRef] [Green Version]
  8. Nozu, K.; Yamamura, T.; Horinouchi, T.; Nagano, C.; Sakakibara, N.; Ishikura, K.; Hamada, R.; Morisada, N.; Iijima, K. Inherited salt-losing tubulopathy: An old condition but a new category of tubulopathy. Pediatr. Int. 2019. [Google Scholar] [CrossRef]
  9. Gollasch, B.; Anistan, Y.M.; Canaan-Kuhl, S.; Gollasch, M. Late-onset Bartter syndrome type II. Clin. Kidney J. 2017, 10, 594–599. [Google Scholar] [CrossRef] [Green Version]
  10. Sharma, A.; Linshaw, M.A. A novel compound heterozygous ROMK mutation presenting as late onset Bartter syndrome associated with nephrocalcinosis and elevated 1,25(OH)(2) vitamin D levels. Clin. Exp. Nephrol. 2011, 15, 572–576. [Google Scholar] [CrossRef]
  11. García Castaño, A.; Pérez de Nanclares, G.; Madariag, L.; Aguirre, M.; Madrid, Á.; Chocrón, S.; Nadal, I.; Navarro, M.; Lucas, E.; Fijo, J.; et al. Poor phenotype-genotype association in a large series of patients with Type III Bartter syndrome. PLoS ONE 2017, 12, e0173581. [Google Scholar] [CrossRef] [PubMed]
  12. Corbetta, S.; Raimondo, F.; Tedeschi, S.; Syrèn, M.L.; Rebora, P.; Savoia, A.; Baldi, L.; Bettinelli, A.; Pitto, M. Urinary exosomes in the diagnosis of Gitelman and Bartter syndromes. Nephrol. Dial. Transplant. 2015, 30, 621–630. [Google Scholar] [CrossRef] [PubMed] [Green Version]
  13. Merchant, M.L.; Rood, I.M.; Deegens, J.K.J.; Klein, J.B. Isolation and characterization of urinary extracellular vesicles: Implications for biomarker discovery. Nat. Rev. Nephrol. 2017, 13, 731–749. [Google Scholar] [CrossRef] [PubMed] [Green Version]
  14. Raimondo, F.; Cerra, D.; Magni, F.; Pitto, M. Urinary proteomics for the study of genetic kidney diseases. Expert Rev. Proteomics 2016, 13, 309–324. [Google Scholar] [CrossRef] [PubMed]
  15. Williams, T.L.; Bastos, C.; Faria, N.; Karet Frank, F.E. Making urinary extracellular vesicles a clinically tractable source of biomarkers for inherited tubulopathies using a small volume precipitation method: Proof of concept. J. Nephrol. 2020, 33, 383–386. [Google Scholar] [CrossRef] [Green Version]
  16. Raimondo, F.; Morosi, L.; Corbetta, S.; Chinello, C.; Brambilla, P.; Della Mina, P.; Villa, A.; Albo, G.; Battaglia, C.; Bosari, S.; et al. Differential protein profiling of renal cell carcinoma urinary exosomes. Mol. Biosyst. 2013, 9, 1220–1233. [Google Scholar] [CrossRef] [Green Version]
  17. Hartinger, J.; Stenius, K.; Högemann, D.; Jahn, R. 16-BAC/SDS-PAGE: A two-dimensional gel electrophoresis system suitable for the separation of integral membrane proteins. Anal. Biochem. 1996, 240, 126–133. [Google Scholar] [CrossRef]
  18. Uhlén, M.; Fagerberg, L.; Hallström, B.M.; Lindskog, C.; Oksvold, P.; Mardinoglu, A.; Sivertsson, Å.; Kampf, C.; Sjöstedt, E.; Asplund, A.; et al. Tissue-based map of the human proteome. Science 2015, 347, 1260419. [Google Scholar] [CrossRef]
  19. Raimondo, F.; Corbetta, S.; Savoia, A.; Chinello, C.; Cazzaniga, M.; Rocco, F.; Bosari, S.; Grasso, M.; Bovo, G.; Magni, F.; et al. Comparative membrane proteomics: A technical advancement in the search of renal cell carcinoma biomarkers. Mol. BioSyst. 2015, 11, 1708–1716. [Google Scholar] [CrossRef] [Green Version]
  20. Metsalu, T.; Vilo, J. ClustVis: A web tool for visualizing clustering of multivariate data using Principal Component Analysis and heatmap. Nucleic Acids Res. 2015, 43, W566–W570. [Google Scholar] [CrossRef]
  21. Dear, J.W.; Street, J.M.; Bailey, M.A. Urinary exosomes: A reservoir for biomarker discovery and potential mediators of intrarenal signalling. Proteomics 2013, 13, 1572–1580. [Google Scholar] [CrossRef] [PubMed]
  22. Webber, J.; Clayton, A. How pure are your vesicles? J. Extracell Vesicles 2013, 2, 19861. [Google Scholar] [CrossRef] [PubMed]
  23. Moon, P.G.; You, S.; Lee, J.E.; Hwang, D.; Baek, M.C. Urinary exosomes and proteomics. Mass Spectrom Rev. 2011, 30, 1185–1202. [Google Scholar] [CrossRef]
  24. Wang, Z.; Hill, S.; Luther, J.M.; Hachey, D.L.; Schey, K.L. Proteomic analysis of urine exosomes by multidimensional protein identification technology (MudPIT). Proteomics 2012, 12, 329–338. [Google Scholar] [CrossRef] [Green Version]
  25. Wang, S.; Kojima, K.; Mobley, J.A.; West, A.B. Proteomic analysis of urinary extracellular vesicles reveal biomarkers for neurologic disease. EBio Med. 2019, 45, 351–361. [Google Scholar] [CrossRef] [PubMed] [Green Version]
  26. Thongboonkerd, V. Roles for Exosome in Various Kidney Diseases and Disorders. Front. Pharmacol. 2020. [Google Scholar] [CrossRef] [PubMed] [Green Version]
  27. Chevalier, F. Highlights on the capacities of “gel-based” proteomics. Proteome Sci. 2010, 8, 23. [Google Scholar] [CrossRef] [PubMed] [Green Version]
  28. Santoni, V.; Molloy, M.; Rabilloud, T. Membrane proteins and proteomics: Un amour impossible? Electrophoresis 2000, 21, 1054–1070. [Google Scholar] [CrossRef]
  29. Yoneten, K.K.; Kasap, M.; Akpinar, G.; Kanli, A.; Karaoz, E. Comparative Proteomics Analysis of Four Commonly Used Methods for Identification of Novel Plasma Membrane Proteins. J. Membr. Biol. 2019, 252, 587–608. [Google Scholar] [CrossRef]
  30. Trevisiol, S.; Ayoub, D.; Lesur, A.; Ancheva, L.; Gallien, S.; Domon, B. The use of proteases complementary to trypsin to probe isoforms and modifications. Proteomics 2016, 16, 715–728. [Google Scholar] [CrossRef]
  31. Pan, Y.; Mao, J.; Deng, Z.; Dong, M.; Bian, Y.; Ye, M.; Zou, H. The proteomic analysis improved by cleavage kinetics-based fractionation of tryptic peptides. Proteomics 2015, 15, 3613–3616. [Google Scholar] [CrossRef] [PubMed]
  32. Erozenci, L.A.; Böttger, F.; Bijnsdorp, I.V.; Jimenez, C.R. Urinary exosomal proteins as (pan-)cancer biomarkers: Insights from the proteome. FEBS Lett. 2019, 593, 1580–1597. [Google Scholar] [CrossRef] [PubMed] [Green Version]
  33. Lonnerholm, G.; Ridderstrale, Y. Intracellular distribution of carbonic anhydrase in the rat kidney. Kidney Int. 1980, 17, 162–174. [Google Scholar] [CrossRef] [Green Version]
  34. Xu, J.; Barone, S.; Brooks, M.B.; Soleimani, M. Double knockout of carbonic anhydrase II (CAII) and Na(+)-Cl(-) cotransporter (NCC) causes salt wasting and volume depletion. Cell Physiol. Biochem. 2013, 32, 173–183. [Google Scholar] [CrossRef] [PubMed]
  35. Wagner, C.A.; Imenez Silva, P.H.; Bourgeois, S. Molecular Pathophysiology of Acid-Base Disorders. Semin. Nephrol. 2019, 39, 340–352. [Google Scholar] [CrossRef] [Green Version]
  36. Mazaheri, M.; Assadi, F.; Sadeghi-Bojd, S. Adjunctive acetazolamide therapy for the treatment of Bartter syndrome. Int. Urol. Nephrol. 2020, 52, 121–128. [Google Scholar] [CrossRef]
  37. Katoh, M. Functional proteomics, human genetics and cancer biology of GIPC family members. Exp. Mol. Med. 2013, 7, 45. [Google Scholar] [CrossRef] [Green Version]
  38. Bhattacharya, S.; Pal, K.; Sharma, A.K.; Dutta, S.K.; Lau, J.S.; Yan, I.K.; Wang, E.; Elkhanany, A.; Alkharfy, K.M.; Sanyal, A.; et al. GAIP interacting protein C-terminus regulates autophagy and exosome biogenesis of pancreatic cancer through metabolic pathways. PLoS ONE 2014, 9, e114409. [Google Scholar] [CrossRef]
  39. Lou, X.; McQuistan, T.; Orlando, R.A.; Farquhar, M.G.J. GAIP, GIPC and Galphai3 are concentrated in endocytic compartments of proximal tubule cells: Putative role in regulating megalin’s function. Am. Soc. Nephro. 2002, 13, 918–927. [Google Scholar]
  40. Harris, A.N.; Grimm, P.R.; Lee, H.W.; Delpire, E.; Fang, L.; Verlander, J.W.; Welling, P.A.; Weiner, I.D. Mechanism of Hyperkalemia-Induced Metabolic Acidosis. J. Am. Soc. Nephrol. 2018, 29, 1411–1425. [Google Scholar] [CrossRef]
  41. Frische, S.; Chambrey, R.; Trepiccione, F.; Zamani, R.; Marcussen, N.; Alexander, R.T.; Skjødt, K.; Svenningsen, P.; Dimke, H. H+-ATPase B1 subunit localizes to thick ascending limb and distal convoluted tubule of rodent and human kidney. Am. J. Physiol. Renal Physiol. 2018, 315, F429–F444. [Google Scholar] [CrossRef] [PubMed] [Green Version]
  42. Watanabe, T. Improving outcomes for patients with distal renal tubular acidosis: Recent advances and challenges ahead. Pediatric Health Med. Ther. 2018, 9, 181–190. [Google Scholar] [CrossRef] [PubMed] [Green Version]
  43. Naveen, P.S.; Srikanth, L.; Venkatesh, K.; Sarma, P.V.; Sridhar, N.; Krishnakishore, C.; Sandeep, Y.; Manjusha, Y.; Sivakumar, V. Distal renal tubular acidosis with nerve deafness secondary to ATP6B1 gene mutation. Saudi J. Kidney Dis. Transpl. 2015, 26, 119–121. [Google Scholar]
  44. Norgett, E.E.; Golder, Z.J.; Lorente-Cánovas, B.; Ingham, N.; Steel, K.P.; Karet Frank, F.E. Atp6v0a4 knockout mouse is a model of distal renal tubular acidosis with hearing loss, with additional extrarenal phenotype. Proc. Natl. Acad. Sci. USA 2012, 109, 13775–13780. [Google Scholar] [CrossRef] [PubMed] [Green Version]
  45. Dathe, C.; Daigeler, A.L.; Seifert, W.; Jankowski, V.; Mrowka, R.; Kalis, R.; Wanker, E.; Mutig, K.; Bachmann, S.; Paliege, A. Annexin A2 mediates apical trafficking of renal Na+-K+-2Cl cotransporter. J. Biol. Chem. 2014, 289, 9983–9997. [Google Scholar] [CrossRef] [Green Version]
  46. Sabaratnam, R.; Geertsen, L.; Skjødt, K.; Højlund, K.; Dimke, H.; Lund, L.; Svenningsen, P. In human nephrectomy specimens, the kidney level of tubular transport proteins does not correlate with their abundance in urinary extracellular vesicles. Am. J. Physiol. Renal Physiol. 2019, 317, F560–F571. [Google Scholar] [CrossRef]
  47. Blijdorp, C.J.; Hoorn, E.J. Urinary extracellular vesicles: The mothership connection. Am. J. Physiol. Renal Physiol. 2019, 317, F648–F649. [Google Scholar] [CrossRef]
Figure 1. uEV protein profile by two-dimensional (2D) diagonal electrophoresis. Protein separation of uEV from Gitelman Syndrome (GS), Bartter type 1 (BS1), Bartter type 2 (BS2) and Bartter type 3 (BS3) patients by 16-BAC-PAGE/SDS-PAGE and Blue Coomassie staining. In the right panels, the selected spots from BS2 (upper) and BS3 (lower) are highlighted by red rectangles.
Proteomes 08 00009 g001
Figure 2. Subcellular localization of uEV proteins. The pie chart represents the cellular localization of the proteins identified in the 16-BAC/SDS-PAGE spots of BS2 and BS3 patient uEV. On the right, the percentages of integral (single-pass and multi-pass), lipid-anchor and peripheral membrane proteins are shown.
Proteomes 08 00009 g002
Figure 3. Venn diagram. Comparison of proteins identified in the partial proteome of uEV from BS2 and BS3 patients and the whole proteome of uEV from healthy subjects [24] and Parkinson’s disease patients and healthy controls [25].
Proteomes 08 00009 g003
Figure 4. uEV content of the proteins of interest. (a) Immunoblotting of GIPC2, CA2, VATB1 and ANXA2 in uEV fraction of GS, BS1, BS2 and BS3 patients (two representative cases for each group are shown). Equal amounts of proteins were loaded on all lanes of each gel. (b) Densitometric analysis of protein signals normalized by mg of uEV proteins. Scatter plot of all patient data. Statistical analysis: red asterisks represent Kruskal-Wallis multivariate analysis, * p-value < 0.05; *** p-value < 0.001; **** p-value < 0.0001; black asterisks represent Mann-Whitney t-test: * p-value < 0.05; ** p-value < 0.01; *** p-value < 0.001.
Proteomes 08 00009 g004
Figure 5. Expression pattern of the differential proteins. Heatmap representation of the band intensities (arbitrary units as in Figure 4) of the proteins of interest expressed as single values for each patient (https://biit.cs.ut.ee/clustvis/). We only included patients for whom we had the data for all the proteins considered.
Proteomes 08 00009 g005
Table 1. Genetic data of patients.
Patient CodeAgeSexGene AffectedMutation at DNA Level *Changes at protein LevelMutation Type16-BACWB
Gitelman Syndrome
3BR047MSLC12A3c.[2981G>A]p.[Cys994Tyr]M X
c.[506-?_741+?del]p.[Val169_Gln247del]LD
5BL9416MSLC12A3c.[2029G>A]p.[Val677Met]MX
c.[506-?_741+?del]p.[Val169_Gln247del]LD
5BT065MSLC12A3c.[1924C>G]p.[Arg642Gly]M X
c.[2981G>A]p.[Cys994Tyr]M
5CM9714MSLC12A3c.[2981G>A]p.[Cys994Tyr]M X
c.[2981G>A]p.[Cys994Tyr]M
5CE9417FSLC12A3c.[1844C>T]p.[Ser615Leu]MXX
c.[1925G>A]p.[Arg642His]M
5DV8526MSLC12A3c.[2899A>G]p.[Arg967Gly]MXX
c.[2899A>G]p.[Arg967Gly]M
5GE01^10MSLC12A3c.[1196_1202dup7bp]p.[Ser402*]N X
c.[1424C>G]p.[Ser475Cys]M
5GF01^10MSLC12A3c.[1196_1202dup7bp]p.[Ser402*]N X
c.[1424C>G]p.[Ser475Cys]M
5MR8625FSLC12A3c.[2560delC];p.[Leu854fs]FX
c.[1180+1G>T]p.[Gly394fs]F
5RT9418MSLC12A3c.[238dupCC]p.[Arg80fs]F X
c.[2952-?_3090+?del]p.[Ile984_Gln1030del]LD
Bartter Type 1 Syndrome
1PD9021MSLC12A1c.[347G>A]p.[Arg116His]MXX
c.[1954G>A]p.[Gly652Ser]M
1TR029MSLC12A1c.[551T>A]p.[Leu184Gln]MXX
c.[611T>C]p.[Val204Ala]M
3GG074MSLC12A1c.[730dupG]p.[Ala244fs]FXX
c.[1432G>A]p.[Gly478Arg]M
6BA095FSLC12A1c.[572T>A]p.[Ile191Asn]MXX
c.[1493C>T]p.[Ala498Val]M
Bartter Type 2 Syndrome
2BG038FKCNJ1c.[256A>G]p.[Thr86Ala]M X
c.[=]p.[=]-/-
2ED043MKCNJ1c.[133A>G]p.[Lys45Glu]MXX
c.[?]p.[Glu334fs]F
2GA04^6MKCNJ1c.[572C>T]p.[Thr191Ile]MXX
c.[572C>T]p.[Thr191Ile]M
2GN03^7MKCNJ1c.[572C>T]p.[Thr191Ile]MXX
c.[572C>T]p.[Thr191Ile]M
Bartter Type 3 Syndrome
3BD8229MCLCNKBc.[371C>T]p.[Pro124Leu]MXX
c.[371C>T]p.[Pro124Leu]M
3BS074FCLCNKBc.[725C>A]p.[Ala242Glu]M X
c.[1-?_2064+?del]p.[0]LD
3DL9120FCLCNKBc.[1-?_2064+?del]p.[0]LDXX
c.[1-?_2064+?del]p.[0]LD
3SS8229MCLCNKBc.[1-?_2064+?del]p.[0]LDXX
c.[1-?_2064+?del]p.[0]LD
5BE9912FCLCNKBc.[1101G>A]p.[Trp367*]NXX
c.[1?_2064+?del]p.[0]LD
Notes: Patient code column: ^: indicates sibling; Unclassified = mutations in Gitelman and Bartter syndrome genes not identified. Mutation at DNA level column: *: genetic variants are shown for the two alleles; [=]: indicates undetected mutations; del: deletion; dup: duplication; [0]: putative null protein production because of complete deletion of the gene. Mutation Type column: M: missense mutation; N: nonsense mutation (stop); F: frameshift mutation; LD: large deletion. The samples used for 16-BAC/SDS-PAGE (16-BAC column) and for western blotting (WB column) analysis are marked with an “X” in the last two columns.
Table 2. List of the proteins identified in the differential spots of 16-BAC/SDS-PAGE of uEV pools of BS2 and BS3 patients.
Uniprot IDProtein NameFunctSub LocMbr InterKidney Expression Score
Proteins Identified Only in BS2 Spots
P41181Aquaporin-2transpmbrM-Pmedium
P08183P-glycoprotein 1transpmbrM-Plow
Q8IZF0Na-leak channel non-selective protein *transpmbrM-Plow
Q9NZM6Polycystin-L2 *transpmbrM-Pmedium
Q9UBD6Ammonium transporter Rh type CtranspmbrM-Pmedium
P55017Na-Cl cotransporter (NCC)transpmbrM-Pmedium
Q8NG04Solute carrier family 26 member 10 *transpmbrM-PNA
P58743Prestin *transpmbrM-PNA
Q9C0H2Protein tweety homolog 3transpmbrM-Pmedium
Q9Y2B5VPS9 domain-containing protein 1transpcyt medium
P60709Actin, cytoplasmic 1structcyt medium
Q9H6S3EPS8-like protein 2structcyt high
Q96T17MAP7 domain-containing protein 2 *structnuc low
Q96QZ7Atrophin-1-interacting protein 3structmbrPermedium
Q969L2Protein MAL2structmbrM-Plow
Q92859NeogeninrecmbrS-Plow
P14384Carboxypeptidase MprotmbrL-Ahigh
P08246Neutrophil elastaseprotcyt NA
P60900Proteasome subunit α type-6protcyt medium
K7EIQ3ZNF561 antisense gene protein 1 *NANA NA
Q9H579Protein MROH8 *NAnuc low
P0CG20Proline-rich protein 35 *NANA NA
O94933SLIT and NTRK-like protein 3 *NAmbrS-PNA
Q9Y4F4Crescerin-1NAcyt medium
O953366-phosphogluconolactonaseenzcyt high
O95573Arachidonate-CoA ligaseenzmbrS-Phigh
Q9BUT13-hydroxybutyrate DH type 2enzcyt high
P00918Carbonic anhydrase 2enzmbrL-Ahigh
Q12873ATP-dependent helicase CHD3enznuc low
Q13237cGMP-dependent protein kinase 2enzmbrL-Amedium
Q9BYJ1Epidermis-type lipoxygenase 3 *enzcyt NA
Q96RQ9l-amino-acid oxidase *enzorg NA
Q8IY17Neuropathy target esterase *enzmbrS-Phigh
P60174Triosephosphate isomeraseenzcyt medium
P02768Serum albuminbindsecr NA
P05090Apolipoprotein Dbindsecr high
P05026Na/K-transporting ATPase sub β-1bindmbrS-Pmedium
Q16854Deoxyguanosine kinase, mitochondrial *bindorg medium
Q0VDD8Dynein heavy chain 14, axonemal *bindcyt low
P01133Pro-epidermal growth factorbindmbrS-PNA
O75955Flotillin-1bindmbrPerhigh
Q86YZ3Hornerinbindcyt NA
Q8N1G4Leu-rich repeat-containing protein 47bindcyt high
Q8WV92MIT domain-containing protein 1bindmbrPerhigh
P15941Mucin-1bindmbrS-Pmedium
Q8WXI7Mucin-16bindmbrS-PNA
P49321Nuclear autoantigenic sperm proteinbindcyt low
O60422One cut domain family member 3 *bindnuc NA
Q9Y5G0Protocadherin γ-B5bindmbrS-PNA
P05164Myeloperoxidasebindorg NA
Q01970Phospholipase C-β-3bindmbrPerlow
P6219126S protease regulatory sub 4bindcyt nd
Q8NFJ5Retinoic acid-induced protein 3bindmbrM-Plow
P6226340S ribosomal protein S14bindnuc medium
P02743Serum amyloid P-componentbindsecr NA
P12931Proto-oncogene c-SrcbindmbrPermedium
Q16851UDP-glucose pyrophosphorylasebindcyt low
Q15904V-type proton ATPase subunit S1bindmbrS-Phigh
Q9UN37Vacuolar protein sorting-associated protein 4AbindmbrPermedium
O75351Vacuolar protein sorting-associated protein 4BbindmbrPermedium
Q86YA3protein ZGRF1 *bindmbrS-Pmedium
Q8IYB9Zinc finger protein 595 *bindnuc NA
B4DX44Zinc finger protein 736 *bindnuc medium
Proteins Identified in Both BS2 and BS3 Spots
P53990IST1 homolog (hIST1)bindcyt high
P21281V-ATPase subunit B 2transpmbrPerhigh
O43508TNF ligand superfamily member 12 *recmbrS-Pmedium
P01008Antithrombin-IIIprot inhsecr medium
P01042Kininogen-1prot inhsecr high
P16444Dipeptidase 1protmbrL-Ahigh
P55786Puromycin-sensitive aminopeptidaseprotcyt medium
Q9Y6R7IgGFc-binding proteinnasecr NA
P07948Tyr-protein kinase LynenzmbrPerND
P33908Mannosidase α class 1A member 1enzmbrS-Phigh
P50995Annexin A11bindcyt medium
Q01518Adenylyl cyclase-associated protein 1bindmbrPermedium
O75131Copine-3bindnuc low
P68104Elongation factor 1-α 1bindcyt medium
P02675Fibrinogen β chainbindsecr NA
Q99816Tumor susceptibility gene 101 proteinbindmbrPerhigh
P0CG47Polyubiquitin-Bbindcyt medium
P42685FYN-related kinasereccyt medium
P19440γ-glutamyltransferase 1enzmbrS-Phigh
Proteins Identified Only in BS3 Spots
P01009α-1-antitrypsinprot inhsecr NA
P01011α-1-antichymotrypsinprot inhsecr low
P05154Serpin A5prot inhsecr NA
P26038MoesinstructmbrPermedium
Q8N957ANKF1 *nanuc NA
P04406Glyceraldehyde-3-phosphate DHenzcyt medium
P80723Brain acid soluble protein 1bindmbrL-AND
Q8TF65PDZ domain-containing protein GIPC2bindcyt high
P15313V-ATPase subunit B 1transpmbrPerhigh
P04075Fructose-bisphosphate aldolase Astructcyt medium
P05062Fructose-bisphosphate aldolase Bstructcyt high
Q9UHR4BAI1-associated protein 2-like protein 1structcyt low
Q9UJU6Drebrin-like proteinstructcyt medium
P15311EzrinstructmbrPerhigh
Q5S007Leu-rich repeat Ser/Thr-protein kinase 2structcyt high
P22105Tenascin-Xstructsecr NA
P28223Serotonin receptor 2A *recmbrM-PNA
P46098Serotonin receptor 3A *recmbrM-PNA
P15328Folate receptor αrecmbrL-ANA
Q9NQ84Glycerol kinaserecmbrM-Phigh
Q08380Galectin-3-binding proteinrecsecr low
O14745Na/H exchanger regulatory factor 1recmbrPerhigh
Q6TCH4Membrane progesterone P4 receptor δ *recmbrM-PNA
O43653Prostate stem cell antigenrecmbrL-Alow
Q6UXT9Protein ABHD15 *prot inhsecr medium
P05543Thyroxine-binding globulinprot inhsecr NA
P28838Cytosol aminopeptidaseprotcyt high
Q9Y646Carboxypeptidase Qprotorg low
P81605Dermcidinprotsecr NA
Q9UHL4Dipeptidyl peptidase 2protorg medium
Q6P179Endoplasmic reticulum aminopeptidase 2protmbrS-Pmedium
P12955Xaa-Pro dipeptidaseprotcyt high
Q8IYX3Coiled-coil domain-containing protein 116 *nacyt NA
Q8NCU4Coiled-coil domain-containing protein 191 *naorg medium
Q8WW52Protein FAM151AnambrS-Phigh
A8MUH7PDZ domain-containing 1 pseudogene 1 *naNA NA
Q9BW04Specifically androgen-regulated gene proteinnacyt medium
P11766Alcohol DH class-3enzcyt high
P00352Retinal DH 1enzcyt low
P49419α-aminoadipic semialdehyde DHenzcyt high
Q9H2A2Aldehyde DH family 8 member A1enzcyt medium
P15121Aldose reductaseenzcyt NA
Q92485ASM-like phosphodiesterase 3benzsec NA
P16278β-galactosidaseenzorg medium
Q00796Sorbitol DHenzmbrPermedium
Q9H9B1Eu-HMTase1 *enznuc NA
Q6UWR7GPC-Cpde ENPP6enzmbrL-Amedium
P06744Glucose-6-phosphate isomeraseenzcyt medium
P32189Glycerol kinaseenzmbrPermedium
P15309Prostatic acid phosphataseenzmbrS-PNA
O43175d-3-phosphoglycerate DHenzcyt high
Q6PHR2Ser/Thr-protein kinase ULK3enzcyt high
Q96BJ3AIDA proteinbindcyt low
P20073Annexin A7bindnuc medium
P06727Apolipoprot A-IVbindsecr medium
P02649Apolipoprot Ebindsecr low
Q9UQB8BAI-associated protein 2bindmbrNAhigh
Q9NRL2BAZ protein 1A *bindnuc low
Q8TDL5BPI fold-containing family B member 1bindsecr NA
P55286Cadherin-8bindmbrS-PNA
P08571Monocyte differentiation antigen CD14bindmbrL-ANA
P10909Clusterinbindsecr NA
Q14117Dihydropyrimidinasebindcyt high
Q96JB3Hypermethylated in cancer 2 protein (Hic2) *bindnuc low
P14618Pyruvate kinase PKMbindcyt medium
P30613Pyruvate kinase PKLRbindcyt high
Q96JY0Protein maelstrom homolog *bindcyt NA
Q86W25Ntd-binding oligomerization domain protein 14 *bindNA NA
Q14596Next to BRCA1 gene 1 protein *bindcyt medium
O94818Nucleolar protein 4 *bindnuc NA
Q6V1P9Protocadherin-23 *bindmbrS-PNA
Q12913Receptor-type Tyr-protein phosphatase ηbindmbrS-Plow
P35241RadixinbindmbrPerhigh
Q9UPX8Cortactin-binding protein 1bindmbrNAlow
O95343Homeobox protein SIX3 *bindnuc NA
O60284Suppression of tumorigenicity 18 protein *bindnucPerhigh
Q9Y6E0Ser/Thr-protein kinase 24bindcyt medium
Q9BXI6TBC1 domain family member 10Abindcyt high
Q7Z2Z1Treslin *bindnuc NA
O75674TOM1-like protein 1bindmbrPermedium
O60784Target of Myb protein 1bindmbrNAmedium
P59923Zinc finger protein 445 *bindnuc NA
Q92629δ-sarcoglycan *NAmbrS-PNA
Q9Y6Q2Stonin-1 *NAcyt medium
Q8N1K5Protein THEMIS *NAcyt NA
Funct, function; Sub Loc, subcellular location; Mbr Int, membrane interaction type; Kidney expression Score, protein expression score in kidney, according to ProteinAtlas; NA, not available; ND, not detected; bind, binding protein; transp, transport protein; enz, enzyme; struct, structural protein; prot, protease; prot inh, protease inhibitor; rec, receptor; mbr, membrane; cyt, cytoplasm; org, organelle; nuc, nucleus; secr, secreted; M-P, multi-pass transmembrane protein; S-P, single-pass transmembrane protein; Per, peripheral membrane protein; L-A, lipid- anchor membrane protein; DH, dehydrogenase; Ser, Serine; Thr, Threonin; Tyr, Tyrosin; Leu, Leucin; Na, Sodium; K, Potassium; H, proton; BAI, Brain-specific angiogenesis inhibitor; TNF, Tumor necrosis factor; EPS8, Epidermal growth factor receptor pathway substrate; GPC-Cpde, Glycerophosphocholine cholinephosphodiesterase; ENPP6, Ectonucleotide pyrophosphatase/phosphodiesterase family member 6; ABHD15, Alpha/beta hydrolase domain-containing protein 15; MROH8, Maestro heat-like repeat-containing protein family member 8; ANKF1, Ankyrin repeat and fibronectin type-III domain-containing protein 1; ASM, Acid sphingomyelinase; Eu-HMTase1, Euchromatic histone-lysine N-methyltransferase 1; AIDA, Axin interactor dorsalization-associated protein; BAZ, Bromodomain adjacent to zinc finger domain. Proteins * indicate the 42 proteins identified in our data set and not in other uEV datasets [24,25].

