Granulocyte-Colony-Stimulating Factor Alters the Proteomic Landscape of the Ventral Tegmental Area

 , and
, and
Abstract
1. Introduction
2. Materials and Methods
2.1. Animals and Drug Treatments
2.2. Protein Preparation
2.3. Tandem Mass Tag (TMT) Labeling
2.4. High-pH Reversed-Phase C18 Peptide Fractionation
2.5. SPS-MS3 TMT Data Acquisition on an Orbitrap Fusion Tribrid Mass Spectrometer
2.6. Protein Identification and Quantification
2.7. Mass Spec Data Analysis
2.8. Western Blot Analysis
3. Results
3.1. Experimental Design
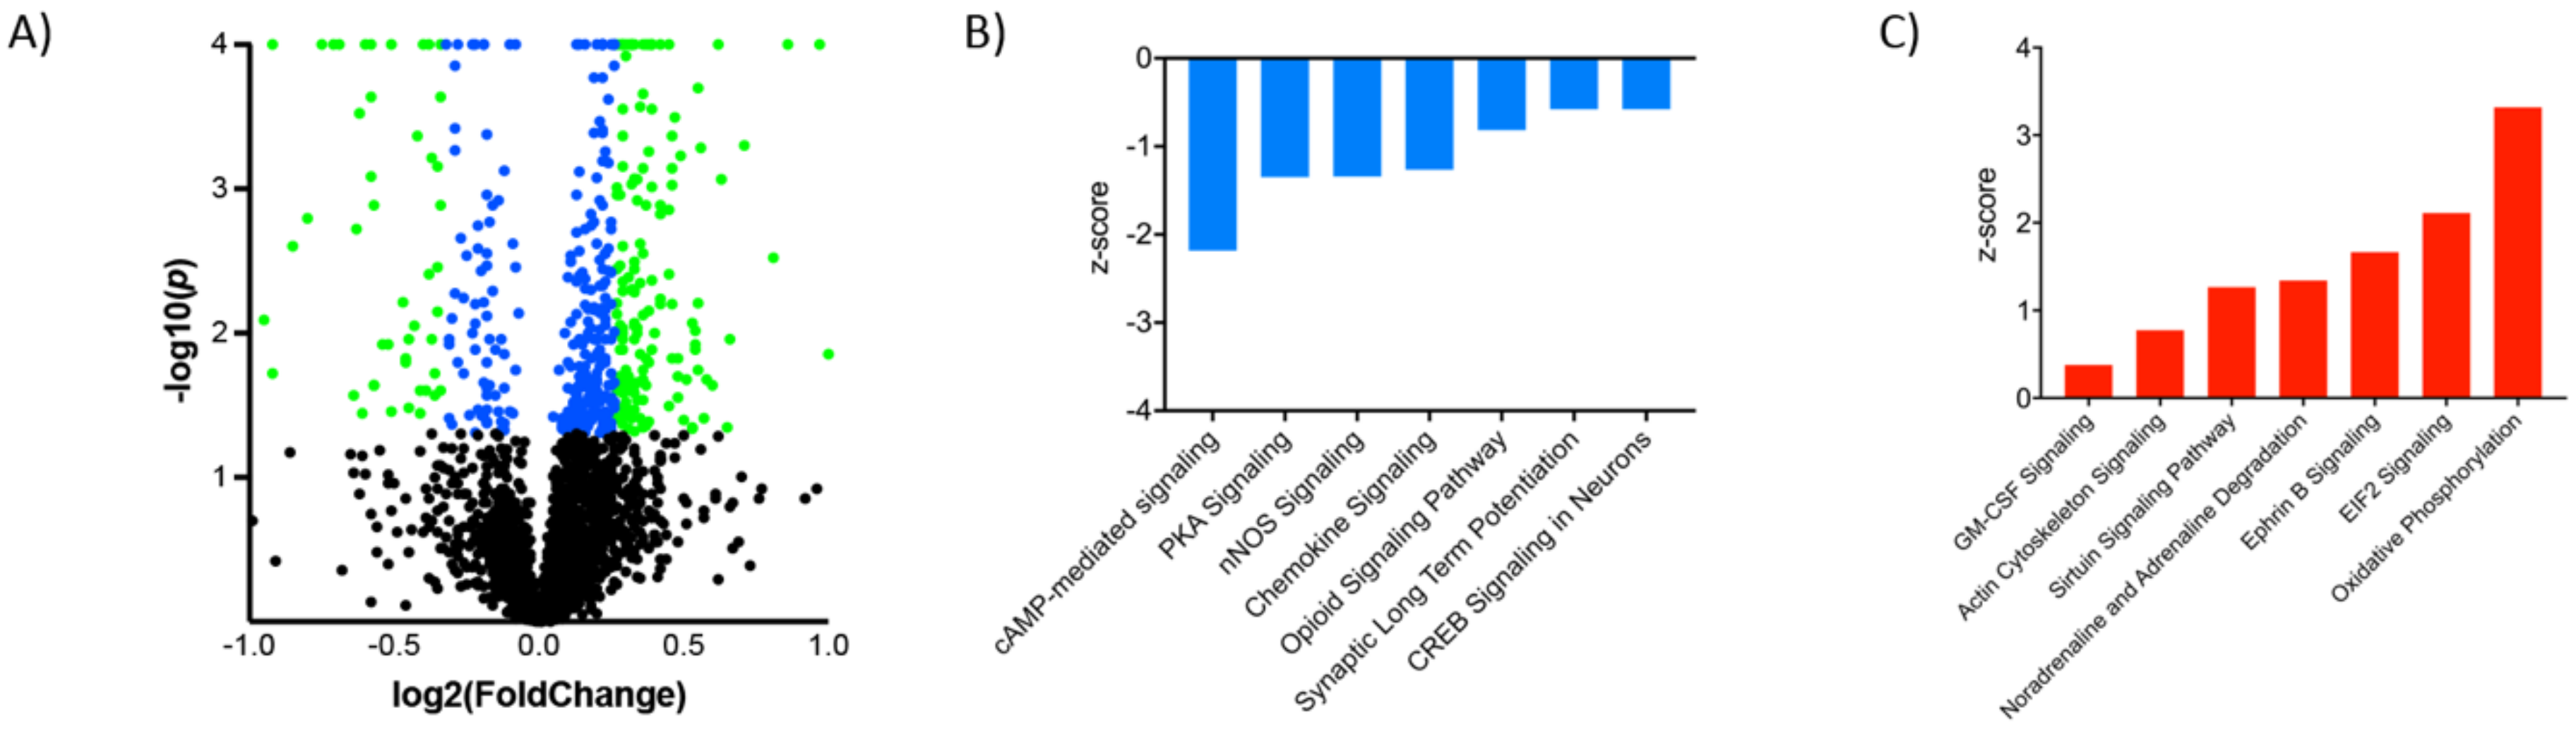
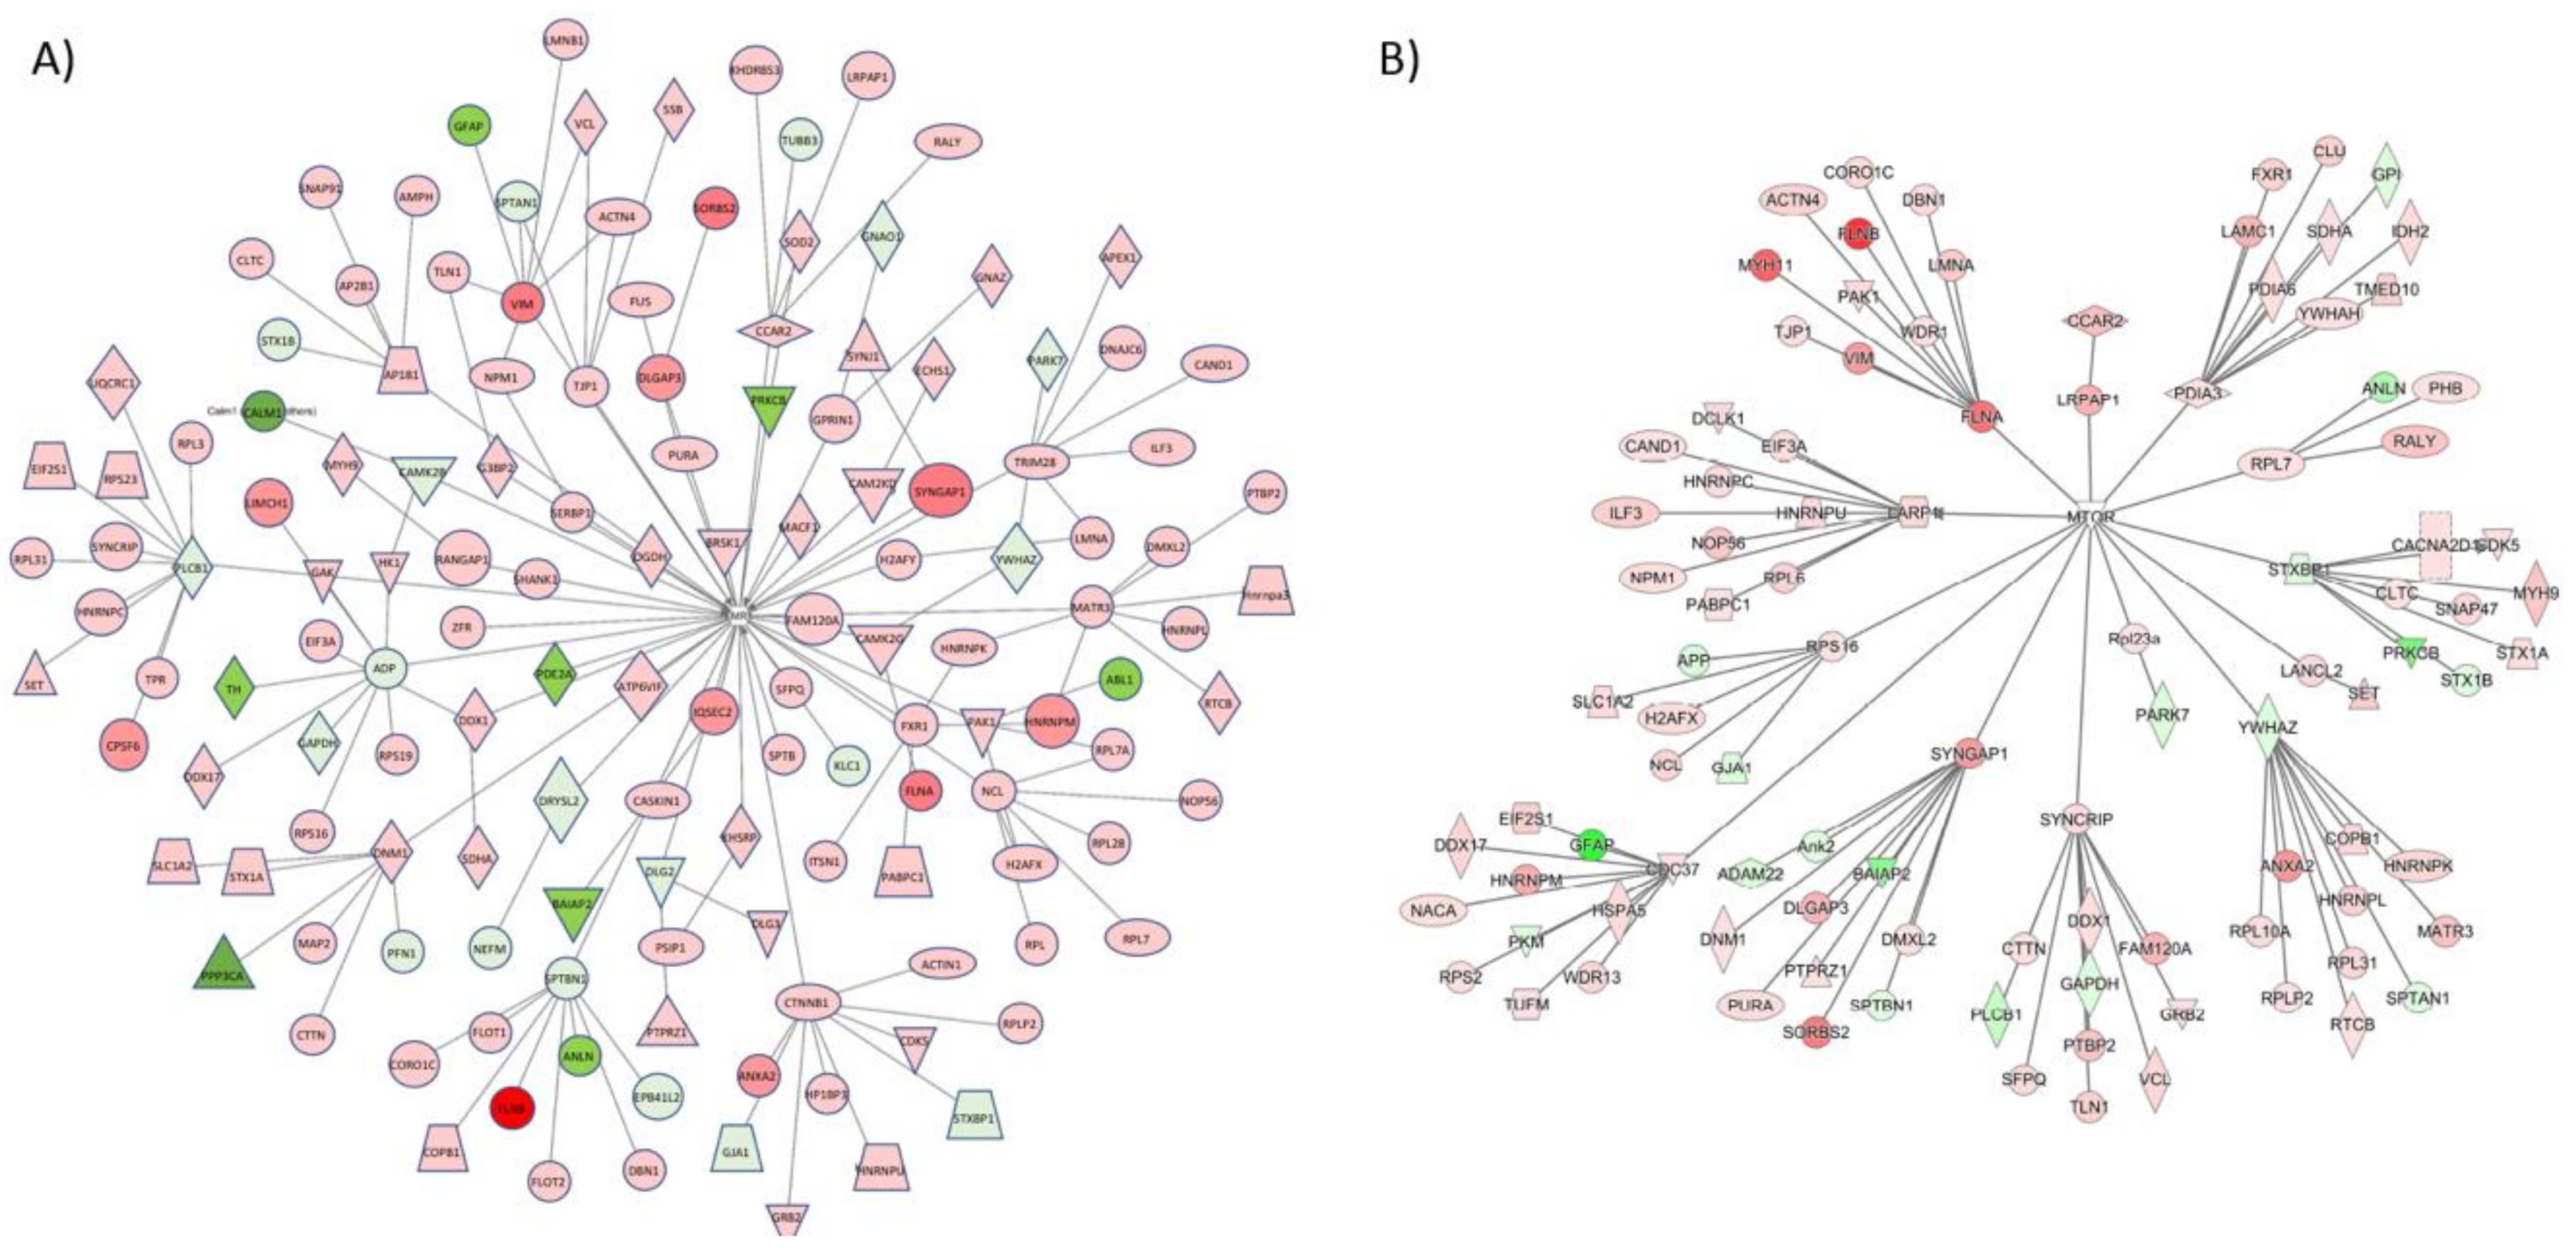
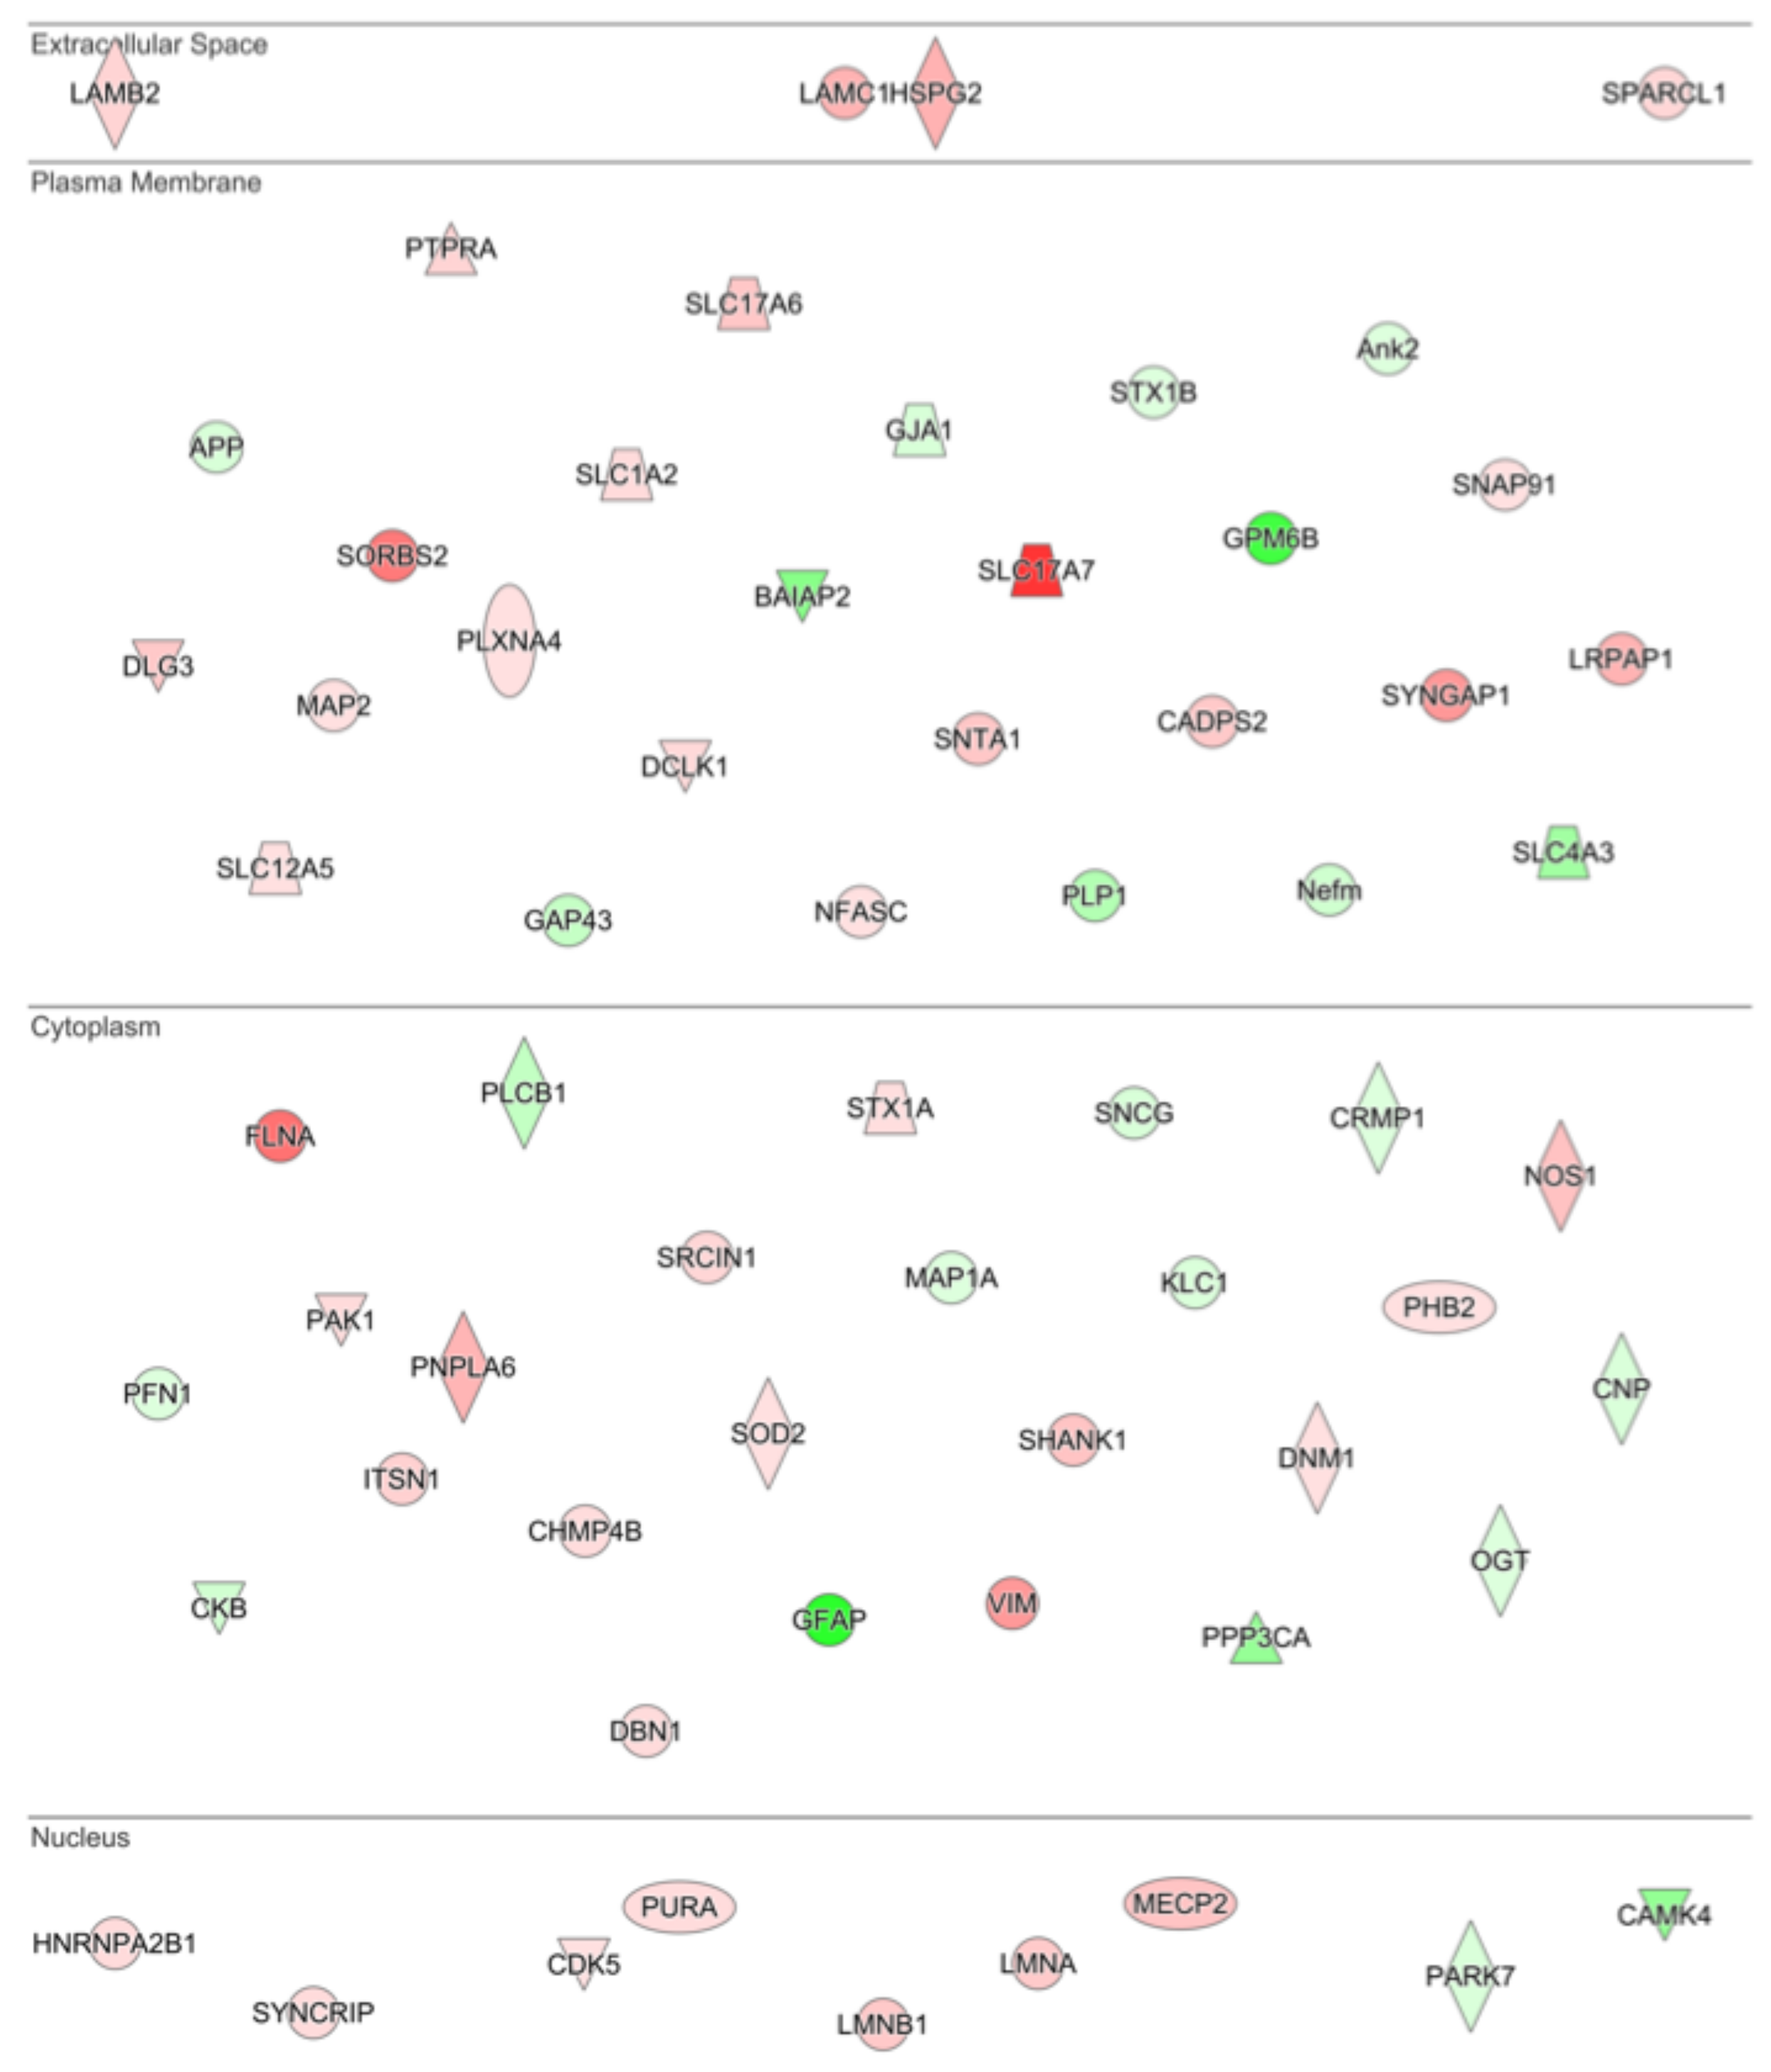
3.2. Proteomic Effects of G-CSF in the VTA
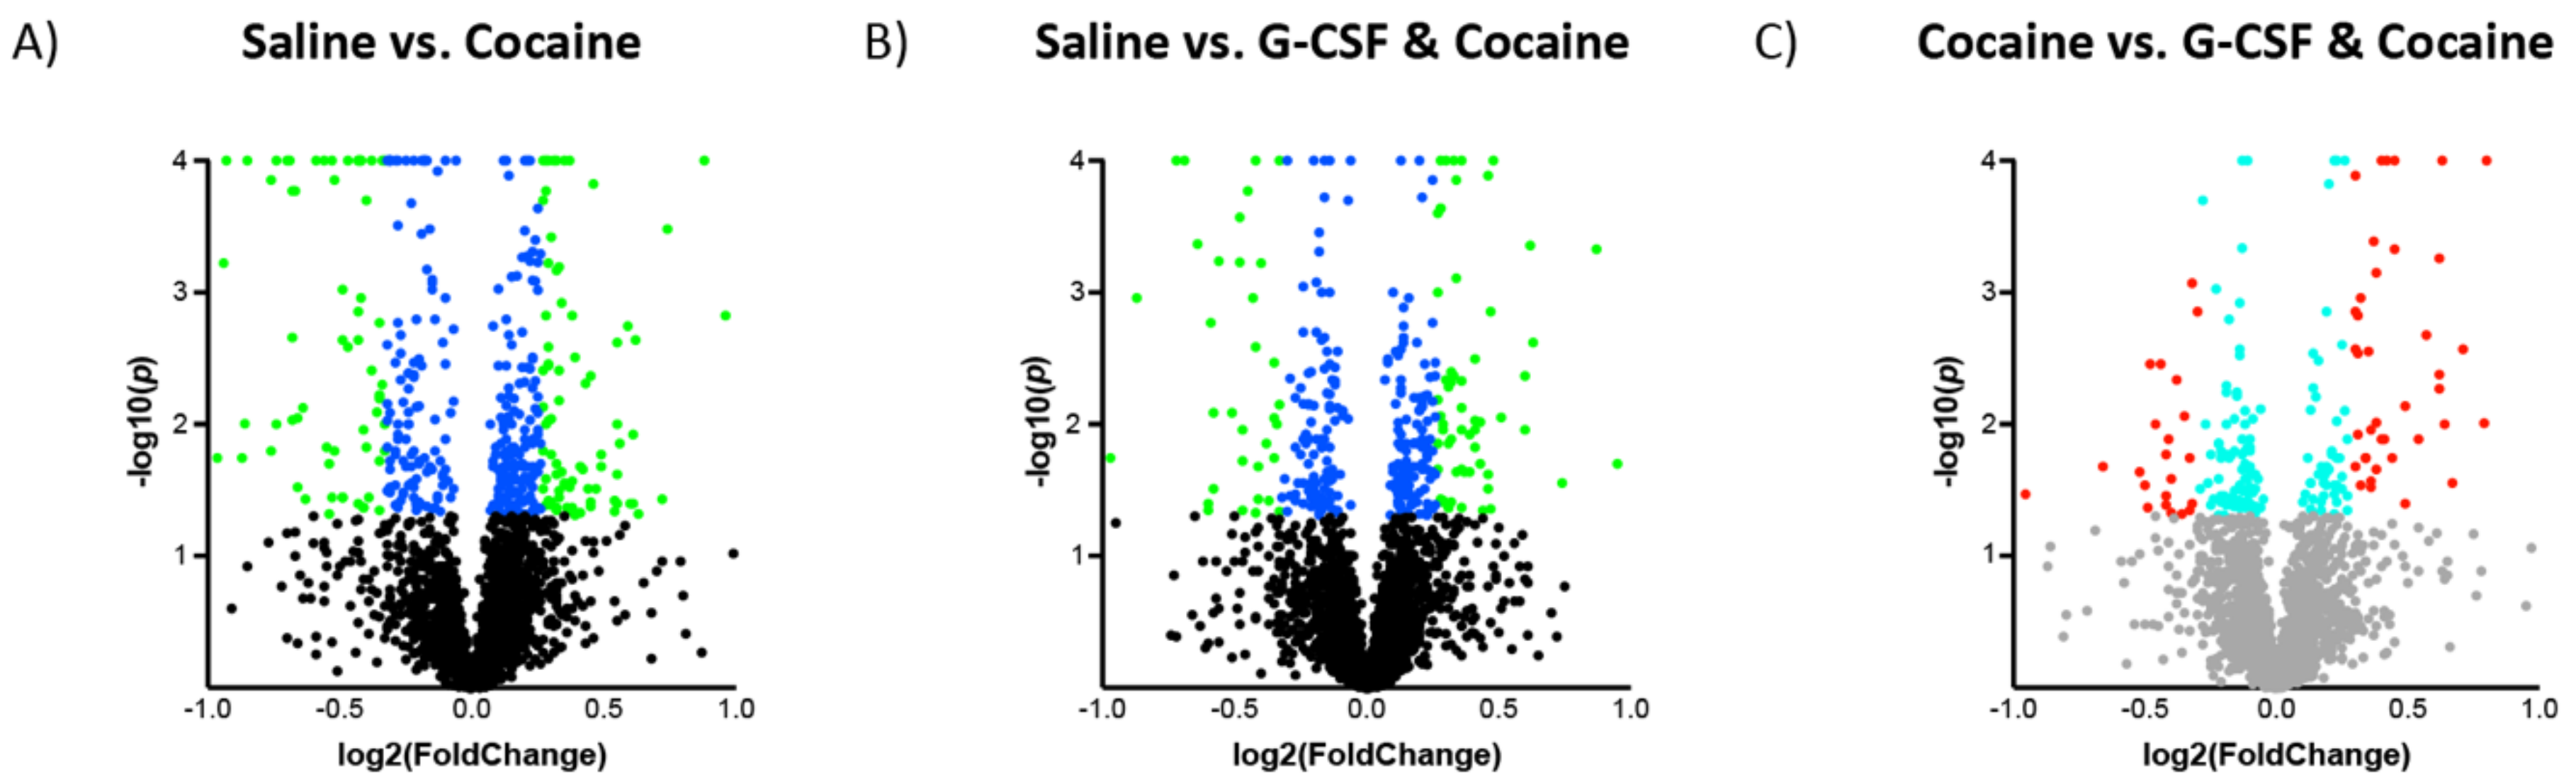
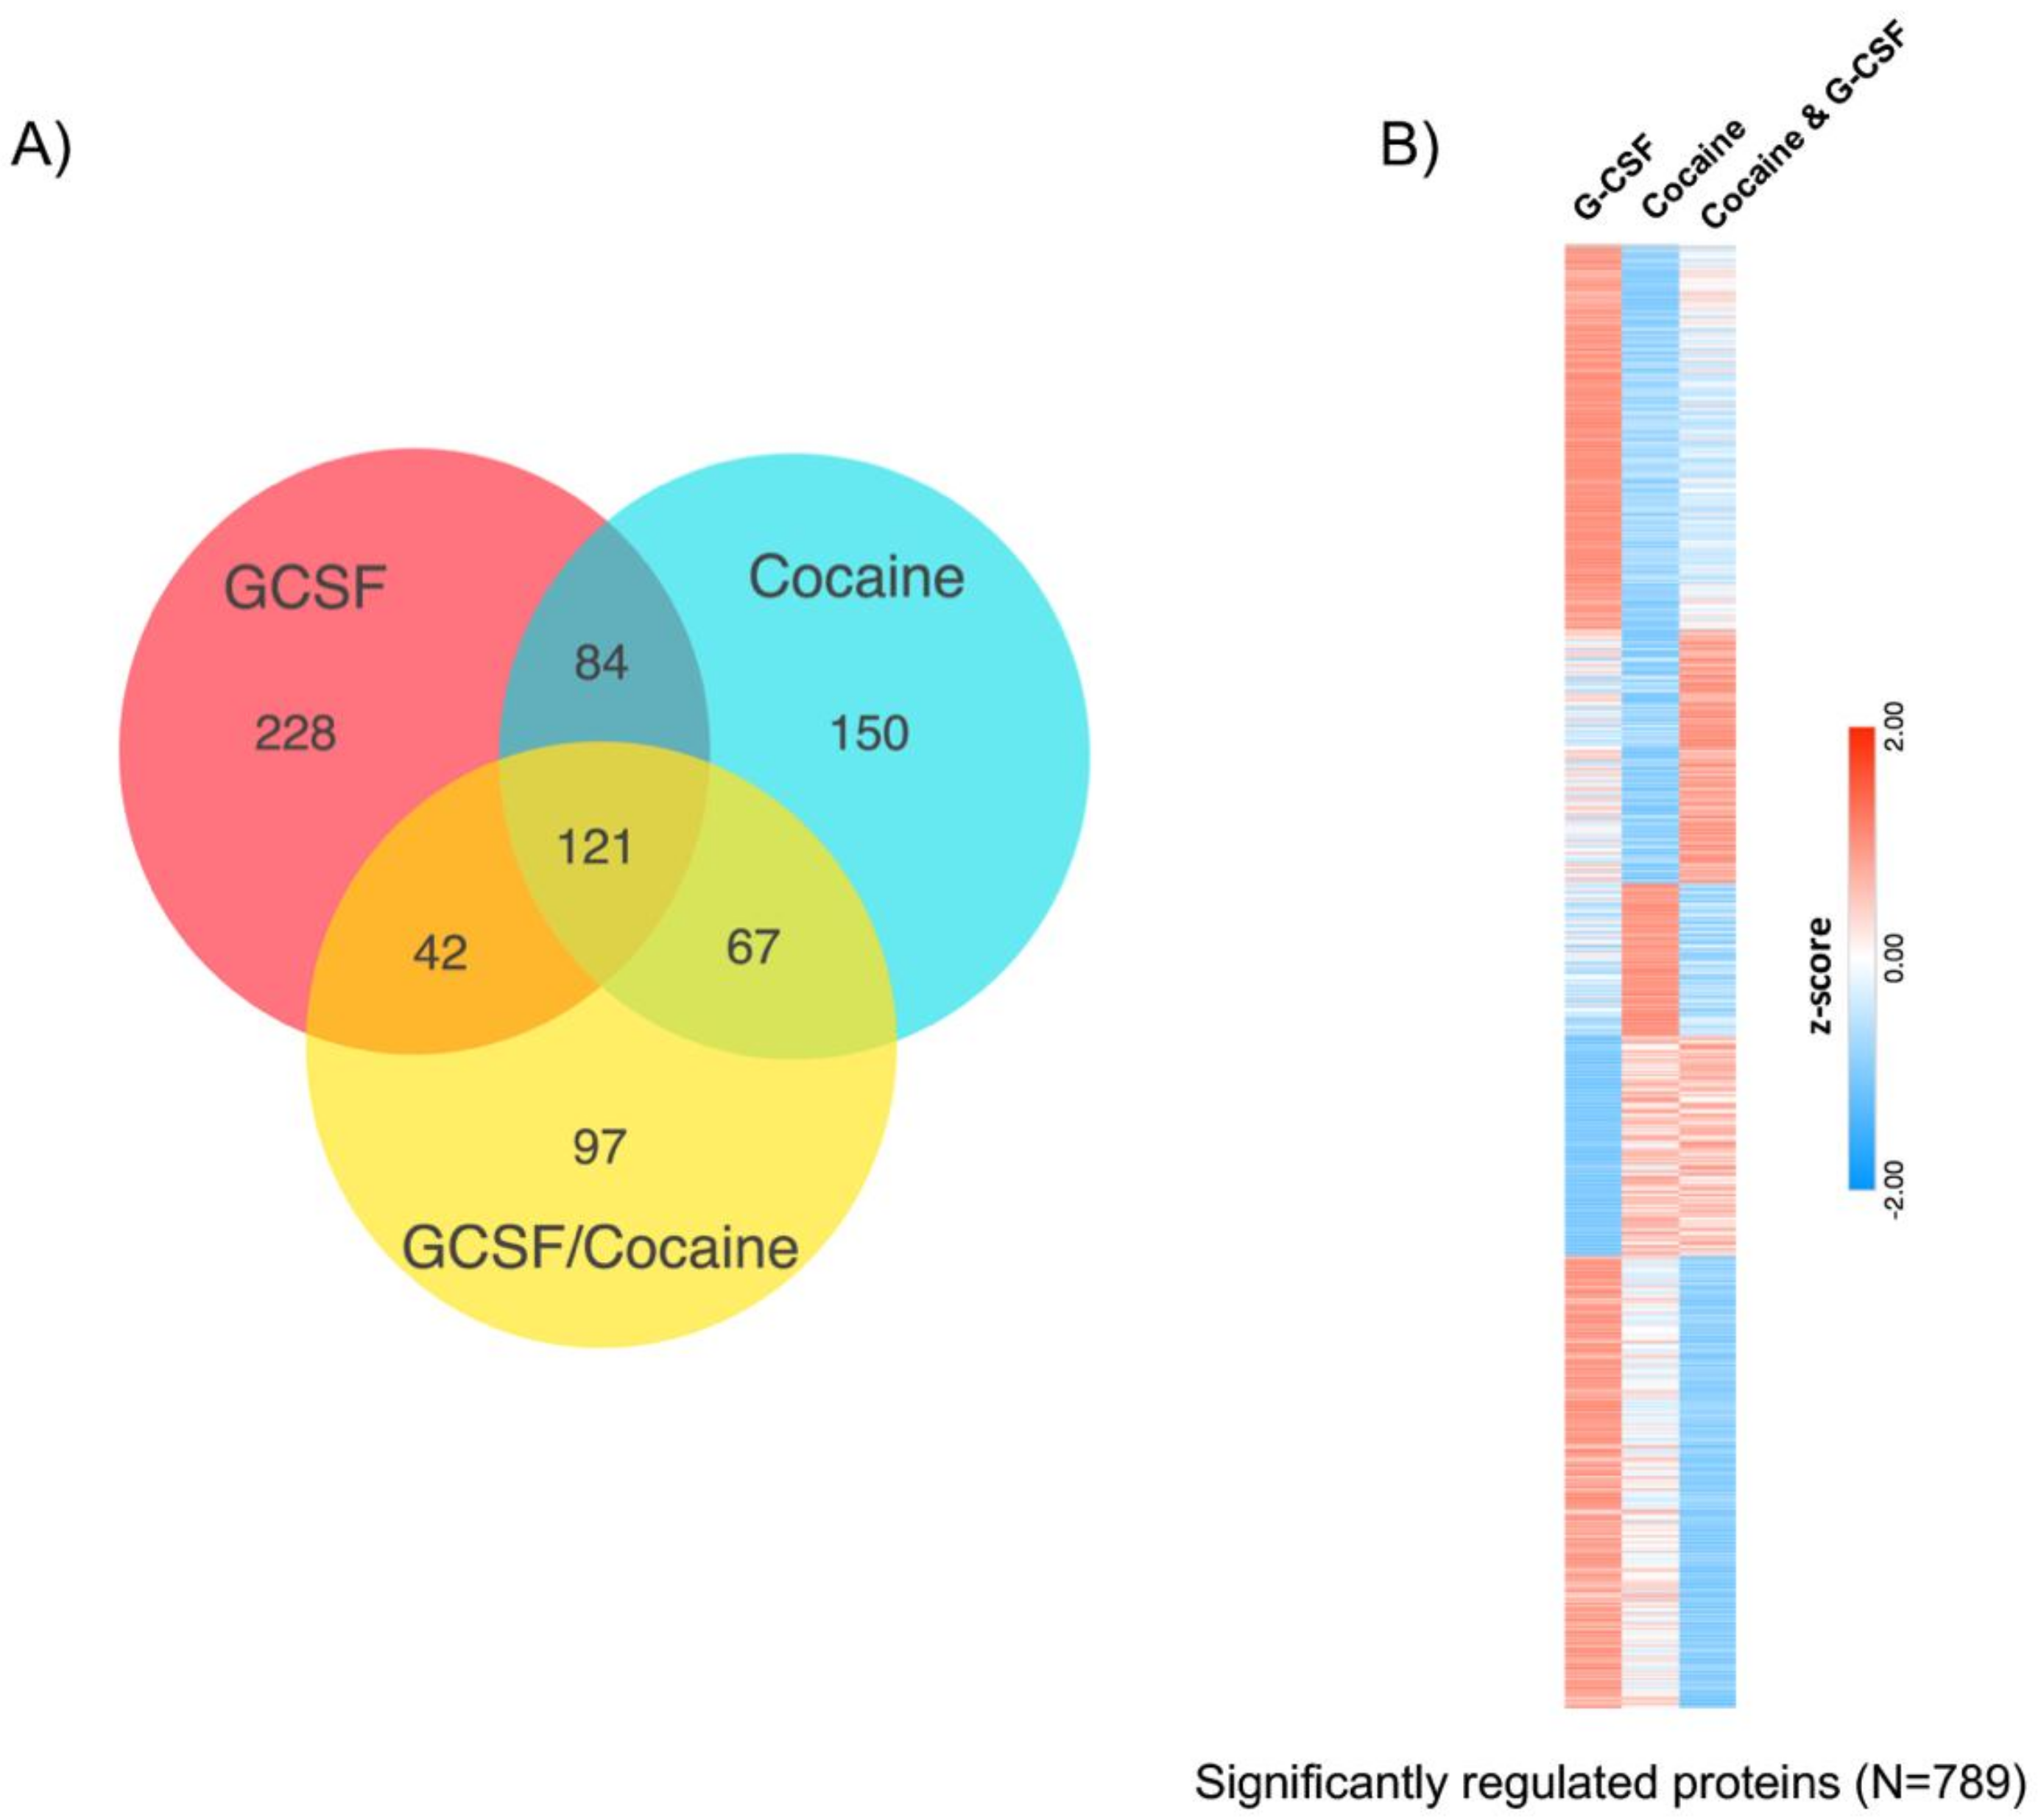
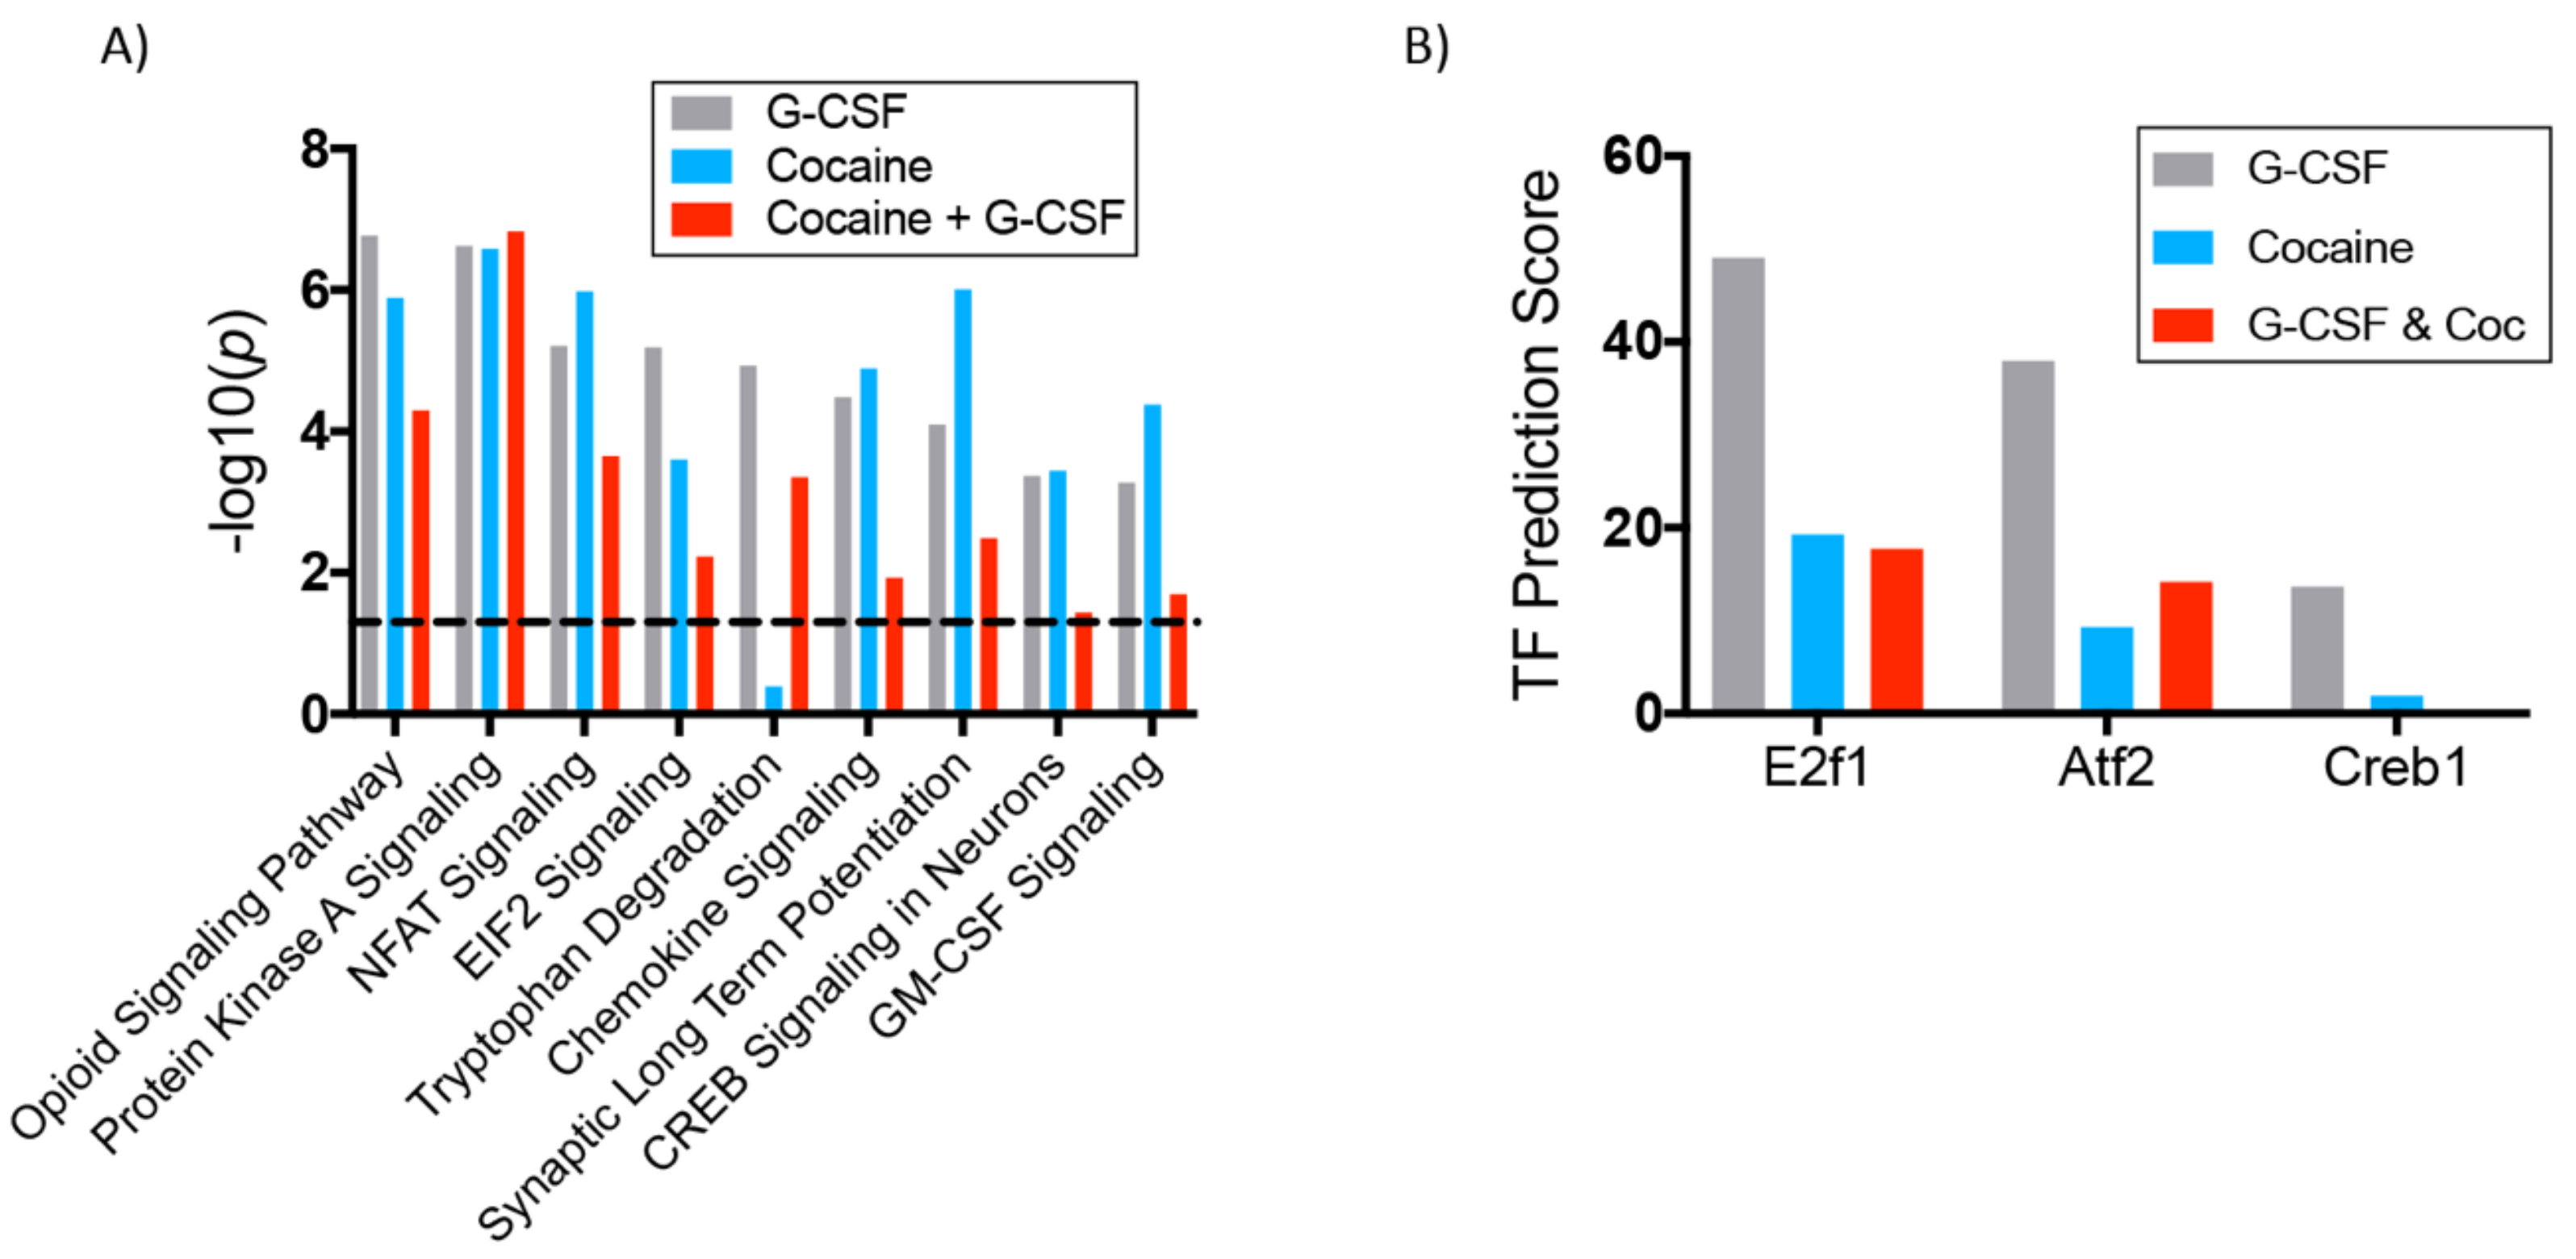
3.3. Interaction Effects of G-CSF & Cocaine in the VTA
3.4. Protein Validation
4. Discussion
Supplementary Materials
Author Contributions
Funding
Conflicts of Interest
References
- Patel, V.; Araya, R.; Chatterjee, S.; Chisholm, D.; Cohen, A.; De Silva, M.; Hosman, C.; McGuire, H.; Rojas, G.; van Ommeren, M. Treatment and prevention of mental disorders in low-income and middle-income countries. Lancet 2007, 370, 991–1005. [Google Scholar] [CrossRef]
- Patel, V.; Chisholm, D.; Parikh, R.; Charlson, F.J.; Degenhardt, L.; Dua, T.; Ferrari, A.J.; Hyman, S.; Laxminarayan, R.; Levin, C.; et al. Addressing the burden of mental, neurological, and substance use disorders: Key messages from Disease Control Priorities, 3rd edition. Lancet 2016, 387, 1672–1685. [Google Scholar] [CrossRef]
- Castells, X.; Cunill, R.; Pérez-Mañá, C.; Vidal, X.; Capellà, D. Psychostimulant drugs for cocaine dependence. Cochrane Database Syst. Rev. 2016, 9, CD007380. [Google Scholar] [CrossRef] [PubMed]
- Shorter, D.; Domingo, C.B.; Kosten, T.R. Emerging drugs for the treatment of cocaine use disorder: A review of neurobiological targets and pharmacotherapy. Expert Opin. Emerg. Drugs 2015, 20, 15–29. [Google Scholar] [CrossRef] [PubMed]
- Platt, D.M.; Rowlett, J.K.; Spealman, R.D. Behavioral effects of cocaine and dopaminergic strategies for preclinical medication development. Psychopharmacology 2002, 163, 265–282. [Google Scholar] [CrossRef] [PubMed]
- Preti, A. New developments in the pharmacotherapy of cocaine abuse. Addict. Biol. 2007, 12, 133–151. [Google Scholar] [CrossRef] [PubMed]
- Shorter, D.; Kosten, T.R. Novel pharmacotherapeutic treatments for cocaine addiction. BMC Med. 2011, 9, 119. [Google Scholar] [CrossRef] [PubMed]
- Hofford, R.S.; Russo, S.J.; Kiraly, D.D. Neuroimmune mechanisms of psychostimulant and opioid use disorders. Eur. J. Neurosci. 2018. [Google Scholar] [CrossRef] [PubMed]
- Lacagnina, M.J.; Rivera, P.D.; Bilbo, S.D. Glial and neuroimmune mechanisms as critical modulators of drug use and abuse. Neuropsychopharmacology 2017, 42, 156–177. [Google Scholar] [CrossRef] [PubMed]
- Hodes, G.E.; Kana, V.; Menard, C.; Merad, M.; Russo, S.J. Neuroimmune mechanisms of depression. Nat. Neurosci. 2015, 18, 1386–1393. [Google Scholar] [CrossRef] [PubMed]
- Calipari, E.S.; Godino, A.; Peck, E.G.; Salery, M.; Mervosh, N.L.; Landry, J.A.; Russo, S.J.; Hurd, Y.L.; Nestler, E.J.; Kiraly, D.D. Granulocyte-colony stimulating factor controls neural and behavioral plasticity in response to cocaine. Nat. Commun. 2018, 9, 9. [Google Scholar] [CrossRef] [PubMed]
- Kutlu, M.G.; Brady, L.J.; Peck, E.G.; Hofford, R.S.; Yorgason, J.T.; Siciliano, C.A.; Kiraly, D.D.; Calipari, E.S. Granulocyte colony stimulating factor enhances reward learning through potentiation of mesolimbic dopamine system function. J. Neurosci. 2018, 1116–1118. [Google Scholar] [CrossRef] [PubMed]
- Kumar, A.S.; Jagadeeshan, S.; Subramanian, A.; Chidambaram, S.B.; Surabhi, R.P.; Singhal, M.; Bhoopalan, H.; Sekar, S.; Pitani, R.S.; Duvuru, P.; et al. Molecular Mechanism of Regulation of MTA1 Expression by Granulocyte Colony-stimulating Factor. J. Biol. Chem. 2016, 291, 12310–12321. [Google Scholar] [CrossRef] [PubMed]
- Prakash, A.; Medhi, B.; Chopra, K. Granulocyte colony stimulating factor (GCSF) improves memory and neurobehavior in an amyloid-β induced experimental model of Alzheimer’s disease. Pharmacol. Biochem. Behav. 2013, 110, 46–57. [Google Scholar] [CrossRef] [PubMed]
- Minnerup, J.; Sevimli, S.; Schäbitz, W.-R. Granulocyte-colony stimulating factor for stroke treatment: Mechanisms of action and efficacy in preclinical studies. Exp. Transl. Stroke Med. 2009, 1, 2. [Google Scholar] [CrossRef] [PubMed]
- Schäbitz, W.-R.; Schneider, A. New targets for established proteins: Exploring G-CSF for the treatment of stroke. Trends Pharmacol. Sci. 2007, 28, 157–161. [Google Scholar] [CrossRef] [PubMed]
- Lu, C.Z.; Xiao, B.G. G-CSF and neuroprotection: A therapeutic perspective in cerebral ischaemia. Biochem. Soc. Trans. 2006, 34, 1327–1333. [Google Scholar] [CrossRef] [PubMed]
- Meuer, K.; Pitzer, C.; Teismann, P.; Krüger, C.; Göricke, B.; Laage, R.; Lingor, P.; Peters, K.; Schlachetzki, J.C.M.; Kobayashi, K.; et al. Granulocyte-colony stimulating factor is neuroprotective in a model of Parkinson’s disease. J. Neurochem. 2006, 97, 675–686. [Google Scholar] [CrossRef] [PubMed]
- Kauer, J.A. Learning mechanisms in addiction: Synaptic plasticity in the ventral tegmental area as a result of exposure to drugs of abuse. Annu. Rev. Physiol. 2004, 66, 447–475. [Google Scholar] [CrossRef] [PubMed]
- Nestler, E.J. Is there a common molecular pathway for addiction? Nat. Neurosci. 2005, 8, 1445–1449. [Google Scholar] [CrossRef] [PubMed]
- Käll, L.; Canterbury, J.D.; Weston, J.; Noble, W.S.; MacCoss, M.J. Semi-supervised learning for peptide identification from shotgun proteomics datasets. Nat. Methods 2007, 4, 923–925. [Google Scholar] [CrossRef] [PubMed]
- Nesvizhskii, A.I.; Keller, A.; Kolker, E.; Aebersold, R. A statistical model for identifying proteins by tandem mass spectrometry. Anal. Chem. 2003, 75, 4646–4658. [Google Scholar] [CrossRef] [PubMed]
- Oberg, A.L.; Mahoney, D.W.; Eckel-Passow, J.E.; Malone, C.J.; Wolfinger, R.D.; Hill, E.G.; Cooper, L.T.; Onuma, O.K.; Spiro, C.; Therneau, T.M.; et al. Statistical analysis of relative labeled mass spectrometry data from complex samples using ANOVA. J. Proteome Res. 2008, 7, 225–233. [Google Scholar] [CrossRef] [PubMed]
- Chen, E.Y.; Tan, C.M.; Kou, Y.; Duan, Q.; Wang, Z.; Meirelles, G.V.; Clark, N.R.; Ma’ayan, A. Enrichr: Interactive and collaborative HTML5 gene list enrichment analysis tool. BMC Bioinform. 2013, 14, 128. [Google Scholar] [CrossRef] [PubMed]
- Kiraly, D.D.; Stone, K.L.; Colangelo, C.M.; Abbott, T.; Wang, Y.; Mains, R.E.; Eipper, B.A. Identification of kalirin-7 as a potential post-synaptic density signaling hub. J. Proteome Res. 2011, 10, 2828–2841. [Google Scholar] [CrossRef] [PubMed]
- Lüscher, C. Cocaine-evoked synaptic plasticity of excitatory transmission in the ventral tegmental area. Cold Spring Harb. Perspect. Med. 2013, 3, a012013. [Google Scholar] [CrossRef] [PubMed]
- Ridwan, S.; Bauer, H.; Frauenknecht, K.; Hefti, K.; von Pein, H.; Sommer, C.J. Distribution of the hematopoietic growth factor G-CSF and its receptor in the adult human brain with specific reference to Alzheimer’s disease. J. Anat. 2014, 224, 377–391. [Google Scholar] [CrossRef] [PubMed]
- Huang, H.-Y.; Lin, S.-Z.; Kuo, J.-S.; Chen, W.-F.; Wang, M.-J. G-CSF protects dopaminergic neurons from 6-OHDA-induced toxicity via the ERK pathway. Neurobiol. Aging 2007, 28, 1258–1269. [Google Scholar] [CrossRef] [PubMed]
- Jennings, M.D.; Pavitt, G.D. A new function and complexity for protein translation initiation factor eIF2B. Cell Cycle 2014, 13, 2660–2665. [Google Scholar] [CrossRef] [PubMed]
- Ferguson, D.; Koo, J.W.; Feng, J.; Heller, E.; Rabkin, J.; Heshmati, M.; Renthal, W.; Neve, R.; Liu, X.; Shao, N.; et al. Essential role of SIRT1 signaling in the nucleus accumbens in cocaine and morphine action. J. Neurosci. 2013, 33, 16088–16098. [Google Scholar] [CrossRef] [PubMed]
- Renthal, W.; Kumar, A.; Xiao, G.; Wilkinson, M.; Covington, H.E.; Maze, I.; Sikder, D.; Robison, A.J.; LaPlant, Q.; Dietz, D.M.; et al. Genome-wide analysis of chromatin regulation by cocaine reveals a role for sirtuins. Neuron 2009, 62, 335–348. [Google Scholar] [CrossRef] [PubMed]
- Ashburner, M.; Ball, C.A.; Blake, J.A.; Botstein, D.; Butler, H.; Cherry, J.M.; Davis, A.P.; Dolinski, K.; Dwight, S.S.; Eppig, J.T.; et al. Gene ontology: Tool for the unification of biology. The Gene Ontology Consortium. Nat. Genet. 2000, 25, 25–29. [Google Scholar] [CrossRef] [PubMed]
- The Gene Ontology Consortium. Expansion of the Gene Ontology knowledgebase and resources. Nucleic Acids Res. 2017, 45, D331–D338. [Google Scholar] [CrossRef] [PubMed]
- Mi, H.; Huang, X.; Muruganujan, A.; Tang, H.; Mills, C.; Kang, D.; Thomas, P.D. PANTHER version 11: Expanded annotation data from Gene Ontology and Reactome pathways, and data analysis tool enhancements. Nucleic Acids Res. 2017, 45, D183–D189. [Google Scholar] [CrossRef] [PubMed]
- Carlezon, W.A.; Thome, J.; Olson, V.G.; Lane-Ladd, S.B.; Brodkin, E.S.; Hiroi, N.; Duman, R.S.; Neve, R.L.; Nestler, E.J. Regulation of cocaine reward by CREB. Science 1998, 282, 2272–2275. [Google Scholar] [CrossRef] [PubMed]
- Brown, T.E.; Lee, B.R.; Mu, P.; Ferguson, D.; Dietz, D.; Ohnishi, Y.N.; Lin, Y.; Suska, A.; Ishikawa, M.; Huang, Y.H.; et al. A silent synapse-based mechanism for cocaine-induced locomotor sensitization. J. Neurosci. 2011, 31, 8163–8174. [Google Scholar] [CrossRef] [PubMed]
- Deng, J.V.; Wan, Y.; Wang, X.; Cohen, S.; Wetsel, W.C.; Greenberg, M.E.; Kenny, P.J.; Calakos, N.; West, A.E. MeCP2 phosphorylation limits psychostimulant-induced behavioral and neuronal plasticity. J. Neurosci. 2014, 34, 4519–4527. [Google Scholar] [CrossRef] [PubMed]
- Im, H.-I.; Hollander, J.A.; Bali, P.; Kenny, P.J. MeCP2 controls BDNF expression and cocaine intake through homeostatic interactions with microRNA-212. Nat. Neurosci. 2010, 13, 1120–1127. [Google Scholar] [CrossRef] [PubMed]
- Tian, S.S.; Tapley, P.; Sincich, C.; Stein, R.B.; Rosen, J.; Lamb, P. Multiple signaling pathways induced by granulocyte colony-stimulating factor involving activation of JAKs, STAT5, and/or STAT3 are required for regulation of three distinct classes of immediate early genes. Blood 1996, 88, 4435–4444. [Google Scholar] [PubMed]
- Marino, V.J.; Roguin, L.P. The granulocyte colony stimulating factor (G-CSF) activates Jak/STAT and MAPK pathways in a trophoblastic cell line. J. Cell Biochem. 2008, 103, 1512–1523. [Google Scholar] [CrossRef] [PubMed]
- Cassinat, B.; Zassadowski, F.; Ferry, C.; Llopis, L.; Bruck, N.; Lainey, E.; Duong, V.; Cras, A.; Despouy, G.; Chourbagi, O.; et al. New role for granulocyte colony-stimulating factor-induced extracellular signal-regulated kinase 1/2 in histone modification and retinoic acid receptor α recruitment to gene promoters: Relevance to acute promyelocytic leukemia cell differentiation. Mol. Cell. Biol. 2011, 31, 1409–1418. [Google Scholar] [CrossRef] [PubMed]
- Diederich, K.; Schäbitz, W.-R.; Kuhnert, K.; Hellström, N.; Sachser, N.; Schneider, A.; Kuhn, H.-G.; Knecht, S. Synergetic effects of granulocyte-colony stimulating factor and cognitive training on spatial learning and survival of newborn hippocampal neurons. PLoS ONE 2009, 4, e5303. [Google Scholar] [CrossRef] [PubMed]
- Robison, A.J.; Nestler, E.J. Transcriptional and epigenetic mechanisms of addiction. Nat. Rev. Neurosci. 2011, 12, 623–637. [Google Scholar] [CrossRef] [PubMed]
- Olson, V.G.; Zabetian, C.P.; Bolanos, C.A.; Edwards, S.; Barrot, M.; Eisch, A.J.; Hughes, T.; Self, D.W.; Neve, R.L.; Nestler, E.J. Regulation of drug reward by cAMP response element-binding protein: Evidence for two functionally distinct subregions of the ventral tegmental area. J. Neurosci. 2005, 25, 5553–5562. [Google Scholar] [CrossRef] [PubMed]
- Kiraly, D.D.; Ma, X.-M.; Mazzone, C.M.; Xin, X.; Mains, R.E.; Eipper, B.A. Behavioral and morphological responses to cocaine require kalirin7. Biol. Psychiatry 2010, 68, 249–255. [Google Scholar] [CrossRef] [PubMed]
- Dietz, D.M.; Sun, H.; Lobo, M.K.; Cahill, M.E.; Chadwick, B.; Gao, V.; Koo, J.W.; Mazei-Robison, M.S.; Dias, C.; Maze, I.; et al. Rac1 is essential in cocaine-induced structural plasticity of nucleus accumbens neurons. Nat. Neurosci. 2012, 15, 891–896. [Google Scholar] [CrossRef] [PubMed]
- Sarti, F.; Borgland, S.L.; Kharazia, V.N.; Bonci, A. Acute cocaine exposure alters spine density and long-term potentiation in the ventral tegmental area. Eur. J. Neurosci. 2007, 26, 749–756. [Google Scholar] [CrossRef] [PubMed]
- Ungless, M.A.; Whistler, J.L.; Malenka, R.C.; Bonci, A. Single cocaine exposure in vivo induces long-term potentiation in dopamine neurons. Nature 2001, 411, 583–587. [Google Scholar] [CrossRef] [PubMed]
- Costa-Mattioli, M.; Sonenberg, N.; Richter, J.D. Translational regulatory mechanisms in synaptic plasticity and memory storage. Prog. Mol. Biol. Transl. Sci. 2009, 90, 293–311. [Google Scholar] [PubMed]
- Taha, E.; Gildish, I.; Gal-Ben-Ari, S.; Rosenblum, K. The role of eEF2 pathway in learning and synaptic plasticity. Neurobiol. Learn. Mem. 2013, 105, 100–106. [Google Scholar] [CrossRef] [PubMed]
- Khlebodarova, T.M.; Kogai, V.V.; Trifonova, E.A.; Likhoshvai, V.A. Dynamic landscape of the local translation at activated synapses. Mol. Psychiatry 2018, 23, 107–114. [Google Scholar] [CrossRef] [PubMed]
- Werner, C.T.; Stefanik, M.T.; Milovanovic, M.; Caccamise, A.; Wolf, M.E. Protein Translation in the Nucleus Accumbens Is Dysregulated during Cocaine Withdrawal and Required for Expression of Incubation of Cocaine Craving. J. Neurosci. 2018, 38, 2683–2697. [Google Scholar] [CrossRef] [PubMed]
- Smith, L.N.; Jedynak, J.P.; Fontenot, M.R.; Hale, C.F.; Dietz, K.C.; Taniguchi, M.; Thomas, F.S.; Zirlin, B.C.; Birnbaum, S.G.; Huber, K.M.; et al. Fragile X mental retardation protein regulates synaptic and behavioral plasticity to repeated cocaine administration. Neuron 2014, 82, 645–658. [Google Scholar] [CrossRef] [PubMed]
- Cahill, M.E.; Bagot, R.C.; Gancarz, A.M.; Walker, D.M.; Sun, H.; Wang, Z.-J.; Heller, E.A.; Feng, J.; Kennedy, P.J.; Koo, J.W.; et al. Bidirectional Synaptic Structural Plasticity after Chronic Cocaine Administration Occurs through Rap1 Small GTPase Signaling. Neuron 2016, 89, 566–582. [Google Scholar] [CrossRef] [PubMed]
- Shi, X.; Miller, J.S.; Harper, L.J.; Poole, R.L.; Gould, T.J.; Unterwald, E.M. Reactivation of cocaine reward memory engages the Akt/GSK3/mTOR signaling pathway and can be disrupted by GSK3 inhibition. Psychopharmacology 2014, 231, 3109–3118. [Google Scholar] [CrossRef] [PubMed]
- Sutton, L.P.; Caron, M.G. Essential role of D1R in the regulation of mTOR complex1 signaling induced by cocaine. Neuropharmacology 2015, 99, 610–619. [Google Scholar] [CrossRef] [PubMed]
- Bailey, J.; Ma, D.; Szumlinski, K.K. Rapamycin attenuates the expression of cocaine-induced place preference and behavioral sensitization. Addict. Biol. 2012, 17, 248–258. [Google Scholar] [CrossRef] [PubMed]
- Wu, J.; McCallum, S.E.; Glick, S.D.; Huang, Y. Inhibition of the mammalian target of rapamycin pathway by rapamycin blocks cocaine-induced locomotor sensitization. Neuroscience 2011, 172, 104–109. [Google Scholar] [CrossRef] [PubMed]
- James, M.H.; Quinn, R.K.; Ong, L.K.; Levi, E.M.; Smith, D.W.; Dickson, P.W.; Dayas, C.V. Rapamycin reduces motivated responding for cocaine and alters GluA1 expression in the ventral but not dorsal striatum. Eur. J. Pharmacol. 2016, 784, 147–154. [Google Scholar] [CrossRef] [PubMed]
- Liu, X.; Li, Y.; Yu, L.; Vickstrom, C.R.; Liu, Q.-S. VTA mTOR Signaling Regulates Dopamine Dynamics, Cocaine-Induced Synaptic Alterations, and Reward. Neuropsychopharmacology 2018, 43, 1066–1077. [Google Scholar] [CrossRef] [PubMed]
- Schäbitz, W.R.; Kollmar, R.; Schwaninger, M.; Juettler, E.; Bardutzky, J.; Schölzke, M.N.; Sommer, C.; Schwab, S. Neuroprotective effect of granulocyte colony-stimulating factor after focal cerebral ischemia. Stroke 2003, 34, 745–751. [Google Scholar] [CrossRef] [PubMed]
- Uslaner, J.; Badiani, A.; Norton, C.S.; Day, H.E.; Watson, S.J.; Akil, H.; Robinson, T.E. Amphetamine and cocaine induce different patterns of c-fos mRNA expression in the striatum and subthalamic nucleus depending on environmental context. Eur. J. Neurosci. 2001, 13, 1977–1983. [Google Scholar] [CrossRef] [PubMed]
- Lasseter, H.C.; Xie, X.; Arguello, A.A.; Wells, A.M.; Hodges, M.A.; Fuchs, R.A. Contribution of a mesocorticolimbic subcircuit to drug context-induced reinstatement of cocaine-seeking behavior in rats. Neuropsychopharmacology 2014, 39, 660–669. [Google Scholar] [CrossRef] [PubMed]
- Stankeviciute, N.M.; Scofield, M.D.; Kalivas, P.W.; Gipson, C.D. Rapid, transient potentiation of dendritic spines in context-induced relapse to cocaine seeking. Addict. Biol. 2014, 19, 972–974. [Google Scholar] [CrossRef] [PubMed]


| Ingenuity Canonical Pathways | −log(p-value) | z-score | |
|---|---|---|---|
| Downregulated | cAMP-mediated signaling | 2.95 | −2.183 |
| Protein Kinase A Signaling | 6.62 | −1.347 | |
| nNOS Signaling in Neurons | 3.2 | −1.342 | |
| Chemokine Signaling | 4.48 | −1.265 | |
| Opioid Signaling Pathway | 6.77 | −0.816 | |
| Synaptic Long-Term Potentiation | 4.1 | −0.577 | |
| CREB Signaling in Neurons | 3.37 | −0.577 | |
| RhoA Signaling | 2.56 | −0.333 | |
| Dopamine-DARPP32 in cAMP Signaling | 2.83 | −0.277 | |
| Upregulated | Oxidative Phosphorylation | 3.78 | 3.317 |
| EIF2 Signaling | 5.19 | 2.111 | |
| Ephrin B Signaling | 3.24 | 1.667 | |
| Noradrenaline/Adrenaline Degradation | 2.87 | 1.342 | |
| Sirtuin Signaling Pathway | 3.07 | 1.265 | |
| Tryptophan Degradation | 4.93 | 0.816 | |
| Actin Cytoskeleton Signaling | 3.15 | 0.775 | |
| Thrombin Signaling | 3.4 | 0.535 | |
| GM-CSF Signaling | 3.28 | 0.378 | |
| 14-3-3-mediated Signaling | 3.93 | 0.333 | |
| Neuropathic Pain Signaling in Dorsal Horn Neurons | 3.07 | 0.302 | |
| Calcium Signaling | 3.46 | 0.277 |
| Master Regulator | Molecule Type | Participating Regulators | Activation z-score | p-Value | Direct Targets |
|---|---|---|---|---|---|
| FMR1 | Translation Regulator | Akt1, FMR1, MAPT, MTOR | 1.4 | 7.83 × 10⁻¹⁴ | 26 |
| MMP9 | Peptidase | AKT1, FMR1, GRIN1, MAPT, MMP9, MTOR | −1.8 | 1.51 × 10⁻¹³ | 25 |
| CDK5 | Kinase | CDK5, FMR1, MAP2, MAP2K1, MAPK1, MAPT, MTOR, RPS6KB1, STAT3, TRPV1 | −0.78 | 1.49 × 10⁻¹⁰ | 25 |
| SLC6A3 | Transporter | CDK5, GSK3B, MAP2, MAP2K1, MAPK10, MAPT, MTOR, RPS6KB1, SLC6A3 | 1.09 | 3.76 × 10⁻¹⁰ | 21 |
| EGR1 | Transcription Regulator | CDK5, EGR1, GSK3B, MAP2, MAP2K1, MAPK10, MAPT, MTOR, RPS6KB1 | −1.34 | 1.05 × 10⁻⁹ | 20 |
| GO Molecular Function Complete | REFLIST (22262) | Upload Match | Upload Expected | Upload +/− | Fold Enrichment | Raw p-Value | FDR | |
|---|---|---|---|---|---|---|---|---|
| G-CSF vs. Saline | binding (GO:0005488) | 13001 | 296 | 200.9 | + | 1.47 | 2.49 × 10⁻²⁸ | 1.13 × 10⁻²⁴ |
| RNA binding (GO:0003723) | 1019 | 73 | 15.75 | + | 4.64 | 2.86 × 10⁻²⁷ | 6.48 × 10⁻²⁴ | |
| protein binding (GO:0005515) | 8900 | 227 | 137.53 | + | 1.65 | 6.02 × 10⁻²² | 9.09 × 10⁻¹⁹ | |
| heterocyclic compound binding (GO:1901363) | 4917 | 152 | 75.98 | + | 2 | 1.82 × 10⁻¹⁹ | 2.07 × 10⁻¹⁶ | |
| organic cyclic compound binding (GO:0097159) | 5006 | 152 | 77.35 | + | 1.96 | 1.08 × 10⁻¹⁸ | 9.77 × 10⁻¹⁶ | |
| mRNA binding (GO:0003729) | 243 | 28 | 3.75 | + | 7.46 | 1.56 × 10⁻¹⁵ | 1.18 × 10⁻¹² | |
| protein-containing complex binding (GO:0044877) | 1163 | 58 | 17.97 | + | 3.23 | 9.27 × 10⁻¹⁵ | 6.01 × 10⁻¹² | |
| enzyme binding (GO:0019899) | 2260 | 84 | 34.92 | + | 2.41 | 7.23 × 10⁻¹⁴ | 4.10 × 10⁻¹¹ | |
| signaling receptor activity (GO:0038023) | 2271 | 2 | 35.09 | − | 0.06 | 1.56 × 10⁻¹³ | 7.87 × 10⁻¹¹ | |
| structural molecule activity (GO:0005198) | 613 | 39 | 9.47 | + | 4.12 | 3.37 × 10⁻¹³ | 1.53 × 10⁻¹⁰ | |
| molecular transducer activity (GO:0060089) | 2324 | 3 | 35.91 | − | 0.08 | 1.18 × 10⁻¹² | 4.88 × 10⁻¹⁰ | |
| transmembrane signaling receptor activity (GO:0004888) | 2082 | 2 | 32.17 | − | 0.06 | 3.02 × 10⁻¹² | 1.14 × 10⁻⁹ | |
| Coc. vs. Saline | protein binding (GO:0005515) | 8900 | 170 | 96.35 | + | 1.76 | 2.40 × 10⁻²¹ | 1.09 × 10⁻¹⁷ |
| binding (GO:0005488) | 13001 | 206 | 140.74 | + | 1.46 | 2.12 × 10⁻¹⁹ | 4.82 × 10⁻¹⁶ | |
| structural molecule activity (GO:0005198) | 613 | 32 | 6.64 | + | 4.82 | 5.44 × 10⁻¹³ | 8.23 × 10⁻¹⁰ | |
| RNA binding (GO:0003723) | 1019 | 41 | 11.03 | + | 3.72 | 7.98 × 10⁻¹³ | 9.05 × 10⁻¹⁰ | |
| organic cyclic compound binding (GO:0097159) | 5006 | 100 | 54.19 | + | 1.85 | 6.20 × 10⁻¹³ | 5.62 × 10⁻⁸ | |
| heterocyclic compound binding (GO:1901363) | 4917 | 98 | 53.23 | + | 1.84 | 1.34 × 10⁻¹⁰ | 1.02 × 10⁻⁷ | |
| molecular transducer activity (GO:0060089) | 2324 | 1 | 25.16 | − | 0.04 | 1.66 × 10⁻¹⁰ | 1.07 × 10⁻⁷ | |
| identical protein binding (GO:0042802) | 1840 | 52 | 19.92 | + | 2.61 | 1.98 × 10⁻¹⁰ | 1.12 × 10⁻⁷ | |
| cytoskeletal protein binding (GO:0008092) | 936 | 35 | 10.13 | + | 3.45 | 3.12 × 10⁻¹⁰ | 1.57 × 10⁻⁷ | |
| signaling receptor activity (GO:0038023) | 2271 | 1 | 24.58 | − | 0.04 | 4.19 × 10⁻¹⁰ | 1.90 × 10⁻⁷ | |
| mRNA binding (GO:0003729) | 243 | 18 | 2.63 | + | 6.84 | 4.91 × 10⁻¹⁰ | 2.02 × 10⁻⁷ | |
| actin binding (GO:0003779) | 411 | 22 | 4.45 | + | 4.94 | 1.85 × 10⁻⁹ | 7.00 × 10⁻⁷ | |
| G-CSF + Coc vs. Saline | binding (GO:0005488) | 13001 | 167 | 108.62 | + | 1.54 | 7.88 × 10⁻²¹ | 3.57 × 10⁻¹⁷ |
| protein binding (GO:0005515) | 8900 | 137 | 74.36 | + | 1.84 | 2.67 × 10⁻²⁰ | 6.06 × 10⁻¹⁷ | |
| identical protein binding (GO:0042802) | 1840 | 46 | 15.37 | + | 2.99 | 1.67 × 10⁻¹¹ | 2.52 × 10⁻⁸ | |
| cytoskeletal protein binding (GO:0008092) | 936 | 31 | 7.82 | + | 3.96 | 9.34 × 10⁻¹¹ | 1.06 × 10⁻⁷ | |
| RNA binding (GO:0003723) | 1019 | 32 | 8.51 | + | 3.76 | 1.65 × 10⁻¹⁰ | 1.50 × 10⁻⁷ | |
| structural molecule activity (GO:0005198) | 613 | 24 | 5.12 | + | 4.69 | 6.58 × 10⁻¹⁰ | 4.97 × 10⁻⁷ | |
| actin binding (GO:0003779) | 411 | 19 | 3.43 | + | 5.53 | 3.48 × 10⁻⁹ | 2.25 × 10⁻⁶ | |
| molecular transducer activity (GO:0060089) | 2324 | 1 | 19.42 | − | 0.05 | 7.39 × 10⁻⁸ | 3.72 × 10⁻⁵ | |
| heterocyclic compound binding (GO:1901363) | 4917 | 74 | 41.08 | + | 1.8 | 6.61 × 10⁻⁸ | 3.75 × 10⁻⁵ | |
| signaling receptor activity (GO:0038023) | 2271 | 1 | 18.97 | − | 0.05 | 1.12 × 10⁻⁷ | 5.07 × 10⁻⁵ | |
| organic cyclic compound binding (GO:0097159) | 5006 | 74 | 41.83 | + | 1.77 | 1.38 × 10⁻⁷ | 5.68 × 10⁻⁵ | |
| enzyme binding (GO:0019899) | 2260 | 43 | 18.88 | + | 2.28 | 2.95 × 10⁻⁷ | 1.11 × 10⁻⁴ |
© 2018 by the authors. Licensee MDPI, Basel, Switzerland. This article is an open access article distributed under the terms and conditions of the Creative Commons Attribution (CC BY) license (http://creativecommons.org/licenses/by/4.0/).
Share and Cite
Mervosh, N.L.; Wilson, R.; Rauniyar, N.; Hofford, R.S.; Kutlu, M.G.; Calipari, E.S.; Lam, T.T.; Kiraly, D.D. Granulocyte-Colony-Stimulating Factor Alters the Proteomic Landscape of the Ventral Tegmental Area. Proteomes 2018, 6, 35. https://doi.org/10.3390/proteomes6040035
Mervosh NL, Wilson R, Rauniyar N, Hofford RS, Kutlu MG, Calipari ES, Lam TT, Kiraly DD. Granulocyte-Colony-Stimulating Factor Alters the Proteomic Landscape of the Ventral Tegmental Area. Proteomes. 2018; 6(4):35. https://doi.org/10.3390/proteomes6040035
Chicago/Turabian StyleMervosh, Nicholas L., Rashaun Wilson, Navin Rauniyar, Rebecca S. Hofford, Munir Gunes Kutlu, Erin S. Calipari, TuKiet T. Lam, and Drew D. Kiraly. 2018. "Granulocyte-Colony-Stimulating Factor Alters the Proteomic Landscape of the Ventral Tegmental Area" Proteomes 6, no. 4: 35. https://doi.org/10.3390/proteomes6040035
APA StyleMervosh, N. L., Wilson, R., Rauniyar, N., Hofford, R. S., Kutlu, M. G., Calipari, E. S., Lam, T. T., & Kiraly, D. D. (2018). Granulocyte-Colony-Stimulating Factor Alters the Proteomic Landscape of the Ventral Tegmental Area. Proteomes, 6(4), 35. https://doi.org/10.3390/proteomes6040035