Article

Student’s Perceptions Regarding Assessment Changes in a Fluid Mechanics Course

by
Teresa Sena-Esteves
1,
Cristina Morais
1,
Anabela Guedes
1,
Isabel Brás Pereira
1,
Margarida Marques Ribeiro
1,
Filomena Soares
2 and
Celina Pinto Leão
3,*
1
Department of Chemical Engineering, CIETI Research Centre, Polytechnic of Porto, 4200-072 Porto, Portugal
2
Department of Industrial Electronics, Algoritmi Research Centre, University of Minho, Campus de Azurem, 4800-058 Guimarães, Portugal
3
Department of Production Systems, Algoritmi Research Centre, University of Minho, Campus de Azurem, 4800-058 Guimarães, Portugal
*
Author to whom correspondence should be addressed.
Educ. Sci. 2019, 9(2), 152; https://doi.org/10.3390/educsci9020152
Submission received: 10 May 2019 / Revised: 7 June 2019 / Accepted: 12 June 2019 / Published: 19 June 2019
(This article belongs to the Special Issue Engineering Education and Technological / Professional Learning)

Abstract

:
The main objective of this study is to evaluate students’ perceptions regarding different methods of assessment and which teaching/learning methodologies may be the most effective in a Fluid Transport System course. The impact of the changes in the assessment methodology in the final students’ grades and attendance at theoretical classes is also analysed, and the results show that students’ attendance at theoretical classes changed significantly. The students prefer and consider more beneficial for their learning assessment through several questions/problems and small tests during theoretical lessons instead of a single moment of evaluation. For them, the traditional teaching/learning methodology is still considered the most effective one. At the same time, students perceive that the development of the Practical Work (PW) and several moments of assessment had positive repercussions on the way they focus on the course content and keep up with the subjects taught, providing knowledge on the area under study, encouraging collaborative work and stimulating the students’ intellectual curiosity. Largely, students agree that the PW is an important tool in their learning process and recommend it as a teaching activity. In general, students are confident with the knowledge acquired with the PW and feel able to size fluid transport systems.

1. Introduction

Several studies can be found in the literature focused on designing and testing new (or reformulated) teaching/learning and assessment methodologies applied in different areas. Most of them have as a final goal promoting class attendance and improving students’ performance and knowledge.
Cansino et al. [1] attempted to find out if the attendance at classes and the promotion of students’ proactivity through oral presentations of case studies positively affected the probability of passing the exam and obtaining higher scores. In fact, they concluded that class attendance and case study presentations were related with academic performance. Also, Lukkarinen et al. [2] investigated the relationship between voluntary class attendance and learning performance. The authors divided students into three distinct groups: students who attended classes but dropped out before the final exam, students who attended classes and the exam, and students who did not attend classes, studied independently, and attended the exam. Although students may succeed without attending classes, the authors concluded that there was a key group of students for whom class attendance was positively related to performance.
Ma et al. [3] explored the use of the application-based flipped classroom (APP-FC), an innovative teaching-learning model, in an immunology course medical curriculum at Lanzhou University, China. The authors concluded that most students that implemented the APP-FC model improved their score in the final examination (60%) compared to the control group (40%). The majority of students (70%) preferred this teaching model to the traditional lecture-based method. Also, APP-FC improved students’ learning motivation, self-directed learning skills, and problem-solving abilities.
There is a growing interest in practice-based learning in countries with both advanced and developing economies. Much of this interest is directed towards augmenting students’ learning within vocational or higher education programmes of initial occupational preparation or those for professional development (i.e., further development of occupational knowledge across working life) [4].
Fluid Mechanics (FM) in engineering courses is not an exception. Several works can be found in the literature [5,6,7,8,9,10]. In fact, FM is considered a challenging topic, leading some of the times to unsuccessful students and distressed teachers.
Since 2013, in the Curricular Unit Fluid Mechanics at the University of Western Sydney (Australia) a Blended Learning Approach (BLA) has been employed. This teaching/learning approach considers online recorded lectures and tutorials, hand-written tutorial solutions, discussion board and online practice quizzes. The tutorial classes are devoted to discussing difficult topics and engaging students with practical applications. Students’ feedback is positive, as the learning experience improved, and the knowledge of fluid mechanics translated into a higher average grade and an increase in completion rates [9].
Nevertheless, the implementation of new teaching/learning methods can be a hard task for students as well as for teachers; it is well known that any change in the traditional and commonly accepted teaching/learning process may cause certain resistance from both. If correctly implemented, problem/project-based learning methodologies, case studies, and hands-on approaches (among other interactive processes, where students are the main actors) are key tools to prepare students for their engineering profession [11,12,13,14,15]. These tools allow students to develop their ingenious, social and management skills, which are undoubtedly relevant for engineers in their profession [16].

1.1. Motivation

Apart from the implementation of new/different teaching/learning tools, students’ assessment is also a topic to explore in higher education. Gibbs and Simpson [17] refer to two important aspects: giving feedback to students on their learning and adequate students’ workload for the assessment method.
Sorensen [8] presents a study on second year students’ perceptions regarding the assessment in a traditional module conducted in the Department of Chemical Engineering at University College London. In this particular case, the assessment was performed through online quizzes that give immediate feedback to students, allowing them to identify the contents that might need to be improved. The analysis of questionnaires made it possible to infer that students react very positively to this assessment mode, suggesting that this method be extended to other modules.
An interactive online system for skills and knowledge assessment in a computer engineering course and its impact on the students’ learning process was presented by Hettiarachchi et al. [18]. Through data analysis, the authors concluded that this type of assessment had a positive impact on students’ learning and performance. In fact, students were engaged in the interactive system for both practices, where they were able to evaluate their progress or difficulties, and also in the assessment process.
The authors believe in the importance of promoting student self-learning and adapting the assessment methods in order to prepare them for their professional challenges. Following this trend, the study presented in this paper is focused on how the assessment in a Fluid Mechanics course is perceived by students. How different evaluation methods are considered relevant by students? How can the evaluation methods help students in their future profession?

1.2. Objectives

The main objective of this study is to evaluate students’ perceptions regarding different types of assessment. In addition, the impact of the changes in the assessment methodology in the final students’ grades is analysed. These analyses will allow the identification and adoption of the teaching/learning methodologies that may be the most effective.
To fulfil the main objective, a main research question (RQ) was defined:
RQ—How do students perceive the assessment methodology?
Moreover, in order to analyse the effect of introducing a Practical Work (PW), five sub-research questions were formulated:
sRQ1—How important is the PW in the students’ learning process?
sRQ2—Is the PW perceived as an autonomous tool?
sRQ3—Is the PW effective for preparing students for the challenge of professional life?
sRQ4—Which competences did students acquire with the PW?
sRQ5—Are the students confident with the knowledge acquired with the PW to size a proper fluid transport system?
It is the authors’ belief that the optimisation of the assessment methodology may have a positive impact in preparing the students for the challenge of their professional learning.
The paper is organised in four sections. In the next section (Materials and Methods), the curricular unit (CU) Fluid Transport Systems (with the acronym STFLU) is characterised followed by the assessment methodology definition, by the questionnaire used to evaluate students’ satisfaction and perceptions and by the students’ characterisation. In the third section, the analysis of students’ perceptions is made, and in the last section, the final remarks are addressed.

2. Materials and Methods

In this section, the curricular unit Fluid Transport Systems (STFLU) is characterised, followed by the assessment methodology definition. The questionnaire used to evaluate students’ satisfaction and perceptions is also described, followed by the students’ characterisation.

2.1. Fluid Transport Systems in Chemical Engineering

Since 2006, the Chemical Engineering graduation in the Higher Education Institution (HEI) has been divided into two cycles, the First Cycle (3 years) and the Master degree (2 years). They represent two complementary levels of higher education. The first cycle enables students to gather technical and scientific tools that will allow them to act in industry, quality control and laboratory services. The Master degree provides a deepening of knowledge in the fundamental areas of chemical engineering and offers specific subjects in each of the three branches presently available: environmental protection technologies, energy and biorefinery, and quality. The present study refers to the Fluid Transport Systems (STFLU) course, which is taught in the 1st cycle.

2.1.1. Course Characterisation

STFLU is a course of the second year of the first cycle in Chemical Engineering of HEI. Since 2012/13, this course has had a total of four hours per week (one hour of lectures and three hours of practical classes) in daytime and evening classes. On average, there are 55 to 65 students each year, and two teachers. Theoretical (T) classes are mainly expositive but the teachers also use the interrogative method and different demonstrative and active techniques. In theoretical-practical (TP) classes, students are requested to cooperatively solve problems and real-world case studies.

2.1.2. Course Objectives

STFLU has the general objective of giving students fundamental knowledge in Fluid Mechanics that will enable them to design fluid transport systems and select the associated equipment. In particular, at the end of this course, students should be able to make mass and energy balances that are necessary to design systems and select the appropriate equipment (flow meters; centrifugal, reciprocating and rotary pumps; compressors and fans).

2.1.3. Course Syllabus

The syllabus of STFLU course is divided into two main parts. The first one covers the fundamental principles of mass, energy and momentum transport and the second parts includes the systems of fluid transport (selection and sizing of pipes, valves and fittings, flow meters, pumps, compressors and fans).

2.1.4. Assessment Methodology

The assessment methodology of this course has been changed in recent years. This change should improve the knowledge acquisition by the students and consequently it should be reflected in the final students’ grades and success rate.
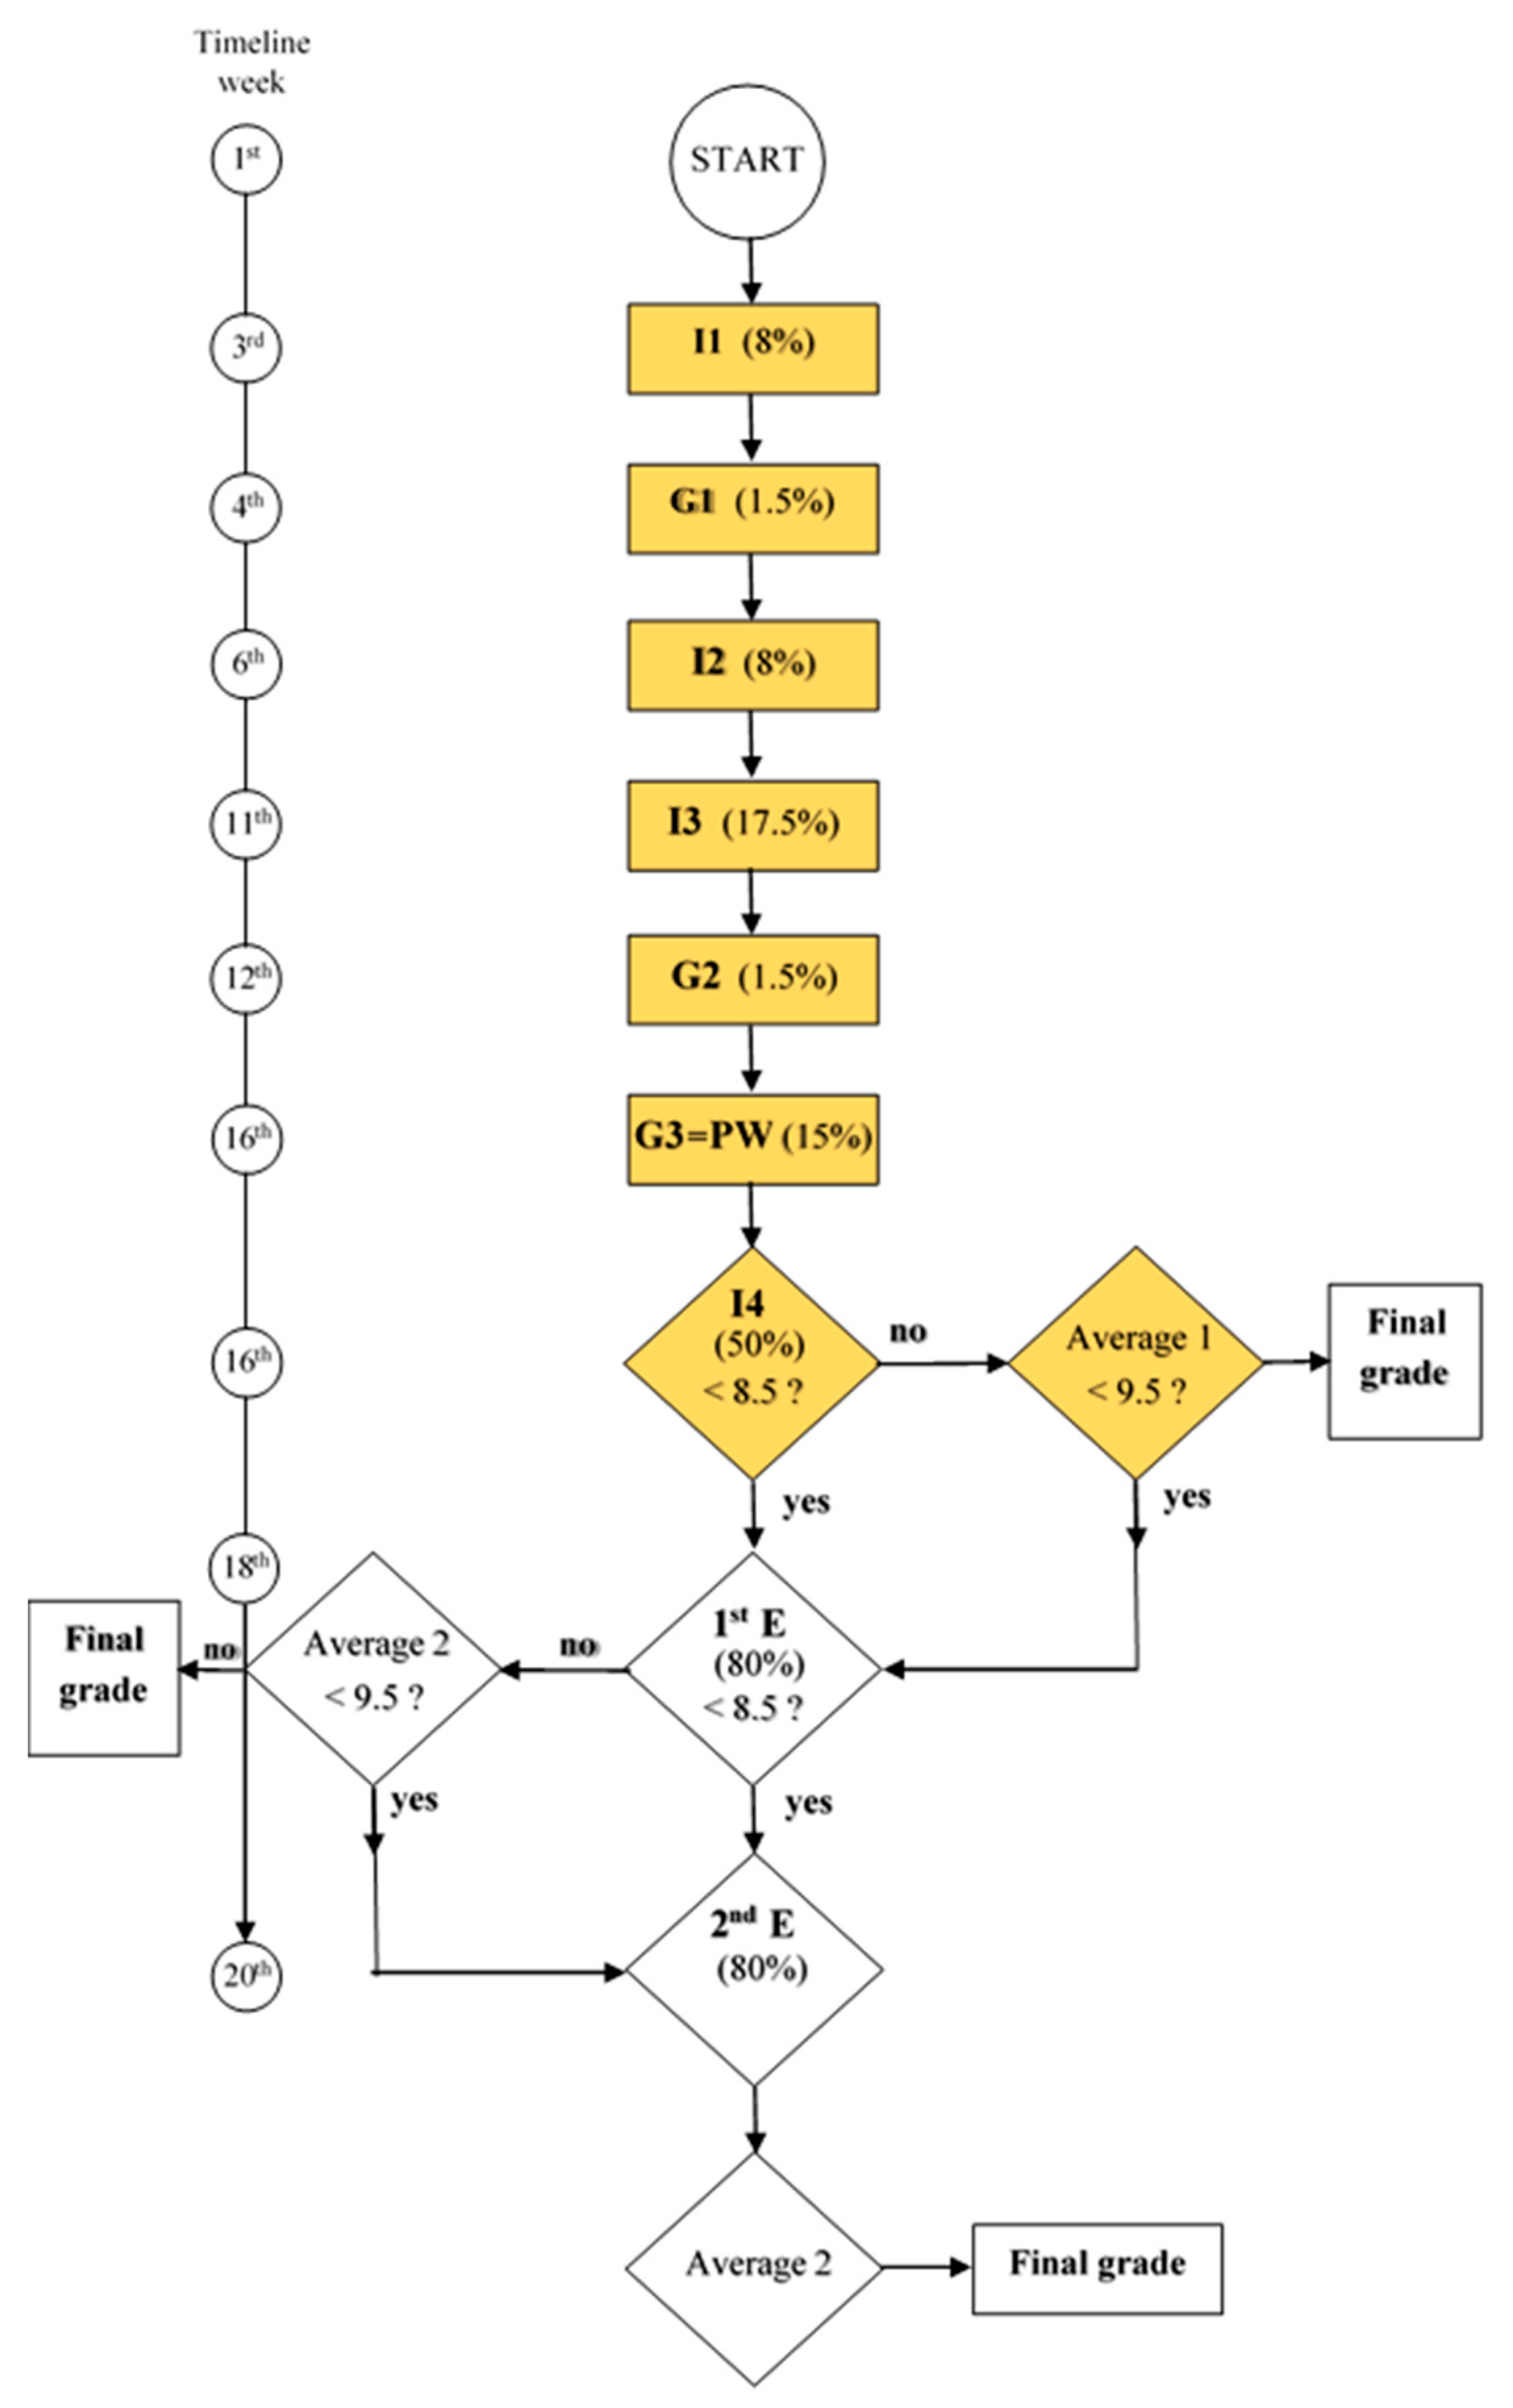
Figure 1 shows the last assessment flowchart, corresponding to the academic year 2017/2018, which reflects the evaluation towards an autonomous/independent learning by students.
The assessment methodology for the academic years between 2006/07 and 2015/16 included only PW (at the Moment G3) and the two final exams (normal and supplementary periods of exams), with the exception of 2009/10, when students only had the two final exams (without the PW).
For the last two academic years (2016/17 and 2017/18), students could choose between two modes of assessment:
  • four individual mini-tests (at Moments I1, I2, I3 and I4), one of the two group tests (Moments G1 and G2, from which they can choose the one with the best grade), and the PW (Moment G3) or
  • a Final Exam (FE) and the PW (Moment G3).
In both cases, the PW had a weight of 15% in the final grade. In case students decide to take the FE, this had a weight of 85%. Otherwise Moment I1 had a weight of 8%, I2 had a weight of 8%, I3 had a weight of 17.5%, I4 had a weight of 50% and Moment G1 or G2 had a weight of 1.5% on the final grade.
There was no minimum score in 2016/17 in any of the assessment components but in 2017/18 a minimum score of 8.5 out of 20 was demanded in moment I4 and in the final exam (normal period of exams).

2.2. Students’ Perceptions Questionnaire about Fluid Transport Systems

To fulfil the main objective of this study, the impact of the changes regarding knowledge assessment changes in a Fluid Mechanics course, it is important to analyse the students’ opinion. Therefore, a questionnaire was developed [19,20] to obtain the students’ perceptions not only regarding the assessment methodology, but also identifying teaching/learning methodologies.

2.2.1. Design of the Questionnaire

The questionnaire was based on a previous one that studied the impact of introducing a PW in the learning process of the Fluid Transport Systems course in the Chemical Engineering degree [20]. Briefly, the questionnaire comprises the following parts:
1. Student’s characterisation (gender, age, academic year, class timetable, class attendance);
2. Student’s perception regarding his/her own learning style and learning style used by the student during the development of the PW. The learning styles used were based on the Kolb theory [21];
3. Technical Skills (TS) acquired through PW; 12 items from which 7 are evaluated according to a 5-point Likert scale (1—Very Poor, 2—Poor, 3—Average, 4—Good, 5—Very Good) and the remaining with a “No/Yes” answer;
4. Concept Understanding (CUnd) with PW development, evidenced by a group of sentences given as multiple choice based on 5 sentences;
5. Soft Skills (SS) acquired through the PW development; 5 items evaluated according to a 5-point Likert scale of agreement (1—strongly disagree, 2—disagree, 3—neither agree nor disagree, 4—agree, 5—strongly agree);
6. Course Organisation and Functioning (COF): 15 items, of which 14 are evaluated according to a 5-point Likert scale of agreement (1—strongly disagree, 2—disagree, 3—neither agree nor disagree, 4—agree, 5—strongly agree) and one with multiple choice;
7. Activity Effectiveness (AE), which compares teaching methodologies: 5 items evaluated according to a 5-point Likert scale of agreement (1—lowest effectiveness to 5—highest effectiveness).

2.2.2. Methodology

The questionnaire, in paper format, was handed out to students and, after an explanation about the objectives of the study, answered it on a voluntary basis. The students completed the questionnaire after a moment of individual evaluation of STFLU course, in the 1st semester of 2016/17 and 2017/18 academic years, which took around 10 minutes. A total of 108 students participated in the study. This corresponds to 90.8% of the enrolled students; moreover, this was all the students that attended classes.

2.2.3. Student Characterisation

Table 1 summarises the main student characteristics. Considering the academic years 2016/17 and 2017/18, most of the students (70.4%) are female. The average age was 19.7 years (SD = 1.44, ranged from 19 to 27 years) and the majority of the respondent students (66.7%) were aged 19 years. Fluid Transport Systems is a curricular unit of the 2nd year; however, six students (around 6%) from the 1st year were permitted to attend the course in advance.
Students attended the course on different timetables (95.3% in daytime and 4.7% after working hours), and 86.9% of students attended the course for the first time, with a maximum of three times (2.8%). Regarding PW, 3.7% of all the students developed this work individually, 20.8% in pairs, 72.6% in groups of three elements and 5.7% in groups of four elements. 49.1% of the students held a PW of this kind for the first time.

3. Results and Discussion

To understand the changes made in the assessment methodology of STFLU, it is important first to analyse the attendance and grades obtained during the last years (Section 3.1). The students’ perceptions with respect to the impact that changes in assessment have in the acquisition and understanding of concepts are presented in Section 3.2.

3.1. Grades and Attendance

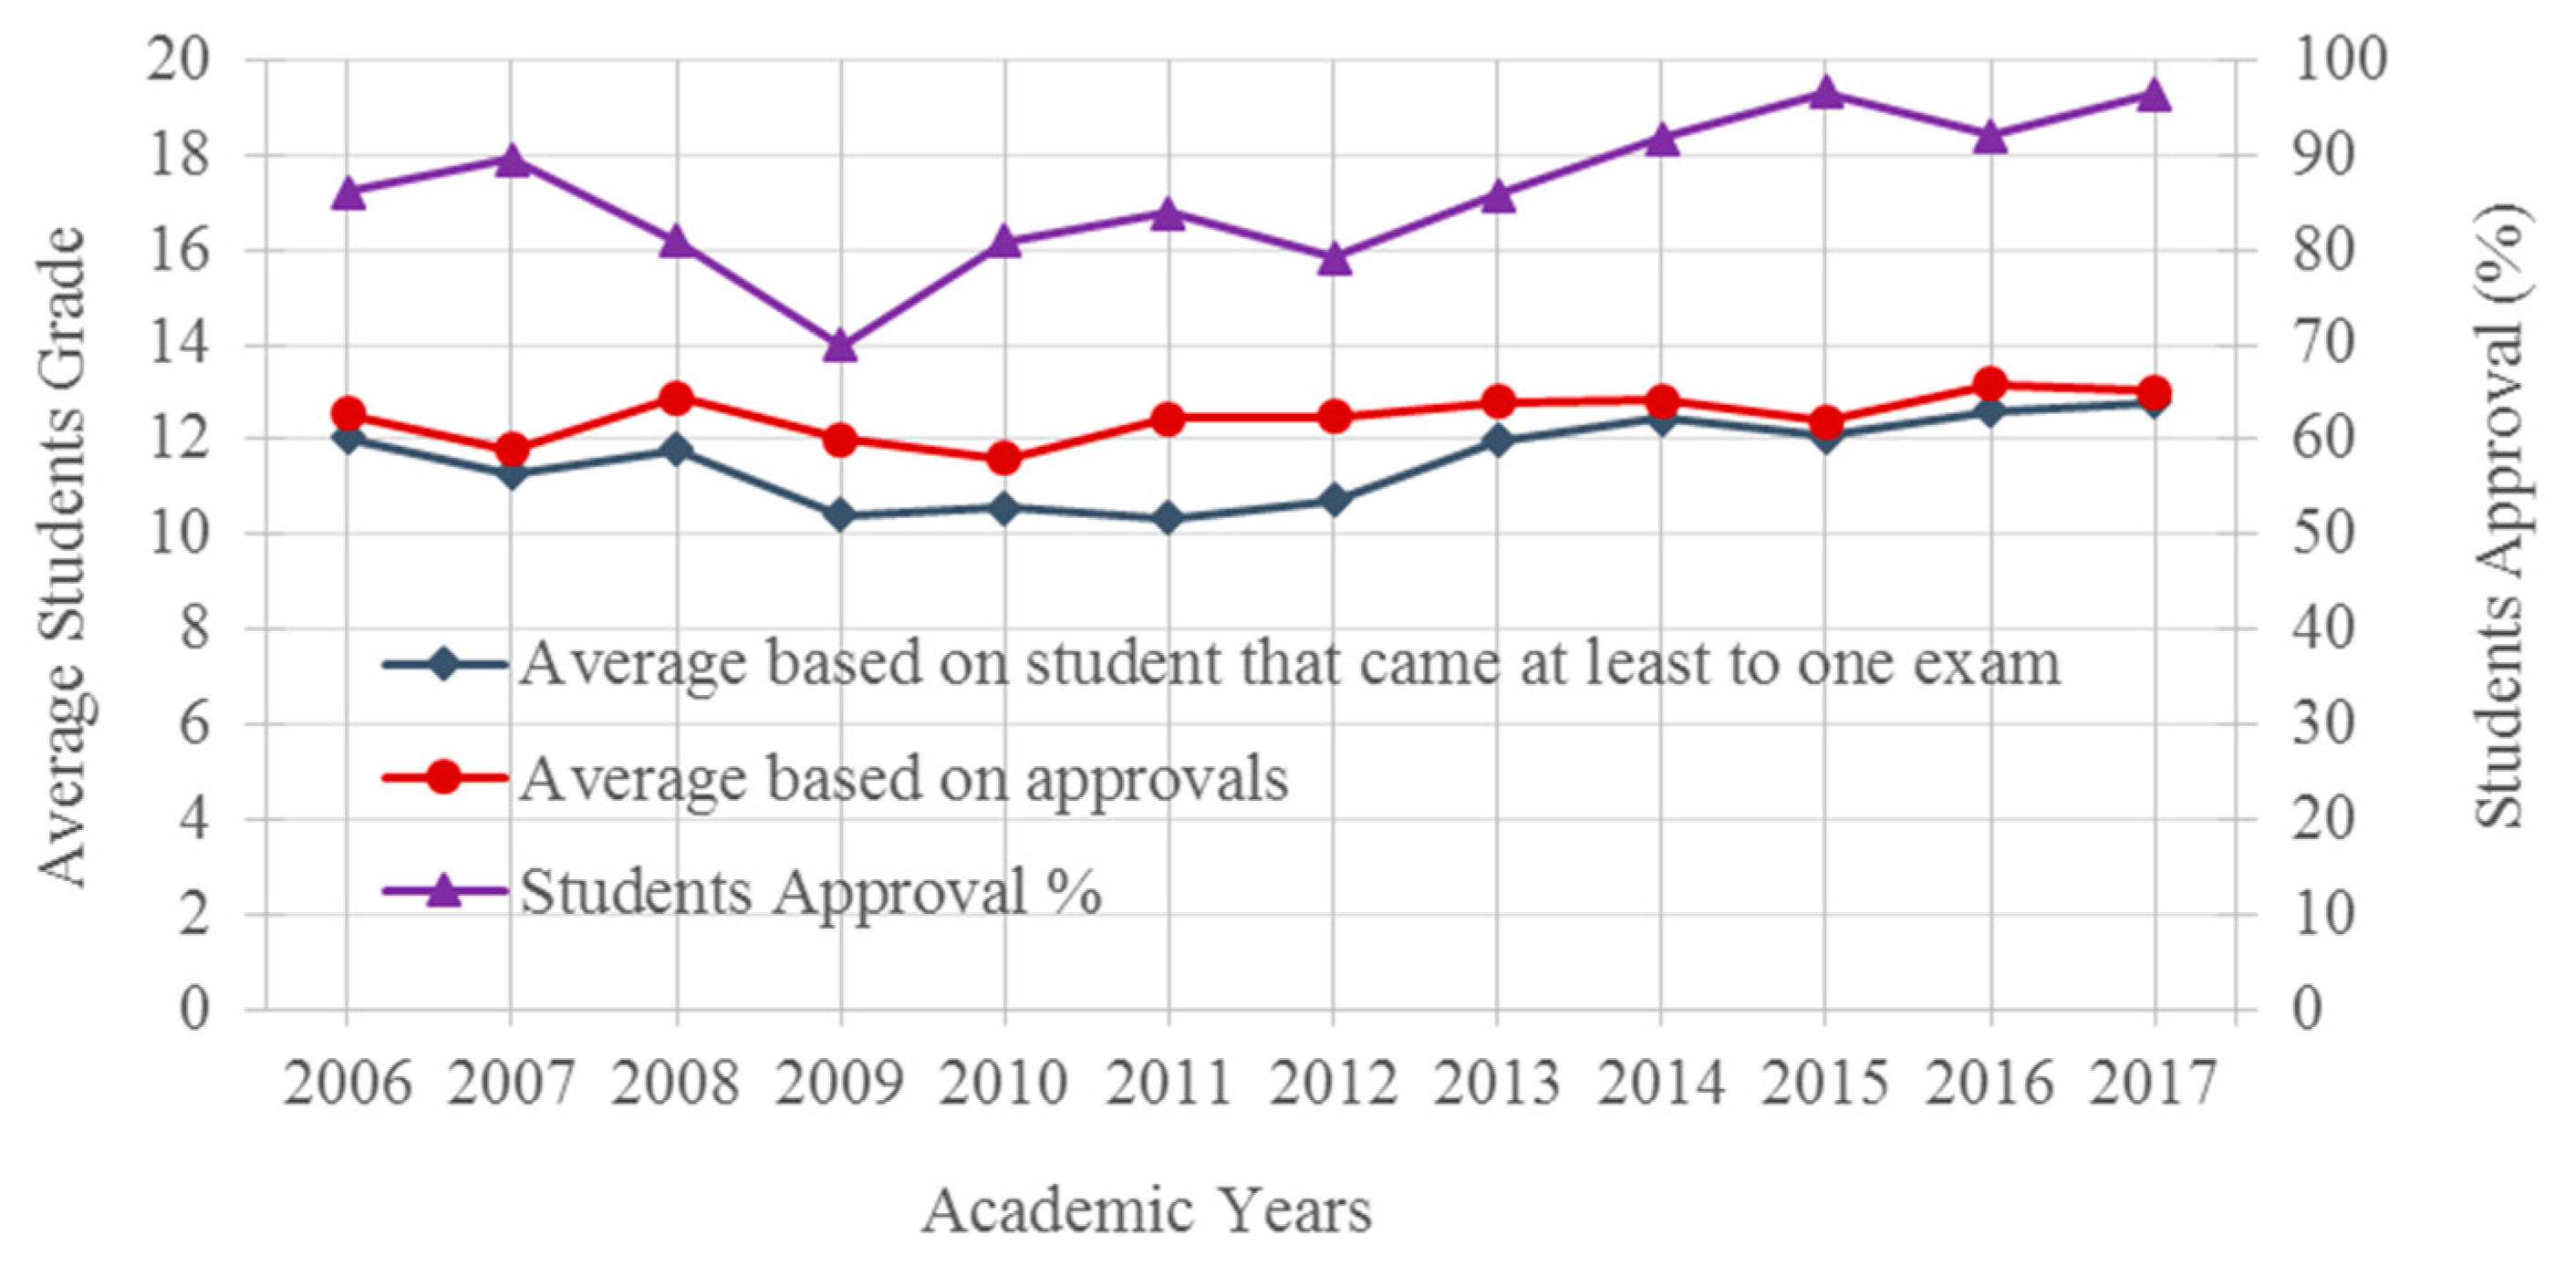
The average final grade for those students who appeared at least at one exam moment, the average final grade and the percentage of students who were approved in the STFLU course, are shown in Figure 2 for the different academic years (from 2006/07 to 2017/18).
According to Figure 2, the lowest approval percentage of students (about 70%) occurred in the academic year 2009/10, the exact year in which PW was not done. The average student grade based on approvals did not change greatly during that period and was around 12 out of 20. It would be premature, based on this amount of data, to correlate this value with the absence of PW in 2009/10. However, for the two last academic years (2016/17 and 2017/18), it is evident that there is a similarity of the average grade based on approvals when compared with the average grade based on students that came at least to one exam. Therefore, almost all students who presented themselves to an evaluation had a positive grade. This can also be reinforced by the analysis of Figure 3.
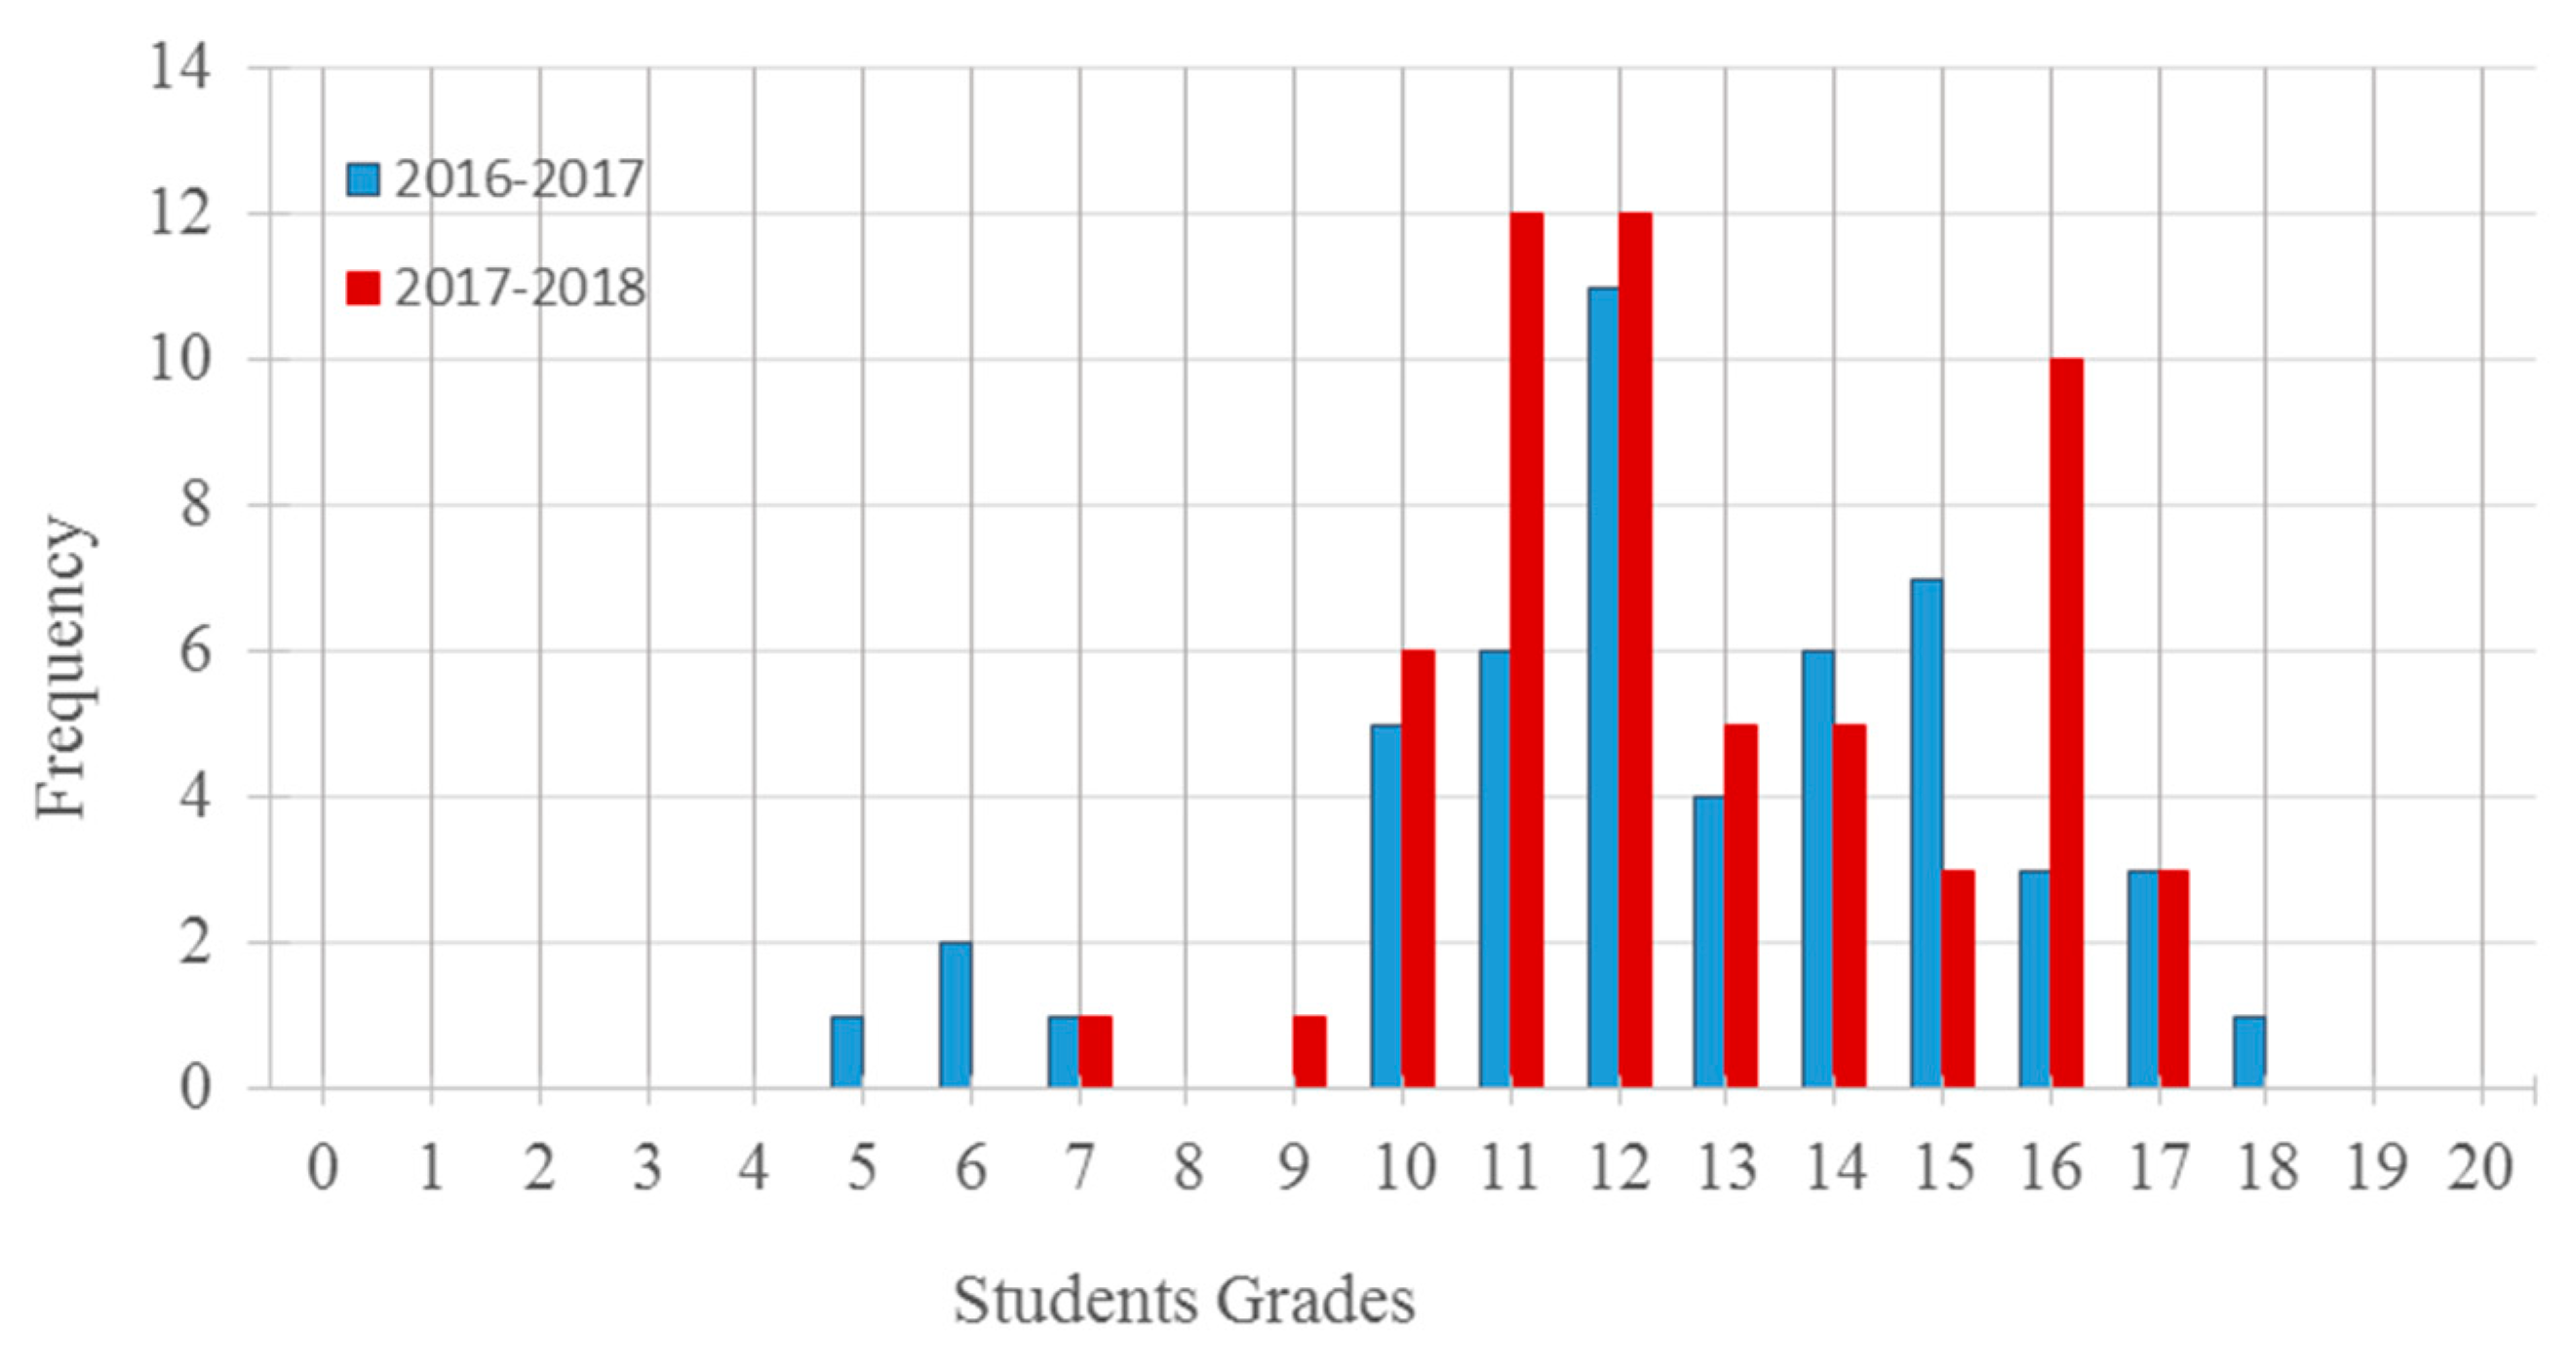
Figure 3 shows the final grade distribution (number of students that obtained each of the possible grades between 0 and 20) for the academic years 2016/17 and 2017/18. There were few failing grades in these two academic years (grades lower than or equal to 9), corresponding to 3.4%.
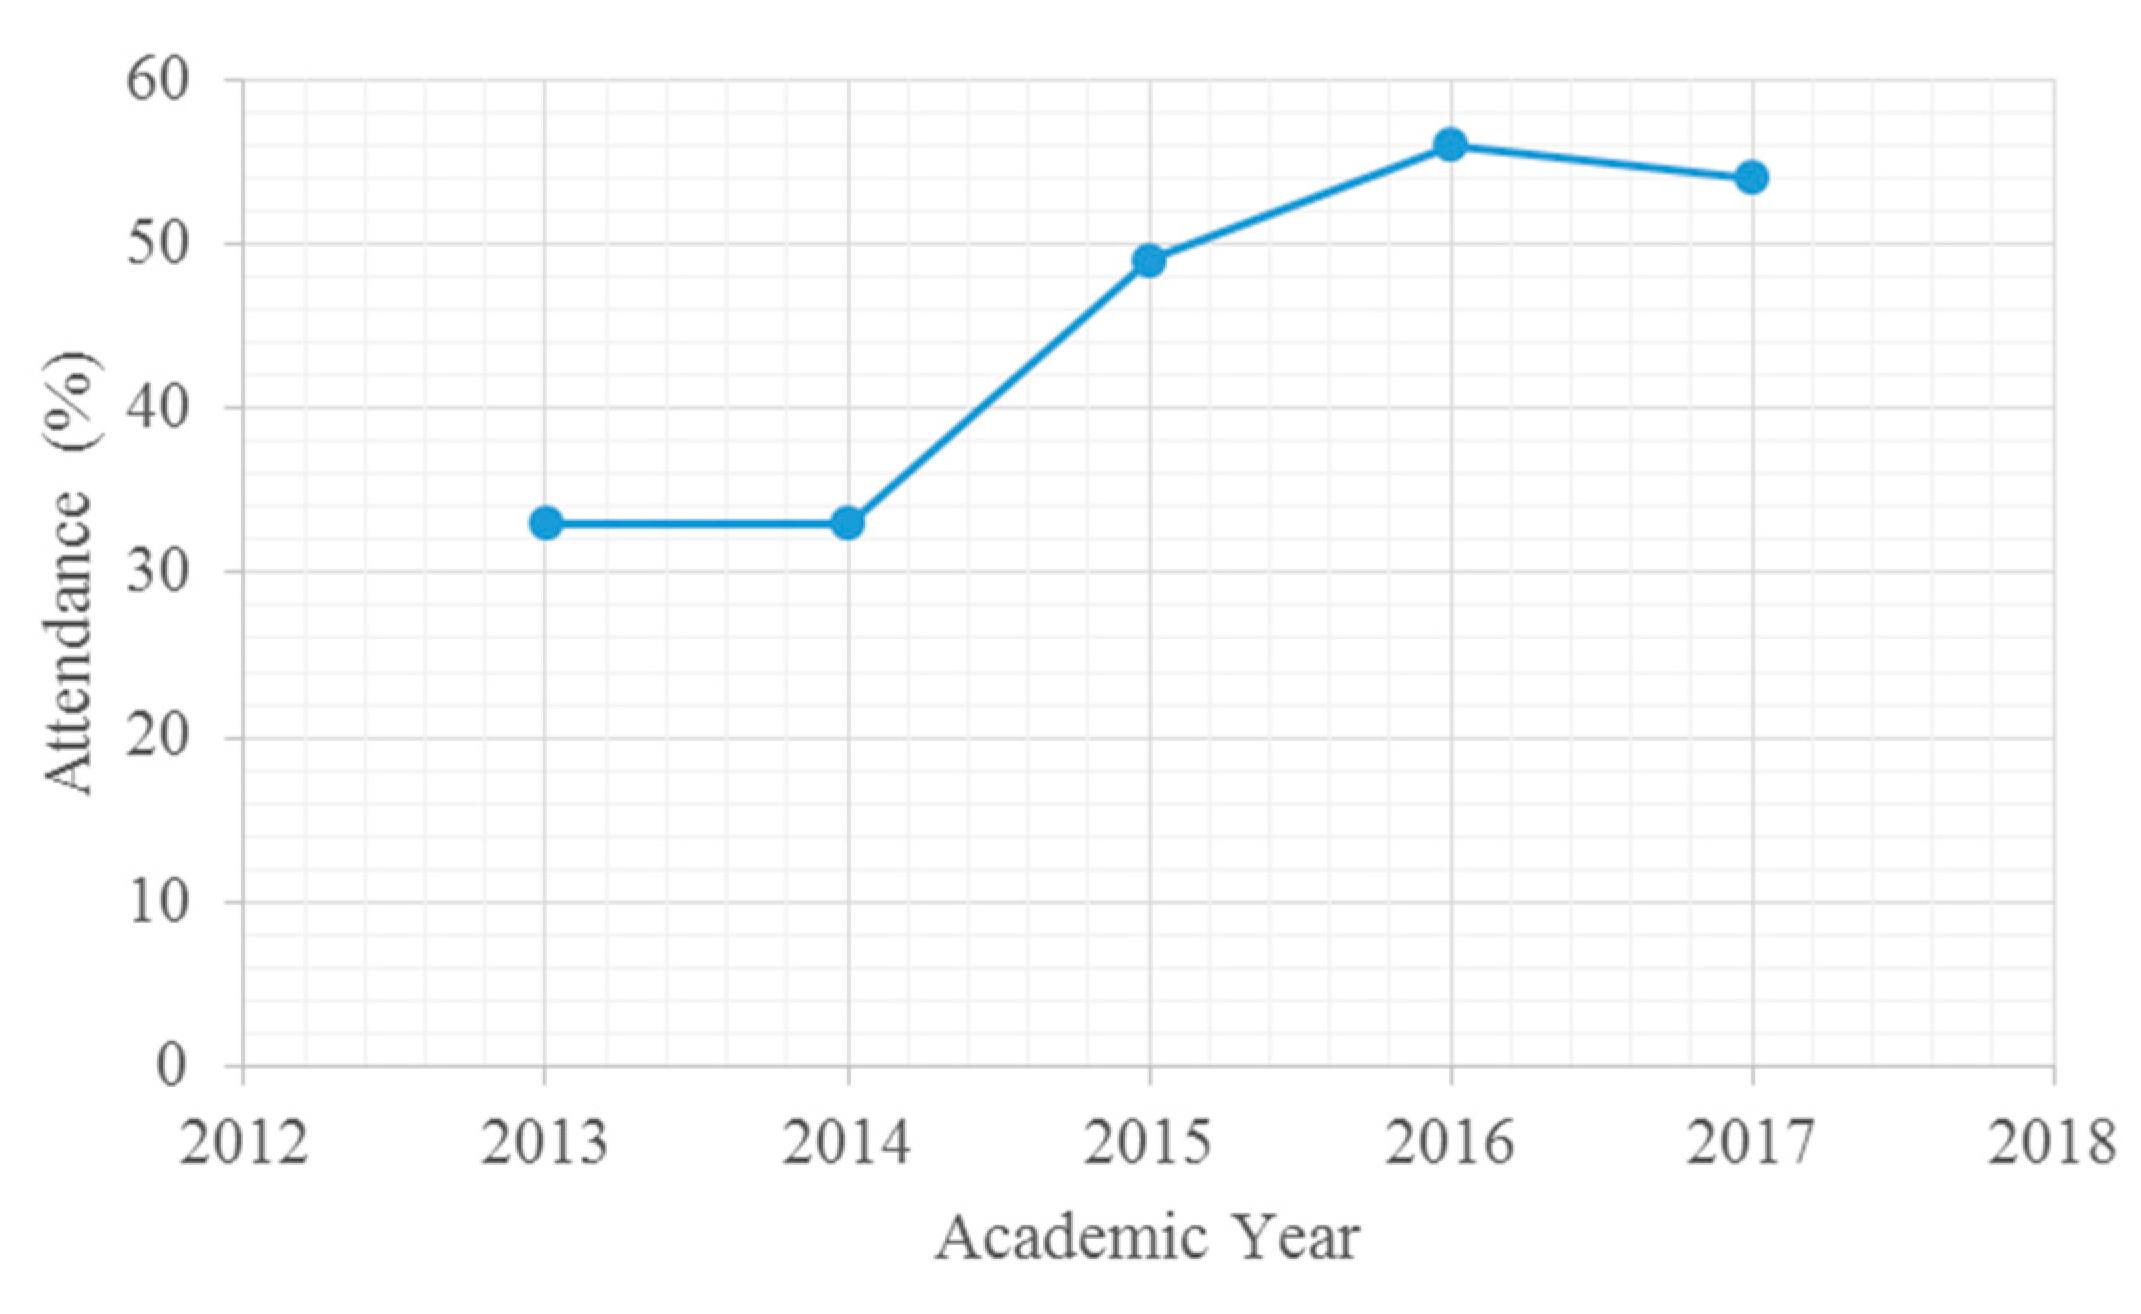
Figure 4 shows the average attendance (to theoretical classes) during the academic years between 2013/14 and 2017/18. The attendance data before 2013/14 were not available.
As attendance at theoretical-practical classes (TP) is mandatory, and the student can only miss 1/3 of the classes (about 5 in 15 classes), attendance is high. According to Figure 4, the level of attendance at theoretical classes was only higher than fifty percent in the last two academic years, which coincides with the period in which more changes were made to the assessment methodology. In that period, six more points of assessment were introduced.
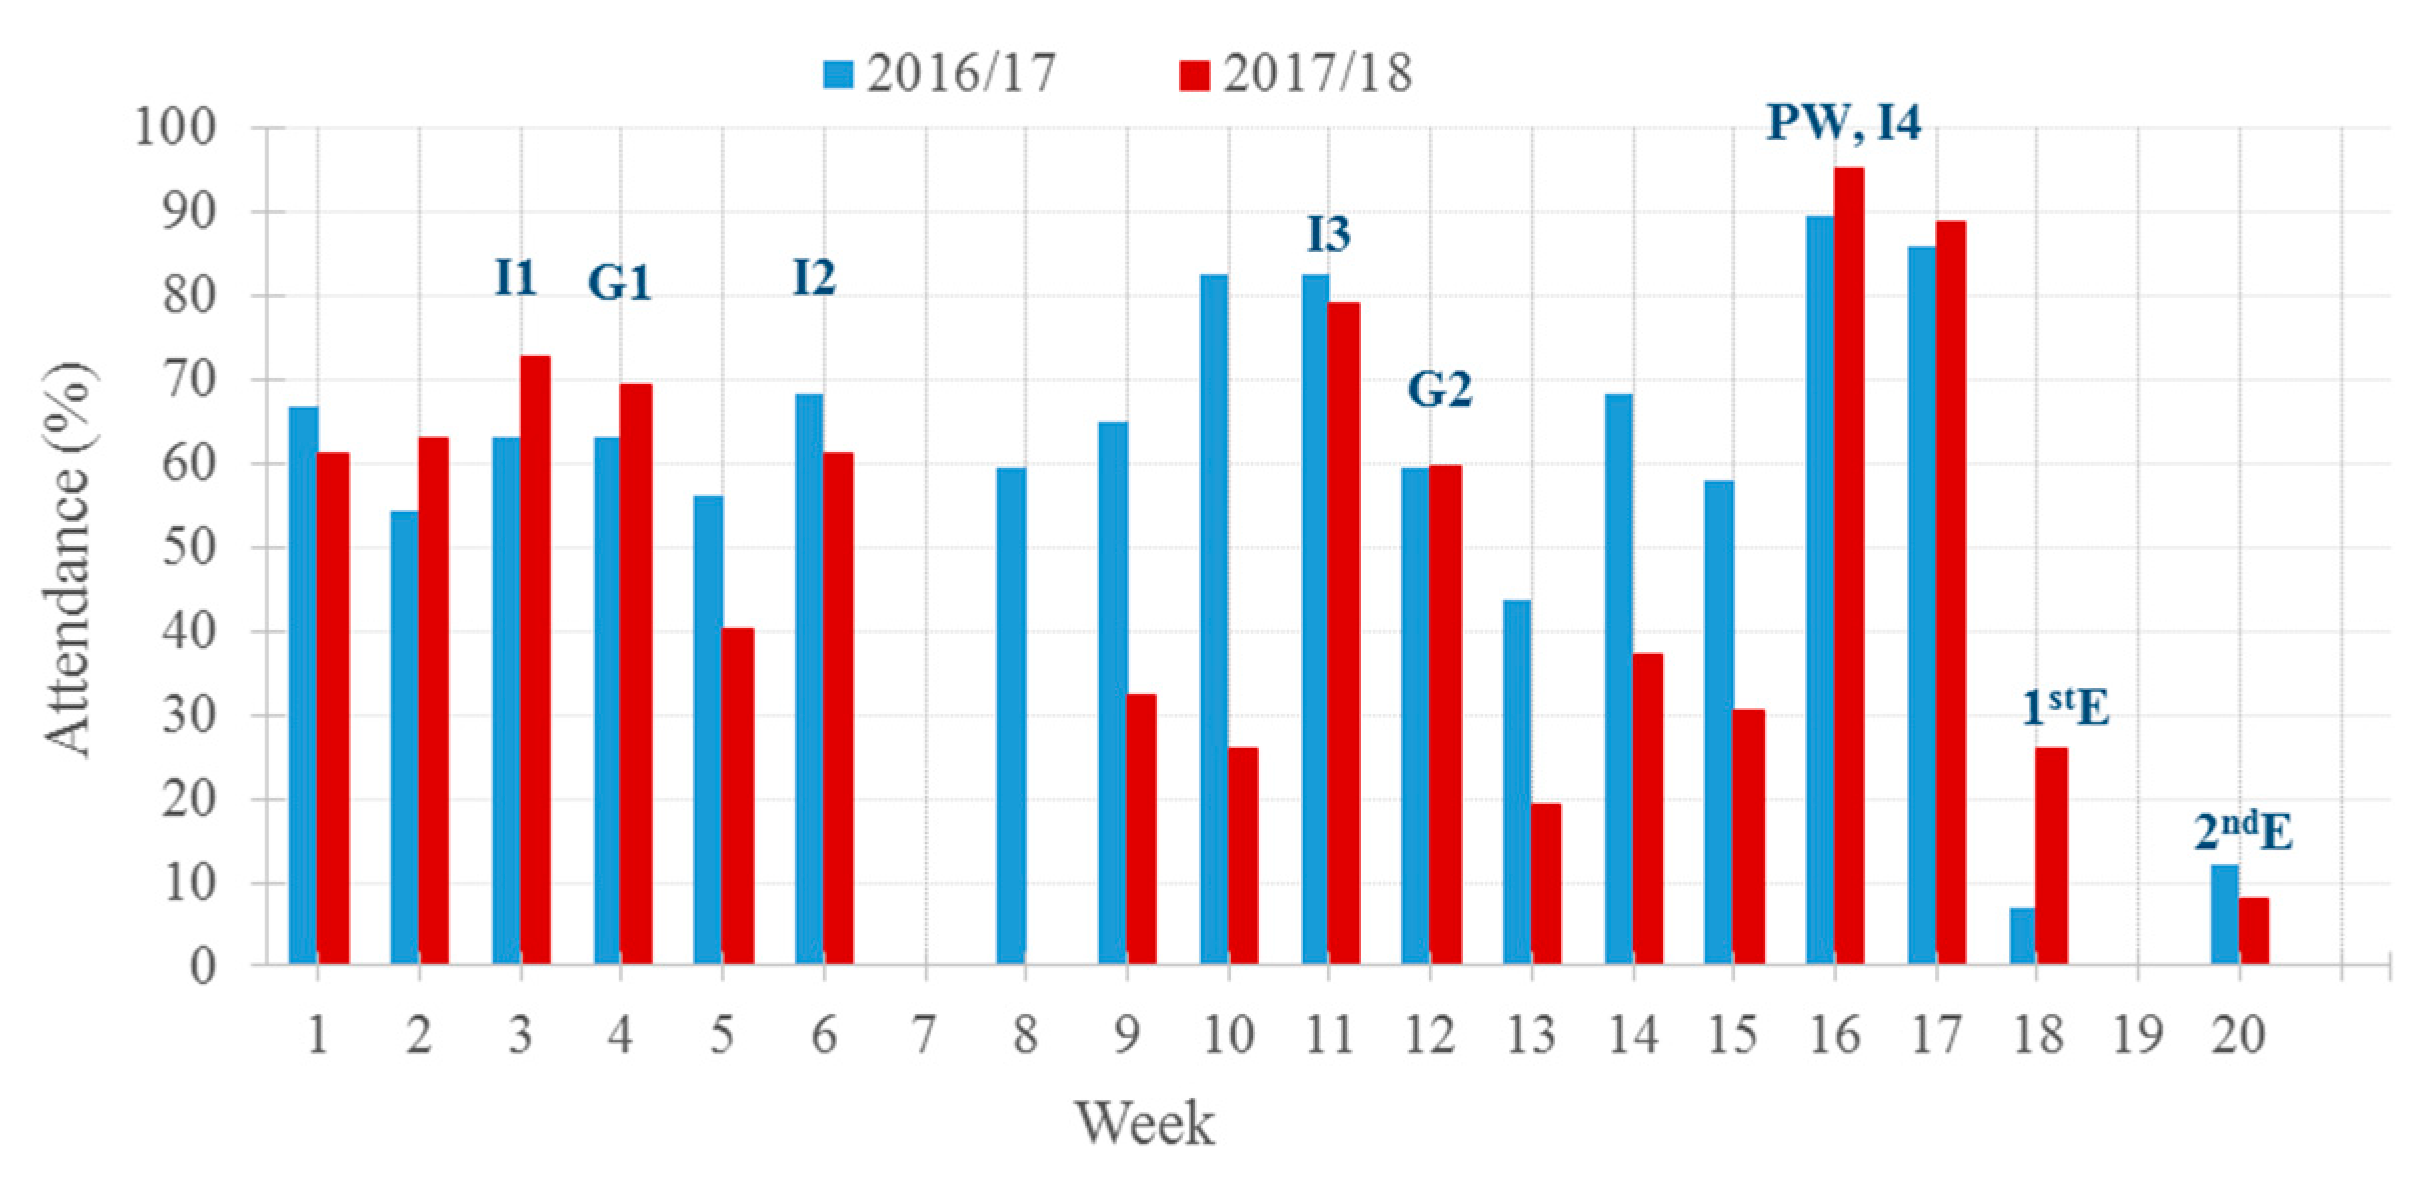
Figure 5 shows the attendance for each theoretical class during the academic years 2016/17 and 2017/18 in more detail.
It is evident that the highest attendance at theoretical classes corresponds to the evaluation days (see the moments identified in Figure 5). Strangely, students missed classes during the week before the assessment moment (see moment I2). However, as stated by Gurung [22], some students tend to do what they should not do, namely, skip classes. Moreover, this behaviour appears not to have had a negative effect on the students’ performance, since the majority of them passed the attendance requirement. In addition, this can be confirmed by the low attendance at moments 1st E (normal exam) and 2nd E (supplementary exam).
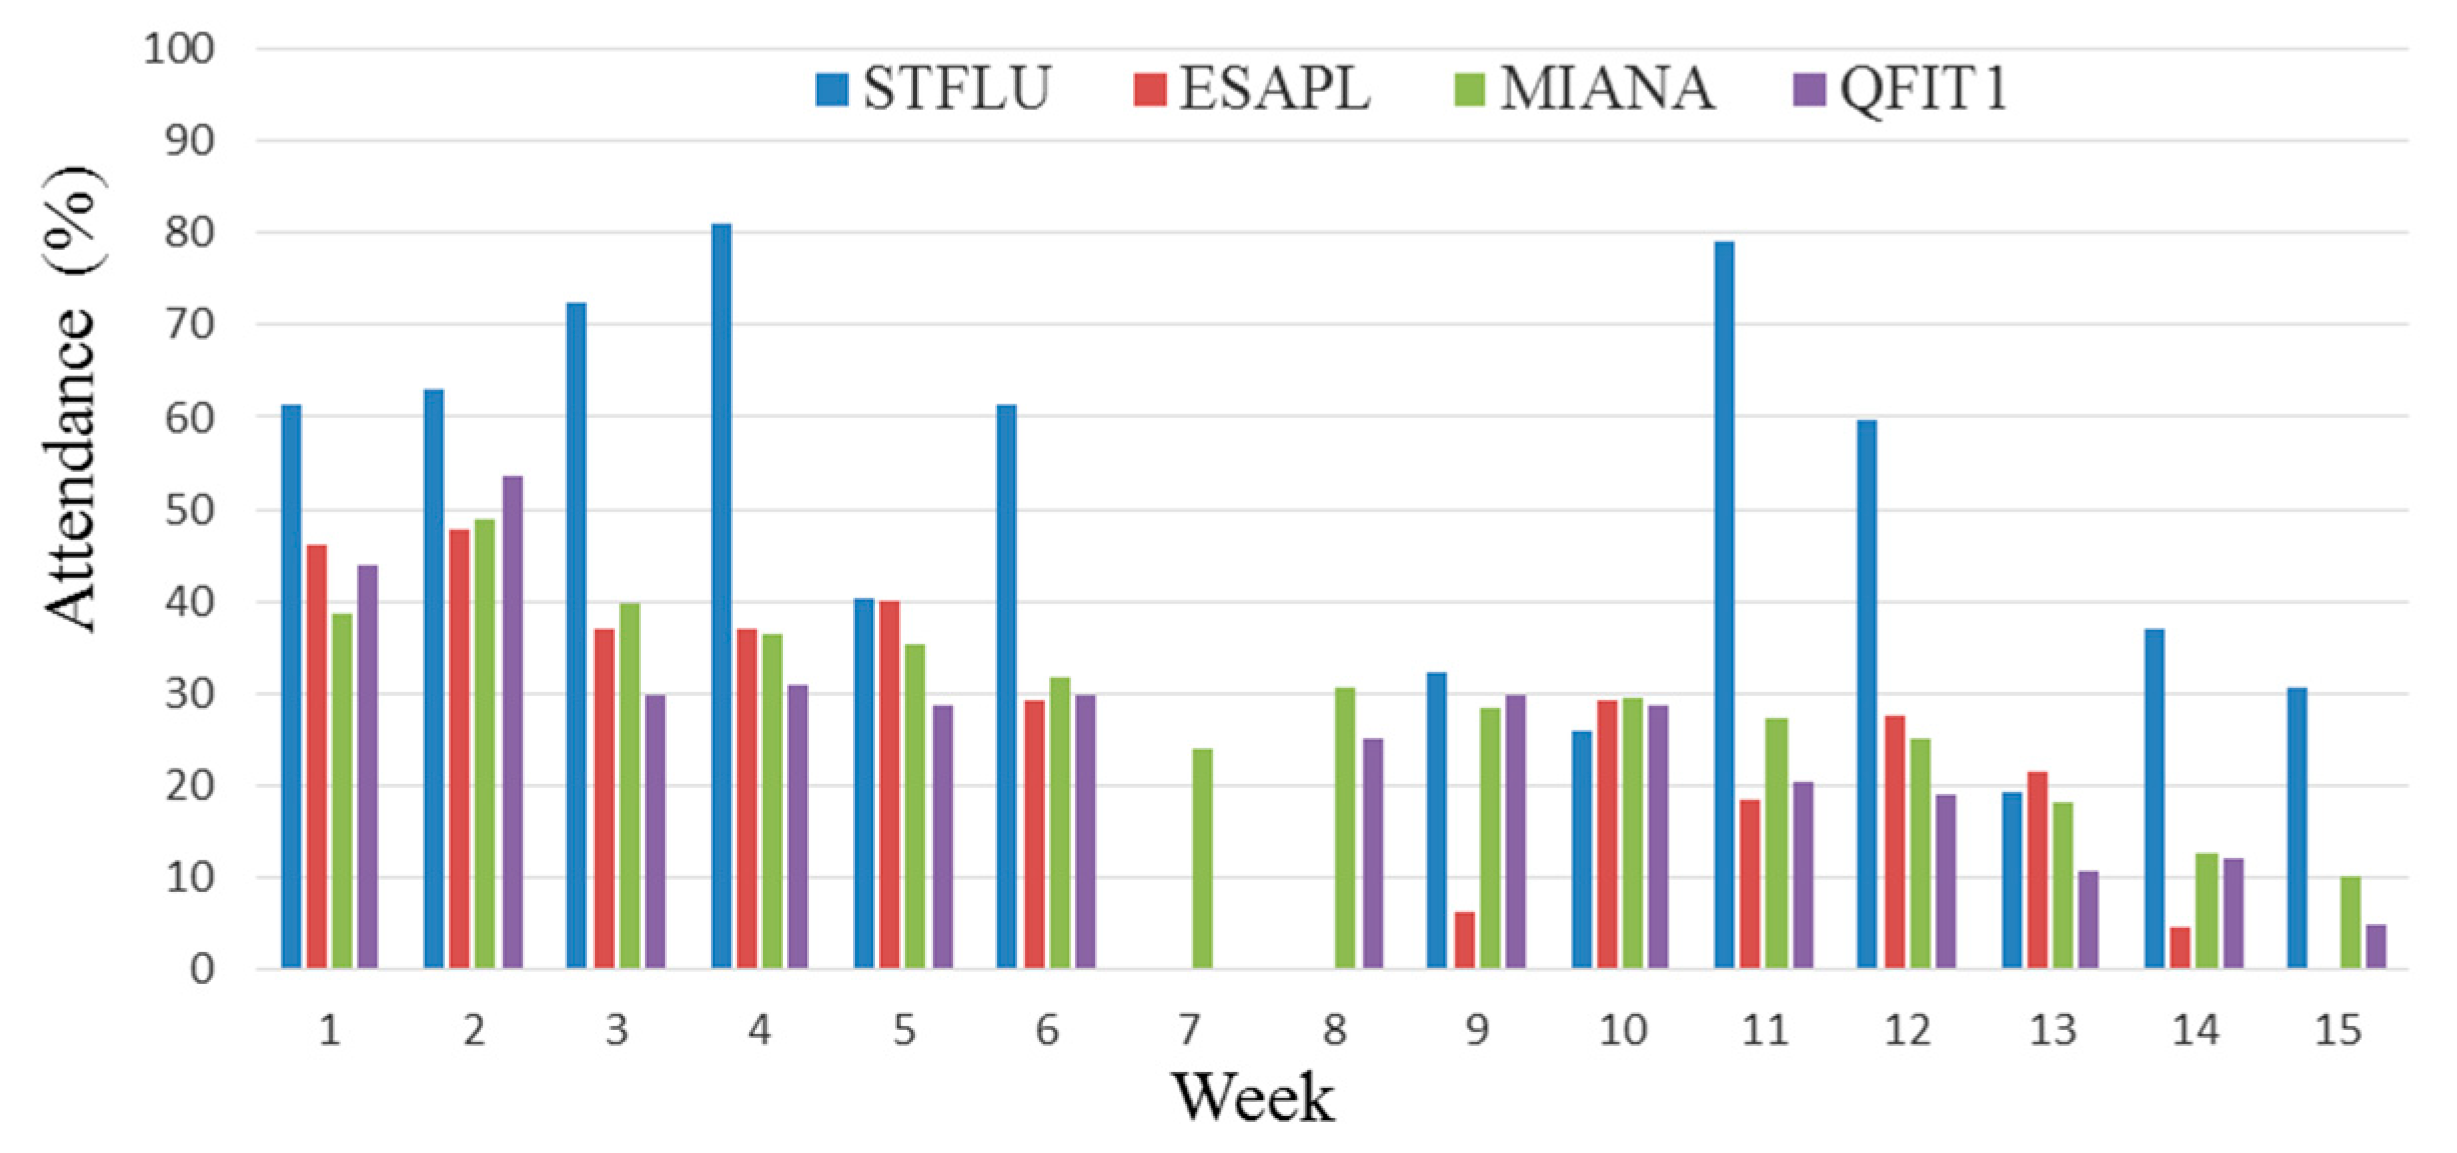
Comparing year 2016/17 to 2017/18, a higher attendance in the 1st E (1st Exam) in the year 2017/18 can be seen, because a minimum frequency of attendance was instituted. The low attendance at theoretical classes that have no moments of evaluation in 2017/18 when compared to 2016/17 seems to be a characteristic of the year. When comparing the attendance of all courses of the 2nd year/1st semester (Figure 6), it is obvious that low attendance was a common factor among all of them. This difference observed between 2016/17 and 2017/18 seemed not to influence either the average attendance (Figure 4) or the students’ mean final grade (Figure 2). Based on these numbers, and as confirmed in the study by Alhija [23], students perceived assessment as the most important of the five teaching dimensions (goals to be achieved, relations with students, teaching methods and characteristics, assessment, long-term student development); therefore, they tended not to miss these moments. The teaching methods were of as little importance as the goals to be achieved and the relations with students.
So the assessment methodology changed the students’ attendance at theoretical classes significantly. In general, the majority of the students only attended theoretical classes when they were forced to do it!
This, in a certain way, is in line with the thoughts of Gurung [22] with respect to the idea that teachers can modify the method to assess different levels of classes, and that they should help students to prepare more effectively for exams or other types of assessment. In addition, they can also inform students about study techniques that may be more beneficial to them, since the most important thing is how students study.

3.2. Student Perceptions

The results analysis of the students’ perceptions regarding the STFLU course are presented and discussed below. The SPSS statistical tool was used for data analysis [21].
As the data collected from the students do not follow normality (normality was checked with the Shapiro-Wilk test for normality of the data), non-parametric tests were considered in the analysis and to be able to provide answers to the research questions raised (Mann-Whitney (U), for the comparison of two independent samples means as an alternative to the independent sample t-test, and the Spearman’s correlation coefficient (rS) to study and measure the strength of the relationship between two ranked variables/items). A significance level of 5% was considered, meaning that differences were considered to be statistically significant for p < 0.05. Both tables and figures are used, when pertinent, to summarise information and to illustrate specific trends or features.
The following research questions will be answered in the subsequent sections:
RQ—How do students perceive the assessment methodology?
sRQ1—How important is the PW in the students’ learning process?
sRQ2—Is the PW perceived as an autonomous tool?
sRQ3—Is the PW effective at preparing students for the challenges of professional life?
sRQ4—Which competences did students acquire with the PW?
sRQ5—Are the students confident with the knowledge acquired with the PW to size a proper fluid transport system?

3.2.1. How Do Students Perceive the Assessment Methodology? (RQ)

To answer RQ, from the 15 items evaluated in part 6 of the questionnaire (course organisation and functioning, COF), 14 will be analysed (COF1 to COF14). Furthermore, the individual (Ii) and final students’ grades will be related with some of these items allowing to understand possible relations between both. The 14 items under analysis are:
COF1: The examples used by the teachers help the understanding of the contents.
COF2: The teachers try to contextualise the contents in a professional perspective.
COF3: I am interested in learning the contents of the CU.
COF4: I participate in discussions in the classroom.
COF5: The quantity of contents covered in the CU is adequate.
COF6: The practical works/exercises indicated are appropriate to the contents covered in the CU.
COF7: In general, the CU meets my expectations.
COF8: The CU is essentially theoretical.
COF9: Theory is important to understand the practical applications.
COF10: The practical applications proposed are sufficient to understand the concepts.
COF11: The practical applications proposed are sufficient to understand the real applicability of the concepts.
COF12: The evaluation through questions/problems and small tests during theoretical lessons was beneficial to my learning.
COF13: For the intermediate assessment, I prefer several questions/problems and small tests during theoretical classes.
COF14: For the intermediate assessment, I prefer to carry out a single moment of evaluation/test.
Despite a general downward trend, on average, from the 2016/17 academic year to 2017/18, the students’ evaluations in these COF items show similar behaviour (Table 2), i.e., there was no statistically significant change in the students’ evaluation between the two academic years (for all the items under analyses p > 0.05). Since no significant differences were obtained, from here on, the results and analysis will be discussed as a whole.
The lowest result obtained was for items COF14 (For the intermediate assessment, I prefer to carry out a single moment of evaluation and test) and COF8 (The CU is essentially theoretical), with average values lower than 3, showing a disagreement in opinion regarding these two items. However, this behaviour in itself suggests a positive perception regarding the change in the assessment of the theoretical topics such as Fluid Mechanics, making them more practical.
Conversely, the COF items with the highest mean (values higher than 4, showing an agreement in opinion) was COF1 (The examples used by the teachers help the understanding of the contents), COF6 (The practical work/exercises indicated are appropriate to the contents covered in the CU), COF2 (The teachers try to contextualise the contents in a professional perspective), COF3 (I am interested in learning the contents of the CU), COF7 (In general, the CU meets my expectations), COF5 (The quantity of contents covered in the CU is adequate) and COF12 (The evaluation through questions/problems and small tests during theoretical lesson was beneficial to my learning). COF13 (For the intermediate assessment, I prefer several questions/problems and small tests during theoretical classes) presents similar results to COF12, although slightly lower. This could indicate that there is a difference between what students prefer and what is beneficial in terms of learning for them. These results are to some degree in line with the results obtained by Struyven and co-authors in their review work [24], in that what students perceive regarding assessment seems to have a considerable impact on students’ learning approaches, and vice versa.
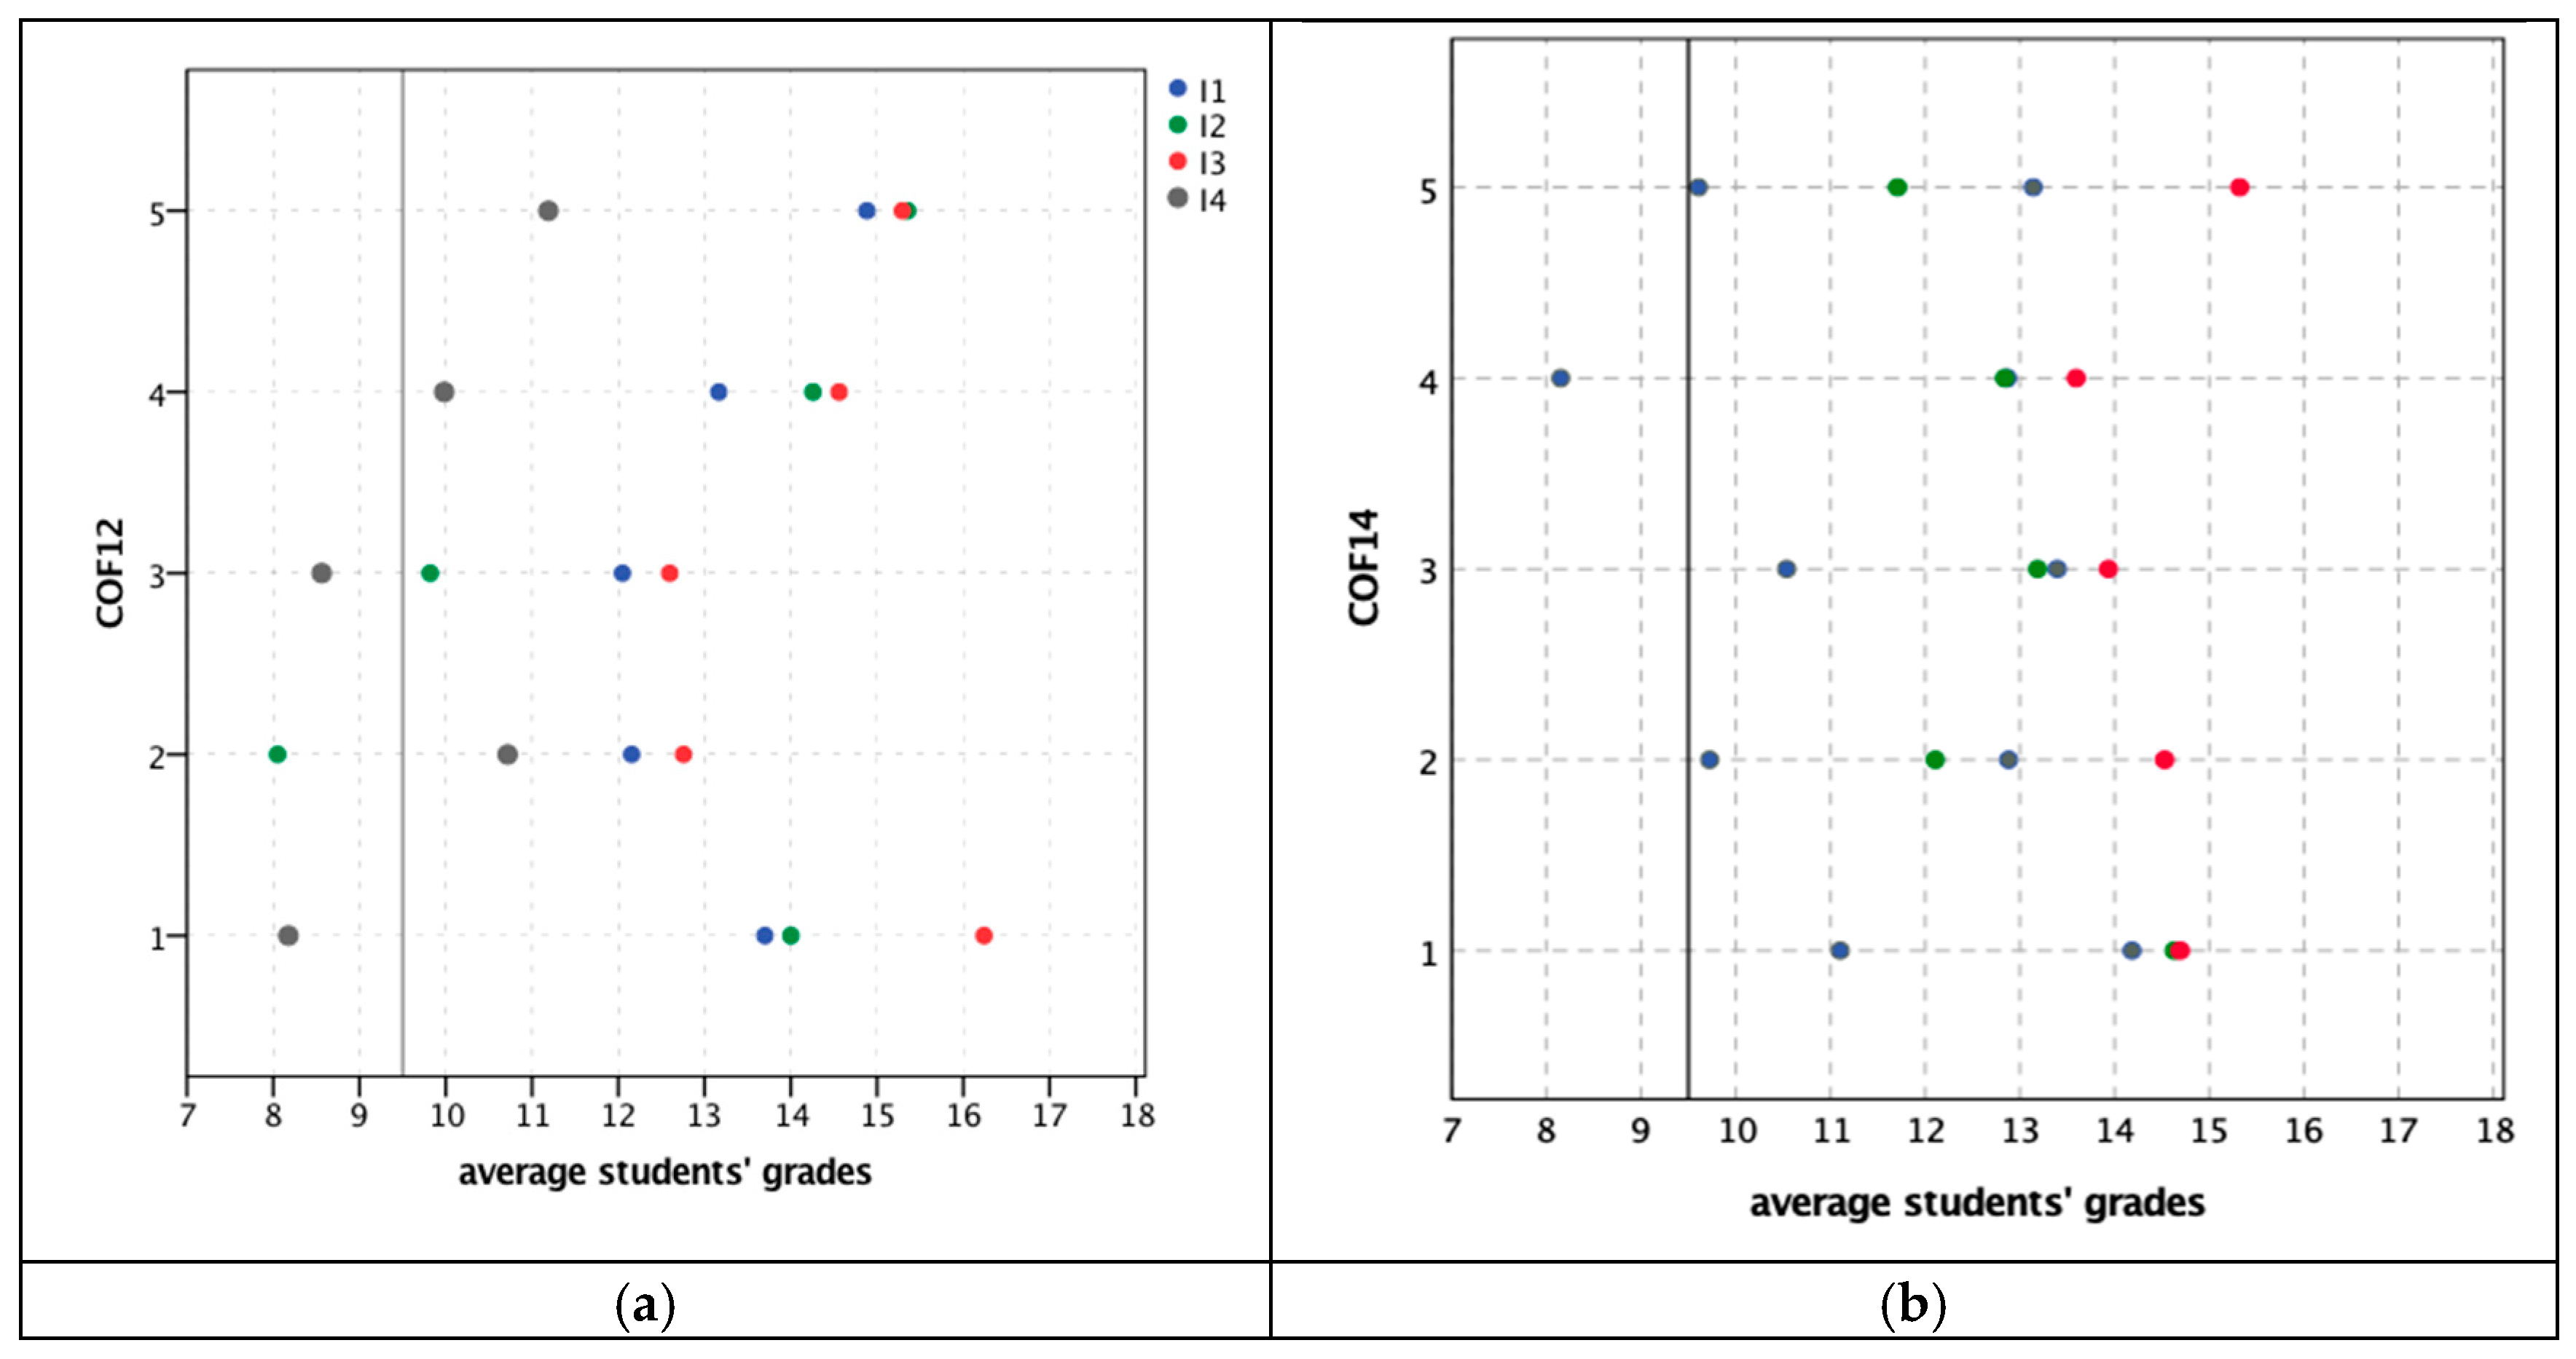
To understand if there is a relationship between the individual (Ii) and students’ final grades with respect to the perception that students have regarding assessment methodology, some of the COF items (COF12 and COF14) will be used. Figure 7 shows the average of the students’ grades obtained in the four individual assessment moments against the students’ perceptions regarding items COF12 and COF14. The individual assessment is the core of the evaluation, and accounts for 83.5% of the final grade (Figure 1).
As can be seen, there is no defined pattern between the grades in different moments and agreement level with the COF12 item statement. For example, students that are strongly in disagreement (1) with “The evaluation through questions/problems and small tests during theoretical lessons was beneficial to my learning” obtained the highest and the lowest grades (on average). However, all the students that are in complete agreement (5) obtained a positive grade (average ranged from 11 to around 15). Regarding COF14, “For the intermediate assessment, I prefer to carry out a single moment of evaluation and test”, the behaviour obtained was more dispersed, making the interpretation more difficult (Figure 7b). That is, for the same individual grade (Ii), students show different evaluations.
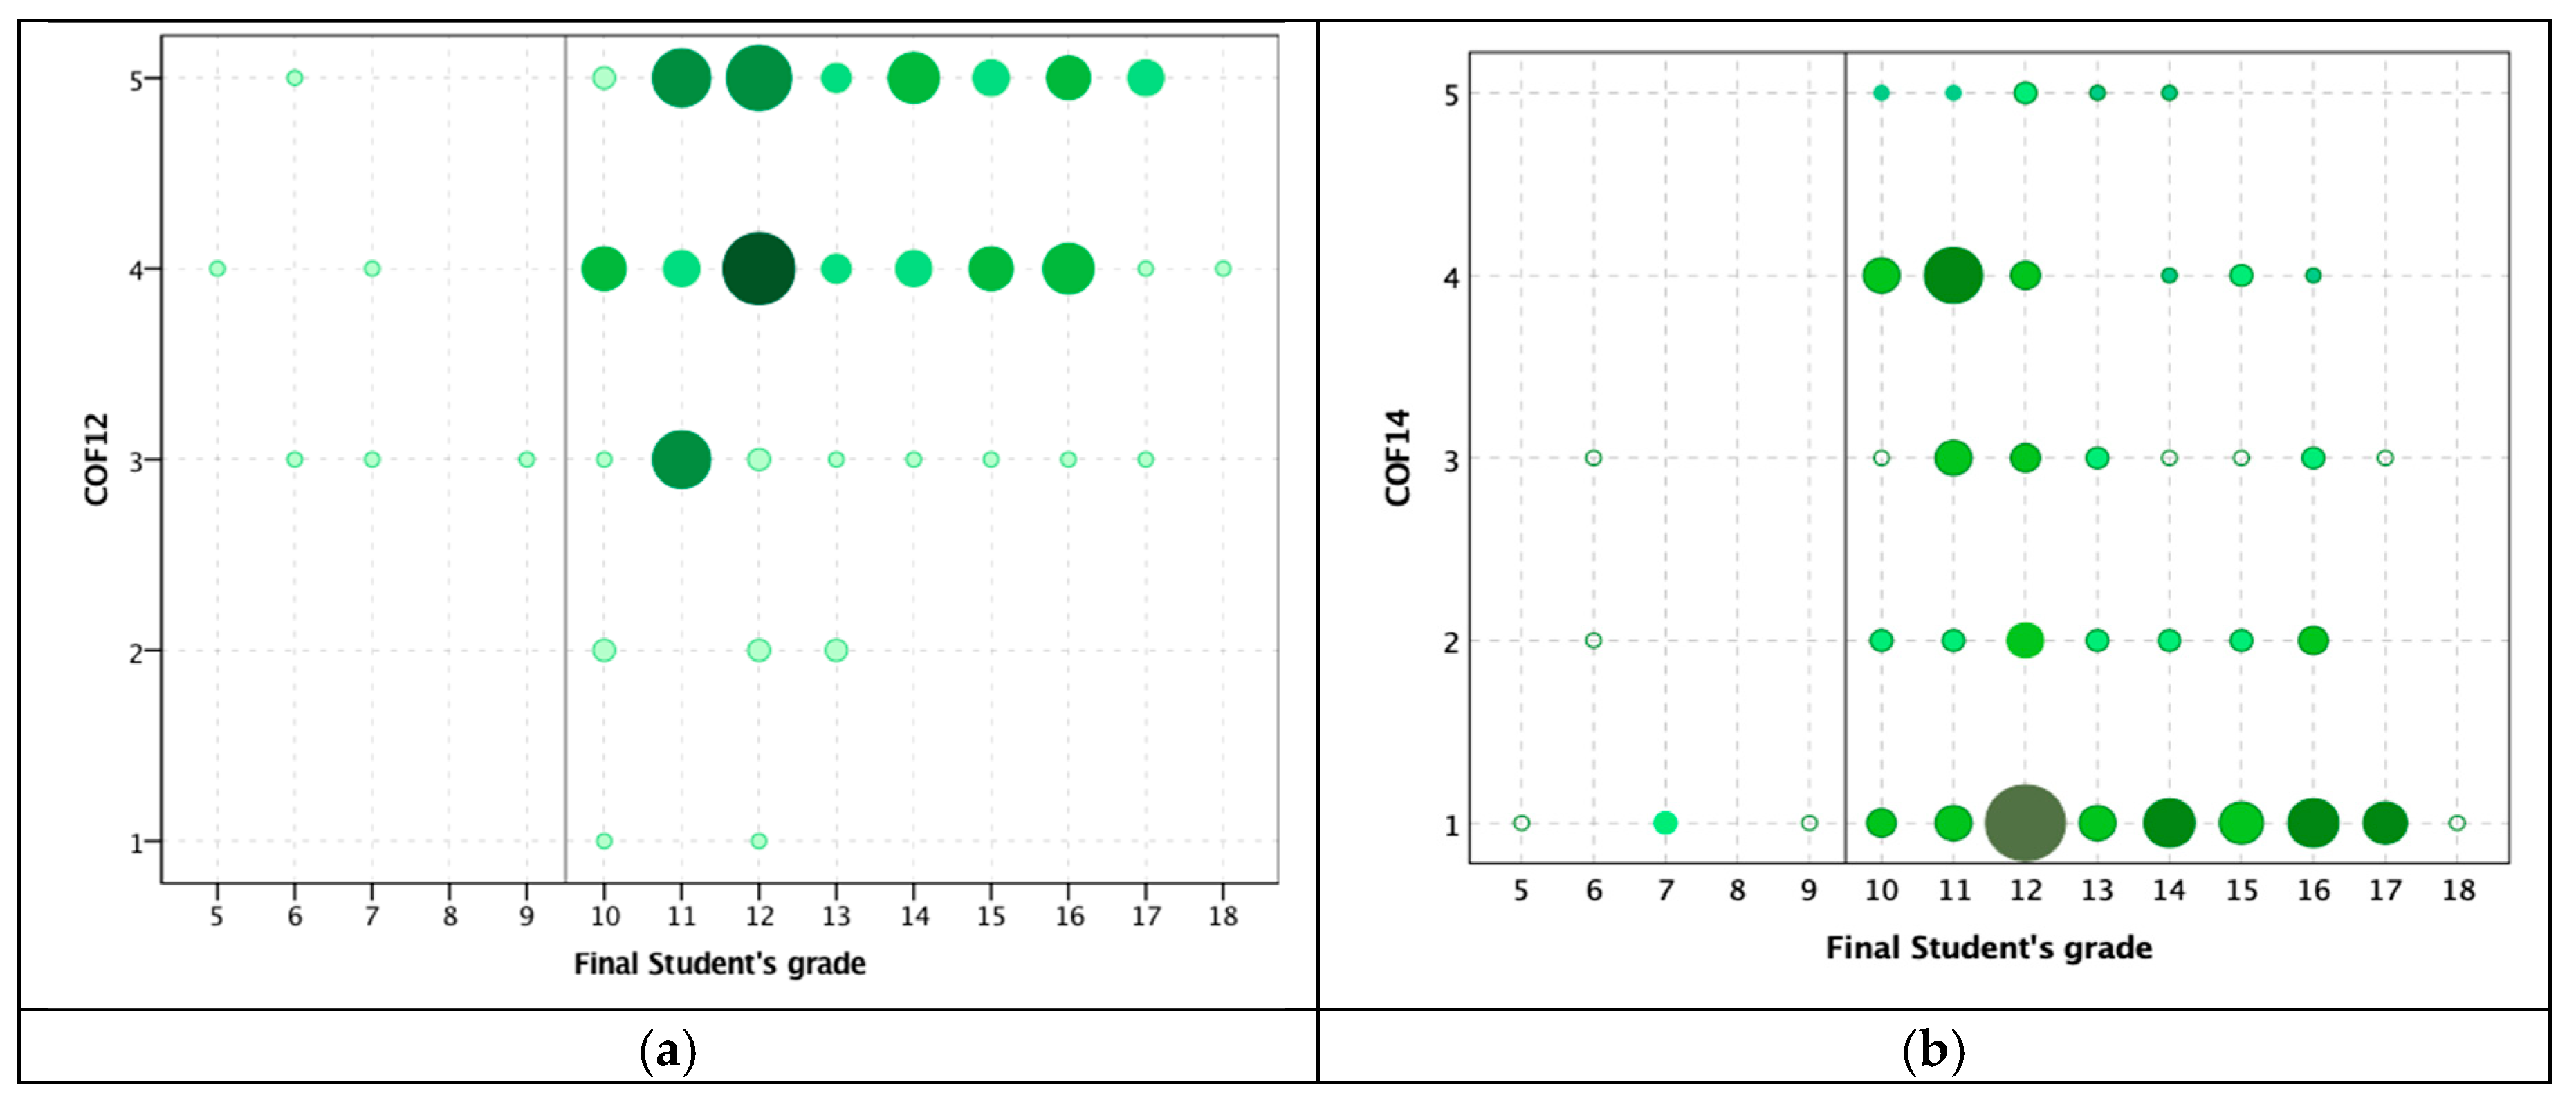
By considering the students’ final grades, the distribution according to the corresponding students’ items evaluation undergoes some changes (Figure 8). Each mark size and colour intensity shown in Figure 8 reflects the number of students in each grid cell (the darkest and largest mark corresponds to 9 students, and then decreases successively until 1). Notice that the levels of agreement for COF12 (Figure 8a) for the 5.6% students that failed (final grade ≤ 9.5) were somewhat positive (3—neither agree nor disagree, 4—agree, 5—strongly agree). It is important, however, to emphasise that 72.6% of students with final grades ≥ 9.5 agree and strongly agree that the evaluation adopted was beneficial to their learning. Figure 8b shows an opposite evaluation behaviour when looking to the opinions regarding intermediate assessment, where the majority of students (1—strongly disagree, 2—disagree) do not prefer to carry out a single moment of evaluation and test (COF14) independently of the final grade.

3.2.2. How Important is PW in the Students’ Learning Process? (sRQ1)

As a measure of how important students perceived the PW to be in their learning process, a set of technical skills acquired with the PW (part 3 of the questionnaire, TS items) was considered:
TS4: PW is a useful tool in supporting the CU,
TS6a: Overall, the PW helped me to assimilate the concepts transmitted throughout the semester,
TS6b: Overall, the PW has made my learning more objective,
TS6d: Overall, the PW motivated me to the CU,
TS7: Overall, I felt motivated to carry out the PW,
TS9: The PW motivated me to learn the CU contents,
TS10: Would you recommend doing a PW as a teaching/learning activity?
The two last items (TS9 and TS10) are “No/Yes” questions.
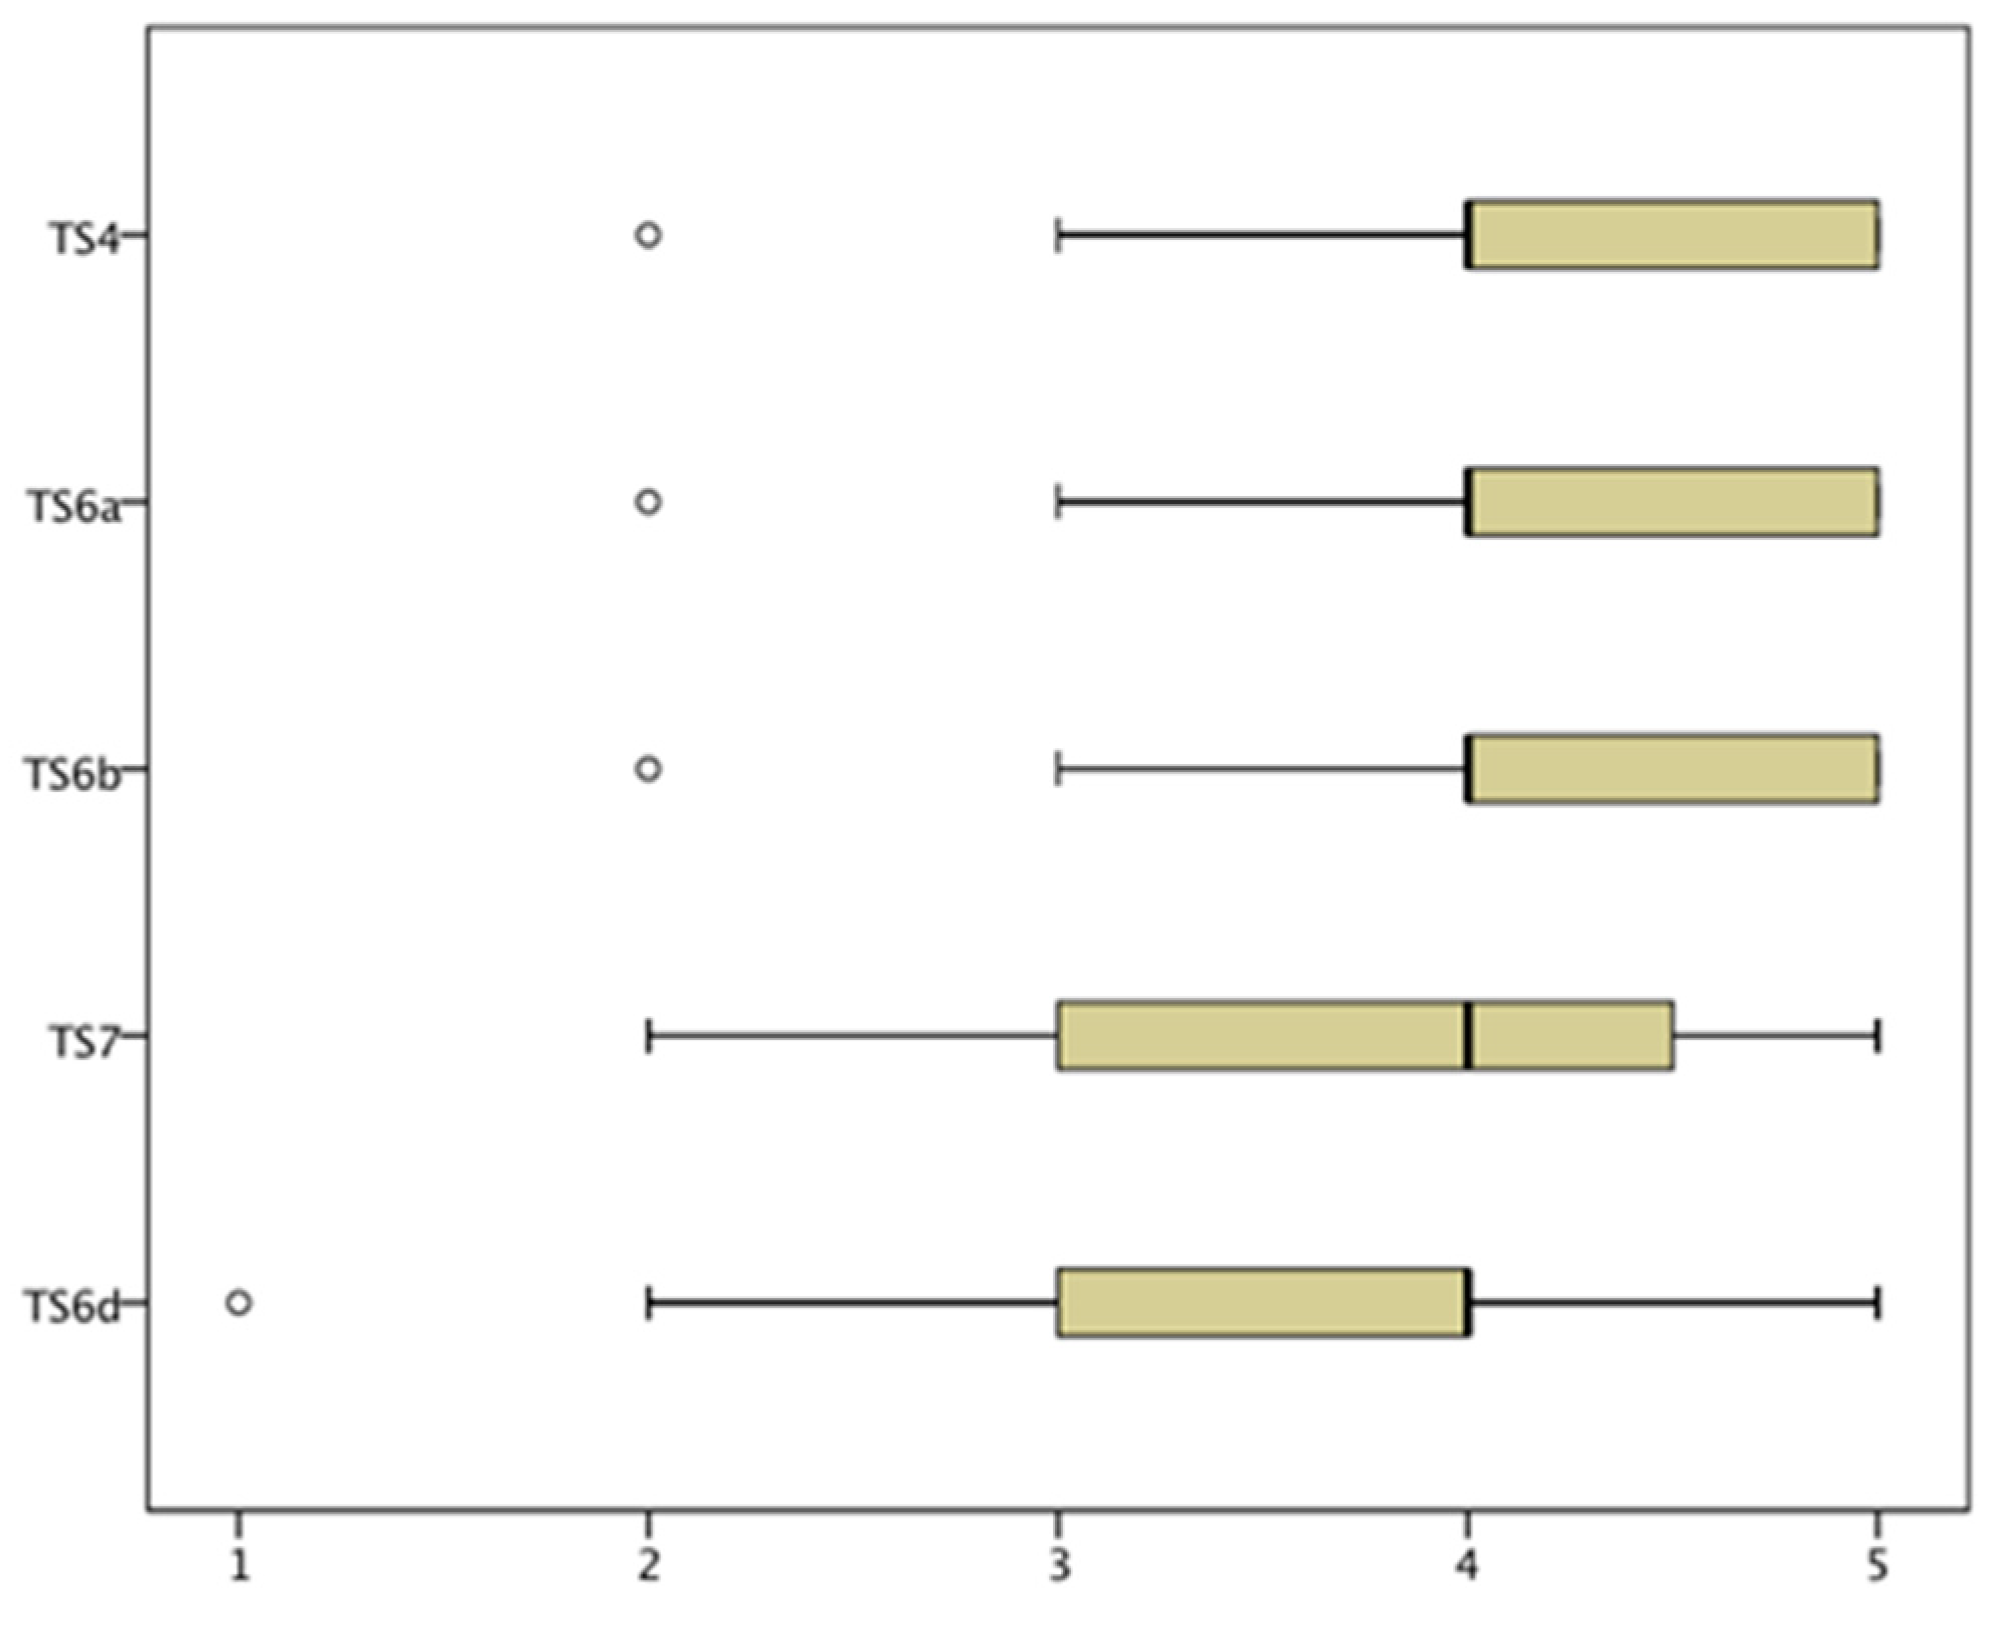
Table 3 and Figure 9 summarise and illustrate the distribution of the obtained data, respectively.
Largely, students agreed (Figure 9, more than 50% of agreement, 4 and 5) that the PW is an important and useful tool in supporting the CU (TS4). This item is the one with the highest evaluation (Table 3, mean = 4.34). Even the item with the lowest evaluation (TS6d, mean = 3.80) reflects an agreement. In fact, this is the only item where the evaluation of 1 (strong disagreement) was obtained. The percentage of disagreement (1 and 2) corresponds to 3.7%, meaning that these students do not consider that the PW development has a motivating effect on the CU.
Despite the previous results, a majority of students (90.7%) consider that the PW motivated them to learn the CU contents (TS9), recommending (96.3%) the PW as a teaching activity in their learning process (TS10).
Knight, in their work [25], stated that, related to group work development, students give more importance to students’ overall ‘group experience’ than the related learning outcomes/skills developed in group work. This could explain why some students did not consider the PW to be motivating for the CU.

3.2.3. Is the PW Perceived as an Autonomous Tool? (sRQ2)

To understand how students perceived the PW as an autonomous tool, item TS12, with a “No/Yes” answer (Do you consider that the PW should be less supervised by the teacher?), belonging to part 3 of the questionnaire (Technical Skills acquired with the PW), will be analysed. Since the students were asked to justify their answers to this question with words, this will also be analysed.
The majority of the students (94.4%) answered “No”. The justifications were related to the support that the teacher must give to students. For example: “it is necessary to have indications from the teacher for the development of the PW”; “teacher’ support is essential”; “in case of less support, we (students) would not manage to develop the PW”. These last comments are in opposition to the comments given by the minority of students that answered “Yes” (5.6%): “the PW obliges students to look for information”.
As previously mentioned (Section 3.1), students’ attendance at theoretical classes was relatively low (high attendance only occurred at evaluation moments, as expected). It is in these classes that important and necessary PW information is given, so if students were present in these classes, the need for indications by the teacher could be diminished. Then, the teacher’s support would only be necessary for some doubts. As emphasised by one student, “even though the contents are taught, there are always some aspects that are specific and vary”.
Answers like “if the PW was less supervised the students would fill lost and would neglect it” shows that some students were not able to perceive the PW as a tool for applying their knowledge and understanding in solving new and practical problems.
It seems that, independently of approaches to learning and to teaching, student motivation is mainly associated with intrinsic or autonomous motivation and each student’s learning profile; moreover, student-centred learning environments do not guarantee success at motivating students to learn [26].

3.2.4. Is the PW Effective for Preparing Students for the Challenges of Professional Life? (sRQ3)

To understand how students perceived the PW and their level of agreement regarding PW effectiveness as an autonomous tool, item TS11 (Do you consider that the PW should be carried out before the contents have been taught?) was related to the five items that measure the activity effectiveness (AE):
AE1—theoretical class where the teacher lectures the contents and a theoretical-practical class where applied exercises are solved,
AE2—previous study of theoretical concepts proposed by the teacher and discussion in theoretical class of the application of these concepts,
AE3—students individually solve a global question in the theoretical class using the knowledge they have,
AE4—theoretical class where the teacher presents the contents using practical examples and a theoretical-practical class where applied exercises are solved,
AE5—students solve a problem in groups in the theoretical class using the knowledge they have.
Table 4 presents the corresponding statistics in terms of minimum, maximum, mean and median values and the standard deviation.
On average, students considered the traditional teaching/learning methodology to be the most effective, that is, a theoretical class where the teacher presents the contents using practical examples and a theoretical-practical class in which applied exercises are solved (AE4, with 4.30 on a scale of 5), and where in the theoretical class, the teacher presents the contents and a theoretical-practical class in which applied exercises are solved (AE1, with 4.10 in a scale of 5).
Students considered the methodology in which students are required to undertake previous study of theoretical concepts proposed by the teacher, followed by a discussion in the theoretical class on the application of these concepts, to be of lower effectiveness (AE2, with 3.69 in a scale of 5).
To understand students’ choices regarding the effectiveness of the PW as an autonomous tool, these 5 items were correlated with item TS11. Table 5 summarises the values of the Spearman coefficients obtained. None of the 5 items (AE1, AE2, AE3, AE4 and AE5) show a significant correlation with item TS11. To some extent, these results confirm earlier findings. However, slightly increasing the significance level to 6%, two positive correlations could be observed. That is, students who agree that the PW should be carried out before the contents have been taught also agree that they could first study the theoretical concepts proposed by the teacher and then discuss them later in theoretical class (AE2), and also agree that students could solve a problem in groups using the knowledge they have (AE5), understanding and identifying their difficulties.

3.2.5. Which Competences Did Students Acquire with the PW? (sRQ4)

To answer sRQ4, the five items in the soft skills part of the questionnaire (part 5) will be analysed concerning what the PW allowed:
SS1: to encourage collaborative work,
SS2: to stimulate my intellectual curiosity,
SS3: to provide necessary knowledge for my area of study,
SS4: to relate this CU to other CUs,
SS5: to apply the acquired concepts during the PW development in different CUs.
As for the previous items, for this set also, no statistical differences were obtained between the two academic years with regard to the way students evaluate them (Table 6).
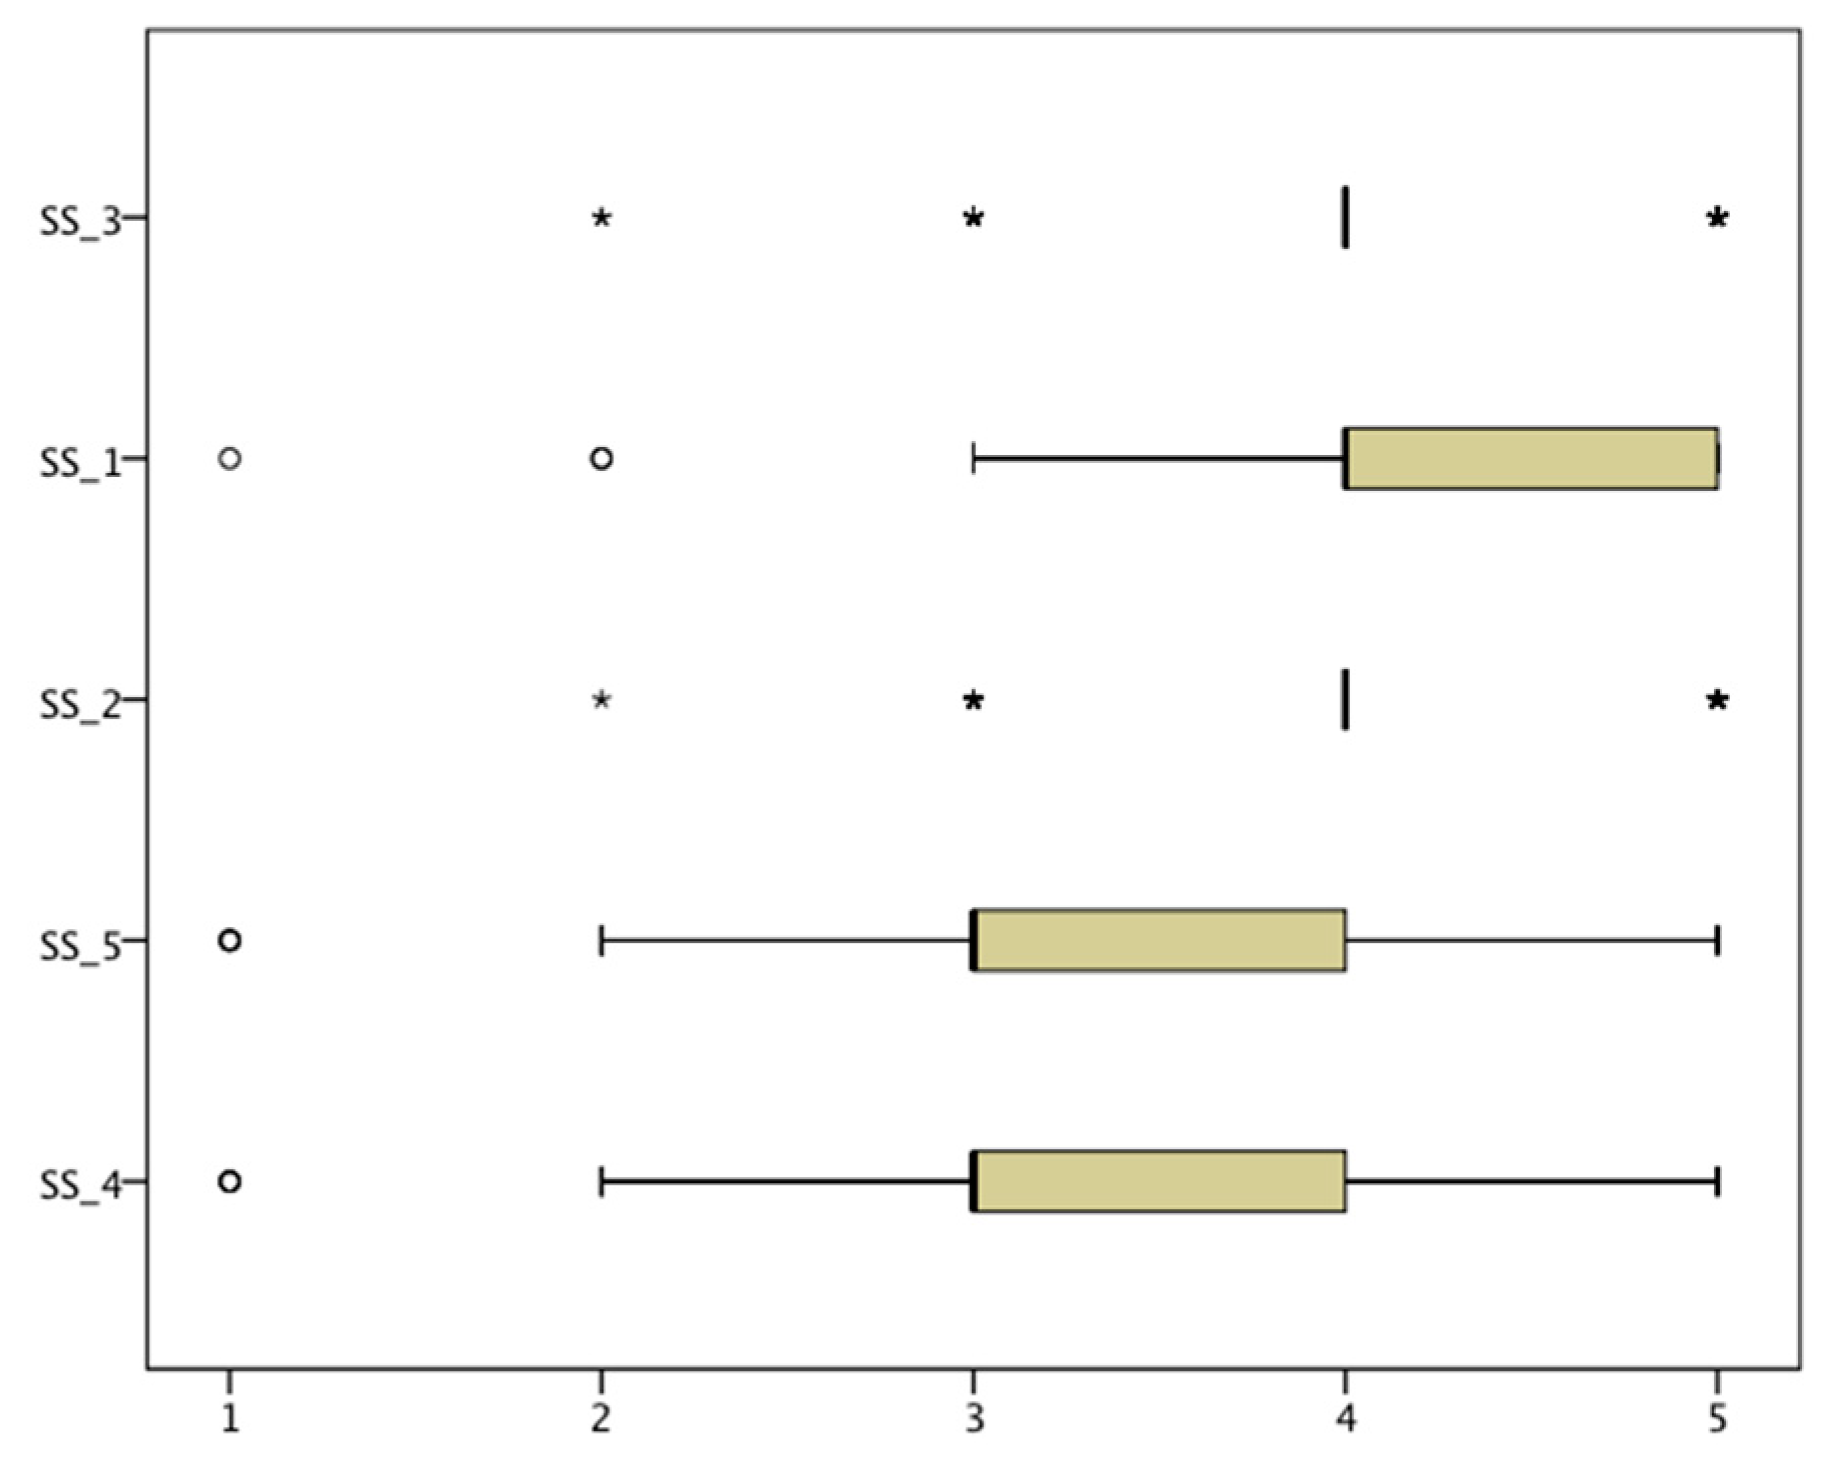
Figure 10 shows the distribution of the students’ evaluation for the five SS items considered in the questionnaire. The items evaluated more positively corresponded to SS3 (Provide necessary knowledge for my area of study), SS1 (Encourage collaborative work) and SS2 (Stimulate my intellectual curiosity).
The students were able to identify that the development of the PW helped in providing knowledge of the area under study (SS3). Only two students stated disagreement. Regarding SS4 and SS5, the majority of students still experienced difficulties in relating the acquired concepts to other subjects (55.1% and 51.4%, respectively, for disagree and do not know). This is not surprising, since the courses until the first semester of the second year are mainly basics courses (mathematics, physics and chemistry). Although they have an integrating laboratory (LABO3) in which they practice Fluid Mechanics simultaneously with STFLU, they do not relate STFLU to this other CU.
These results, together with the results obtained in Section 3.2.1 (COF12), reinforce the idea that the PW and several moments of assessment can be used as tools promoting the acquisition of knowledge in Fluid Mechanics.

3.2.6. Are the Students Confident with the Knowledge Acquired with the PW in Sizing a Proper Fluid Transport System? (sRQ5)

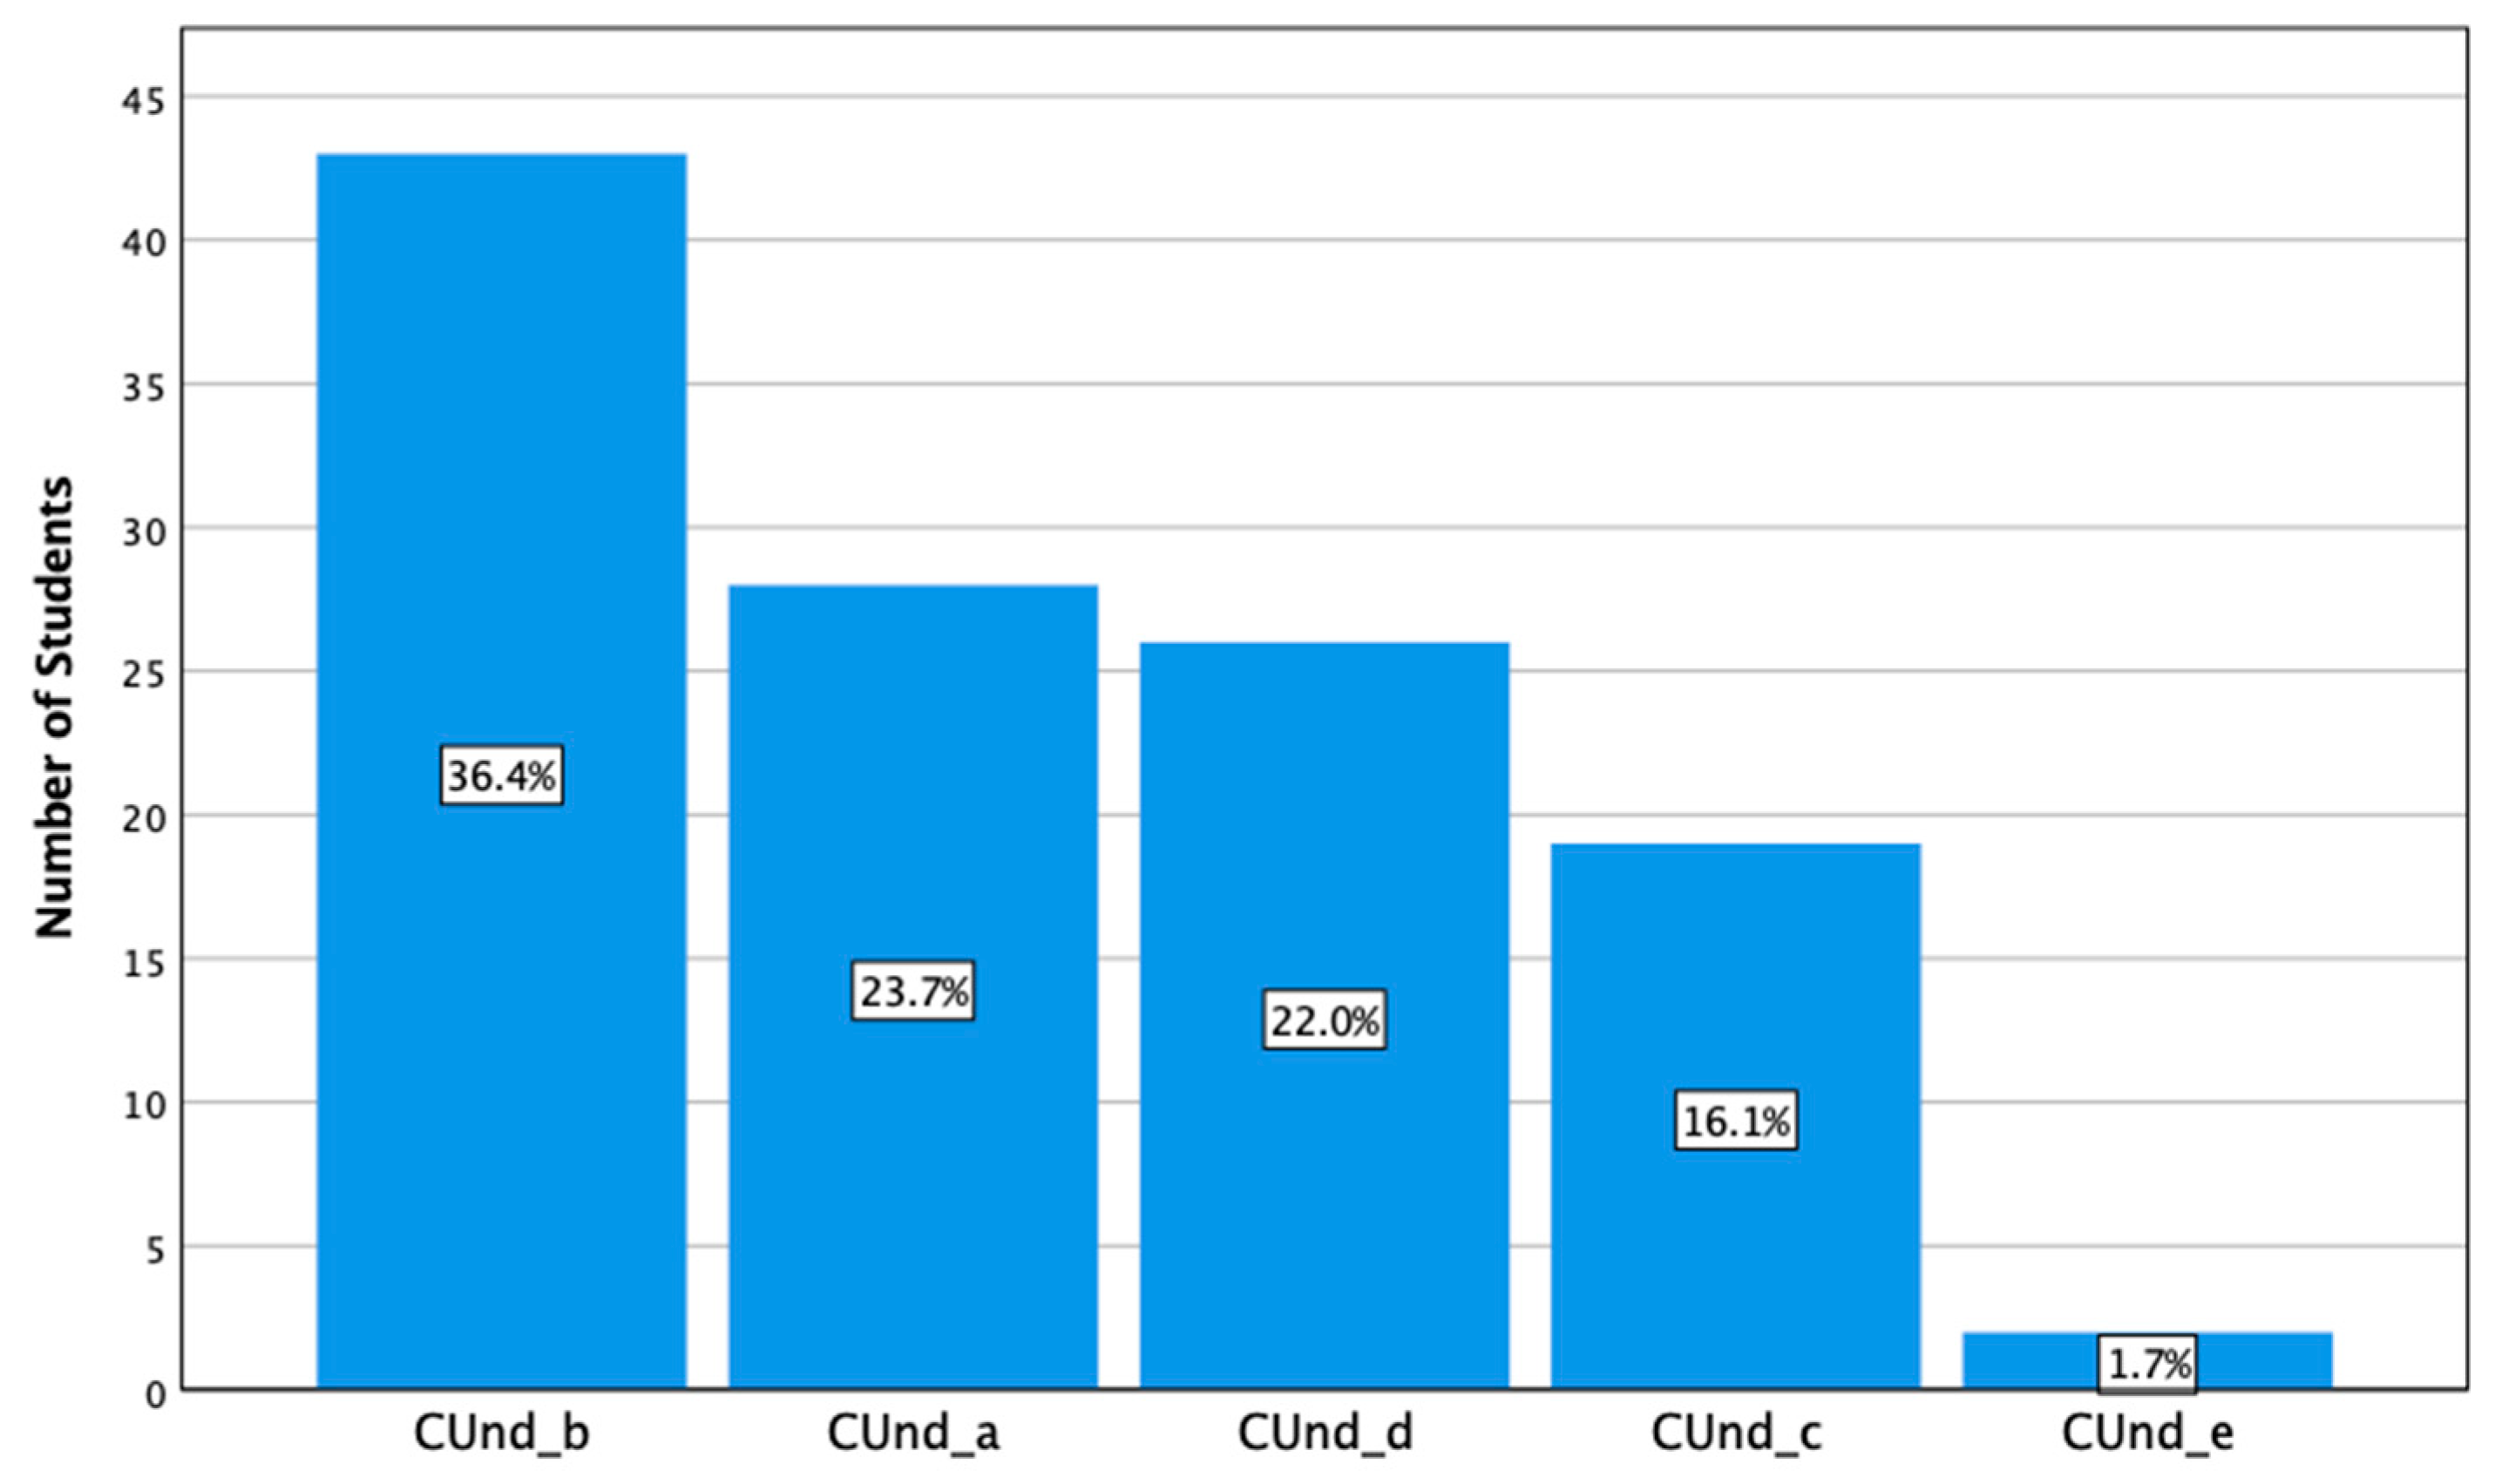
To understand how confident students are with the knowledge acquired with the PW to size a proper fluid transport system, group 4, Concepts’ Understanding (CUnd) with PW development, was analysed. To this end, five sentences were given, and the student selected the most appropriate situation:
CUnd_a: with the PW development, now I am able to select a pump and size the involved system (pump and system characteristics, costs…) for any situation,
CUnd_b: with the PW development, now I am able to select a pump and size the involved system (pump and system characteristics, costs…) for a house/building,
CUnd_c: with the PW development, now I am able to select a pump (pump characteristics, costs …) for any situation,
CUnd_d: with the PW development, now I am able to select a pump (pump characteristics, costs…) for a house/building,
CUnd_e: with the PW development, I am still not able to select a pump and size the involved system (pump and system characteristics, costs…) for a house/building.
Figure 11 shows the percentage of students’ answers for each of the CUnd items.
As can be seen, the majority of students (60.1 %) were confident when selecting a pump and sizing the involved system (pump and system characteristics, costs …). Some students (38.1 %) were only confident when selecting a pump (pump characteristics, costs …) without sizing the complete flow system. Only 1.7 % of students (corresponding to 2 students) did not feel confident when sizing this type of system. These results reflect the problem associated with group work; that is, some groups split the tasks among them and only become aware of the contents that they developed, forgetting to integrate all of the contents [27].
Nevertheless, these results show that students are in general confident with the knowledge acquired through PW.
4. Conclusions

The main objective of this study was to evaluate students’ perceptions regarding different types of assessment and to analyse the impact of the changes in the assessment methodology on attendance and on the students’ final grades.
It was verified that the assessment methodology changed the students’ attendance at theoretical classes significantly. In general, the majority of the students only attended theoretical classes when they were forced to do it! The introduction of several assessment moments increased students’ attendance at the theoretical classes, mainly on the days on which assessments occurred. In fact, the absence at theoretical classes was somewhat problematic, and the methodology enhanced the attendance at six out of fifteen theoretical classes. This assessment methodology allows the students to be focused on and motivated by the learning process. Consequently, the majority of students who presented themselves to an evaluation passed the attendance requirement.
The development of the PW as an evaluation method has positive repercussions for the way students focus on the course contents and keep up with the subjects taught.
Studying throughout the semester (as opposed to studying only for a final exam) facilitates good knowledge acquisition and allows a better success with respect to final grades and also to the preparation for future professional life.
In general, students consider the contents, practical examples and contextualisation of the CU to be adequate and positive with respect to their learning process and preparation for professional life.
Students prefer assessment through several questions/problems and small tests during the theoretical lessons, and consider it more beneficial for their learning, rather than carrying out a single evaluation and test. Even students that fail (final grade ≤ 9.5) classified the assessment methodology based on several questions/problems and small tests during theoretical lessons positively (level of agreement between 3 and 5).
Largely, students agree that the PW is an important tool in their learning process that helps them to assimilate concepts and make their learning more objective. The majority of students recommend the PW as a teaching activity.
On average, students considered the traditional teaching/learning methodology (a theoretical class, where the teacher presents the contents using practical examples, and a theoretical-practical class, where applied exercises are solved) to be the most effective. In line with this, students did not agree that the PW should be carried out before the contents had been taught; they did not intend to use the PW as an autonomous tool.
In general, students were confident with the knowledge acquired with the PW and felt able to size fluid transport systems.
The majority of students were able to identify that the development of the PW and several moments of assessment helped in providing knowledge on the area under study, encouraged their collaborative work and stimulated their intellectual curiosity, but they still experienced difficulties in relating the acquired concepts with other subjects.
The authors believe that the students acquired new competences, in particular autonomous work, that may be applied in other courses and in their professional life.

Author Contributions

All authors conceived and designed the experiment. T.S.-E. and C.M. collected data. C.P.L. analysed the data with the SPSS statistical tool. All authors contributed to the final manuscript.

Funding

This research received no external funding.

Acknowledgments

The authors would like to express their acknowledgment to all students who agreed to collaborate in this study. The authors also thank the Research Centre CIETI (Centro de Inovação em Engenharia e Tecnologia Industrial) and FCT—Fundação para a Ciência e Tecnologia for all the support provided in the scope of the projects COMPETE: POCI-01-0145-FEDER-007043, UID/CEC/00319-2019 and UID-EQU-04730-2019.

Conflicts of Interest

The authors declare no conflict of interest.

References

  1. Cansino, J.M.; Román, R.; Expósito, A. Does Student Proactivity Guarantee Positive Academic Results? Educ. Sci. 2018, 8, 62. [Google Scholar] [CrossRef]
  2. Lukkarinen, A.; Koivukangasa, P.; Seppäläa, T. Relationship between class attendance and student performance. Procedia Soc. Behav. Sci. 2016, 228, 341–347. [Google Scholar] [CrossRef]
  3. Ma, X.; Luo, Y.; Zhang, L.; Wang, J.; Liang, Y.; Yu, H.; Wu, Y.; Tan, J.; Cao, M. A Trial and Perceptions Assessment of APP-Based Flipped Classroom Teaching Model for Medical Students in Learning Immunology in China. Educ. Sci. 2018, 8, 45. [Google Scholar] [CrossRef]
  4. Billett, S. Learning through Practice. In Learning Through Practice. Models, Traditions, Orientations and Approaches, 1st ed.; Billett, S., Ed.; Springer Science + Business Media B.V: Brisbane, Australia, 2010; pp. 1–20. [Google Scholar]
  5. Lu, H.; Zhang, X.; Jiang, D.; Zhao, Z.; Wang, J.; Liu, J. Several Proposals to Improve the Teaching Effect of Fluid Mechanics. In Emerging Computation and Information teChnologies for Education; Mao, E., Xu, L., Tian, W., Eds.; Springer: Berlin/Heidelberg, Germany, 2012; pp. 187–191. [Google Scholar]
  6. Hunsu, N.; Abdul, B.; Van Wie, B.J.; Brown, G.R. Exploring Students’ Perceptions of an Innovative Active Learning Paradigm in a Fluid Mechanics and Heat Transfer Course. Int. J. Eng. Educ. 2015, 31, 1200–1213. [Google Scholar]
  7. Absi, R.; Nalpace, C.; Dufour, F.; Huet, D.; Bennacer, R.; Absi, T. Teaching Fluid Mechanics for Undergraduate Students in Applied Industrial Biology: From Theory to Atypical Experiments. Int. J. Eng. Educ. 2011, 27, 550–558. [Google Scholar]
  8. Sorensen, E. Implementation and student perceptions of e-assessment in a Chemical Engineering module. Eur. J. Eng. Educ. 2013, 38, 172–185. [Google Scholar] [CrossRef] [Green Version]
  9. Rahman, A. A blended learning approach to teach fluid mechanics in engineering. Eur. J. Eng. Educ. 2017, 42, 252–259. [Google Scholar] [CrossRef]
  10. Gynnild, V.; Myrhaug, D.; Pettersen, B. Introducing innovative approaches to learning in fluid mechanics: A case study. Eur. J. Eng. Educ. 2007, 32, 503–516. [Google Scholar] [CrossRef]
  11. Golter, P.B.; Thiessen, D.B.; Van Wie, B.J.; Brown, G.R. Adoption of a non-lecture pedagogy in chemical engineering: Insights gained from observing an adopter. J. STEM Educ. 2012, 13, 52–62. [Google Scholar]
  12. Prince, M.J.; Felder, R.M. Inductive Teaching and Learning Methods: Definitions, Comparisons, and Research Bases. J. Eng. Educ. 2006, 95, 123–138. [Google Scholar] [CrossRef]
  13. Boylan-Ashraf, P.C.; Freeman, S.A.; Shelley, M.C.; Keleş, Ö. Can Students Flourish in Engineering Classrooms? J. STEM Educ. 2017, 18, 16–24. [Google Scholar]
  14. Schmidt, H.G.; Rotgans, J.I.; Yew, E.H. The process of problem-based learning: What works and why. Med. Educ. 2011, 45, 792–806. [Google Scholar] [CrossRef] [PubMed]
  15. Yadav, A.; Subedi, D.; Lunderberg, M.; Bunting, C.F. Problem-based Learning: Influence on Students’ Learning in an Electrical Engineering Course. J. Eng. Educ. 2011, 100, 253–280. [Google Scholar] [CrossRef]
  16. Daly, S.R.; Mosyjowski, E.A.; Seifert, C.M. Teaching Creativity in Engineering Courses. J. Eng. Educ. 2014, 103, 417–449. [Google Scholar] [CrossRef] [Green Version]
  17. Gibbs, G.; Simpson, C. Conditions under which Assessment supports Student Learning. Learn. Teach. High. Educ. 2004, 1, 3–31. [Google Scholar]
  18. Hettiarachchi, E.; Huertas, M.A.; Mor, E. E-Assessment System for Skill and Knowledge Assessment in Computer Engineering Education. Int. J. Eng. Educ. 2015, 31, 529–540. [Google Scholar]
  19. Soares, F.; Leão, C.P.; Guedes, A.; Brás-Pereira, I.; Morais, C.; Sena-Esteves, T. Interpreting students’ perceptions in fluid mechanics learning outcomes. Educ. Knowl. Soc. 2015, 16, 73–90. [Google Scholar] [CrossRef]
  20. Sena-Esteves, T.; Morais, C.; Guedes, A.; Brás-Pereira, I.; Ribeiro, M.M.; Soares, F.; Leão, C.P. Teaching Impact and Evaluation Methodology Assessment in a Fluid Mechanics Course: Student’s Perceptions. In Proceedings of the ASME 2017 International Mechanical Engineering Congress and Exposition (ASME IMECE2017), Tampa, FL, USA, 3–9 November 2017. [Google Scholar]
  21. Field, A. Discovering Statistics Using SPSS; SAGE, Publications Ltd.: London, UK, 2009. [Google Scholar]
  22. Gurung, R.A.R. How do students really study (and does is matter)? Teach. Psychol. 2002, 2, 149–155. [Google Scholar]
  23. Alhija, F.N. Teaching in higher education: Good teaching through students’ lens. Stud. Educ. Eval. 2017, 54, 4–12. [Google Scholar] [CrossRef]
  24. Struyven, K.; Dochy, F.; Janssens, S. Students’ perceptions about evaluation and assessment in higher education: A review. Assess. Eval. High. Educ. 2005, 30, 325–341. [Google Scholar] [CrossRef]
  25. Knight, J. Comparison of student perception and performance in individual and group assessments in practical classes. J. Geogr. High. Educ. 2004, 28, 63–81. [Google Scholar] [CrossRef]
  26. Baeten, M.; Kyndt, E.; Struyven, K.; Dochy, F. Using student-centred learning environments to stimulate deep approaches to learning: Factors encouraging or discouraging their effectiveness. Educ. Res. Rev. 2010, 5, 243–260. [Google Scholar] [CrossRef]
  27. Cohen, E.G. Restructuring the Classroom: Conditions for Productive Small Groups. Rev. Educ. Res. 1994, 64, 1–35. [Google Scholar] [CrossRef]
Figure 1. Assessment flowchart for the academic year 2017/18 (I stands for Individual and G for Group evaluation moments).
Education 09 00152 g001
Figure 2. Average of the final grades of students and the percentage of students who were approved for the academic years 2006/07 to 2017/18 (note that the xx axis value corresponds to the beginning of the academic year, i.e., 2006 corresponds to 2006/07).
Education 09 00152 g002
Figure 3. Final grade distribution (number of students that obtained each of the possible grades between 0 and 20) for the academic years 2016/17 and 2017/18.
Education 09 00152 g003
Figure 4. Attendance at theoretical classes for the academic years 2013/14 to 2017/18 (note that the xx axis value corresponds to the beginning of the academic year, i.e., 2013 corresponds to 2013/14).
Education 09 00152 g004
Figure 5. Attendance for each theoretical class throughout the academic year 2016/17 and 2017/18. Ii: Individual moment i, Gi: Group moment i, PW: Practical Work, E: Exam (individual, normal and supplementary).
Education 09 00152 g005
Figure 6. Attendance for each theoretical class of the 2nd year/1st semester courses throughout the academic year 2017/18 (ESAPL—Statistical Methods; MIANA—Methods of Instrumental Analysis; QFIT1—Chemical Physics and Thermodynamics).
Education 09 00152 g006
Figure 7. Average student grades versus (a) COF12 student evaluation and (b) COF14 student evaluation.
Education 09 00152 g007
Figure 8. Students’ final grades versus (a) COF12 student evaluation and (b) COF14 student evaluation (marker size and colour intensity reflect the number of students in each grid cell).
Education 09 00152 g008
Figure 9. Students’ evaluation for TS Technical Skills.
Education 09 00152 g009
Figure 10. Students’ evaluation for SS Soft Skills.
Education 09 00152 g010
Figure 11. Students’ answers for CUnd with PW development.
Education 09 00152 g011
Table 1. Descriptive statistics of the student characteristics.
2016/172017/18Total
Respondent (%)87.793.690.8
Gender
Male (%)32.027.629.6
Female (%)68.072.470.4
Age
19 (%)78.056.966.7
20– 21 (%)14.032.724.1
≥228.010.49.2
Mean Age (x ± SD)19.5 ± 1.1719.9± 1.6219.7 ± 1.44
Regime of Class
Daytime (%)98.093.095.3
After work (%)2.07.04.7
First time Attending Students (%)84.089.586.9
Table 2. Statistical summary for the considered COF items.
ItemYearNMinMaxMeanStd. DeviationMedianStatistics U
COF1201750354.400.57341153.0
201856254.180.6364
COF2201750354.280.57341196.5
201856254.090.6404
COF3201750354.200.53541244.0
201856254.040.7134
COF4201750253.440.88431147.5
201856253.130.8753
COF5201750254.060.71241376.5
201856153.980.8634
COF6201750254.280.67141354.5
201856154.180.8764
COF7201750354.160.58441157.0
201855153.910.8004
COF8201750152.400.88121383.0
201856142.380.8222
COF9201748153.770.77841301.5
201856153.680.9364
COF10201750253.820.85041238.0
201853153.750.7314
COF11201750253.740.89941398.0
201854153.780.6914
COF12201750154.021.02041398.0
201856154.050.9424
COF13201750153.821.27341320.5
201856154.021.0364
COF14201750152.181.32021370.0
201856152.231.3482
Table 3. Statistical summary for the considered Technical Skill (TS) items.
ItemNMin.Max.MeanStd. DeviationMedian
TS4108254.340.7134
TS6a108254.130.6984
TS6b108254.120.6804
TS6d108153.800.7834
TS7108253.910.8034
TS910890.7% Yes
TS1010896.3% Yes
Table 4. Statistical summary for the considered Activity Effectiveness (AE) items.
itemnMin.Max.MeanSth. DeviationMedian
AE1106254.100.6754
AE2106153.690.9194
AE3105153.761.0334
AE4106154.300.7834
AE5106253.960.8274
Table 5. Spearman’s correlation coefficient, rS.
TS11AE1AE2AE3AE4AE5
TS111.0
.
AE10.0251.0
0.797.
AE20.186 ‡0.1751.0
0.0560.072.
AE30.0820.1200.363 **1.0
0.4060.2230.000.
AE4−0.1010.275 **0.1220.283 **1.0
0.3010.0040.2120.003.
AE50.185 ‡0.0120.315 **0.514 **0.192 *1.0
0.0580.9050.0010.0000.048.
** Correlation is significant at the 0.01 level (2-tailed). * Correlation is significant at the 0.05 level (2-tailed). ‡ Correlation is significant at the 0.06 level (2-tailed).
Table 6. Statistical summary for the three SS items.
ItemYearNMinMaxMeanStd. DeviationMedianStatistics U
SS1201750154.020.84541391.0
201856354.090.6954
SS2201751353.980.67841413.0
201856253.980.7514
SS3201751254.080.65941415.5
201856254.090.6684
SS4201751153.370.93731419.0
201856153.450.9333
SS5201751153.410.89841374.0
201856153.501.0273