Fuzzy Logic as a Tool for Assessing Students’ Knowledge and Skills

Abstract
:1. Introduction
2. A Fuzzy Model for Assessing Student Groups’ Performance
 and let us assume that the teacher wants to assess the following students’ characteristics: S1 = knowledge of a subject matter, S2 = problem solving related to this subject matter and S3 = ability to adapt properly the already existing knowledge for use in analogous similar cases (analogical reasoning; of course the teacher could choose characteristics different for those mentioned here and may be more than three in total). However, the more are the characteristics chosen for assessment, the more complicated (technically) becomes our model.). Denote by a, b, c, d, and e the linguistic labels (fuzzy expressions) of very low, low, intermediate, high and very high success respectively of a student in each of the Sis and set U = {a, b, c, d, e}.
 . Nevertheless, such an action would be highly questionable, since the nix’s are obtained with respect to the linguist labels of U, which are fuzzy expressions by themselves. Therefore, the application of a fuzzy approach by using membership degrees instead of probabilities seems to be the most suitable for this case. However, as it is well known, the membership function is usually defined empirically in terms of logical or/and statistical data. In our case the above definition of
  seems to be compatible with common sense. Then, the fuzzy subset Ai of U corresponding to Si has the form:


 (x)
(x)  (y)
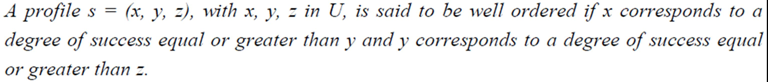
(y)  (z), if s is well ordered, and 0 otherwise. In fact, if for example the profile (b, a, c) possessed a nonzero membership degree, how it could be possible for a student, who has failed at the problem solving stage, to perform satisfactorily at the stage of analogical reasoning, where he/she has to adapt the existing knowledge for solving problems related to analogous similar cases?
  . We define also the possibility rs of s to be rs =
  , where max {ms} denotes the maximal value of ms for all s in U3. In other words the possibility of s expresses the “relative membership degree” of s with respect to max {ms}. From the above two definitions it becomes evident that ps < rs for all s in
  , which is compatible to the common logic. In fact, whatever is probable it is also possible, but whatever is possible need not be very probable.
 2. For this, we introduce the fuzzy variables A1(t), A2(t) and A3(t) with t = 1, 2,…, k. The values of these variables represent fuzzy subsets of U corresponding to the students’ characteristics under assessment for each of the k groups; e.g., A1(2) represents the fuzzy subset of U corresponding to the knowledge of a subject matter (characteristic S1) for the second group (t = 2). Obviously, in order to measure the degree of evidence of the combined results of the k groups, it is necessary to define the probability p(s) and the possibility r(s) of each profile s with respect to the membership degrees of s for all groups. For this reason we introduce the pseudo-frequencies f(s) = ms(1)+ms(2)+…. +ms(k) and we define the probability and possibility of a profile s by p(s) =
  and r(s) =
  respectively, where max{f(s)} denotes the maximal pseudo-frequency. The same method could be applied when one wants to study the combined results of k different assessments of the same student group.
 3. Defuzzification Methods
3.1. The Centroid Method
 U} of the universal set U of the discourse with membership function
  [0, 1], we correspond to each x U an interval of values from a prefixed numerical distribution, which actually means that we replace U with a set of real intervals. Then, we construct the graph F of the membership function y = m(x).There is a commonly used in fuzzy logic approach to measure performance with the pair of numbers (xc, yc) as the coordinates of the center of gravity, say Fc, of the graph F, which we can calculate using the following well-known (e.g., see [8]) formulas:
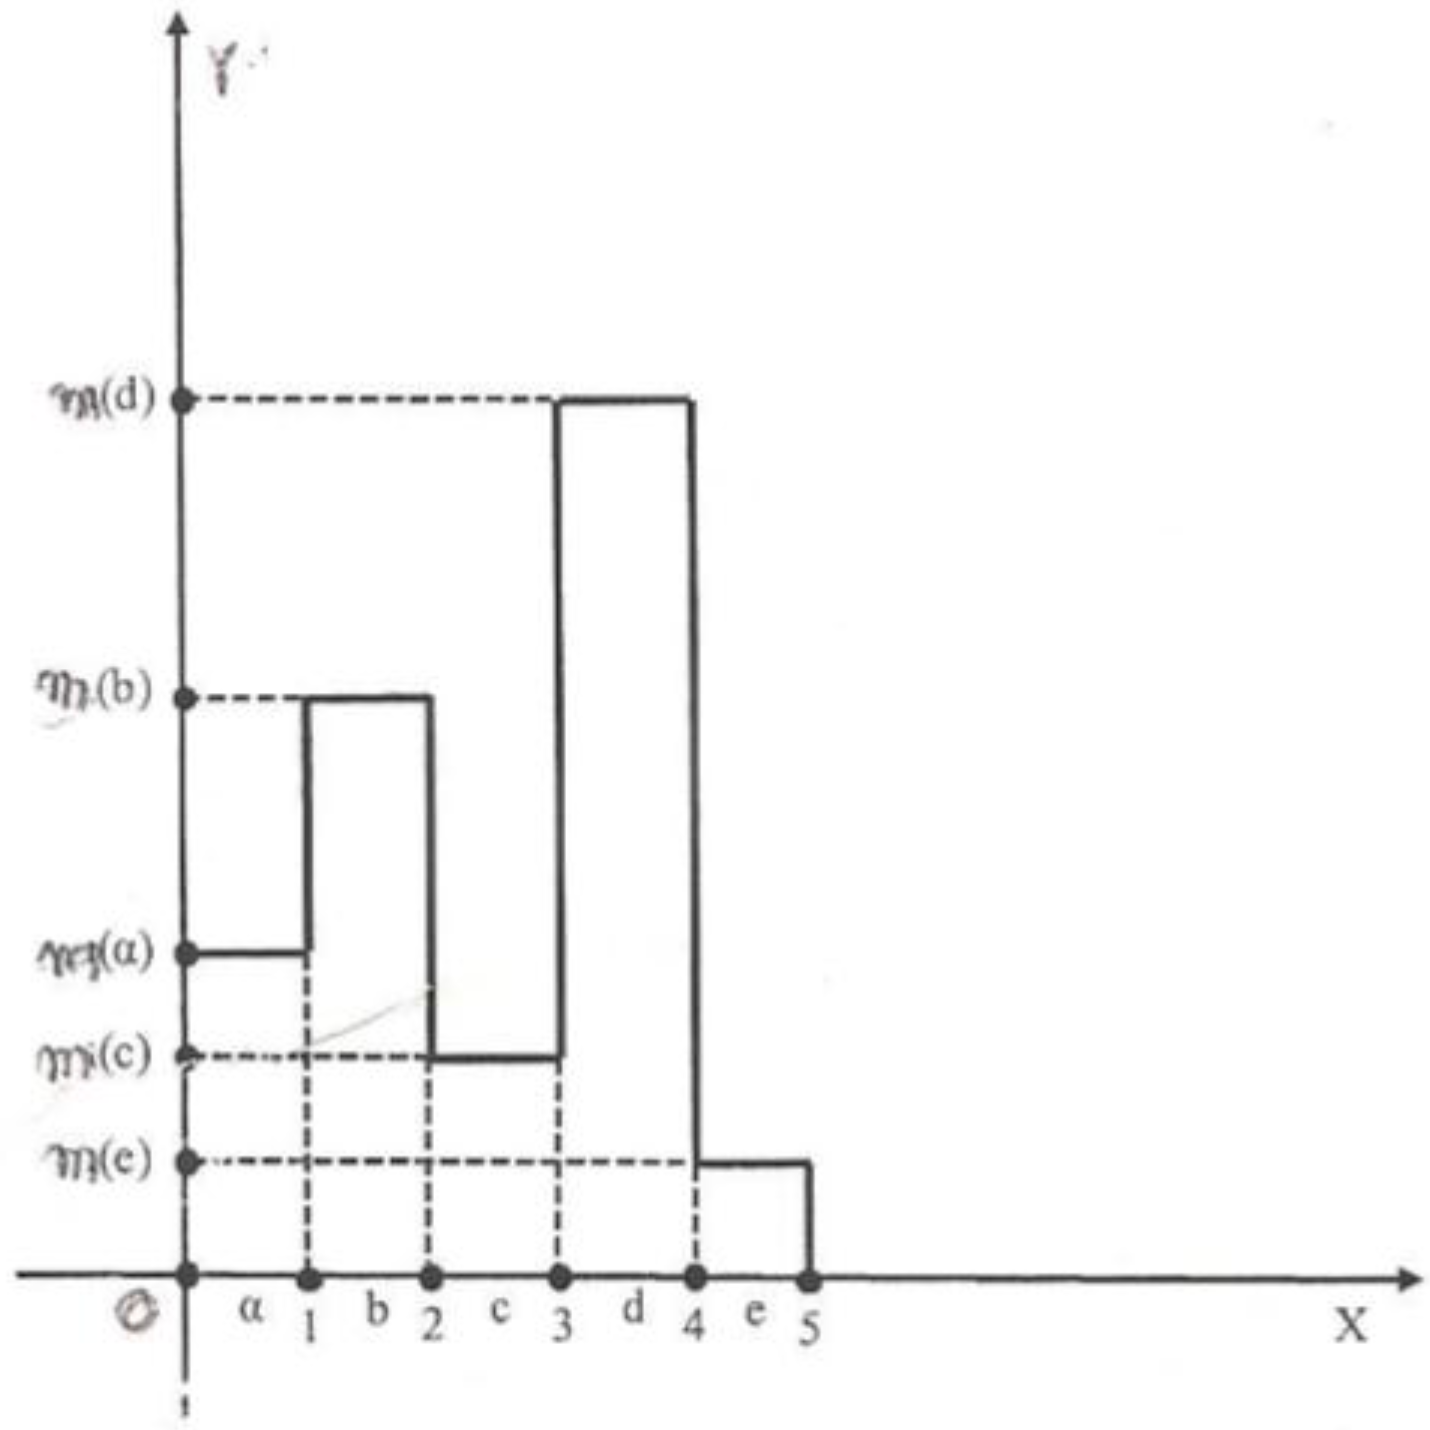
 [0, 1), as low (b) if y [1, 2), as intermediate (c) if y [2, 3), as high (d) if y [3, 4) and as very high (e) if y [4, 5) respectively (these characterizations are usually awarded on the basis of the reports prepared by the students during the course and the results of the progress exams (if any) and the final exam). In this case the graph F of the corresponding fuzzy subset of U is the bar graph of Figure 1 consisting of 5 rectangles, say Fi, i = 1,2,3,4,5, having the lengths of their sides on the x axis equal to 1.
 , which is the total area of F, is equal to
  . We also have that
  =
= 

 , and
, and  =
=  =
=  .
. U, with the sum of all membership degrees we can assume without loss of the generality that y1 + y2 + y3 + y4 + y5 = 1. Therefore, we can write:

 , where x1 = a, x2 = b, x3 = c, x4 = d and x5 = e.
 (y1 − y2)2 = y12 + y22 − 2y1y2, therefore y12 + y22 2y1y2, with the equality holding if, and only if, y1 = y2. In the same way one finds that y12+y32 2y1y3, and so on. Hence it is easy to check that (y1 + y2 + y3 + y4 + y5)2 5(y12 + y22 + y32 + y42 + y52), with the equality holding if, and only if y1 = y2 = y3 = y4 = y5. However, y1 + y2 + y3 + y4 + y5 = 1; therefore, 1 5(y12 + y22 + y32 + y42 + y52) (3), with the equality holding if, and only if y1 = y2 = y3 = y4 = y5 =
  . In this case the first of Formulas (2) gives that xc =
  . 10yc, or yc
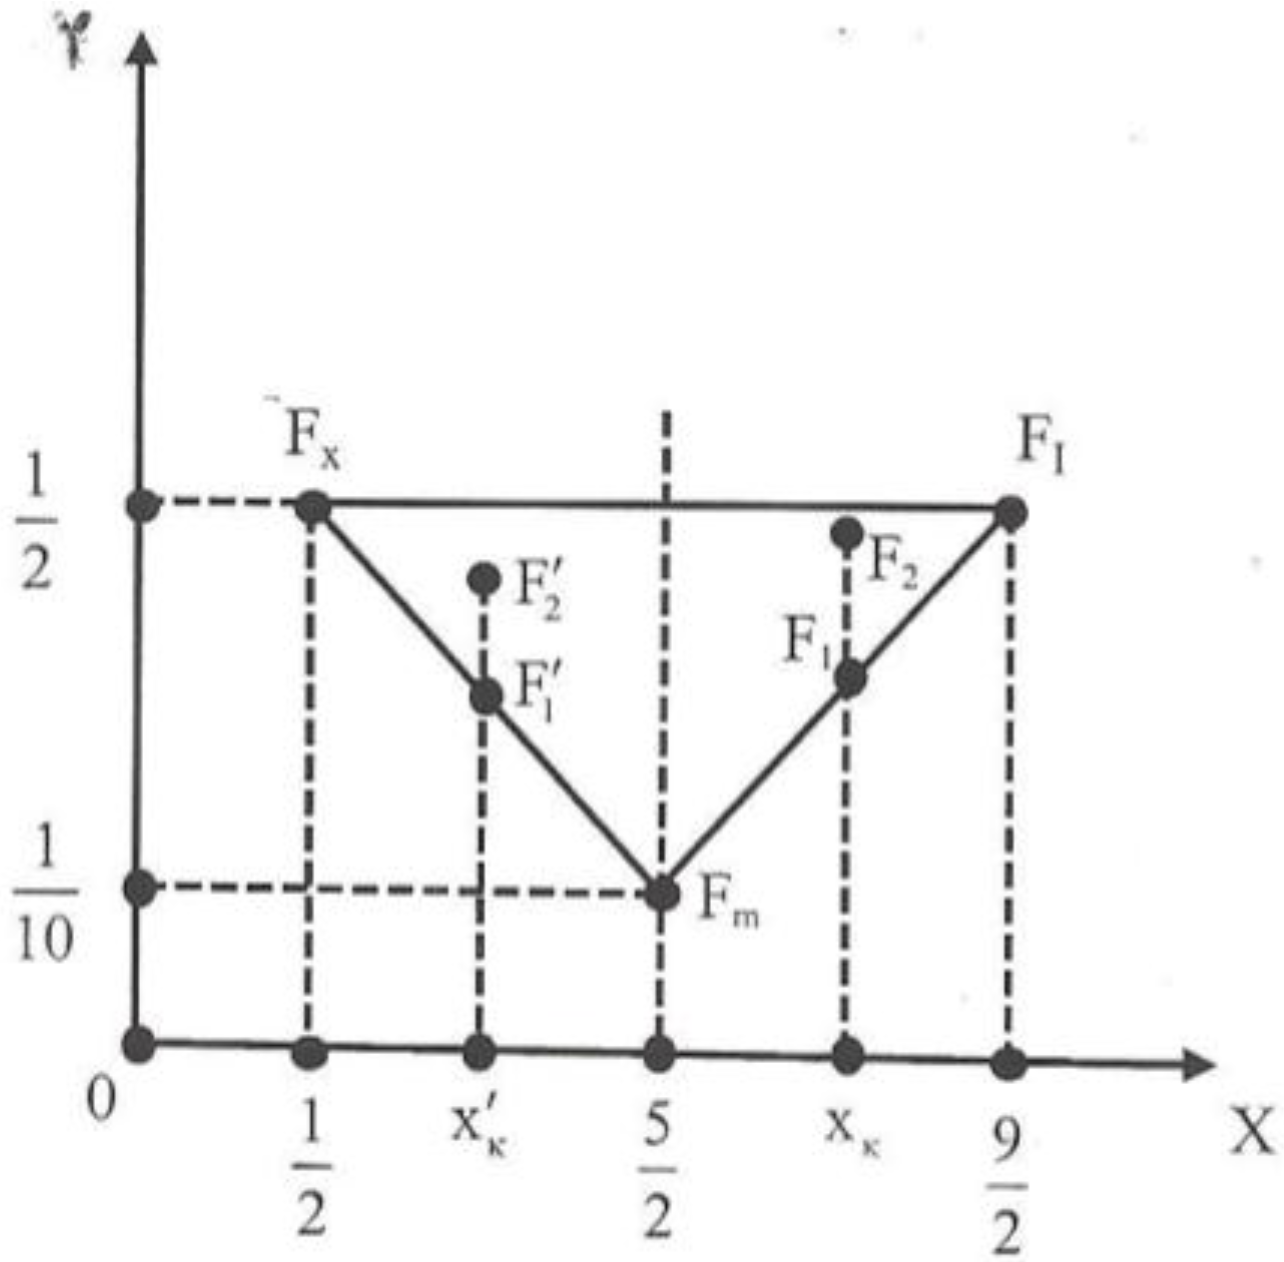
  . Therefore, the unique minimum for yc corresponds to the center of gravity Fm (
  , ).
, ). and yc =
  . Therefore the center of gravity in the ideal case is the point Fi ( ,
  ). On the other hand the worst case is when y1 = 1 and y2 = y3 = y4 = y5 = 0. Then for formulas (2) we find that the center of gravity is the point Fw ( , ). Thus, the “area” where the center of gravity Fc lies is represented by the triangle Fw Fm Fi of Figure 2.
 2.5 the group having the center of gravity which is situated closer to Fi is the group with the higher yc; and for two groups with the same xc < 2.5 the group having the center of gravity which is situated farther to Fw is the group with the lower yc. Based on the above considerations we formulate our criterion for comparing the groups’ performances as follows:
- Among two or more groups the group with the biggest xc performs better.
- If two or more groups have the same xc ≥ 2.5, then the group with the higher yc performs better.
- If two or more groups have the same xc < 2.5, then the group with the lower yc performs better.
3.2. The Group’s Uncertainty
 r2 ……. rrn rrn+1 of a group of students defined by

 ]
]
 . The possibilities of the students’ profiles are presented in column of rs(1) of Table 1. One could also calculate the probabilities of the students’ profiles using the formula for ps given in section 2. However, according to Shackle [16] and many other researchers after him, human cognition is better presented by possibility rather than by probability theory. Therefore, adopting this view, we considered that the calculation of the probabilities was not necessary.
| A1 | A2 | A3 | ms(1) | rs(1) | ms(2) | rs(2) | f(s) | r(s) |
|---|---|---|---|---|---|---|---|---|
| b | b | b | 0 | 0 | 0.016 | 0.258 | 0.016 | 0.129 |
| b | b | a | 0 | 0 | 0.016 | 0.258 | 0.016 | 0.129 |
| b | a | a | 0 | 0 | 0.016 | 0.258 | 0.016 | 0.129 |
| c | c | c | 0.062 | 1 | 0.062 | 1 | 0.124 | 1 |
| c | c | a | 0.062 | 1 | 0.062 | 1 | 0.124 | 1 |
| c | c | b | 0 | 0 | 0.031 | 0.5 | 0.031 | 0.25 |
| c | a | a | 0 | 0 | 0.031 | 0.5 | 0.031 | 0.25 |
| c | b | a | 0 | 0 | 0.031 | 0.5 | 0.031 | 0.25 |
| c | b | b | 0 | 0 | 0.031 | 0.5 | 0.031 | 0.25 |
| d | d | a | 0.016 | 0.258 | 0 | 0 | 0.016 | 0.129 |
| d | d | b | 0.016 | 0.258 | 0 | 0 | 0.016 | 0.129 |
| d | d | c | 0.016 | 0.258 | 0 | 0 | 0.016 | 0.129 |
| d | a | a | 0 | 0 | 0.016 | 0.258 | 0.016 | 0.129 |
| d | b | a | 0 | 0 | 0.016 | 0.258 | 0.016 | 0.129 |
| d | b | b | 0 | 0 | 0.016 | 0.258 | 0.016 | 0.129 |
| d | c | a | 0.031 | 0.5 | 0.031 | 0.5 | 0.062 | 0.5 |
| d | c | b | 0.031 | 0.5 | 0.031 | 0.5 | 0.062 | 0.5 |
| d | c | c | 0.031 | 0.5 | 0.031 | 0.5 | 0.062 | 0.5 |
| e | c | a | 0.031 | 0.5 | 0 | 0 | 0.031 | 0.25 |
| e | c | b | 0.031 | 0.5 | 0 | 0 | 0.031 | 0.25 |
| e | c | c | 0.031 | 0.5 | 0 | 0 | 0.031 | 0.25 |
| e | d | a | 0.016 | 0.258 | 0 | 0 | 0.016 | 0.129 |
| e | d | b | 0.016 | 0.258 | 0 | 0 | 0.016 | 0.129 |
| e | d | c | 0.016 | 0.258 | 0 | 0 | 0.016 | 0.129 |


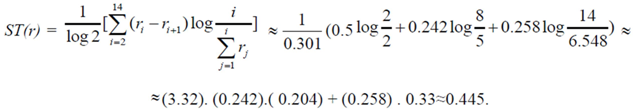

 ≈ 2.208. Therefore we finally have that T(r) ≈ 2,653
4. Students’ Individual Assessment
 and xc 21 =
  .
.- D1 = {(S1, 0.75), (S2, 0.75), (S3, 1)} (this type of deviation was related with 2 students)
- D2 = {(S1, 0.5), (S2, 1), (S3, 1)} (related with 7 students)
- D3 = {(S1, 0.5), (S2, 0.75), (S3, 1)} (related with 5 students)
- D4 = {(S1, 0.5), (S2, 0.75), (S3, 0.75)} (related with 4 students)
- D5 = {(S1, 0.25), (S2, 0.5), (S3, 0.75)} (related with 3 students)
- D6 = {(S1, 0.25), (S2, 0.25), (S3, 0.5)} (related with 6 students)
- D7 = {(S1, 0), (S2, 0.5), (S3, 0.75)} (related with 1 student)
- D8 = {(S1, 0), (S2, 0.5), (S3, 0.5)} (related with 2 students)
- D9 = {(S1, 0), (S2, 0.25), (S3, 0.5)} (related with 1 student)
- D10 = {(S1, 0), (S2, 0.25), (S3, 025)} (related with 3 students)
- D11 = {(S1, 0), (S2, 0), (S3, 0.25)} (related with 1 student)
 , for all students and all characteristics. The above fuzzy framework could help him/her to determine the divergences with respect to this target and hence readapt his/her didactic plans in order to diminish them.
 5. Conclusions and Discussion
- Fuzzy logic, due to its nature of including multiple values, offers a wider and richer field of resources for assessing the students’ performance than the classical crisp characterization does by assigning a mark to each student, expressed either with a numerical value within a given scale or with a letter corresponding to the percentage of the student’s success.
- In this article we developed a fuzzy model for assessing student groups’ knowledge and skills, in which the students’ characteristics under assessment are represented as fuzzy subsets of a set of linguistic labels characterizing their performance.
- The group’s total possibilistic uncertainty and the coordinates of the center of gravity of the graph of the membership function involved were used as defuzzification methods in converting our fuzzy outputs to a crisp number.
- Techniques of assessing the students’ performance individually were also discussed and examples were presented illustrating the use of our results in practice.
Conflicts of Interest
References
- Zadeh, L.A. Fuzzy sets. Inf. Control 1965, 8, 338–353. [Google Scholar] [CrossRef]
- Zadeh, L.A. Fuzzy algorithms. Inf. Control 1968, 12, 94–102. [Google Scholar] [CrossRef]
- Voskoglou, M.G. Stochastic and Fuzzy Models in Mathematics Education, Artificial Intelligence and Management; Lambert Academic Publishing: Saarbrucken, Germany, 2011. [Google Scholar]
- Voskoglou, M.G. A study on fuzzy systems. Am. J. Comput. Appl. Math. 2012, 2, 232–240. [Google Scholar] [CrossRef]
- Voskoglou, M.G. Fuzzy logic and uncertainty in mathematics education. Int. J. Appl. Fuzzy Sets Artif. Intell. 2011, 1, 45–64. [Google Scholar]
- Voskoglou, M.G. A fuzzy model for human reasoning. Int. J. Math. Eng. Comput. 2012, 3, 61–71. [Google Scholar]
- Klir, G.J.; Folger, T.A. Fuzzy Sets, Uncertainty and Information; Prentice-Hall: London, UK, 1988. [Google Scholar]
- Van Broekhoven, E.; de Baets, B. Fast and accurate centre of gravity defuzzification of fuzzy system outputs defined on trapezoidal fuzzy partitions. Fuzzy Sets Syst. 2006, 157, 904–918. [Google Scholar] [CrossRef]
- Voskoglou, M.G. The process of learning mathematics: A fuzzy set approach. Heuristics Didact. Exact Sci. 1999, 10, 9–13. [Google Scholar]
- Subbotin, I.; Badkoobehi, H.; Bilotskii, N. Application of fuzzy logic to learning assessment. Didact. Math. Probl. Investig. 2004, 22, 38–41. [Google Scholar]
- Subbotin, I.; Mossovar-Rahmani, F.; Bilotskii, N. Fuzzy logic and the concept of the Zone of Proximate Development. Didact. Math. Probl. Investig. 2011, 36, 101–108. [Google Scholar]
- Subbotin, I.; Voskoglou, M.G. Applications of fuzzy logic to case-based reasoning. Int. J. Appl. Fuzzy Sets Artif. Intell. 2011, 1, 7–18. [Google Scholar]
- Voskoglou, M.G.; Subbotin, I. Fuzzy models for analogical reasoning. Int. J. Appl. Fuzzy Sets Artif. Intell. 2012, 2, 19–38. [Google Scholar]
- Klir, G.J. Principles of Uncertainty: What are they? Why do we mean them? Fuzzy Sets Syst. 1995, 74, 15–31. [Google Scholar] [CrossRef]
- Perdikaris, S. Using probabilities to compare the intelligence of student groups the van Hiele level theory. J. Math. Sci. Math. Educ. 2012, 7, 27–36. [Google Scholar]
- Shackle, G.L.; Decision, S. Order and Time in Human Affairs; Cambridge University Press: Cambridge, United Kingdom, 1961. [Google Scholar]
- Jones, A.; Kaufmman, A.; Zimmerman, H.J. Fuzzy Sets. Theory and Applications; NATO ASI Series, Series C: Mathematical and Physical Sciences; Reidel Publishing Company: Dordrecht, Holland, 1986; Volume 177. [Google Scholar]
- Espin, E.A.; Oliveras, C.M.L. Introduction to the use of fuzzy logic in the assessment of mathematics teachers’ professional knowledge. Proc. First Mediterr. Conf. Math. 1997, 107–113. [Google Scholar]
© 2013 by the authors; licensee MDPI, Basel, Switzerland. This article is an open access article distributed under the terms and conditions of the Creative Commons Attribution license (http://creativecommons.org/licenses/by/3.0/).
Share and Cite
Voskoglou, M.G. Fuzzy Logic as a Tool for Assessing Students’ Knowledge and Skills. Educ. Sci. 2013, 3, 208-221. https://doi.org/10.3390/educsci3020208
Voskoglou MG. Fuzzy Logic as a Tool for Assessing Students’ Knowledge and Skills. Education Sciences. 2013; 3(2):208-221. https://doi.org/10.3390/educsci3020208
Chicago/Turabian StyleVoskoglou, Michael Gr. 2013. "Fuzzy Logic as a Tool for Assessing Students’ Knowledge and Skills" Education Sciences 3, no. 2: 208-221. https://doi.org/10.3390/educsci3020208
APA StyleVoskoglou, M. G. (2013). Fuzzy Logic as a Tool for Assessing Students’ Knowledge and Skills. Education Sciences, 3(2), 208-221. https://doi.org/10.3390/educsci3020208