Abstract
Many countries use national-level surveys to capture student opinions about their university experiences. It is necessary to interpret survey results in an appropriate context to inform decision-making at many levels. To provide context to national survey outcomes, we describe patterns in the ratings of science and engineering subjects from the UK’s National Student Survey (NSS). New, robust statistical models describe relationships between the Overall Satisfaction’ rating and the preceding 21 core survey questions. Subjects exhibited consistent differences and ratings of “Teaching”, “Organisation” and “Support” were thematic predictors of “Overall Satisfaction” and the best single predictor was “The course was well designed and running smoothly”. General levels of satisfaction with feedback were low, but questions about feedback were ultimately the weakest predictors of “Overall Satisfaction”. The UK’s universities affiliated groupings revealed that more traditional “1994” and “Russell” groups over-performed in a model using the core 21 survey questions to predict “Overall Satisfaction”, in contrast to the under-performing newer universities in the Million+ and Alliance groups. Findings contribute to the debate about “level playing fields” for the interpretation of survey outcomes worldwide in terms of differences between subjects, institutional types and the questionnaire items.
1. Introduction
National-scale questionnaires are used in many countries to capture information about student experiences of tertiary education and inform potential future stakeholders [1]. These include the “student satisfaction” approach of the UK’s National Student Survey (NSS). As an alternative, there are student “engagement” questionnaires, such as the National Survey of Student Engagement (NSSE; Indiana University, Indiana, USA). The NSS provides an end-user view of their undergraduate experiences in terms of agreement with positive statements about the student experience. Around 60 percent of predominantly final year undergraduates return the survey. The survey excludes already students that have left the course before their third undergraduate year and there are potential biases in the survey participants, for example females are more likely to respond [2]. Student surveys have been criticised as being tools with insufficient practical value [3] and there remains a need for greater context of the results to draw value from the results [4]. Previous analyses have highlighted subject differences, in particular how different types of feedback were valued differently by students in different subject disciplines. This work pointed to a need for greater depth of analysis, with more robust techniques to explore what best predicts overall satisfaction of respondents [4].
Attempts to decipher the essence of the notion of “satisfaction” [5] reveal general agreement that the concept is complex and multidimensional with no entirely accepted general measurement scale for Higher Education [6]. There has been suggestion that student satisfaction measures relate well to the quality of the learning experiences [7,8], but more recent evidence suggests that engagement measures are much better surrogate measures for “quality” of education and that satisfaction metrics are largely unrelated to educational quality/gains [9]. It is noteworthy that there is ongoing debate around the term “satisfaction” in the context of students’ ratings of their perceptions of teaching quality (and other elements of their tertiary level educational experiences). For a useful insight into this discussion, refer to Richardson’s 2005 review [8]. The term “satisfaction” will be used in the current article to discriminate the NSS approach from “engagement” surveys such as the NSSE used by US institutions (www.nsse.iub.ed).
With the use of UK’s NSS scores in calculating “Good University” metrics and in the new “Key Information Sets” (or “KIS” data; http://unistats.direct.gov.uk/) provided for to guide course selections of those interested in studying in higher education, there seems to be greater value than ever placed on student ratings of educational experiences. The value of nationally based satisfaction surveys remains in dispute [9,10] and there continues to be debate about the best ways to respond to national-level student evaluations [11]. Therefore, it is timely to use more sophisticated approaches to data analysis and bespoke knowledge of differences in subjects and institutions to contextualise NSS outcomes.
It is well established that a variety of approaches can be used to interpret national datasets [12,13,14]. Thomas and Galambos [15] applied data mining approaches to identify patterns in the data sets. The CHAID (chi squared automatic interaction detector) algorithm used showed the strengths of this type of analytical approach and identified key factors associated with US students’ satisfaction ratings. For example, intellectual stimulation was perceived as very important to students who recorded high intellectual growth, but this was not true of other subgroups. Thus, as a consequence of not being a significant factor in the overall regression model, it would normally be interpreted as unimportant when using more “traditional” statistical approaches. Other significant factors unearthed by this approach included “academic experiences” which differentiated between more and less satisfied students and also “non-academic” aspects of their experiences were most important to “less academically engaged” students (for definitions see [15]).
The current study uses robust, readily available modeling techniques to contextualise the quantitative outcomes of the NSS ratings for science and engineering subjects and begins to explore what a “level playing field” means in terms of satisfaction metrics. The study will highlight differences between subjects and institutional types as a starting point to explore comparability of NSS ratings. It will also determine differences in how the individual survey questions predict overall ratings of satisfaction to highlight the most influential of the survey items in terms of overall satisfaction of the respondents. The modeling technique used is robust, has yet to be used to explore mass educational datasets and accounts for variability between the factors that affect the “playing field” of NSS metrics. A short introduction to the statistical technique is provided, which is derived from licence-free software.
2. Experimental Section
2.1. Brief Background to “RandomForests” Analysis
In order to determine the best predictors of “Overall Satisfaction” (or Q22) the modeling software “RandomForests” analysis (“RFA”) was used and background of this approach is available [16,17]. It is considered more robust than classical regression methods [14] and more robust with data distributions that do not conform to normality or are not associated with each other in a linear fashion. It has superseded older, more basic regression trees which were considered “unstable” [18] in the sense that if a small amount of data changed, there was an over-proportional change to the outcome [19], which can lead to interpretations being “built on shifting sands”. [16,17] developed “RandomForests” Analysis (RFA; a trademark of Salford Systems) algorithm to overcome many of these shortcomings.
2.2. Data Extraction and Analysis
Nationally available data of individual responses to the NSS were extracted from the 2007, 2008 and 2009 NSS datasets. All analyses used percentage satisfaction scores returned (i.e., percentage of students answering 4 or 5 on the 5 point Likert scale, often referred to as the “percentage agree”; see [4]) and each used responses for the core survey questions (Q1 to Q21 are ratings of the learner’s experience; with all years and all subjects included) to hierarchically predict “Overall Satisfaction” (the explicit measure of satisfaction; Q22). Three RFA models’ outcomes were calculated using data that combined all three annual surveys, subjects and university grouping. The rationale behind the three models relates to the inconsistent subject composition across institutions. The one common factor is that all subjects/institution types have values for the 22 questions. In this first model the effects of subjects and institution type are lost (because only the 22 answers are used) and this could result in artefacts resulting from the different subject mixes in different institutions. We investigated if this was true by including subject, and then institution type, as a predictors.
Model 1 used all years and all subjects. The importance of the “subject” itself was then included in the model (Model 2) and then “institutional type” was added in Model 3 to include university grouping as a predictor. Overall fit of the models was assessed by the explained percentage of variance in Overall Satisfaction’ (Q22) for each of the survey questions (Q1-21). The relative importance of predictors in the models are shown as a percentage increase in MSE (Mean Squared Error; larger values indicating more influence on Q22) for each predictor. Simple residuals were calculated to show how the ratings of Q22 differed from those predicted using the first 21 questions in the survey. Random Forest analyses were calculated using “R” (for a general overview of “R” [20]). All other analyses were carried out using SPSS v16.0 (SPSS Inc, Chicago, Illinois, USA).
3. Results
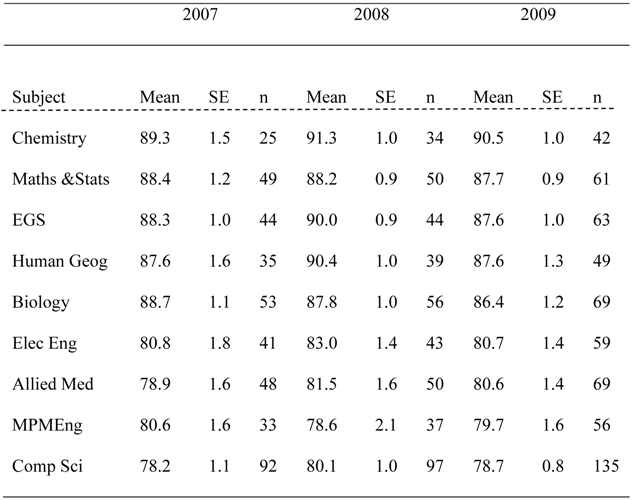
In general terms, levels of overall satisfaction within subject areas were relatively constant across the surveys (Table 1), with a trend of increasing numbers of returns from Higher Education Institutions (HEIs) over time.

Table 1.
Mean percentages of overall satisfaction scores and number of HEIs returned for each subject grouping for surveys scored as 4 or 5 (indicating satisfaction).
 |
Scatterplots revealed clear, consistent differences between subject groupings, with a cluster of subjects (Figure 1) that received 5–10% higher overall satisfaction scores. These were Chemistry, Mathematics and Statistics, Physical Geography and Environmental Science, Human Geography and Biology. The lower scoring group comprised Electronic and Electrical Engineering, Others in Subjects allied to Medicine, Mechanical, Production and Manufacturing Engineering and Computer Science.
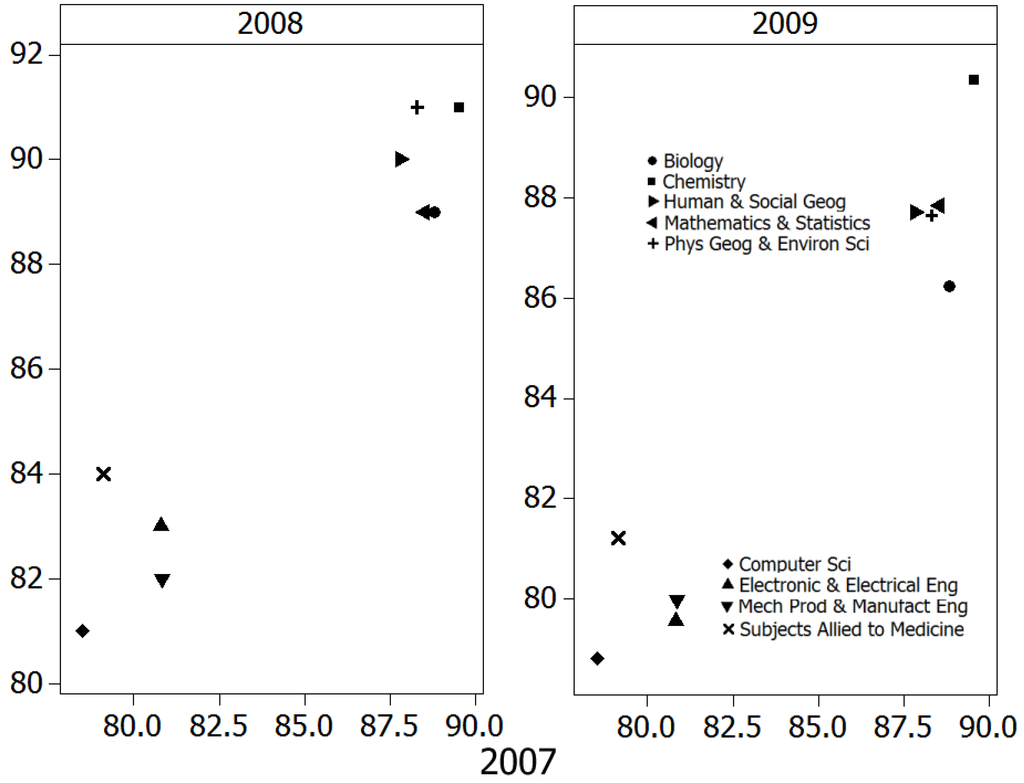
Figure 1.
Satisfaction scores from 2007 (Q22) plotted against the satisfaction scores for 2008 and 2009 to highlight consistency of patterns through the clusters of subjects that have lower (four subject groupings) or higher (five subject groupings) levels of satisfaction.
Figure 1.
Satisfaction scores from 2007 (Q22) plotted against the satisfaction scores for 2008 and 2009 to highlight consistency of patterns through the clusters of subjects that have lower (four subject groupings) or higher (five subject groupings) levels of satisfaction.

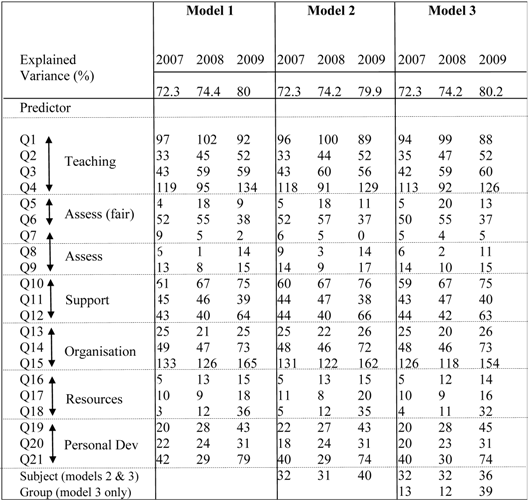
The percentage of explained variance was consistently large (when considered in light of the many subjects included in this analysis) and also very similar for all models/years (for 2007, Model 1–72.3%, Model 2–72.2%; for 2008, Model 1–74.3%, Model 2–74.2%; for 2009, Model 1–79.9%, Model 2–79.9%; note that Model 3 exploring university groupings will be explored further in the next section. The inclusion of subject as predictor (Model 2) did not result in larger values for the explained variance and it was never an important predictor. The similarities between these models suggest that robust conclusions can be drawn from the pattern of importance statistics. The model structure was very similar between all six models (Table 2) with Q15 being clearly the most important predictor. It is noteworthy that Q15 asks students if their course is “well organised and running smoothly” and, therefore, is double-barreled and covers many potential issues and problems.
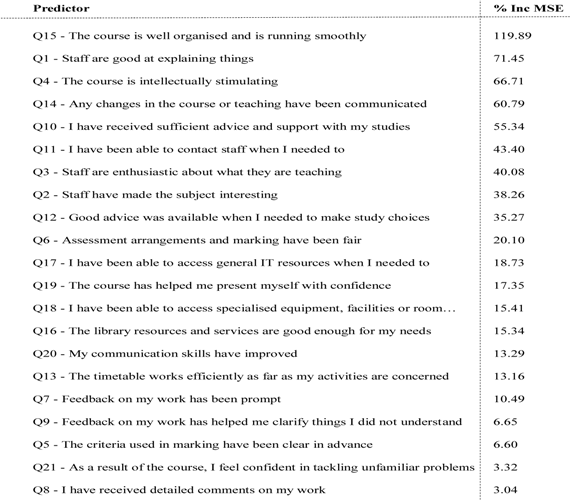
Often questions are combined into their “dimensions” for a more general insight into the survey’s outcomes, see [14,21]. From Table 3 it is clear that the “Teaching” dimension (Q1–Q4 considered together) is the most important predictive dimension of Q22 for the science subjects investigated, followed by questions about “Organisation” (not surprising due to the prominence of Q15) and also “Support”. Scores associated with feedback issues were the lowest and thus the poorest predictors of student’s overall satisfaction (but note the differences between subjects in [4]), as with many of the other questionnaire items associated with assessment. Although their importance is still quite low there is evidence that the “Resources” questions are increasing in prominence and also note the differences in the two areas of assessment that are often considered separately [21].
Table 2.
Strength of National Student Survey (NSS) questions predictions of overall satisfaction (2007–2009) for the three models (1, 2 and 3). Higher numbers (of percentage increase in mean square error) indicative greater influence of the first 21 questionnaire items on Q22. “Subject” and “Group” are included but these factors were not as influential as the most prominent questions (e.g., Q15, Q4 and Q1).
 |
All predicted satisfaction values were highly correlated with the actual value (r > 0.85 in all cases) and residual means were always close to 0 indicating no systematic under- or over-prediction of satisfaction scores and large correlation coefficients confirmed that actual and predicted satisfaction scores remained in approximately the same rank order. Given the similarities in the models it is unsurprising that between-year predictions were good, with correlations between actual and predicted values of 0.86 or more. The between-year residuals had slightly larger means and were always negative, i.e., the models tended to over-predict overall satisfaction by only 1–2%. Looking at all three models, over three years there was a striking similarity between years/models (see Table 2), and a model that combines all years and excluded subject/group is shown in Table 4.
Table 3.
How well NSS question thematic areas predict overall satisfaction. The higher values indicate greater importance in predicting Q22 and “Teaching” and “Organisation” were the best predictors of overall satisfaction over all the surveys. “Assessment” is shown both as an overall measure and also separately as the commonly deciphered sub-themes of “Fairness” and “Feedback”.
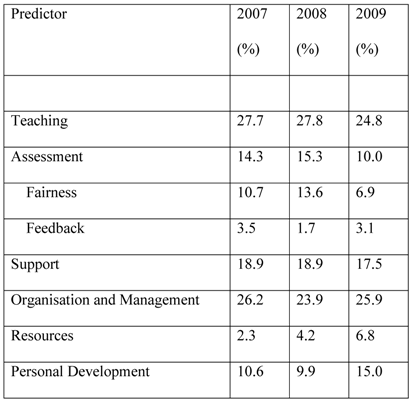 |
Table 4.
Overall effectiveness of NSS questionnaire items (Q1–Q21) as predictors of Overall Satisfaction for all years combined. Predictors are presented hierarchically with best predictors at the top, relating to those with the highest % Mean Squared Error(MSE) (which may be greater than 100%).
 |
University groupings in Table 5 show mean satisfaction score across all subjects and groups over the three years explored (Table 5a–c). Subjects are ordered from left (lowest scores) to right (highest scores) after accounting for all university groups. Accounting for subjects, the University groupings are shown in ascending order of responses, with the “1994 group” attaining the highest overall satisfaction, followed by the Russell Group. The Million+ and Alliance had the lowest satisfaction responses. In terms of subjects, Computer Science, Engineering subjects and Subjects Allied to Medicine were consistently the least satisfied while Chemistry, Mathematics and Statistics plus the Geographical subjects were consistently the most satisfied.
Table 5.
Mean overall satisfaction scores for data presented as percentage responses of overall satisfaction for subject and university groupings. The table is ordered by row (lowest scores at the top) and column (lowest scores to the right) means for three years data (a–c).
| 2007 data | |||||||||||
| Group | n | Comp Sci | Allied Med | MPM Eng | Elec Eng | Hum Geog | EGS | Maths | Biol | Chem | All |
| Million+ | 46 | 72.2 | 77.6 | 80.5 | 66.2 | N/A | 86.3 | 71.0 | 86.4 | N/A | 75.6 |
| Alliance | 75 | 72.8 | 79.7 | 77.7 | 79.5 | 89.4 | 88.5 | 92.3 | 87.0 | 74.0 | 80.7 |
| None | 117 | 80.6 | 75.7 | 76.3 | 85.3 | 91.1 | 87.7 | 86.9 | 84.6 | 89.0 | 83.0 |
| Russell | 117 | 87.3 | 83.1 | 86.0 | 85.2 | 85.2 | 87.6 | 86.8 | 90.7 | 91.2 | 87.2 |
| 1994 | 64 | 81.5 | 80.0 | 85.5 | 86.2 | 86.7 | 91.1 | 93.3 | 93.1 | 91.2 | 88.9 |
| All | 405 | 78.2 | 78.9 | 80.6 | 80.8 | 87.6 | 88.3 | 88.4 | 88.7 | 89.3 | 84.0 |
| n | 92 | 48 | 33 | 41 | 35 | 44 | 49 | 53 | 25 | ||
| 2008 data | |||||||||||
| Group | n | Mech Eng | Comp Sci | Allied Med | Elec Eng | Biol | Maths | EGS | Hum Geog | Chem | All |
| Million+ | 46 | 57.0 | 76.1 | 75.2 | 77.3 | 79.0 | 95.0 | 85.0 | N/A | N/A | 76.6 |
| Alliance | 89 | 81.6 | 75.4 | 83.0 | 78.7 | 87.3 | 89.3 | 90.8 | 91.5 | 93.0 | 83.2 |
| None | 108 | 77.8 | 82.5 | 80.7 | 81.4 | 85.3 | 88.3 | 91.0 | 91.9 | 91.5 | 84.9 |
| Russell | 129 | 81.1 | 85.1 | 89.3 | 86.4 | 90.9 | 87.0 | 89.6 | 87.8 | 90.4 | 87.4 |
| 1994 | 71 | 84.0 | 83.2 | 89.3 | 89.4 | 90.0 | 88.5 | 91.6 | 91.9 | 92.0 | 88.8 |
| All | 443 | 78.6 | 80.1 | 81.5 | 83.0 | 87.8 | 88.2 | 90.0 | 90.4 | 91.3 | 85.4 |
| n | 48 | 93 | 37 | 42 | 44 | 39 | 56 | 50 | 34 | ||
| 2009 data | |||||||||||
| Group | n | Mech Eng | Comp Sci | Allied Med | Elec Eng | Biol | Maths | EGS | Hum Geog | Chem | All |
| Million+ | 85 | 72.6 | 71.2 | 74.2 | 71.9 | 75.9 | 92.0 | 84.3 | 91.1 | N/A | 75.7 |
| Alliance | 117 | 75.9 | 71.3 | 79.8 | 74.3 | 84.1 | 85.8 | 84.8 | 87.9 | 89.1 | 80.0 |
| None | 151 | 79.0 | 82.2 | 81.7 | 80.7 | 87.1 | 90.4 | 89.6 | 86.3 | 89.3 | 84.2 |
| Russell | 139 | 86.8 | 85.7 | 83.7 | 86.1 | 91.3 | 85.6 | 88.7 | 84.7 | 90.7 | 87.3 |
| 1994 | 84 | 83.4 | 88.0 | 89.8 | 90.0 | 89.7 | 90.3 | 88.6 | 91.5 | 92.7 | 88.9 |
| All | 576 | 78.7 | 79.7 | 80.6 | 80.7 | 86.4 | 87.6 | 87.6 | 87.7 | 90.5 | 84.5 |
| n | 65 | 115 | 56 | 57 | 63 | 48 | 69 | 61 | 42 | ||
Inclusion of an overall satisfaction measure provides an opportunity to explore how this holistic assessment can be predicted by the elemental parts surveyed (Q1-21). It was anticipated that at least some universities/subjects would over (or under-) perform in such models due to the large number of institutions in the analysis. Since differences in the subject composition used for each of the institutions in the analysis will contribute to the model’s outcome, the findings are summarised together with subject groupings in Table 6.
Table 6.
Prediction of Q22 (Overall Satisfaction) by the surveys main questions (Q1-Q21) for; (a) university groupings; and (b) subject groupings. Shaded numbers indicate groupings/subjects that perform better than the model predicts. Higher numbers (positive or negative) indicates greater deviation from model prediction.
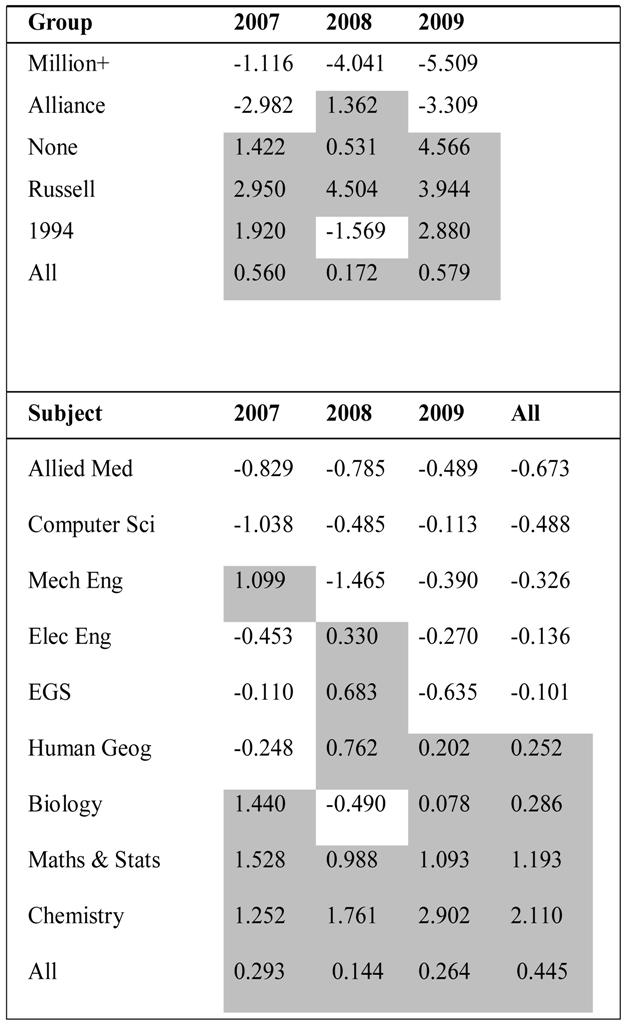 |
In general, Russell Group institutions perform 3–4% better than the model predicts, whereas, the Million+ group do 1–5% worse. In terms of the subjects, Computer Sciences and Allied to Medicine perform slightly worse than predicted (but generally by <1%) whereby Maths & Stats and Chemistry always do better than predicted (1–3% better).
4. Discussion
4.1. Subject- and Course-Level Variation
The current study describes techniques to model and interpret a national survey in order to provide greater context to the output metrics. The context generated by deeper exploration of survey datasets provides a starting point to compare NSS metrics at several levels (e.g., faculty, institutional, institutional groupings). The current study provides context in several ways: firstly by acknowledging the consistent differences in ratings between subjects secondly by exploring how UK institutional types perform in the survey to identify wider patterns in the metrics in terms of institutional performances; and finally by clarifying which questions best predict “Overall Satisfaction”. The latter may be most pertinent to learning designers and managers, to gain insights into the perceptions of what factors most influence overall satisfaction with their courses. Survey question areas are not all perceived as equally important by respondents and it is hoped these approaches can be developed at local levels, nationally and internationally (with different survey types) to provide context to interpretations.
Our outcomes support the claim (for science subjects) that the NSS has good internal consistency and is known to be robust [8,21] with patterns in ratings remaining remarkably constant between the years. Subject differences are apparent, consistent and likely reflect the culture of courses and their learners [4]. Clearly, any interpretations of national level outcomes should be “subject-aware” and there is a need to build subject-differences into institutional/faculty responses to the survey ratings. This study led to local acceptance of lower average ratings for engineering, computing science and allied to medicine subjects when compared to those subject areas nationally, and management of actions from the survey results included cross-referencing to national subject means. Even with such subject-awareness, the “playing field” is of course not entirely level and many other factors have effects on satisfaction ratings, such as the composition/demographics of student cohorts (e.g., ethnicity and modes of learning [22]). For example, if institutions/courses contain different learner compositions (in terms of their ethnicities, sexes, ages, socio-economic backgrounds, etc.), then differences in satisfaction would be expected, making comparisons between subjects (e.g., in KIS data) difficult to interpret. Benchmarks have recently been provided in response to variability in NSS respondent demographics (see http://www.heacademy.ac.uk/assets/EvidenceNet/Benchmarking_and_the_NSS.pdf). This goes some way to to compensate for such effects, but the approach is in its infancy and has yet to be used widely as far as the authors are aware. In practical terms, institutional outcomes should not be built into league tables of NSS outcomes, or other metrics/indices such as those used in “Good University Guides” without much greater context about subject and learner compositions.
4.2. Key Determinants of Satisfaction Ratings
It is worth noting that the most parsimonious final model (Table 4) was produced to exclude subject and institution, and pooled data across the three surveysand it is not surprising that there were minor changes to the model structures (e.g., when comparing Table 2, Table 4). The final model (Table 4) should be focussed on and Table 2 viewed asdevelopmental (in orderto justify the pooling of data across years and the exclusion of subject and group in the final model). In this final model it was clear that questions pertaining to perceptions of the quality of teaching and or organisation and management of courses were most influential. The dimension “Support” is more strongly associated with these particular survey dimensions [4] and it is unsurprising it is the most prominent of the rest of the questionnaire dimensions.
One of the most public reactions to the NSS outcomes has focused on the lower scores for “satisfaction with feedback” [23]. The current study shows that feedback does not predict overall ratings of satisfaction with the university experience in the subjects investigated. Indeed, feedback questions were amongst the poorest predictors, agreeing with research into other subject areas [22] and their importance varies between subjects [4]. It is noteworthy that these findings do not suggest ignoring issues of feedback in the design of assessment systems; this process is an intrinsically important component of learning (for example see http://www.heacademy.ac.uk/assessment). There is also an issue of “what learners want” and “what learners need” which is encapsulated in a small study that described how medical students, in a randomised trial, rated higher levels of satisfaction with feedback that was complimentary, rather than constructive feedback that led to greater educational gains [24]. Awareness of the “needs and wants” of any particular learning group is an important element of curriculum design and a good example of where survey interpretation needs to be bespoke.
Ratings of satisfaction with teaching quality, organisation of the course and support for the learner that are consistently of high importance in overall satisfaction metrics in science and engineering subjects, but the detail of predictors of overall satisfaction varies subtly between subjects. For example, business students have been found to weight questions about support more heavily than those targeting course organisation, but teaching questions were again the primary driver; (2010 national NSS data; [22]). In addition, Q19 that refers to building confidence was identified as of much greater important for business students than those we found and the current authors are seeing this particular item rise in its importance as a satisfaction predictor using the instituion’s internal survey. Clearly, educators need to be insightful about evaluating educational needs when responding to survey outcomes and should account for subject cultures through knowledge of their cohorts/discipline and other information about the student experience. It is worth noting that Q22 was included in the NSS to provide an additional check on the validity of the survey instrument [25]. This metric has become ubiquitous in the reporting of the survey outcomes, and this study contributes to understanding the complexity of the global statement. It is accepted that individuals may interpret the survey questions differently and there are useful longitudinal studies into how people engage with surveys [3].
4.3. Overall Satisfaction may be Higher than Predicted by the Other Survey Items
Exploration of science subjects in university groupings (here generalising across institutions to dilute influences of subject composition), the Million+ and Alliance are scored lower in the Overall Satisfaction question by than would be predicated from the first 21 questionnaire items. Russell and 1994 Group universities outperform the model as a general rule and thusit appears that a complex psychology underpins perceptions of Overall Satisfaction. Over-performing universities may have different infrastructures (e.g., greater spend per student; lower staff student ratios) and qualities that are undetected by the survey instrument (i.e., the first 21 questionnaire items may be missing important elements of the overall experience). Thus, despite statistical robustness and reliability, its validity may be compromised if all the elements required to measure learner satisfaction are not captured (for debate about the instruments validity see [8]). Incorporation of other non-NSS information in future analyses would permit a greater diversity of factors associated with institutions to be used to characterise them (e.g., campus base, demographics, size, detail about entry qualifications etc.) and explore their relative importance to NSS outcomes. There is already evidence of differences between ethnic groups taking the survey, for example with strikingly different scores from Indian, black and mixed race students on business courses [22].
4.4. Using the Survey in Context to Catalyse Change
The value of the NSS is in the interpretation and how it is used catalyse further dialogue staff/students associated with the experience. NSS metrics are available in many media, including the “KIS” documentation to inform for those applying to courses in the UK (http://www.hefce.ac.uk/whatwedo/lt/publicinfo/kis/). When NSS outcomes are used in action planning at any level, there should be reference to the literature combined with local evidence [11]. Note that it is implicit in this study that the text comments generated by the survey are crucial to interpretation. The statistical techniques presented here, together with [4] provide a framework to evaluate patterns for subject groupings with greater context for decision-making. Emery et al. [26] presented a strong case for surveys that measure student capabilities rather than their satisfaction, so that drivers to enhance the learning experience are focused on sound pedagogy (to “produce knowledgeable effective students’) rather than being held accountable to customers and responding to please, rather than educate. National level surveys like this, used in the correct context with supporting evidence, can generate beneficial actions and many good examples are available as the survey catalysing positive change in UK HEIs [27]. It is not a “level playing field” due to consistent subject differences and potentially many other institutional differences and factors not captured by the survey. Institutions should resist knee-jerk responses to league tables and indices that incorporates satisfaction ratings in their calculation and acknowledge evidence that satisfaction is not necessarily related to the quality of educational provision.
5. Conclusions
Subjects were highly consistent year on year in terms of their relative performance in the satisfaction survey. This has implications for institutional decision-making particularly if subjects are wrongly compared against institutional averages, when comparisons should be made within subject areas (e.g., comparing with national subject averages, although this may be subject to error if courses contain different compositions of learners, for example in terms of ethnicity). The best predictor of student satisfaction nationally for the three years analysed was “The course was well designed and running smoothly” followed by ratings of “Teaching”, “Organisation” and “Support”. This may vary slightly between subjects/institutions, so it is proposed that this type of quantitative approach to contextualising survey metrics can be used to guide institutions in resource allocation to tackle student experience challenges. This does not preclude good teaching practices, such as responding to comments about improving feedback, which may increase learning gains. However, the value of feedback may not be appreciated as much as other aspects of the learning experience [24]. This is embodied by low levels of satisfaction with feedback, but questions about feedback were the weakest predictors of “Overall Satisfaction”. The UK’s universities affiliated groupings revealed that more traditional “1994” and “Russell” groups over-performed in a model using the core 21 survey questions to predict “Overall Satisfaction”, in contrast to the under-performing newer universities in the Million+ and Alliance groups. This is intended to initiate debate about the aspects of the student experience that are not captured by the survey instrument. Future work should account for the demographics of the respondents and also more elusive information about factors that could include measures of how learner’s expectations are met, their sense of belonging to courses/instituions and the role of institutional reputation. Ultimately, those involved in the design of courses need information that relates more closely to educational gains, such as measures of engagement and to understand the alignment of metrics with the valuable text comments that the NSS also harvests.
Acknowledgements
We thank anonymous referees for their constructive comments on this work.
Conflict of Interest
The authors declare no conflict of interest.
References
- Chalmers, D.; Lee, K.; Walker, B. International and National Quality Teaching and Learning Performance Models Currently in Use, 2008. Available online: http://www.catl.uwa.edu.au/projects/tqi (accessed on 23 February 2013).
- Hewson, P. Preliminary Analysis of the National Student Survey. MSOR Connections Vol 11, No 1 Spring Term 2011. Available online: http://www-new1.heacademy.ac.uk/assets/documents/subjects/msor/Hewson.pdf (accessed on 23 February 2013).
- O’Neill, M.; Palmer, A. Cognitive dissonance and the stability of service quality perceptions. J. Serv. Market. 2004, 18, 433–449. [Google Scholar] [CrossRef]
- Fielding, A.H.; Dunleavy, P.J.; Langan, A.M. Effective use of the UK’s National Student (Satisfaction) Survey (NSS) data in science and engineering subjects. J. Furth. High. Educ. 2010, 33, 347–368. [Google Scholar] [CrossRef]
- Giese, J.L.; Cote, J.A. Defining customer satisfaction. Acad. Market. Sci. Rev. 2000, 1, 1–34. [Google Scholar] [CrossRef]
- Garcia-Aracil, A. European graduates’ level of satisfaction with higher education. High. Educ. 2009, 57, 1–21. [Google Scholar] [CrossRef]
- Ramsden, P. A performance indicator of teaching quality in higher education: The course experience questionnaire. Stud. High. Educ. 1991, 16, 129–150. [Google Scholar] [CrossRef]
- Richardson, J.T.E. Instruments for obtaining student feedback: A review of the literature. Assess. Eval. High. Educ. 2005, 30, 387–415. [Google Scholar] [CrossRef]
- Gibbs, G. Dimensions of Quality; Higher Education Academy: York, UK, 2010. [Google Scholar]
- Curtis, P. Student survey is bland and worthless, claims academic. Educ. Guard. 2008. Available online: http://www.guardian.co.uk/education/2008/jun/12/highereducation.uk2 (accessed on 23 February 2013).
- Brown, S. Bringing about positive change in the higher education student experience: A case study. Qual. Assur. Educ. 2011, 19, 195–207. [Google Scholar] [CrossRef]
- Ainley, J.; Long, M. The Course Experience Survey 1992 Graduates; Australian Government Publishing Service: Canberra, Australia, 1994. [Google Scholar]
- Brennan, J.; Williams, R.; Brighton, R.; Moon, N.; Richardson, J.; Rindl, J. Collecting and Using Student Feedback on Quality and Standards of Learning and Teaching in Higher Education; Higher Education Funding Council for England: London, UK, 2003. Available online: www.hefce.ac.uk/Pubs/rdreports/2003/rd08_03/rd08_03.pdf (accessed on 23 February 2013).
- Surridge, P. Interpreting the National Student Survey Data Using Multi-Level Modelling. A Non-Technical Guide; The Higher Education Academy: York, UK, 2008. Available online: http://www.heacademy.ac.uk/assets/York/documents/ourwork/research/NSS_interpreting_data_nontechnical_guide.pdf (accessed on 23 February 2013).
- Thomas, E.H.; Galambos, N. What satisfies students? Mining student-opinion data with regression and decision tree analysis. Res. High. Educ. 2004, 45, 251–269. [Google Scholar] [CrossRef]
- Breiman, L. Random forests. Mach. Learn. 2001, 45, 5–32. [Google Scholar] [CrossRef]
- Breiman, L. Statistical modelling: The two cultures. Stat. Sci. 2001, 16, 199–215. [Google Scholar] [CrossRef]
- Breiman, L. Bagging predictors. Mach. Learn. 1996, 24, 123–140. [Google Scholar]
- Breiman, L.; Cutler, A. Interface Workshop–April 2004. 2004. Available online: http://stat-www.berkeley.edu/users/breiman/RandomForests/interface04.pdf (accessed on 23 February 2013).
- Crawley, M.J. The R Book; John Wiley and Sons: Chichester, UK, 2007. [Google Scholar]
- Marsh, H.W.; Cheng, J.H.S. Dimensionality, Multilevel Structure, and Differentiation at the Level of University and Discipline: Preliminary Results, 2008. Available online: http://www.heacademy.ac.uk/resources/detail/ourwork/research/NSS_herb_marsh (accessed on 23 February 2013).
- Dean, A.A. Enhancing the Learning Experience of Students in Higher Education: Key Findings from the NSS Survey (2008 to 2010) for University Business Schools in England. Report to the Higher Education Academy, Business, Accountancy and Finance Network, 2010. Available online: http://www-new1.heacademy.ac.uk/business/news/detail/2011/nss-survey-report (accessed on 23 February 2013).
- Crawford, K.; Hagyard, A.; Saunders, G. Creative Analysis of NSS Data and Collaborative Research to Inform Good Practice in Assessment Feedback. SWAP Project Output: Higher Education Academy Social Policy and Project Work, 2010. Available online: http://www.swap.ac.uk/docs/projects/nss_report.pdf (accessed on 23 February 2013).
- Boehler, M.L.; Rogers, D.A.; Schwind, C.J.; Mayforth, R.; Quin, J.; Williams, R.G.; Dunnington, G. An investigation of medical student reactions to feedback: a randomised controlled trial. Med. Educ. 2006, 40, 746–749. [Google Scholar] [CrossRef]
- Richardson, J.T.E.; Slater, J.B.; Wilson, J. The national student survey: Development, findings and implications. Stud. High. Educ. 2007, 32, 557–580. [Google Scholar] [CrossRef]
- Emery, C.; Kramer, T.; Tian, R. Customers vs. products: Adopting an effective approach to business students. Qual. Assur. Educ. 2001, 9, 110–115. [Google Scholar] [CrossRef]
- Buckley, A. Making It Count: Reflecting on the National Student Survey in the Process of Enhancement; Higher Education Academy: York, UK, 2012. [Google Scholar]
© 2013 by the authors; licensee MDPI, Basel, Switzerland. This article is an open access article distributed under the terms and conditions of the Creative Commons Attribution license (http://creativecommons.org/licenses/by/3.0/).